Abstract
In alignment with the European Union’s legislation, Greece submitted its final 10-year National Energy and Climate Plan (NECP) in December 2019, setting more ambitious energy and climate targets than those originally proposed in the draft version of the document. Apart from higher penetration of renewable energy sources (RES), the final NECP projects also zero carbon use in power generation till 2030. Although decarbonization has long been regarded beneficial for economies that base their energy production on coal, as it is the case with Greece, the macroeconomic and societal ramifications of faster transitions to carbon-free economies remain highly unexplored. Under this context, in this paper, we soft-link energy models, namely Times-Greece and Primes, with a macroeconomic model, namely Global Trade Analysis Project (GTAP), to measure the effects of the final and draft NECPs on the Greek economy and evaluate the impact of higher decarbonization speeds. We find that the faster transition scenario displays both economic and societal merits, increasing Gross Domestic Product (GDP) and household income by about 1% and 7%, respectively.
1. Introduction
The Paris Agreement has become a trademark in the fight against climate change. European Union (EU), being responsible for 10% of global greenhouse gas emissions (GHG), aspires to be at the forefront of this fight, aiming for a climate neutral economy by 2050 [1]. According to the Energy Union governance regulation [2], Member States were obliged to submit to European Commission (EC) their 10-year National Energy and Climate plan (NECP) for the 2021–2030 period by the end of 2019, specifying their energy and climate targets towards the decarbonization of their national energy systems [3].
The energy and climate targets set by the EU demonstrate that fossil fuels, which have been widely used since the industrial revolution to provide low-cost energy and stimulate economic growth [4], should be gradually replaced by more environmentally friendly technologies, such as renewable energy sources (RES). In order for the established targets to be met, various legal obstacles must be tackled [5], as well as a significant amount of investments must be channeled to European economies, the exact level of which cannot be precisely estimated [6]. Although carbon taxes [7] and access to cheaper forms of RES [8] facilitate this transition, a heated debate still exists on the “double dividend” effect of “green” policies [9,10,11,12,13], questioning their ability to produce both environmental and economic benefits. Therefore, it becomes critical for the focus of the academic community and policy makers to move from concluding whether “greener” policies are required, to identifying measures that fulfil both the economic and environmental targets set.
Given that the transition to a RES-based economy is a matter of speed and not direction, being closely related to the mix and intensity of the “green” measures employed, policy makers have to account for the possible repercussions that a rapid coal phase-out could have on the economies at large and the citizens’ welfare. In addition, policy makers must ensure that any negative consequences resulting from such measures will be fairly distributed across individuals, groups, and sectors [14,15]. These kinds of concerns are particularly relevant to countries like Greece which come from a prolonged economic crisis, initiated in 2008, with vast societal consequences.
Greece submitted its revised NECP [16], to be called final NECP, in December 2019. The document set higher penetration targets for RES when compared to its previous version, to be called draft NECP, projecting also higher energy efficiency and, most importantly, zero carbon use in power generation till 2030. Based on this, the Greek government aspires to speed up the decarbonization of its energy production, shutting down the vast majority of the coal-fired power plants operating in its regions by 2028 [17]. Specifically, from the coal types used for generating electricity, Greece uses lignite for its energy production, which is the lowest-ranked coal in terms of carbon content (65–70%), mainly due to the high availability of lignite in its territory [18,19]. Thus, the transition of its energy system accounts for the delignitization of its energy production, among others. Natural gas, which displays lower emission intensity than lignite, is planned to “bridge the gap” in the intermediate period to meet time and cost-related constraints, associated with the increase of RES generation capacity, before the country entirely transits to a carbon-neutral energy system [20].
Note that, although the final NECP sets strict targets for the future use of lignite in Greece, the gradual delignitization of the Greek energy production began in the early 2010s. Historically, Greece decided to use lignite for its electricity production after the oil crisis of the 1970s [21] due to its high availability in its regions, low cost of extraction, and stable price, becoming one of the largest EU’s lignite producers [19]. In addition, due to its scale, lignite’s production provided thousands of jobs to several rural areas of Greece, contributing significantly to the national economic development of the country. However, lignite’s share in gross final energy consumption (GFEC) decreased by 49% from 2015 to 2020, while the share of RES increased by 29% over the same period [22]. This can be ascribed on the devaluation of the Greek lignite-fired plants, the lower cost of natural gas [21], and the significant cost of GHG emissions, increasing by more than 80% over the 2017–2019 period [22]. Thus, although the long-term macroeconomic impact of decarbonization has long been regarded beneficial for countries like Greece that base their energy production on coal [23,24], examining its side-effects on societal, economic, and energy security related aspects [21,25] in detail for shorter horizons becomes critical, especially when applied rapidly.
Motivated by the above, in this paper, we investigate the economy wide implications of the decarbonization speed, considering the case of Greece. To do so, we measure the effects of the final (fast transition) and draft (mild transition) versions of the Greek NECP on the national economy in the short (five years) and medium (ten years) term. We focus on key macroeconomic parameters, such as Gross Domestic Product (GDP), wages, household demand and income, imports, exports, and inflation, and exploit our results to assess the effect of the fast transition scenario on citizens’ welfare and living standards, as measured by indicative indicators (e.g., GDP per capita, purchasing power, and cost of living). Finally, we provide insights on how the Greek economy is expected to be restructured in terms of productivity, imports dependency, and extroversion, highlighting future prospects and challenges.
We base our analysis on an integrated modeling approach that soft-links the energy models originally used for preparing the NECPs with an open-source macroeconomic model, namely Global Trade Analysis Project (GTAP), thus effectively using the output provided by the former as shocks to the latter. We tailor the macroeconomic model to the Greek economy by using the Greek Social Accounting Matrix (SAM) as input and adjusting its parameters (elasticities) appropriately. Finally, we assess the sensitivity of our results with respect to the variability of the parameters used.
The rest of the paper is organized into five sections: Section 2 presents the main methodological approaches adopted in the literature for assessing energy and climate policies, also reviewing some relevant studies to the present one. Section 3 discusses the two transition scenarios considered in this paper for evaluating the macroeconomic impact of decarbonization speed and describes the approach followed for performing the respective simulations. Section 4 presents and discusses our results, while Section 5 concludes the paper and suggests avenues for future research.
2. Literature Review
2.1. Modeling Approaches
Various modeling approaches have been proposed in the literature for analyzing the economic effects of energy and climate policies [26], each one displaying its own advantages and limitations [27]. Based on their focus, these approaches can be categorized as top-down or bottom-up, being also frequently linked with each other, to allow for more detailed and representative assessments.
Top-down approaches depict the economy as a whole on a national or regional level and assess the aggregated effects of energy and climate policies in monetary units [28]. Thus, they typically involve macroeconomic models that simulate how the economy works and allow the substitution of the different production factors after a “shock” has taken place, i.e., the value of an economic parameter has changed when compared to the business as usual (BAU) scenario, with the aim of optimizing societal welfare [29]. Top-down approaches can be implemented using a variety of models, such as input–output, computable general equilibrium (CGE), econometric, and system dynamic ones [28,29,30].
Input–output models depict the monetary flows between the different sectors of the economy considering both the intermediate and final demand. Their main drawback is that they cannot analyze prices as they consider them as exogenous parameters [29]. Thus, they are more suitable for assessing policies in the short term, capturing the current state of the economy [31]. CGE models describe the motivation and behavior of the primary agents of the economy, i.e., the producers and consumers, as well as their relationships, with consumers aiming to maximize their utility and producers their profits [32]. They resemble input–output models since they base their calculations on SAMs, being, however, capable of analyzing changes in prices and provide long-term insights [29]. CGE models usually perform agent’s optimizations in a deterministic fashion, but dynamic stochastic variants of these models can be used instead to enable random shocks and simulate business cycles and cyclical effects more realistically [33,34]. The main critique on these models is based on their complex structure and dependence on the elasticity parameters used [27,35]. Econometric models estimate the relations between the variables of interest in a statistical fashion using historical data. Although more data-driven in nature than their counterparts, they are often criticized in a sense that policy analysis should not rely solely on past data [36]. Finally, system dynamic models establish rules for explaining the behavior of the agents involved and produce their results according to these rules, also considering dynamic changes over time [37]. However, their focus is rather narrow, thus not being appropriate for answering to economy wide questions [29].
Bottom-up approaches involve detailed representations of the energy sector and the interactions taking place among its elements [28]. They entail the utilization of energy optimization models that aim to identify the most cost efficient way of delivering energy services, choosing the best set of technology alternatives [28,29,38] given a set of constraints (e.g., GHG emission limits). Although numerous alternatives exist, the energy models most frequently used belong to the Markal and Edmonds–Reilly families of models [39], with the Integrated MARKAL-EFOM2 System (TIMES; [40]), developed by the International Energy Agency (IEA), being the most popular choice [38]. Another bottom-up model that has been extensively used by EC over the last decade is the Price-Induced Market Equilibrium System (Primes), developed by the Energy-Economy Environment Modelling Laboratory at National Technical University of Athens. It is differentiated from TIMES in a manner that simulates an energy market equilibrium by estimating the prices that balance the energy demand with supply [41].
To sum up, top-down approaches simulate the economy as a whole, paying little attention to the energy sector and the underlying energy-related constraints [29], providing, however, a detailed overview of the macroeconomic and societal impact of the examined policies. In contrast, bottom-up approaches are partial equilibrium models, representing the energy sector in detail but failing to capture regional-wide or sectoral effects not directly related to the energy sector. It becomes evident that, in order for the evaluations performed to be more informative and effectively support policy makers, holistic approaches that link top-down macroeconomic models with bottom-up energy ones are required [42,43,44]. Such linkages can be applied in a variety of ways [45]. In “soft-linking,” each model is run independently, and the results of the one model act as exogenous parameters to the other. When the information is shared in one direction, i.e., the results of the first model are only used to inform the second one, we refer to “one-way” linkages, while when information exchange is performed iteratively until their outcomes agree on the same parameters under a specified error range, we refer to “two-way” linkages [46]. “Hard-linking” two models is also an option, involving their integration into a single “super” model. Finally, “hybrid-linking” suggests that the individual models will remain distinct, but may not run independently. Thus, in energy and climate policy making settings, macroeconomic models will typically inform bottom-up models about the growth of the economy and energy demand, while energy models will usually inform top-down models regarding the behavior of the energy suppliers [38].
By reviewing the advantages and limitations of the modeling approaches available in the literature [47], we find that CGE models are among the most appropriate alternatives when it comes to evaluating energy and climate policies from a macroeconomic point of view in the medium and long term, with TIMES being the most prominent choice among the energy models. Moreover, considering the merits of model linkage [47], as well as the challenges presented in integrating bottom-up with top-down approaches into a single solution (e.g., in terms of results interpretation, data compatibility, data availability, and development effort; [37,38]), we conclude that soft-linking can effectively allow information exchange in a straightforward and less resources-intensive way offering unexplored and robust insights [48]. Moreover, in view of enhancing the added value of modeling process to decision-making, a special focus should be laid on enhancing the transparency of the analysis, for example via using open source models and interpreting the results [27,49]. Thus, in Section 3, we base our modeling approach on these principles.
2.2. Relevant Work
Many modeling studies have been published with the aim of evaluating the economic and societal impact of “green” policies, as well as their feasibility, such as the transition to RES and the implementation of energy efficiency policies [50]. These studies also refer to various regional levels. For example, Calise et al. [51] assesses different energy efficiency measures from a technological and economic point of view for two cities in Italy and Egypt, Nasirov et al. [52] evaluates the macroeconomic impacts of different carbon phase-out trajectories for the Chilean economy, while Gonzalez-Salazar et al. [53] examines the feasibility and potential of different coal phase-out scenarios in Berlin.
In this respect, a considerable body of the literature concludes that sustainability policies bring about positive macroeconomic and societal impacts. For instance, Chepeliev et al. [12] evaluates the economy-wide impact of higher shares (91%) of RES in the final energy consumption of Ukraine till 2050 by soft-linking TIMES-Ukraine with a dynamic CGE model [54]. They find that the implementation of this policy could increase GDP by up to 16% when compared to the BAU scenario, with GHG emissions being decreased by 76% relative to their 2012 level. Renner et al. [55] exploits input–output models, industry surveys, and employment-factor calculations to evaluate the global effect of the policies proposed under the Paris Agreement on the renewable energy sector job market, concluding that direct and indirect job positions could increase from 10.3 millions in 2017 to 23.6 and 28.8 millions in 2030 and 2050, respectively. Ram et al. [56] assesses the impact that a climate neutral economy could have on employment rate in 2050 by utilizing an employment factor method [57]. Their results suggest an increase in global jobs related to the electricity sector from 21 million in 2015 to nearly 35 million in 2050.
On the other hand, many studies argue against the “double dividend” effect of “green” policies, resulting in negative macroeconomic repercussions. For instance, Almutairi et al. [58] evaluates the economic and societal implications of the implementation of the renewable and nuclear energy targets described in [59] for the cases of Saudi Arabia, United States of America, China, India, Europe, and the Rest of World (RoW) till 2030. To do so, they employ GTAP-E [60], an extension of the GTAP model [61] with energy specification, as described in [57]. They find negative economic implications in terms of GDP change for all the regions examined apart from India. From these, Europe and Saudi Arabia are expected to present the biggest contractions, i.e., −2.81% and −3.52%, respectively, since their economies rely heavily on oil. In addition, a reduction in commodity prices, deriving from declines in the energy prices, and a loss of 4.45 million jobs worldwide over this period are simulated. In the same direction, Grottera et al. [62] evaluates the macroeconomic impact of reducing GHG emissions of households by 26% in Brazil over the 2005–2050 period using a hybrid CGE model (IMACLIM-S; [63]). Their results suggest negative macroeconomic implications, with GDP, wages, and employment being 2.6%, 1.5%, and 0.03% lower in 2050 when compared to the BAU scenario. Similarly, Antosiewicz et al. [64] evaluates the macroeconomic impact of a faster coal phase-out scenario in Poland over the 2015–2050 period using a DSGE model (MEMO; [65]). They find a modest macroeconomic cost (<1%) in terms of GDP and employment, especially in the years when investment requirements in the decarbonization scenario are the largest.
Our review suggests that a lack of consensus still exists regarding the macroeconomic and societal implications of “green” policies. This can be attributed to the differences observed between different countries, regions, and sectors [11] in terms of economic structures, institutional settings, climate policies, and local energy resources [58,66]. However, the results may also vary according to the modeling approach used and the key assumptions made by the analysts or the models alone [56]. It seems that the energy policy analysis community will have to adopt a commonly accepted framework to mitigate this issue, making also sure that published work can be either reproduced or replicated [67].
3. Experimental Design
3.1. NECP Scenarios
The two scenarios considered in this study correspond to the draft (mild delignitization speed) and final (fast delignitization speed) versions of the Greek NECP that span over the period 2020–2030. Table 1 summarizes the main quantitative targets set by each plan and compares them with the core European ones. The targets refer to the RES share in gross final energy and electricity consumption, final energy consumption, lignite share in power generation, and GHG emissions reduction. As seen, the Greek government projects a significant restructuring of its energy sector, aiming for a much faster delignitization and a climate neutral economy by 2050.

Table 1.
Main quantitative targets set for 2030 under the final and draft versions of the Greek National Energy and Climate Plan (NECP). The aspiration level of the final NECP targets is evaluated against the core European ones to facilitate comparisons [16].
Two energy models were used for preparing the NECPs and assessing the evolution of the Greek energy system for the projected targets: Times-Greece, designed by the Center for Renewable Energy Sources and Saving (CRES), and Primes (more details are available in Section 2.1). Both models employ a bottom-up optimization approach to reach their conclusions by making key assumptions about the economic activity by industry and the number of households, among others [16]. Table 2 presents the exogenous parameters assumed in the present study, i.e., GDP and population growth. These projections were originally supplied by the Greek Ministry of Finance (MoF) and, although slightly different between the two NECP versions, in this study, we adopt the final projections for both simulation scenarios to allow for direct comparisons. Moreover, Table 2 presents the evolution of the gross inland energy consumption (GIEC) and energy intensity (; [68]) considered in this study for the draft and final NECP scenarios. In particular, for the case of the final NECP’s scenario, the results correspond to the average (arithmetic mean) of the outputs of Times-Greece and Primes, while, for the case of the draft NECP’s scenario, to the respective results of the two scenarios in terms of domestic energy consumption [16,69]. As described later in Section 3.2, these results will be supplied as input to the macroeconomic model used in our study in order to soft-link its conclusions with those of the energy models officially adopted for preparing the NECPs.
Table 2.
Gross Domestic product (GDP) and population projections considered in the present study for simulating the economic and societal impact of the targets set under the draft and final versions of the Greek NECP. These variables were also the exogenous parameters of the energy models used for preparing the NECPs and estimating the evolution of energy intensity and gross inland energy consumption (GIEC) [16,69].
Table 2 suggests that the energy intensity in Greece is expected to decrease significantly till 2030, being about 25% and 33% lower than 2020 for the cases of the draft and final NECP versions, respectively. Similarly, a decrease of GIEC by about 9% and 12% for the former and latter delignitization scenarios, respectively, is envisaged. On the contrary, GDP is expected to increase by more than 22%, demonstrating that “green” policies can effectively accompany economic growth. However, in order for the targets set to be met, significant investments are required to increase the RES capacity and improve buildings stocks, among others. In particular, as shown in Table 1, an estimate of €43.8 and €34.7 billion are necessary for implementing the final and draft versions of the NECP, respectively, with a large share of this amount (€19,138 Million) being covered by EU funds [16]. Therefore, the realization of the rapid delignitization scenario entails a higher risk in terms of capital requirements when compared to the mild transition. However, the financial pillar of EU, which would cover approximately 44% and 55% of the funding needs for the case of the final and draft NECP, respectively, mitigates the entailed risk. It is noteworthy that a split between public and private funding is not specified in either of the versions of the NECP of Greece, thus more justification is needed to further conclude on the challenges of each scenario from a funding’s perspective.
3.2. Models
In order to quantify the economic and societal impact of higher delignitization speeds on Greece at large, we utilize the standard version of the GTAP model [61]. GTAP is a comparative static, multi-region, global general equilibrium model that has been widely exploited for conducting similar simulations with the one examined in the presented study [58]. According to the model, production generates income that accrues to endowments, then being returned to the regional household and spent on three sources of final demand: (i) private expenditures, (ii) government spending, and (iii) saving (subsequently translated into investment spending).
A major advantage of GTAP over other alternatives of CGE models is that it is open-source. Thus, its parameters can be easily adjusted to better simulate the idiosyncrasy of the Greek economy, while its study requirements, including the model’s closure (i.e., the determination of the endogenous and exogenous parameters) can be directly tailored to better fit the problem under investigation. Moreover, since the shocks under evaluation are applied linearly over the sequential time periods of interest, i.e., 2020 to 2025 and 2026 to 2030, its static nature does not affect the representativeness of the results over time.
We soft-link GTAP to the energy models utilized for constructing the two delignitization speed scenarios in order to acquire the shocks of interest, triggered by the policy measures described in the draft and final versions of the Greek NECP to achieve the respective energy and climate targets set for 2030. Moreover, we calibrate the model based on the macroeconomic and demographic projections originally supplied to the energy models to ensure a harmonized starting point for all simulations. This also involves linking the model to the latest version of the GTAP database (pre-release version 11; [70,71]) and updating the data that refer to the Greek economy (row and column sums of the Greek SAM table), originally provided using 2017 as a reference year. To do so, the money flows of the database are multiplied by a scaling factor, , that corresponds to the GDP growth between 2017 and 2020, measured in 2010 constant prices. No adjustments are made to the microeconomic parameters of the database, such as the production and imports share of sectors, due to information shortage. However, we do adjust the elasticity parameters of the model in order for its results to better represent the trade pattern changes [61, Chapter 4]. Thus, we raise the original values provided by 10% and 20% for the 5-year and 10-year simulations, respectively, validating the appropriateness of the determined values by conducting back-casting exercises and selecting appropriate evaluation measures [72].
The database contains 142 regions, aggregated to two regional coalitions. The first is composed of Greece (region of interest), while the rest constitute the “Rest of World” (ROW) regional coalition. In addition, it contains 65 sectors, aggregated to 10 major ones, with “Energy” sector being one of them. Finally, the database contains five primary factors of production, namely land, unskilled labor, skilled labor, capital, and natural resources. Capital and labor are assumed to be perfectly mobile (can fully move from one sector to another until being equally remunerated from each sector), natural resources immobile, or sector specific (cannot move from one sector to another), while land is partially mobile (the factor’s transition from one sector to another is discouraged due to the existence of transition costs). We adopt this mobility structure as it represents reality for the simulations of interest’s time horizons [73].
The simulations are performed in two stages, each referring to a particular time span (2020 to 2025 or 2020 to 2030). This allows us to examine the effect of the examined policy measures in both the short and the medium term and inspect the pathway of the Greek economy towards achieving its targets in more detail. In addition, each stage is composed of three simulations. The first two simulations construct the BAU or trend-based scenario, reflecting how the Greek economy would evolve over the 2020–2030 period based on the projections made (GDP, population, and factors of production supply). The third simulation creates the counterfactual scenarios of this study, reflecting how the Greek economy would evolve if the policy measures foreseen under the mild and rapid delignitization scenarios were applied. The latter simulation involve both the projections made for the Greek economy and the shocks’ rates sparked by the policy measures envisaged by each scenario.
Since GTAP is not a growth model, in order to construct the BAU scenario, we first conduct a simulation by providing the endowments (capital, labor, natural resources, and land) growth projections to the model as shocks (exogenous parameters) along with the projections of the GDP and population. Moreover, as GTAP is a global model, we supply these projections for all the regions considered by the model apart from the region of interest (Greece). We assume that land and natural resources are in fixed supply between 2020–2025 and 2020–2030, an approach that has been followed by many policy making studies for similar simulation horizons [61, Chapter 4]. By applying these baseline shocks, an economy-wide productivity factor is calculated for achieving the projected GDP growth. Then, we perform a second simulation by changing the model’s closure and swapping GDP with output productivity (i.e., making GDP an endogenous parameter and total productivity factor an exogenous one) to construct the final BAU scenario. The latter simulation serves also as a homogeneity test that evaluates whether the model behaves appropriately or not, in a sense that the projected GDP growth for Greece and RoW must be precisely simulated by the model after applying the above-mentioned shocks. Below, we describe how the growth rate values of the parameters required for constructing the BAU scenario are determined, as presented in Table 3. Note that our computations are based on the second Shared Socioeconomic Pathway (SSP2) provided by International Institute for Applied Systems Analysis (IIASA) [74,75,76], since it is considered a moderate pathway in comparison with the rest of the alternatives and describes a world that best reflects historical trends.
Table 3.
Baseline growth rates provided as shocks to Global Trade Analysis Project (GTAP) for constructing the Business as Usual (BAU) scenarios of Greece and Rest of World (RoW) over the periods 2020–2025 and 2020–2030.
- 1
- GDP growth: Provided by Greece’s MoF and Organization for Economic Co-operation and Development (OECD) [77] for Greece and RoW, respectively.
- 2
- Population growth: Provided by the Greece’s MoF and SSP2 [74,75,76] for Greece and ROW, respectively.
- 3
- Endowments growth:
- Labor force growth rate: It is set equal to the growth rate of the working age population, i.e., the population aged between 15 and 64, and is calculated based on the IIASA’s SSP2 [74,75,76], both for Greece and RoW.
- Capital growth: Capital accumulation, K, is calculated as proposed by Fouré et al. [78]:where is the gross fixed capital investment (GFCI) of country i at year t and is the depreciation rate, being equal to 4%, as specified in the GTAP database. The start year for performing the computations is 2020. Capital supply is retrieved from the GTAP database for both Greece and RoW, while GFCI is specified using data provided by the Hellenic Statistical Authority [79] and the World Bank [80], respectively. Since GFCI is not provided for the complete simulations horizon, we proceed by projecting these values using a regression model that correlates GFCI with GDP projections.
In order to construct the rapid and mild delignitization scenarios, we utilize the results emerged from the simulations of energy models employed for preparing the respective versions of the Greek NECP. Specifically, we model the shocks of interest via a uniform decline of GIEC of Greece and an increase of the total investments of the Greek economy. GIEC represents the quantity of energy necessary to satisfy the inland consumption of the geographical entity under consideration, being calculated as the sum of the primary energy consumption and net energy imports (imports–exports), plus the recovered products and variations of stocks [81]. Thus, we shock the primary energy production and energy imports of Greece to decrease by the GIEC’s decrease rate considered under each scenario over the periods 2020–2025 and 2020–2030, while the energy exports of Greece to grow by the same rate. Note that, according to the SAM table of Greece, energy stocks’ variations and recovered products are equal to zero. Moreover, given that the investments in the Greek economy in 2020 are assumed as being equal to €28,729 millions, we shock the total investments directed towards the Greek economy in order to increase their value by 73% and 152% over the 2020–2025 and 2020–2030 periods, respectively, for the rapid delignitization scenario, while, for the mild delignitization scenario, by 57% and 121%. Note that, as mentioned in Section 3.1, in this study, the additional investments required are not classified into public and private ones since this information is not provided by the Greek Ministry of Environment and Energy. In addition, we do not simulate any shocks regarding the final energy prices or production costs since the average cost of electricity generation remains stable over the 2020–2030 period [16]. The shock rates applied to primary energy production, energy imports, energy exports, and total investments for constructing the two delignitization scenarios are summarized in Table 4.
Table 4.
Shock rates applied upon the Greek economy over the 2020–2025 and 2020–2030 periods to construct the rapid and mild delignitization scenarios.
Since the results of all CGE models depend heavily on the elasticities considered, we follow a systematic sensitivity analysis approach [82] to evaluate the sensitivity of our results, particularly for the rapid delignitization scenario. In this regard, we distort the elasticities originally provided by GTAP by 20% from their central values, performing the respective simulation multiple times for different parameter values. We use a triangular distribution to vary the values of the elasticities and Stroud’s quadrature for approximation. By acquiring the mean and standard deviation of the endogenous variables arisen from the simulations, we derive the 95% confidence intervals (CIs) of the results.
We perform the simulations and the respective sensitivity analysis using the GTAP’s interface, RunGTAP [83,84]. At all the simulations performed, we select the “Johansen” method as the solution algorithm [83,84]. For the graphical representation of the results, we use the ggplot2 package for R [85].
4. Results
The results of our simulations demonstrate the potential economic and societal implications of higher delignitization speeds. It is noteworthy that the differences reported between the results of the two delignitization scenarios are of much greater importance than the absolute pathways simulated for each scenario individually, since they explicitly account for the impact of different lignite phase-out speeds. However, to better inspect the absolute consequences of each scenario, we also present the full pathways over the 2020–2030 period. We should clarify that, although GTAP, like any other macroeconomic model, does not take into consideration the technological aspects and advances of the energy sector, these are indirectly incorporated into our analysis through the exploitation of the results of the bottom-up energy models used under the NECP of Greece preparation.
Figure 1 presents the evolution of the Greek GDP (adjusted for inflation), which demonstrates the value change of the goods and services produced by the Greek economy, under the rapid and mild delignitization scenarios, as well as the BAU one. Moreover, it displays the 95% CI of the rapid delignitization scenario pathway to demonstrate the variation of its projections under high parameter’s uncertainty. As seen, rapid delignitization has a positive impact on GDP in the medium term, with GDP being 1% higher in 2030 compared to the mild transition. The differences are mainly observed over the 2026–2030 period, with the two pathways being almost identical over the 2020–2025 period. In addition, the significant differences observed between both delignitization scenarios and the BAU one, highlight the positive economic implications of adopting “green” policy measures. We also find that the results of the rapid delignitization scenario are relatively insensitive to model parameters’ variability, suggesting confidence about the positive impact of fast transitions on GDP when compared to BAU, but similar effects when compared to slower transitions.
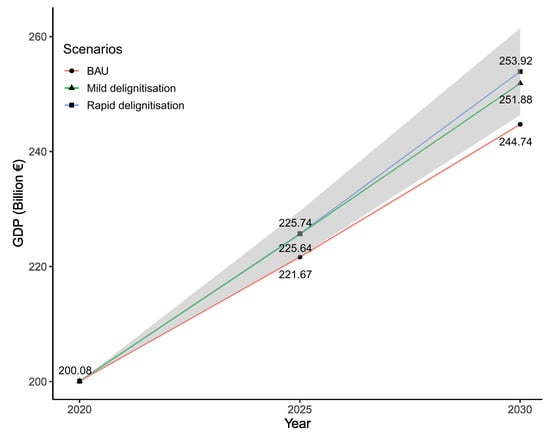
Figure 1.
Graphical display of the evolution of the GDP of Greece over the 2020–2025 and 2026–2030 periods under the BAU, mild, and rapid delignitization scenarios. The grey area indicates the 95% Confidence Interval (CI) of the rapid delignitization scenario’s pathway with respect to model parameters’ variability.
To interpret the results, it should be noted that the mild delignitization scenario encompasses a more rapid decrease of GIEC in the short term, causing a higher increase of the demand of the production factors (labor, capital, land, natural resources) to substitute for the energy required for production, thus increasing their compensation. The increased compensation of production factors in turn results in the increase of household income over the same period and subsequently in the increase of the household demand. However, in the short term, GDP under the rapid delignitization scenario not only does not decrease when compared to the mild transition, but it is slightly increased (by about 0.05%) due to the higher level of investments envisaged under this scenario. This trajectory is reversed, however, in the medium term, where the rapid delignitization scenario encompasses a higher decrease of the GIEC. This trend can be observed in Figure 2, which displays how household demand (plot A) and income (plot B) are going to elaborate under the rapid and mild delignitization scenarios. As seen, the household demand is expected to be 5.96% higher under the mild delignitization scenario in 2025, becoming 6.23% higher in 2030 under the rapid delignitization scenario. Moreover, household income, which determines the household demand, is expected to follow a similar trajectory, being 7.30% higher in 2030 under the rapid delignitization scenario.
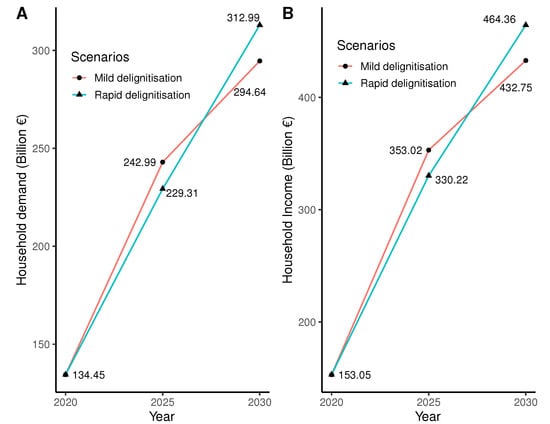
Figure 2.
Graphical display of the household demand (plot A) and income (plot B) over the 2020–2025 and 2026–2030 periods under the mild and rapid delignitization scenarios.
Observe that, since the household demand increases under the rapid delignitization scenario in the medium term, it positively affects the government demand (higher income and domestic sales taxes), which is expected to be 7.45% increased in 2030 compared to the mild transition. As far as the economy wide wages are concerned, in the medium term, the skilled labor is going to be benefited under the rapid delignitization scenario (+0.72% in 2030), while the unskilled one under the mild scenario (+0.53% in 2030). This finding suggests that more advanced technology is required to rapidly move to the post-lignite era, thereby favoring workers of higher skills. However, overall, in 2030, the difference between the wages of the two scenarios becomes negligible.
The first order effect of the higher household demand is the increase of the level of prices in terms of the Consumer Price Index (CPI) and the Producer Price Index (PPI). PPI indicates prices from the viewpoint of industries creating the products, whereas CPI from the perspective of consumers. The trajectory of the PPI defines the export price of Greek products, making them less competitive when increasing and vice versa. Price of imports depends on the domestic prices of the countries from which the products are imported and the import duties. Thus, its change cannot be connected to the changes taking place in the Greek economy. In this regard, Figure 3 exhibits how the CPI (plot A), PPI (plot B), and the price index of imports (plot C) and exports (plot D) are going to evolve under the rapid and mild delignitization scenarios over 2020–2030. As depicted, under the rapid delignitization scenario, CPI and PPI are going to be 4.42% and 3.03% increased in 2030, respectively, compared to the mild transition. On the other hand, the price index of imports is expected to be 1.38% increased 2030, under the rapid delignitization scenario, while the price index of exports will be 4.24% increased.
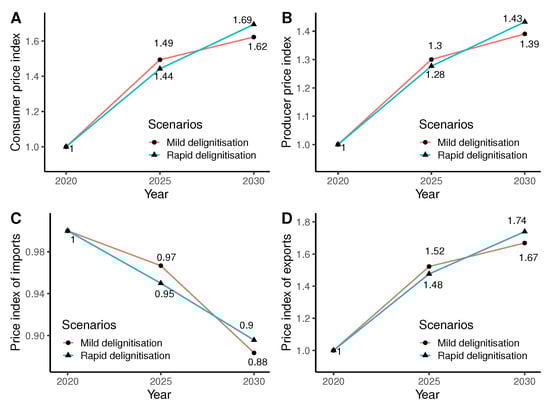
Figure 3.
Graphical display of the evolution of the Consumer Price Index (CPI; plot A), the Producer Price Index (PPI; plot B), the price index of imports (plot C), and the price index of exports (plot D) over the 2020–2025 and 2026–2030 periods under the mild and rapid delignitization scenarios.
The increased price of exports in the medium term under the rapid delignitization scenario, negatively affecting the international competitiveness and extroversion of the Greek products and services. This fact, in conjunction with the rise of domestic demand and income that encourages domestic firms to switch from selling abroad to selling domestically as it becomes more profitable, leads to the decline of the total exports of Greece. In that regard, under the rapid delignitization scenario, exports are going to be 10% decreased in 2030, compared to the mild transition. On the contrary, the imports are going to be 3.75% increased in 2030. Total imports demand follows the trajectory of the domestic demand, since firms and households consume more raw materials, products, and services, where a part of them is covered by imports. Value added of GDP’s trajectory is going to be almost identical under the two scenarios of different delignitization speed. Thus, given that the supply side is going to be expanded in the medium term due to the speedier delignitization, while value added is hardly going to be affected, it can be concluded that the productivity of the Greek economy will increase. The same value of factors of production results in a higher value of output or put it another way, the amount of value added required per unit of output decreases. Productivity of an economy composes one of the most important factors of the economy’s competitiveness [86].
To sum up, the rapid delignitization scenario is expected to have a positive impact in the medium term both from a macroeconomic and societal point of view. However, it also entails a higher risk in a sense that its realization presents higher capital needs, the alleviation of which is enabled via the financial support of EU. Considering the GDP per capita, i.e., the total output of an entire economy that corresponds to each citizen, a measure usually utilized when assessing the standard of living, it is simulated that, in the case of implementing the rapid delignitization scenario, an increase of the GDP per capita by €70.21 (in 2010 constant prices) on a yearly basis over 2020–2030 on average will take place, relative to the mild transition. Moreover, an increase of income per capita by €9.34 and of wages per capita by €60.17 per annum on average is simulated over the same period. As a result, the purchasing power of the Greek citizens is expected to expand and their welfare conditions to improve due to the faster delignitization transition.
In regard to the expected impact of the policies under examination on the employment, under the model’s closure used, employment supply is assumed to be fixed and fully utilized while the wages are adjusted to cover the increased demand (employment closure). Hence, their impact on employment cannot be assessed under this closure. To inspect the employment impact, we must swap labor supply with wages, i.e., make labor supply endogenous and wages exogenous (unemployment closure). However, it has been proved that the same economic shocks can result in very different adjustment pathways of the economy in question if the unemployment closure is utilized over the employment one [32]. This is done as the CGE models are more sensitive to the economy’s growth under the unemployment closure, producing overoptimistic results [32]. However, considering the bigger expansion of the Greek economy simulated under the rapid delignitization scenario compared to the mild one, in the medium term, it becomes evident that the employment demand is going to increase over this period.
Table 5 presents the shocks reflecting the decarbonization target scenarios of those Member States for which a macroeconomic impact assessment of their target scenarios over 2020–2030 is available. The energy shocks are expressed, as described under their final NECPs, in terms of GHG emissions, the percentage of RES share in energy production, energy consumption, and investments, while the macroeconomic impacts resulted by applying these shocks in terms of GDP, employment, and income. If not mentioned otherwise, the macroeconomic impacts are expressed as percentage deviations from the BAU over 2020–2030. The macroeconomic impact-assessments performed in the context of the final NECPs and in most cases employ a combination of an energy optimization model with a top-down one (CGE or input–output).
Table 5.
Shocks on Member States’ general economies triggered by implementing the measures foreseen under the final NECPs, and the key macroeconomic impacts arisen by simulating these shocks over the 2020–2030 period [3].
As seen, in most cases, the decarbonization scenarios are expected to generate positive economy-wide impacts, proving the “double dividend” effect of green policies. Greece, which has to increase the investments channeled to its economy by about 2% of GDP annually over 2020-2030 for realizing its target scenario, has similar funding needs with Cyprus (+2.26%), France (+2.44%), Latvia (+2.65%), and Spain (+1.82%). The simulated macroeconomic impacts for these countries are in line with our outcomes in terms of GDP, ranging from being slightly positive (+0.25% for the case of Cyprus) to being more pronounced beneficial (+2.1% for the case of Spain). Note also that the study conducted by the EC [23], regarding the macroeconomic impact of the compatible with Paris-agreement policies at a EU level, results in the same conclusions. Specifically, it indicates an increase of EU GDP by 1.1% till 2030, compared to the baseline.
From the Member States presented in Table 5, the ones in which their target scenarios entail the largest capital requirements to be realized, face the largest challenges (e.g., Italy and Romania), while, when the scenarios are not accompanied by a positive impact on GDP, as it is the case with Italy, they imply a potential negative macroeconomic repercussion via the deterioration of the debt-to-GDP ratio [87]. Moreover, as seen, high discrepancies exist between Member States in regard to the projected trajectories of the main energy variables over the 2020–2030 period, which can be attributed to the particularities of their energy systems, i.e., a different effort is required per Member State to meet the energy goals that EU dictates. However, interestingly enough, despite the fact that different modelling approaches have been employed across Member States, a relative homogeneity is observed in terms of the expected impact of the policies on GDP, ranging from −0.59% for Finland to 2.4% for Slovenia, with the exception of Romania where a very large positive impact is simulated as a consequence of the target scenario’s implementation.
5. Conclusions and Future Work
The Greek government, having set particularly ambitious energy and climate targets for 2030 in the final version of its NECP relative to both the draft version of the document and the central key European targets, intends to radically transform its energy system, totally removing lignite from electricity production by 2028. This trend has already been observed over the last decade, where the share of RES has been significantly increased. The increasing cost of carbon in tandem with the decreasing cost of RES suggests that the focus of decision makers should not be laid on deciding whether decarbonization policies should be implemented or not, but rather on identifying the optimal speed of such an implementation in order for it to achieve both the economic and energy targets set. However, little evidence has been provided regarding the macroeconomic and societal impact of higher decarbonization speeds [22,88]. In this regard, in this study, we examine the macroeconomic and societal implications of adopting a rapid delignitization scenario relative to a mild one. To do so, we consider the two NECP scenarios prepared by the Greek Ministry of Environment and Energy, where the draft NECP accounts for a mild transition and the final one for a rapid transition. We follow a top-down analysis, using a CGE model to answer to economy-wide questions in medium and long terms, but soft-link its input parameters with the outputs of the bottom-up energy models utilized for constructing each transition scenario to enhance the representativeness of our results.
Our results indicate that the faster the delignitization is, the higher the macroeconomic and societal benefits are, provided that the required capital is available for funding the transition of the energy system. Moreover, they support the “double dividend” effect of green policies, suggesting that the delignitization of the energy system, irrespective of the speed conducted, is beneficial for the economy at large. In this respect, the rapid delignitization scenario is anticipated to boost the Greek economy and improve the living standard of Greek citizens in the medium term, with GDP and household income being higher in the order of 1% and 7%, respectively, in 2030 compared to the mild delignitization scenario. This is mainly ascribed to the additional investments required for implementing the revised, more stringent measures of the rapid delignitization scenario that expand the Greek economy, as well as to the increased demand of production factors for substituting for energy that positively affects the household’s income. The only repercussions in the medium term, commonly observed in a demand-based expansion, are the increased inflation (CPI: +4.42% in 2030), the greater imports dependence (imports: +3.75% in 2030), and the decline of the international competitiveness of the Greek economy (exports: −10% in 2030). Finally, our results are in line with those for Member States having similar energy targets and investments needs with Greece, as well as with those of the study conducted by the EC regarding the compatibility with Paris-agreement policies.
Based on the limitations of our study, we also envision some expansions of it that could be considered in future research. For instance, in our study, we use a “one-way linkage” between the bottom-up, energy models, and the top-down, macroeconomic model. A more consistent way of linking the two approaches would be to employ a “two-way linkage”, as well as to account for uncertainties against different plausible socioeconomic trajectories [89]. Moreover, apart from the economy wide impacts that this paper focuses on, the regional ones could be examined to evaluate the fairness of the distribution of the projected impact. In doing so, agent-based models [90] could be incorporated to examine the impact of local agents’ (e.g., power generators) decisions [91]. In addition, given that the COVID-19 crisis forced governments to undertake containment measures to halt the spread of the virus, large costs on economic activity have unexpectedly emerged, which could be taken into account to better simulate the implications of “green” policy measures in the short-term. Finally, EU revised its climate targets in December of 2020, setting even more ambitious ones [92]. This change is going to force Member States to revise their corresponding climate objectives, triggering further evaluations and simulations.
Author Contributions
Conceptualization, D.K., E.S., H.D. and J.P.; methodology, D.K., E.S., H.D. and J.P.; software, D.K.; validation, D.K. and E.S.; formal analysis, D.K.; investigation, D.K.; resources, D.K.; data curation, D.K.; writing—original draft preparation, D.K. and E.S.; writing—review and editing, D.K., E.S., H.D. and J.P.; visualization, D.K.; supervision, H.D. and J.P.; project administration, H.D. and J.P.; funding acquisition, H.D. and J.P. All authors have read and agreed to the published version of the manuscript.
Funding
This research was funded by European Commission Horizon 2020 Framework Programme, “PARIS REINFORCE” Research and Innovation Project, Grant No. 820846.
Institutional Review Board Statement
Not applicable.
Informed Consent Statement
Not applicable.
Data Availability Statement
The datasets analyzed during the current study were extracted from the draft and final versions of the NECP of Greece [16,69], the final NECPs of Member States [3], the OECD macro-projections (Available online: https://doi.org/https://doi.org/10.1787/39a88ab1-en (accessed on 5 August 2020)), the SSP2 of IIASA (Available online: https://tntcat.iiasa.ac.at/SspDb (accessed on 5 August 2020)) and the GTAP database pre-release version 11 (not publicly released yet—available only for contributors).
Acknowledgments
The most important part of this research is based on the H2020 European Commission Project “PARIS REINFORCE” under Grant No. 820846. The sole responsibility for the content of this paper lies with the authors. The paper does not necessarily reflect the opinion of the European Commission.
Conflicts of Interest
The authors declare no conflict of interest. The funders had no role in the design of the study; in the collection, analyses, or interpretation of data; in the writing of the manuscript, or in the decision to publish the results.
Abbreviations
The following abbreviations are used in this manuscript:
| BAU | Business as Usual |
| CGE | Computable General Equilibrium |
| CI | Confidence Interval |
| CPI | Consumer Price Index |
| CRES | Center for Renewable Energy Sources and Saving |
| DSGE | Dynamic Stochastic General Equilibrium |
| EC | European Commission |
| ETS | Emissions Trading System |
| EU | European Union |
| GDP | Gross Domestic Product |
| GFEC | Gross Final Energy Consumption |
| GFElC | Gross Final Electricity Consumption |
| GHG | Greenhouse Gases |
| GIEC | Gross Inland Energy Consumption |
| GTAP | Global Trade Analysis Project |
| IEA | International Energy Agency |
| IIASA | International Institute for Applied Systems Analysis |
| MoF | Ministry of Finance |
| NECP | National Energy and Climate Plan |
| OECD | Organization for Economic Co-operation and Development |
| PPI | Producer Price Index |
| Primes | Price-Induced Market Equilibrium System |
| RES | Renewable Energy Sources |
| RoW | Rest of World |
| SAM | Social Accounting Matrix |
| SSP | Shared Socioeconomic Pathway |
| TIMES | Integrated MARKAL-EFOM2 System |
References
- European Commission. 2050 Long-Term Strategy. 2020. Available online: https://ec.europa.eu/clima/policies/strategies/2050_en (accessed on 4 September 2020).
- European Council. Governance of the Energy Union: Council Confirms Deal Reached with the European Parliament. 2020. Available online: https://www.consilium.europa.eu/en/press/press-releases/2018/06/29/governance-of-the-energy-union-council-confirms-deal-reached-with-the-european-parliament/ (accessed on 20 September 2020).
- European Commission. National Energy and Climate Plans (NECPs). 2020. Available online: https://ec.europa.eu/energy/topics/energy-strategy/national-energy-climate-plans_en (accessed on 7 May 2020).
- D’Alessandro, S.; Luzzati, T.; Morroni, M. Erratum to “Energy transition towards economic and environmental sustainability: Feasible paths and policy implications”. J. Clean. Prod. 2010, 18, 531. [Google Scholar] [CrossRef]
- Fermeglia, M.; Bevilacqua, P.; Cafaro, C.; Ceci, P.; Fardelli, A. Legal Pathways to Coal Phase-Out in Italy in 2025. Energies 2020, 13, 5605. [Google Scholar] [CrossRef]
- Kotze, R.; Brent, A.C.; Musango, J.; de Kock, I.; Malczynski, L.A. Investigating the Investments Required to Transition New Zealand’s Heavy-Duty Vehicles to Hydrogen. Energies 2021, 14, 1646. [Google Scholar] [CrossRef]
- European Commission. European Green Deal: What Role Can Taxation Play? 2020. Available online: https://ec.europa.eu/taxation_customs/commission-priorities-2019-24/european-green-deal-what-role-can-taxation-play_en (accessed on 7 May 2020).
- Roser, M. Why did Renewables Become Thus, Cheap Thus, Fast? In addition, What Can We do to Use This Global Opportunity for Green Growth? 2020. Available online: https://ourworldindata.org/cheap-renewables-growth#:~:text=In%20most%20places%20in%20the,declines%20by%20the%20same%20fraction (accessed on 1 December 2020).
- Parry, I.; Bento, A. Tax deductions, environmental policy, and the ’double dividend’ hypothesis. J. Environ. Econ. Manag. 2000, 39, 67–96. [Google Scholar] [CrossRef]
- Freire-González, J. Environmental taxation and the double dividend hypothesis in CGE modelling literature: A critical review. J. Policy Model. 2018, 40, 194–223. [Google Scholar] [CrossRef]
- Wesseh, P.K., Jr.; Lin, B. Environmental policy and ‘double dividend’ in a transitional economy. Energy Policy 2019, 134. [Google Scholar] [CrossRef]
- Chepeliev, M.; Diachuk, O.; Podolets, R. Transition towards High Share of Renewables in Ukraine: Linked Energy System and CGE Model Approach, 2018. Available online: https://ssrn.com/abstract=3231225 (accessed on 10 August 2020).
- Köhlin, G.; Pattanayak, S.; Sills, E.; Mattsson, E.; Ostwald, M.; Salas, A.; Ternald, D. In Search of Double Dividends from Climate Change Interventions Evidence from Forest Conservation and Household Energy Transitions. 2015. Available online: https://eba.se/rapporter/in-search-of-double-dividends-from-climate-change-interventions-evidence-from-forest-conservation-and-household-energy-transitions/3226/ (accessed on 9 September 2020).
- Newell, P.; Mulvaney, D. The political economy of the ‘just transition’. Geogr. J. 2013, 179, 132–140. [Google Scholar] [CrossRef]
- Alexander, S.; Floyd, J. The Political Economy of Deep Decarbonization: Tradable Energy Quotas for Energy Descent Futures. Energies 2020, 13, 4304. [Google Scholar] [CrossRef]
- HMEE. National Energy and Climate Plan; Hellenic Ministry of Environment and Energy. 2019. Available online: https://ec.europa.eu/energy/sites/ener/files/el_final_necp_main_en.pdf (accessed on 30 August 2020).
- Nikas, A.; Neofytou, H.; Karamaneas, A.; Koasidis, K.; Psarras, J. Sustainable and socially just transition to a post-lignite era in Greece: A multi-level perspective. Energy Sources Part B Econ. Plan. Policy 2020, 15, 513–544. [Google Scholar] [CrossRef]
- Roser, M. Coal Types. 2021. Available online: https://energyeducation.ca/encyclopedia/Coal_types (accessed on 24 March 2021).
- PPC. Mines. 2020. Available online: https://www.dei.gr/en/i-dei/i-etairia/tomeis-drastiriotitas/oruxeia (accessed on 23 November 2020).
- Dedi, D.V.; Mavroeidis-Kamperis, P. Natural Gas in Greece: The Bridge to Decarbonization. 2020. Available online: https://energypress.eu/natural-gas-in-greece-the-bridge-to-decarbonization/ (accessed on 30 September 2020).
- HAEE. Greek Energy Market, Report 2019. Available online: https://www.haee.gr/media/4858/haees-greek-energy-market-report-2019-upload-version.pdf (accessed on 23 November 2020).
- Marinakis, V.; Flamos, A.; Stamtsis, G.; Georgizas, I.; Maniatis, Y.; Doukas, H. The Efforts towards and Challenges of Greece’s Post-Lignite Era: The Case of Megalopolis. Sustainability 2020, 12, 575. [Google Scholar] [CrossRef]
- European Commission. Employment and Social Developments in Europe 2019. Available online: https://op.europa.eu/en/publication-detail/-/publication/747fefa1-d085-11e9-b4bf-01aa75ed71a1/language-en (accessed on 10 January 2021).
- Kumbaroğlu, G.; Canaz, C.; Deason, J.; Shittu, E. Profitable Decarbonization through E-Mobility. Energies 2020, 13, 4042. [Google Scholar] [CrossRef]
- Greenleaf, J.; Harmsen, R.; Angelini, T.; Green, D.; Williams, A.; Rix, O.; Lefevre, N.; Blyth, W. Analysis of Impacts of Climate Change Policies on Energy Security–Final Report. 2009. Available online: https://ec.europa.eu/environment/integration/energy/pdf/cces.pdf (accessed on 5 October 2020).
- Nikas, A.; Doukas, H.; Papandreou, A. A Detailed Overview and Consistent Classification of Climate-Economy Models; Springer: Berlin/Heidelberg, Germany, 2018; pp. 1–54. [Google Scholar] [CrossRef]
- Doukas, H.; Nikas, A.; González-Eguino, M.; Arto, I.; Anger-Kraavi, A. From integrated to integrative: Delivering on the paris agreement. Sustainability 2018, 10, 2299. [Google Scholar] [CrossRef]
- Herbst, A.; Toro, F.; Reitze, F.; Jochem, E. Introduction to energy systems modelling. Swiss J. Econ. Stat. 2012, 148, 111–135. [Google Scholar] [CrossRef]
- Helgesen, P.I. Top-Down and Bottom-Up: Combining Energy System Models and Macroeconomic General Equilibrium Models. 2013. Available online: https://www.ntnu.no/documents/7414984/202064323/2013-12-11+Linking+models_444.pdf/4252b320-d68d-43df-81b8-e8c72ea1bfe1 (accessed on 15 October 2020).
- Herbst, M.; Toro, F.; Reitze, F.; Eberhard, J. Bridging Macroeconomic and Bottom up Energy Models-the Case of Efficiency in Industry. 2012. Available online: https://www.eceee.org/library/conference_proceedings/eceee_Industrial_Summer_Study/2012/3-matching-policies-and-drivers-policies-and-directives-to-drive-industrial-efficiency/bridging-macroeconomic-and-bottom-up-energy-models-the-case-of-efficiency-in-industry/ (accessed on 15 October 2020).
- Catenazzi, G. Advances in Techno-Economic Energy Modeling. Costs, Dynamics and Hybrid Aspects. Ph.D. Thesis, ETH Zurich, Zurich, Switzerland, 2009. [Google Scholar] [CrossRef]
- Burfisher, M.E. Introduction to Computable General Equilibrium Models, 2nd ed.; Cambridge University Press: Cambridge, UK, 2017. [Google Scholar] [CrossRef]
- Perali, F.; Scandizzo, P. DSGE vs. CGE Models: Modelling Sustainable Development in a Computable General Equilibrium Context. 2020. Available online: https://siecon3-607788.c.cdn77.org/sites/siecon.org/files/media_wysiwyg/297-perali-scandizzo_0.pdf (accessed on 30 December 2020).
- Khansari, F. General Equilibrium Models and Uncertainty in Environmental Policies: Implications for Australia. 2015. Available online: https://ro.uow.edu.au/cgi/viewcontent.cgi?article=1954&context=buspapers (accessed on 10 December 2020).
- Nilsson, L. Reflections on the economic modelling of free trade agreements. J. Glob. Econ. Anal. 2018, 3, 156–186. [Google Scholar] [CrossRef]
- Lucas, R.J. Econometric policy evaluation: A critique. Carnegie Rochester Conf. Ser. Public Policy 1976, 1, 19–46. [Google Scholar] [CrossRef]
- Krook-Riekkola, A.; Berg, C.; Ahlgren, E.; Söderholm, P. Challenges in top-down and bottom-up soft-linking: Lessons from linking a Swedish energy system model with a CGE model. Energy 2017, 141, 803–817. [Google Scholar] [CrossRef]
- Katris, A.; Calvillo-Muñoz, C.; Figus, G.; Riddoch, F.; Turner, K.; McGregor, P.; Lecca, P.; Swales, K. Workshop on Linking CGE and TIMES Models: Lessons Learned and Next, Steps; 2017; International Public Policy Institute Policy Brief, University of Strathclyde, 2017. An “Occasional Paper” Published by the University of Strathclyde’s International Public Policy Institute (IPPI); Available online: https://pureportal.strath.ac.uk/en/publications/workshop-on-linking-cge-and-times-models-lessons-learned-and-next (accessed on 10 September 2020).
- LEFEVRE, J. Hybridization Challenges in Energy-Economy Integrated Models and Representation of the Low Carbon Transition: An Application to the Brazilian Case. Theses, Université Paris Saclay, 2016. Available online: https://hal.archives-ouvertes.fr/tel-01685944 (accessed on 10 September 2020).
- IEA-ETSAP. IEA-ETSAP Optimization Modeling Documentation. 2020. Available online: https://iea-etsap.org/index.php/etsap-tools/model-generators/times (accessed on 7 May 2020).
- E3MLab. The PRIMES Model. 2020. Available online: http://www.e3mlab.eu/e3mlab/index.php?option=com_content&view=category&id=35 (accessed on 7 May 2020).
- Fortes, P.; Pereira, A.M.; Pereira, R.M.; Seixas, J. Integrated Technological-Economic Modeling Platform for Energy and Climate Policy Analysis. Working Papers 148, Department of Economics, College of William and Mary, 2014. Available online: https://ideas.repec.org/p/cwm/wpaper/148.html (accessed on 15 September 2020).
- Bye, B.; Espegren, K.; Fæhn, T.; Rosendahl, E.; Rosnes, O. Energy Technology and Energy Economics: Analysis of Energy Policy in Two Different Model Traditions, 2016. IAEE. Available online: https://www.iaee.org/proceedings/article/14502 (accessed on 15 September 2020).
- Glynn, J.; Fortes, P.; Krook-Riekkola, A.; Labriet, M.; Vielle, M.; Kypreos, S.; Lehtilä, A.; Mischke, P.; Dai, H.; Gargiulo, M.; et al. Economic Impacts of Future Changes in the Energy System—Global Perspectives. In Informing Energy and Climate Policies Using Energy Systems Models: Insights from Scenario Analysis Increasing the Evidence Base; Springer International Publishing: Cham, Switzerland, 2015; pp. 333–358. [Google Scholar] [CrossRef]
- Labriet, M.; Drouet, L.; Vielle, M.; Loulou, R.; Kanudia, A.; Haurie, A. Assessment of the Effectiveness of Global Climate Policies Using Coupled Bottom-up and Top-down Models. Working Papers 2015.23, Fondazione Eni Enrico Mattei, 2015. Available online: https://ssrn.com/abstract=2580216 (accessed on 15 September 2020).
- Delzeit, R.; Beach, R.; Bibas, R.; Britz, W.; Chateau, J.; Freund, F.; Lefevre, J.; Schuenemann, F.; Sulser, T.; Valin, H.; et al. Linking Global CGE Models with Sectoral Models to Generate Baseline Scenarios: Approaches, Challenges, and Opportunities. J. Glob. Econ. Anal. 2020, 5, 162–195. [Google Scholar] [CrossRef]
- Doukas, H.; Nikas, A. Decision support models in climate policy. Eur. J. Oper. Res. 2020, 280, 1–24. [Google Scholar] [CrossRef]
- Nikas, A.; Gambhir, A.; Trutnevyte, E.; Koasidis, K.; Lund, H.; Thellufsen, J.; Mayer, D.; Zachmann, G.; Miguel, L.; Ferreras-Alonso, N.; et al. Perspective of comprehensive and comprehensible multi-model energy and climate science in Europe. Energy 2021, 215. [Google Scholar] [CrossRef]
- Adams, P. Interpretation of results from CGE models such as GTAP. J. Policy Model. 2005, 27, 941–959. [Google Scholar] [CrossRef]
- Forouli, A.; Gkonis, N.; Nikas, A.; Siskos, E.; Doukas, H.; Tourkolias, C. Energy efficiency promotion in Greece in light of risk: Evaluating policies as portfolio assets. Energy 2019, 170, 818–831. [Google Scholar] [CrossRef]
- Calise, F.; Cappiello, F.L.; Vicidomini, M.; Song, J.; Pantaleo, A.M.; Abdelhady, S.; Shaban, A.; Markides, C.N. Energy and Economic Assessment of Energy Efficiency Options for Energy Districts: Case Studies in Italy and Egypt. Energies 2021, 14, 1012. [Google Scholar] [CrossRef]
- Nasirov, S.; O’Ryan, R.; Osorio, H. Decarbonization Tradeoffs: A Dynamic General Equilibrium Modeling Analysis for the Chilean Power Sector. Sustainability 2020, 12, 8248. [Google Scholar] [CrossRef]
- Gonzalez-Salazar, M.; Langrock, T.; Koch, C.; Spieß, J.; Noack, A.; Witt, M.; Ritzau, M.; Michels, A. Evaluation of Energy Transition Pathways to Phase out Coal for District Heating in Berlin. Energies 2020, 13, 6394. [Google Scholar] [CrossRef]
- Chepeliev, M. Simulation and Economic Impact Evaluation of Ukrainian Electricity Market Tariff Policy Shift, 2014. Available online: https://ssrn.com/abstract=2608980 (accessed on 20 August 2020).
- Renner, M.; Garcia-Banos, C.; Nagpal, D.; Khalid, A. Renewable Energy and Jobs—Annual Review 2018. Available online: https://www.irena.org/publications/2018/May/Renewable-Energy-and-Jobs-Annual-Review-2018#:~:text=The%20industry%20created%20more%20than,million%20for%20the%20first%20time (accessed on 20 December 2020).
- Ram, M.; Aghahosseini, A.; Breyer, C. Job creation during the global energy transition towards 100% renewable power system by 2050. Technol. Forecast. Soc. Chang. 2020, 151, 119682. [Google Scholar] [CrossRef]
- Rutovitz, J.; Dominish, E.; Downes, J. Calculating Global Energy Sector Jobs: 2015 Methodology, 2015. Available online: http://hdl.handle.net/10453/43718 (accessed on 20 September 2020).
- Almutairi, K.; Thoma, G.; Durand-Morat, A. Ex-ante analysis of economic, social and environmental impacts of large-scale renewable and nuclear energy targets for global electricity generation by 2030. Sustainability 2018, 10, 2884. [Google Scholar] [CrossRef]
- EIA, U. The International Energy Outlook 2016 (IEO2016). 2017. Available online: https://www.eia.gov/outlooks/ieo/ (accessed on 2 December 2020).
- Truong, T.P.; Kemfert, C.; Burniaux, J.M. GTAP-E: An Energy-Environmental Version of the GTAP Model with Emission Trading; Number 668 in DIW Discussion Papers; Deutsches Institut für Wirtschaftsforschung (DIW): Berlin, Germany, 2007; Available online: http://hdl.handle.net/10419/18400 (accessed on 20 September 2020).
- Hertel, T.W. Global Trade Analysis: Modeling and Applications; Cambridge University Press: Cambridge, UK, 1996. [Google Scholar] [CrossRef]
- Grottera, C.; Rovere, E.L.L.; Wills, W.; Pereira, A.O., Jr. The role of lifestyle changes in low-emissions development strategies: An economy-wide assessment for Brazil. Clim. Policy 2020, 20, 217–233. [Google Scholar] [CrossRef]
- Lefevre, J. A description of the IMACLIM-BR Model: A Modeling Framework to Assess Climate and Energy Policy in Brazil. CIRED Working Papers hal-01685947, HAL, 2016. Available online: https://ideas.repec.org/p/hal/ciredw/hal-01685947.html (accessed on 15 December 2020).
- Antosiewicz, M.; Nikas, A.; Szpor, A.; Witajewski-Baltvilks, J.; Doukas, H. Pathways for the transition of the Polish power sector and associated risks. Environ. Innov. Soc. Transitions 2020, 35, 271–291. [Google Scholar] [CrossRef]
- Bukowski, M.; Kowal, P. Large Scale, Multi-Sector DSGE Model as a Climate Policy Assessment Tool—Macroeconomic Mitigation Options (MEMO) Model for Poland. IBS Working Papers 3/2010, Instytut Badan Strukturalnych, 2010. Available online: https://ideas.repec.org/p/ibt/wpaper/wp032010.html (accessed on 20 December 2020).
- NGFS. Guide to Climate Scenario Analysis for Central Banks and Supervisors. Available online: https://www.ngfs.net/sites/default/files/medias/documents/ngfs_guide_scenario_analysis_final.pdf (accessed on 20 November 2020).
- Makridakis, S.; Assimakopoulos, V.; Spiliotis, E. Objectivity, reproducibility and replicability in forecasting research. Int. J. Forecast. 2018, 34, 835–838. [Google Scholar] [CrossRef]
- Eurostat. Glossary: Energy Intensity. 2020. Available online: https://ec.europa.eu/eurostat/statistics-explained/index.php?title=Glossary:Energy_intensity (accessed on 7 May 2020).
- HMEE. National Energy and Climate Plan; Hellenic Ministry of Environment and Energy (Draft Version). 2019. Available online: https://ec.europa.eu/energy/sites/ener/files/documents/ec_courtesy_translation_el_necp.pdf (accessed on 30 August 2020).
- Aguiar, A.; Narayanan, B.; McDougall, R. An Overview of the GTAP 9 Data Base. J. Glob. Econ. Anal. 2016, 1, 181–208. [Google Scholar] [CrossRef]
- Aguiar, A.; Chepeliev, M.; Corong, E.L.; McDougall, R.; van der Mensbrugghe, D. The GTAP data base: Version 10. J. Glob. Econ. Anal. 2019, 4, 1–27. [Google Scholar] [CrossRef]
- Koutsandreas, D.; Spiliotis, E.; Petropoulos, F.; Assimakopoulos, V. On the selection of forecasting accuracy measures. J. Oper. Res. Soc. 2021. [Google Scholar] [CrossRef]
- Narayanan, B.; McDougall, R. Guide to the GTAP Data Base. 2015. Available online: https://www.gtap.agecon.purdue.edu/resources/res_display.asp?RecordID=4819 (accessed on 1 December 2020).
- Riahi, K.; van Vuuren, D.P.; Kriegler, E.; Edmonds, J.; O’Neill, B.; Fujimori, S.; Bauer, N.; Calvin, K. The Shared Socioeconomic Pathways and their energy, land use, and greenhouse gas emissions implications: An overview. Glob. Environ. Chang. 2017, 42, 153–168. [Google Scholar] [CrossRef]
- Rogelj, J.; Popp, A.; Calvin, K.V.; Luderer, G.; Emmerling, J.; Gernaat, D.; Fujimori, S.; Strefler, J. Scenarios towards limiting global mean temperature increase below 1.5 °C. Nat. Clim. Chang. 2018, 8, 325–332. [Google Scholar] [CrossRef]
- Gidden, M.J.; Riahi, K.; Smith, S.J.; Fujimori, S.; Luderer, G.; Kriegler, E.; van Vuuren, D.P.; van den Berg, M. Global emissions pathways under different socioeconomic scenarios for use in CMIP6: A dataset of harmonized emissions trajectories through the end of the century. Geosci. Model Dev. 2019, 12, 1443–1475. [Google Scholar] [CrossRef]
- OECD. OECD Economic Outlook, Volume 2020 Issue 2; OECD Publishing: Paris, France, 2020; p. 264. [Google Scholar] [CrossRef]
- Fouré, J.; Bénassy-Quéré, A.; Fontagné, L. The Great Shift: Macroeconomic Projections for the World Economy at the 2050 Horizon. Working Papers hal-00962464, HAL, 2012. Available online: https://ideas.repec.org/p/hal/wpaper/hal-00962464.html (accessed on 10 September 2020).
- ELSTAT. Gross Fixed Capital Formation. 2020. Available online: https://www.statistics.gr/en/statistics/-/publication/SEL81/- (accessed on 30 June 2020).
- Worldbank. Gross Fixed Capital Formation (Constant 2010 US$). 2020. Available online: https://data.worldbank.org/indicator/NE.GDI.FTOT.KD (accessed on 30 June 2020).
- Eurostat. Glossary: Gross Inland Energy Consumption. 2018. Available online: https://ec.europa.eu/eurostat/statistics-explained/index.php/Glossary:Gross_inland_energy_consumption (accessed on 7 May 2020).
- Arndt, C.; Pearson, K.R. How to Carry out Systematic Sensitivity Analysis via Gaussian Quadrature and GEMPACK. 1998. Available online: https://www.copsmodels.com/ftp/gpssatp3/tp3.pdf (accessed on 10 July 2020).
- Pearson, K.; Horridge, M. Hands-On Computing with RunGTAP and WinGEM to Introduce GTAP and GEMPACK (GTAP Resource No. 1638). 2005. Available online: https://www.gtap.agecon.purdue.edu/resources/res_display.asp?RecordID=1638 (accessed on 10 July 2020).
- Horridge, J.M.; Jerie, M.; Mustakinov, D.; Schiffmann, F. GEMPACK Manual, GEMPACK Software. 2018. Available online: https://www.copsmodels.com/gpmanual.htm (accessed on 10 July 2020).
- Wickham, H. ggplot2: Elegant Graphics for Data Analysis; Springer: New York, NY, USA, 2016. [Google Scholar] [CrossRef]
- Schreyer, P.; Pilat, D. Measuring productivity. OECD Econ. Stud. 2001, 33, 127–170. [Google Scholar]
- Pegkas, P. The Effect of Government Debt and Other Determinants on Economic Growth: The Greek Experience. Economies 2018, 6, 10. [Google Scholar] [CrossRef]
- Doukas, H.; Nikas, A.; Stamtsis, G.; Tsipouridis, I. The Green Versus Green Trap and a Way Forward. Energies 2020, 13, 5473. [Google Scholar] [CrossRef]
- Forouli, A.; Nikas, A.; Van de Ven, D.J.; Sampedro, J.; Doukas, H. A multiple-uncertainty analysis framework for integrated assessment modelling of several sustainable development goals. Environ. Model. Softw. 2020, 131. [Google Scholar] [CrossRef]
- Haldane, A.; Turrell, A. Drawing on different disciplines: Macroeconomic agent-based models. J. Evol. Econ. 2019, 29, 39–66. [Google Scholar] [CrossRef]
- Nikas, A.; Stavrakas, V.; Arsenopoulos, A.; Doukas, H.; Antosiewicz, M.; Witajewski-Baltvilks, J.; Flamos, A. Barriers to and consequences of a solar-based energy transition in Greece. Environ. Innov. Soc. Transit. 2020, 35, 383–399. [Google Scholar] [CrossRef]
- European Union. 2030 Climate & Energy Framework: Greenhouse Gas Emissions—Raising the Ambition. 2020. Available online: https://ec.europa.eu/clima/policies/strategies/2030_en (accessed on 10 January 2020).
Publisher’s Note: MDPI stays neutral with regard to jurisdictional claims in published maps and institutional affiliations. |
© 2021 by the authors. Licensee MDPI, Basel, Switzerland. This article is an open access article distributed under the terms and conditions of the Creative Commons Attribution (CC BY) license (https://creativecommons.org/licenses/by/4.0/).