Article

Designing Control and Protection Systems with Regard to Integrated Functional Safety and Cybersecurity Aspects

Faculty of Electrical and Control Engineering, Gdańsk University of Technology, 80-233 Gdansk, Poland
*
Author to whom correspondence should be addressed.
Energies 2021, 14(8), 2227; https://doi.org/10.3390/en14082227
Submission received: 1 March 2021 / Revised: 8 April 2021 / Accepted: 14 April 2021 / Published: 16 April 2021

Abstract

:
This article addresses current problems of risk analysis and probabilistic modelling for functional safety management in the life cycle of safety-related systems. Two main stages in the lifecycle of these systems are distinguished, namely the design and operation. The risk analysis and probabilistic modelling differ in these stages in view of available knowledge and data. Due to the complexity and uncertainty involved, both qualitative and quantitative information can be useful in risk analysis and probabilistic modelling. Some methodological aspects of the functional safety assessment are outlined that include modelling of dependent failures or cybersecurity and verifying the safety integrity level (SIL) under uncertainty. It is illustrated how the assumptions in the process of risk analysis and probabilistic modelling influence results obtained and, therefore, potentially the decisions taken in functional safety management. Programmable control and safety systems play an important role in mitigating and controlling risks in the operation of hazardous installations. This paper presents ways to deal with safety hazards involving such systems to be considered in risk analysis and integrated functional safety and cybersecurity management.

1. Introduction

Emerging threats have significant potential to destructively impact the operation of technical systems, hazardous facilities, and critical infrastructure systems or networks. Therefore, the risks of major accidents with severe consequences that can happen in hazardous industrial plants have to be systematically assessed and properly managed across the entire life cycle [1,2,3]. Safety and security issues are two different groups of functional requirements for industrial systems. It is one of the main causes that the analyses of safety and cybersecurity should not be integrated directly. They should be integrated with one of the specified approaches Common Criteria approach, SecureSafety (SeSa) methodology, the Ring protection model, and ISO-IEC 62443 standard technology. The guidelines and specified information of this method are presented in publications [1,2]. This article presents one of the proposed approaches that consists of integrated analysis safety and security in probabilistic modelling in the safety integrity level verification process. This integrated methodology has limited application in information technology (IT) applications, but has a lot of opportunities in operational technologies (OT) application. The proposed integrated approach is useful in the engineering design process control as well as in protection systems. Of course, it can also be used in all life cycles of critical installations. It is clear that automation systems in process installations have integral systematic proof tests, and the most sophisticated construction of the safety control systems. These systems are the most vulnerable to cyber-attacks via an industrial computer network.
One of the main objectives of functional safety analysis is determining the required safety integrity level (SIL) for the safety-related functions to be realized by safety-related systems. According to IEC 61508, to each SIL (1 ÷ 4) the interval probabilistic quantitative criterion is defined. Functional safety analysis procedure usually does not include security aspects. In the case of a distributed control and protection system, it can have practical significance, and may affect the results of determination as well as verifying SIL, taking into account functional safety analysis [1,2].
An important part of the safety and security management system is the functional safety and security sub-system. Its purpose is to reduce some risks using safety-related technology of the programmable control and protection systems, such as electric/electronic/programmable electronic (E/E/PE) systems [4] or safety instrumented systems (SISs) [5]. These systems are applied for implementing defined safety-related functions (SRF) and are characterized by appropriate configuration/architecture to fulfil relevant safety integrity requirements.
If the layers of protection in a hazardous plant have to be applied due to high risk, then the layer of protection analysis (LOPA) is of interest [6,7]. In such a plant, an alarm system (AS) should be properly designed to include a relevant human-system interface. An important issue is to design a safety-related decision support system. This article addresses some methodological issues of the functional safety and security analysis and management in hazardous plants, as well as those in which the layer of protection according to defense in depths (DinD) concept is applied in industrial installation [5]. Cybersecurity factors contribute positively to maintaining the high reliability and productivity of industrial plants [8,9]. If these factors are not properly considered and shaped in practice, they can influence the system negatively, either before or during abnormal situations and potential accidents [1].
We emphasize that the functional safety and cybersecurity management in a life cycle should be treated as a complex interdisciplinary problem with a number of coordinated tasks requiring integration of relevant knowledge and data from various sources using suitable and effective methods with regard to uncertainty issues [8,10]. Some important areas of functional safety analysis and management are identified that require additional research effort to develop more integrated methods and tools (next-generation) that would support functional safety analysts, designers, and users of functional safety technology in a more compatible way [11,12]. The results of this effort would be valuable for functional safety specialists [13], who face methodological difficulties, such as designers or operators in the industry [14,15,16].

2. Issues of Determining the Required Safety Integrity Level of Safety Functions

2.1. Functional Safety Requirements

The SIL of given safety-related functions (SRF) is presented by numbers 1 to 4 and is bound to the needed risk reduction when the SRF is implemented in regard to IEC standards [1]. The assignment of safety requirements to protection function using the E/E/PE, and other technologies (Figure 1) [4,17].
For safety functions implemented using the safety-related system two types of interval probabilistic criteria are defined in the IEC 61508 standard given (Table 1) for two modes of operation [4,5]:
  • the probability of failure (average) PFDavg for the safety function system operating on demand; or
  • the frequency (probability of a dangerous failure per hour) PFH.
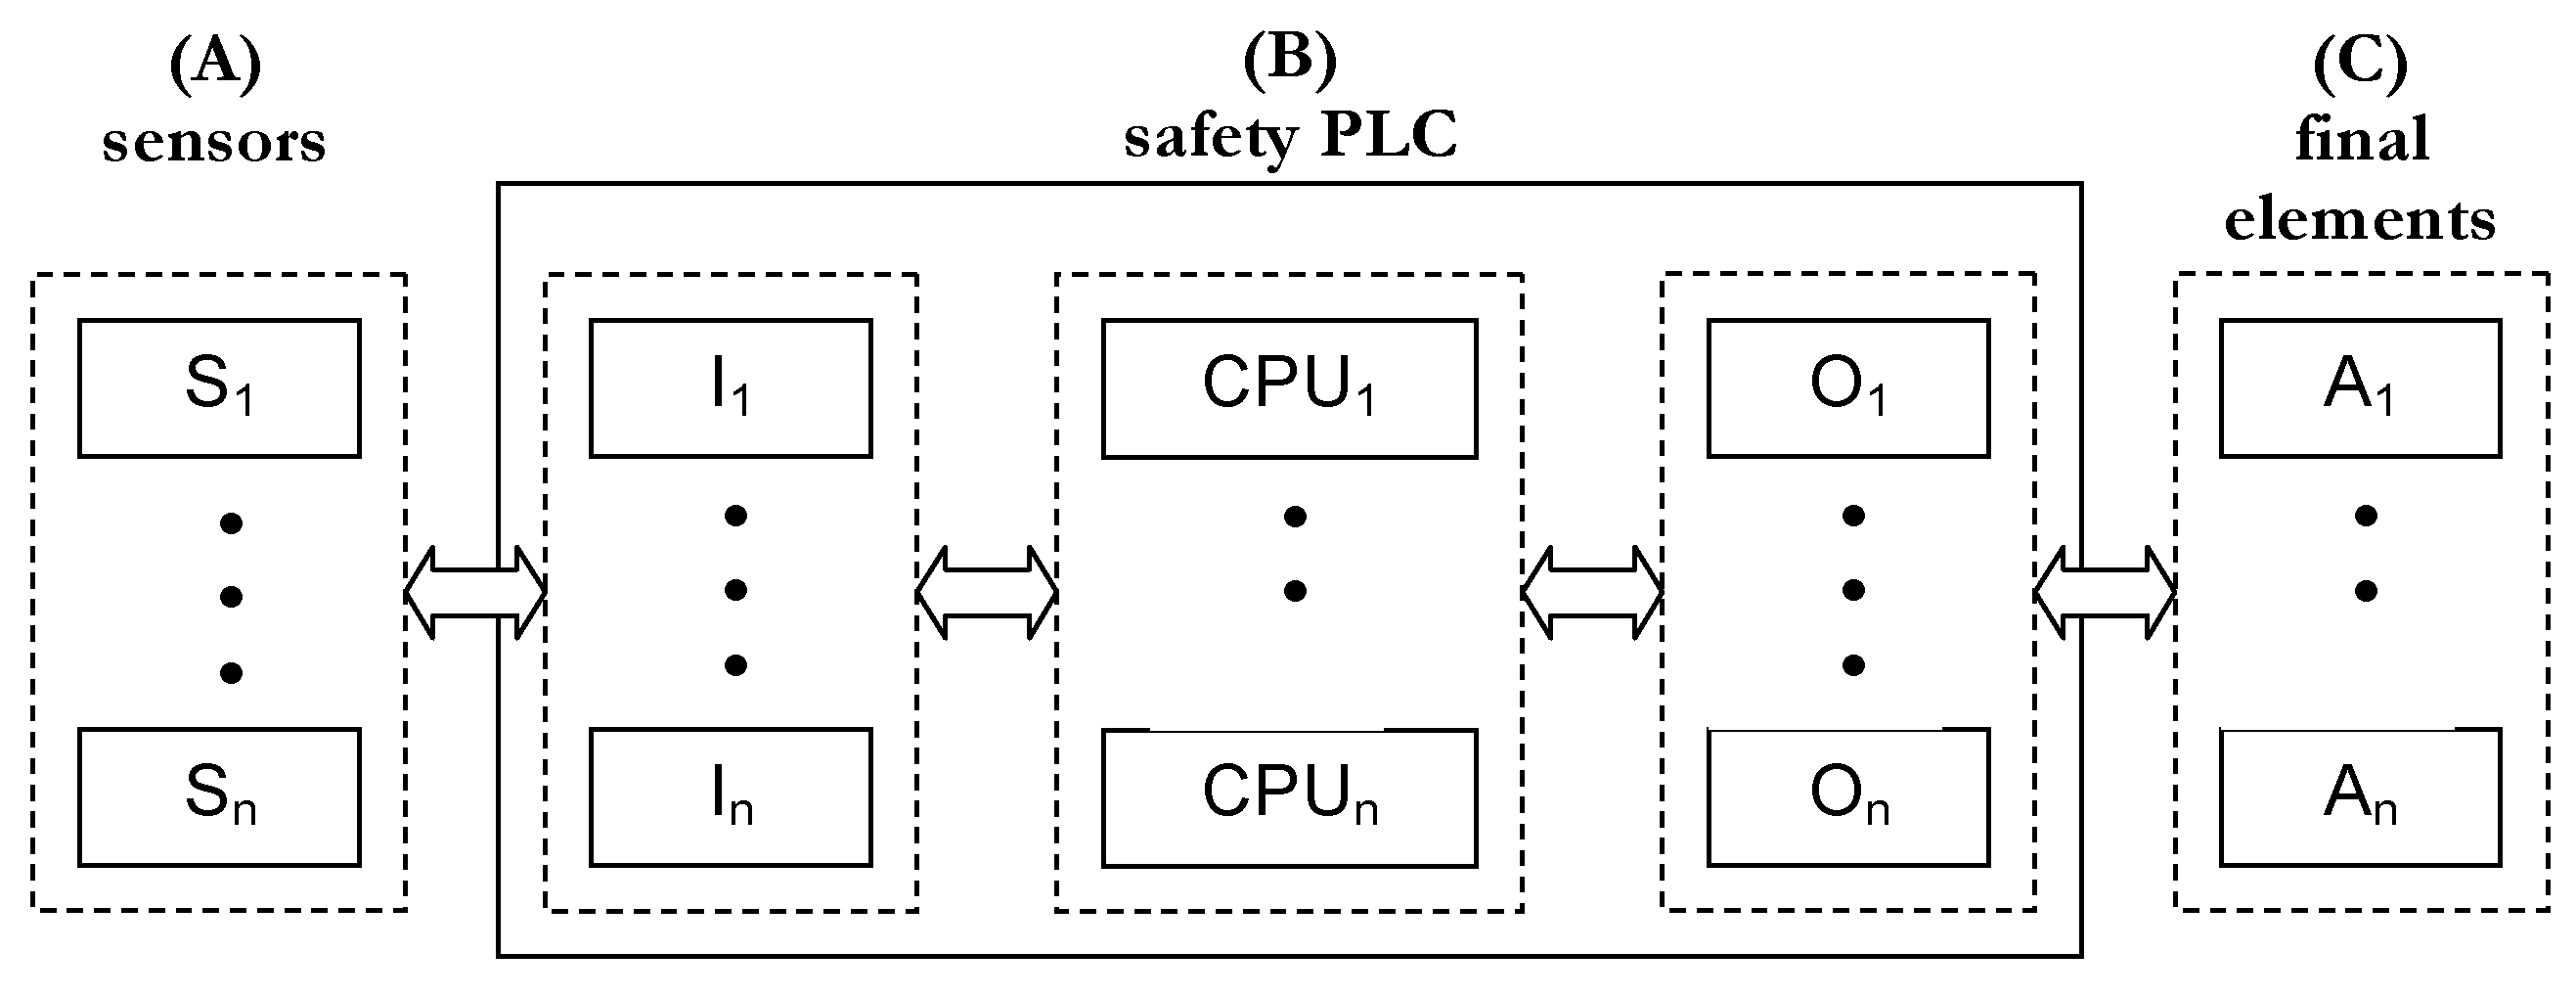
The typical configuration of a safety system (Figure 2) that consists of three subsystems, generally of koon configuration: (A) sensors, (B) safety PLC (Programmable Logic Controller), and (C) final elements.
The risk of potential hazardous events can be rationally reduced in the context of evaluated categories of the frequency of unwanted occurrence (W) and consequences (N) (Table 2) [4]. The total probability of safety system failure for the case considered has to be reduced to the value shown on the right side of the arrow ↓ (to obtain reduced frequency (F) of given category from a to d). As shown, the required SIL level of the defined safety function to be implemented depends on the possibility of failing to avoid a hazardous event using other safety measures (x, y, or z as described below Table 2) [17]. In cases denoted as b a single SIS is not enough, and an additional protection layer has to be designed.
The risk matrix defined (Table 2) can be modified, e.g., to take into account some societal values and an aversion to major accidents with serious consequences. It would change SIL requirements to be assigned to the E/E/PE or SIS (increased SIL—high consequences), or the necessity to design an additional safety layer.
To fulfil requirements of a higher SIL (3 or 4) assigned to the safety function the appropriate configuration of the E/E/EP system or SIS is to be designed, e.g., 1oo2, 2oo3, or 2oo4.

2.2. Cybersecurity Approach

In cybersecurity there are two main approaches: Evaluation Assurance Level (EAL) and Security Assurance Level (SAL). Evaluation Assurance Level (EAL) based on Common Criteria standard [18], with EAL1 the minimal requirements to EAL7 high requirements. Each Evaluation Assurance Level can be described as: EAL1- functionally tested; EAL2—structurally tested; EAL3—methodically tested and checked; EAL4—methodically tested, designed and reviewed; EAL5—semi-formally designed and tested; EAL6—semi-formally verified design and tested; EAL7—formally verified design and tested [18].
Another approach to cybersecurity evaluation for industrial control systems (ICS) is IEC 62443 [3]. A definition of Security Assurance Level (SAL) has been introduced in this standard. There are four security levels (SAL1 to 4) and they are assessed for a given security zone using a set of 7 functional requirements (Table 3).
The SAL is a cybersecurity measure concerning industrial control systems ICS. It is evaluated on a defined vector of seven requirements for a relevant cybersecurity zone [3]:
S A L = { A C ,   U C ,   D I ,   D C ,   R D F ,   T R E ,   R A }
where: AC—identification control, UC—use control, DI—data integrity DC—data confidentiality, RDF—restricted data flow, TRE—timely response, RA—resource availability.
Results of a cybersecurity analysis of a given industrial control system can be divided into some general categories, for example, a qualitative description with defined cybersecurity levels such as: low, medium, or high-level of cybersecurity [9]. The EAL [18] or SAL [3] determined for a given solution is taken into account during the functional safety analysis (Table 4) [9].
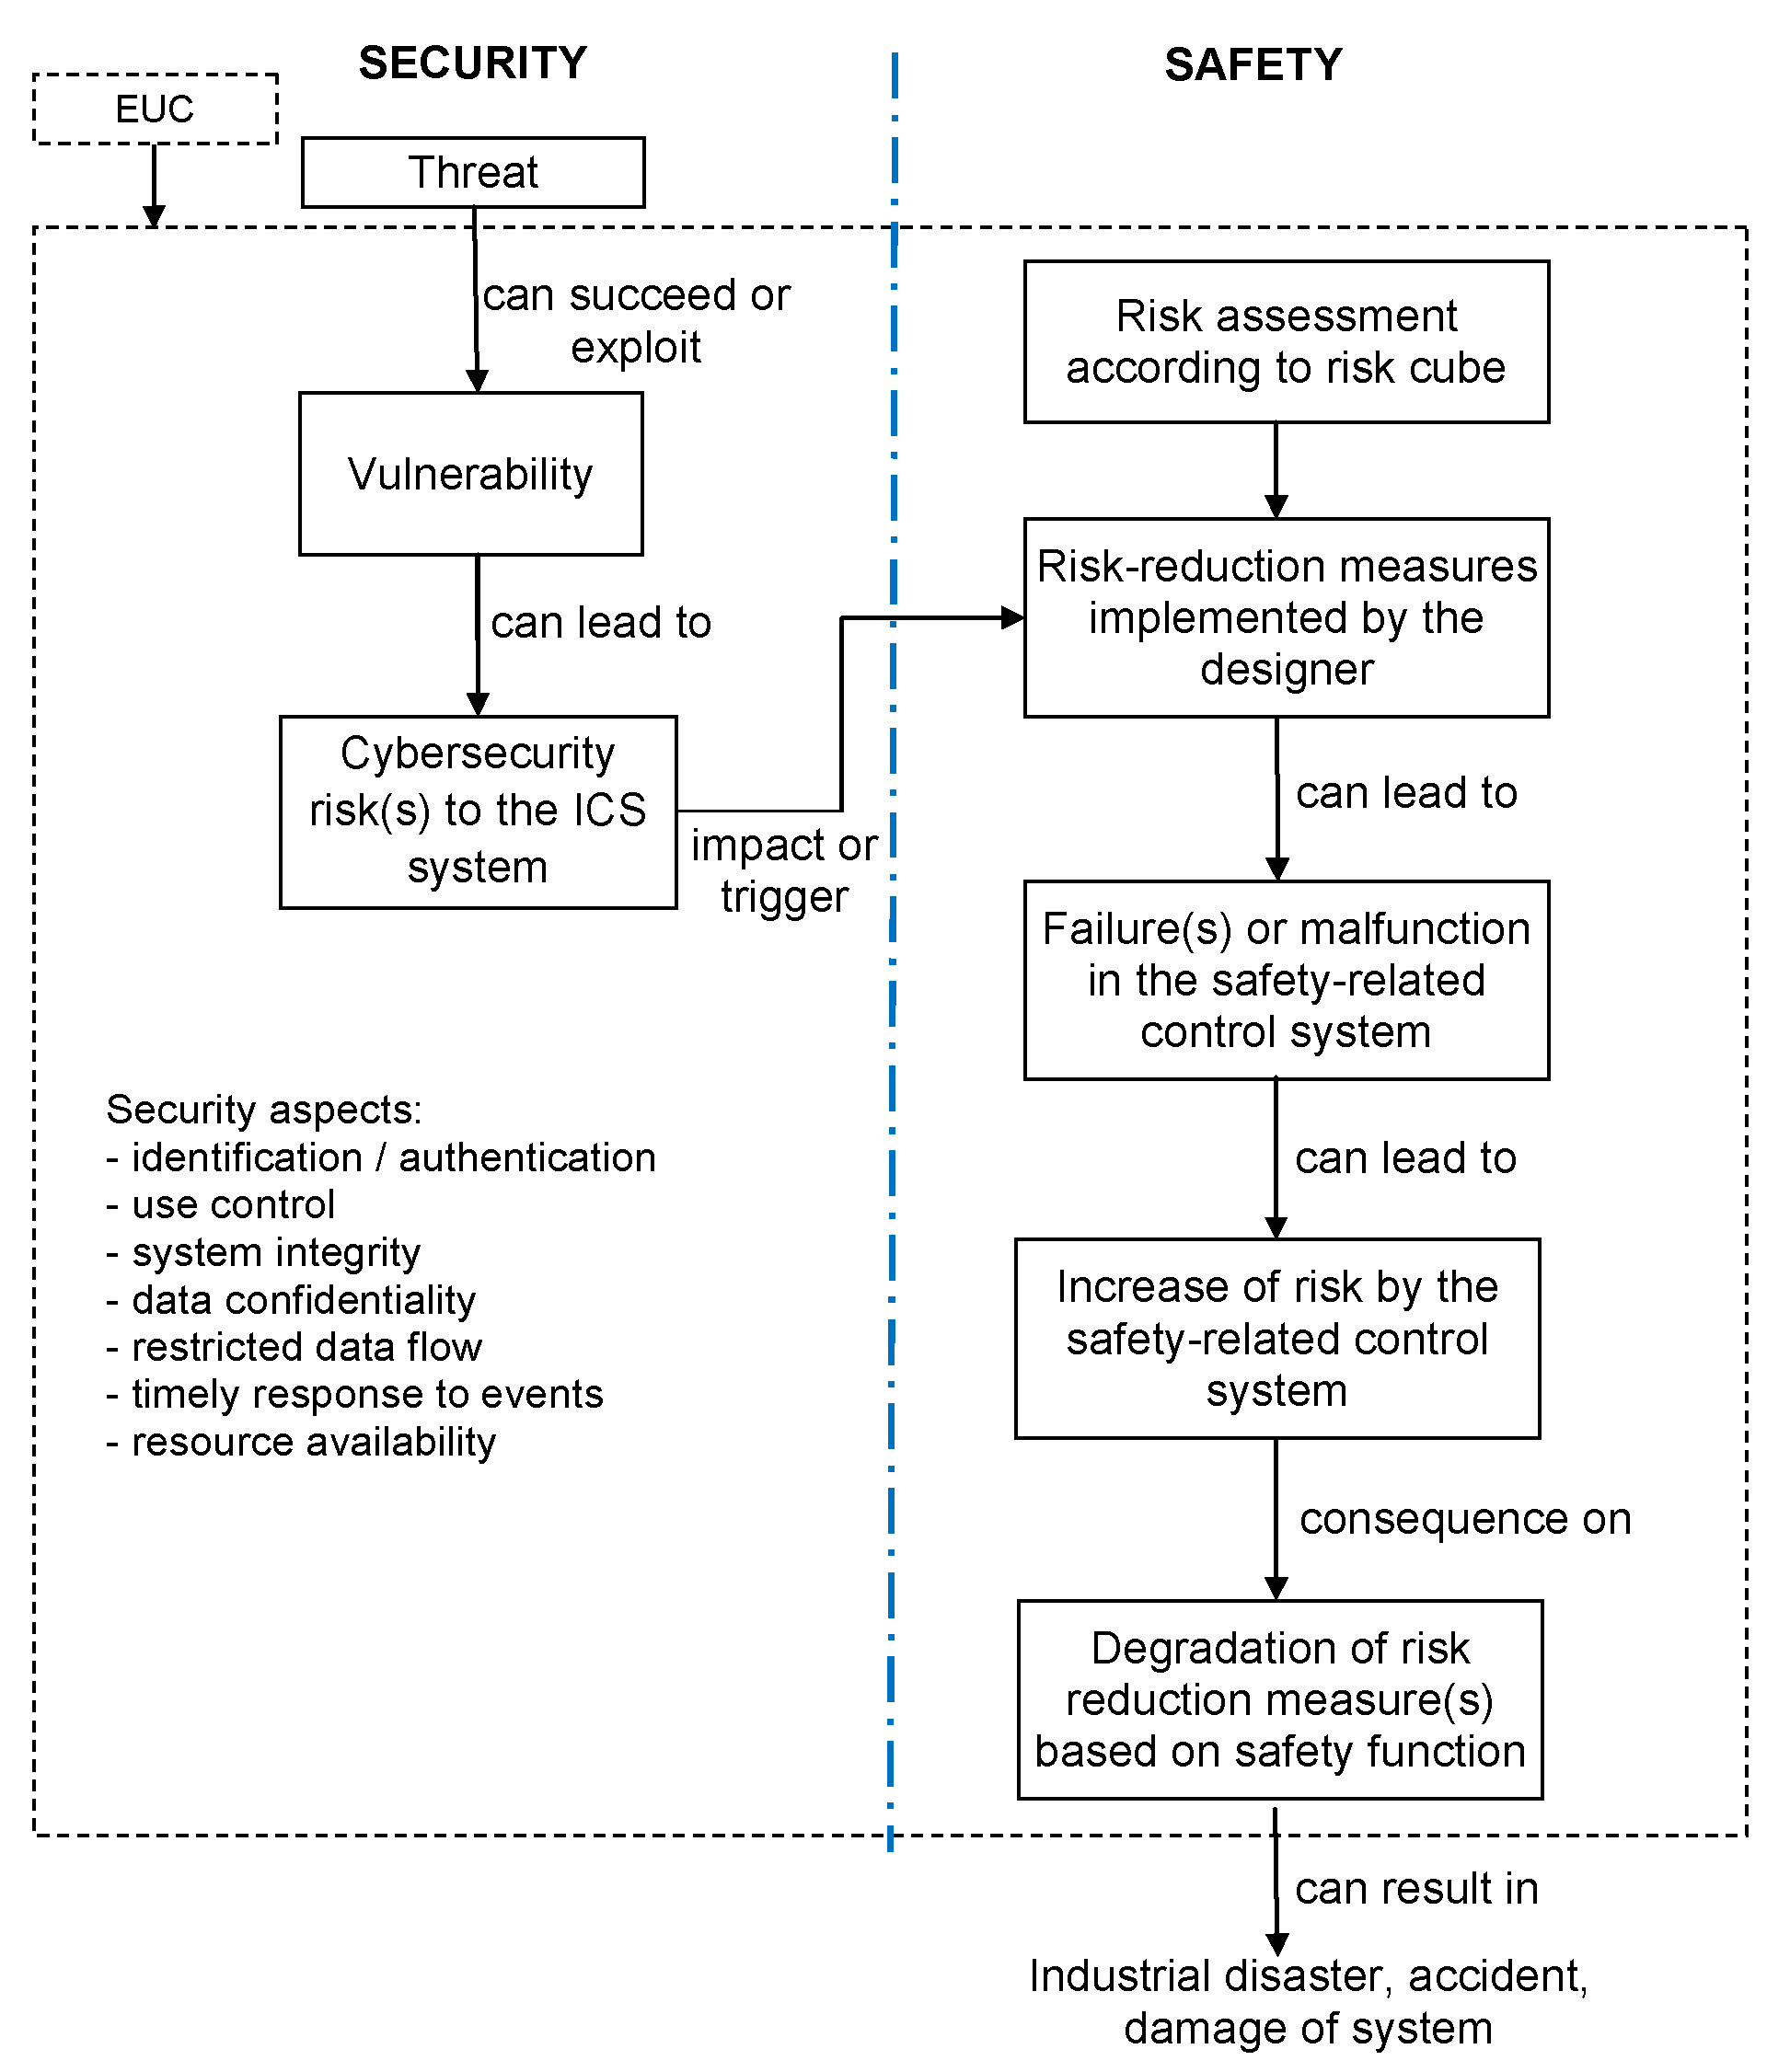
Due to the nature of threats and known vulnerabilities the security risk assessment shall be event-driven or under periodic cybersecurity review [19]. The possible effects of a security risk(s) (Figure 3) in this context to a safety-related control system [19,20].
The safety risk assessment should be made in advance of any cybersecurity risk considerations [19]. The results: inherently safe design measures and safeguarding and risk reduction measures of a machine should then be analyzed regarding possible vulnerabilities against cyber-attacks (threats). The following are guidelines for the step-by-step approach to limit or restrict IT security threats and vulnerabilities [19,20].
Requirements concerning cybersecurity-related aspects will be considered regarding the requirements of a series of international standards, IEC 62443 [3], IEC, 63074 [20], ISO/IEC 15408 [18], ISO/IEC 27000 [21], ISO/IEC 27001 [22] and ISO/IEC 27005 [23]. In general, a security risk assessment is based on a product/system in its environment to which threats and known vulnerabilities are applied [24]. This activity aims to define relevant (counter) measures to fulfil the overall security objectives [24,25,26,27].
Some of the risk factors to be taken into account when carrying out this type of analysis have an impact on the estimated value of the frequency or likelihood of some of the consequences [28]. The risk is defined as:
R = F × C
where the frequency F of occurrence of some scenario associated with certain consequences C is dependent on several factors, including the reliability of technical solutions used in the analyzed system [9].
Analyzing such a system in terms of cybersecurity can result in detecting the existence of certain vulnerabilities, which may increase the risks associated with the overall system. In most cases, this will result in increasing the frequency of occurrence of a certain scenario, therefore, assuming that the consequences are C = const. Then, it can be said that:
F R V
The system vulnerability can be measurable and expressed by the level of security, taking into account the countermeasures introduced to the system which may mitigate these vulnerabilities [11,27]. Considering the stage of identifying hazards in the system, which is a very important part of defining the required safety-related functions, there is a need for determining the possible causes, consequences, and frequency of occurrence for every described hazard or scenario [29].

2.3. The Risk Cube Methodology

The vulnerability of a system can be measurable and expressed through the level of information protection taking into account the countermeasures put in place to mitigate this vulnerability [1,30].
The risk of human, environmental and economic losses in the functional safety analysis is determined by taking into account the identified environmental hazards and technical disturbances (internal disturbances caused by human errors or external disturbances from the industrial installation).
In a broader perspective, the complementary analysis of information security should take into account threats related to the unfriendly intentions of intruders located inside or outside a given facility, as well as possible terrorist activities under certain conditions [1,2]. The risk measure Rij in the annual period and for the i-th threat and the j-defined emergency scenario in the considered facility/system is proposed to be determined in accordance with the formula:
R i j = f i V i j C i j
where: fi—frequency of occurrence of the i-th hazard situation (an event initiating an abnormal emergency situation) due to the intentional action; Vij—the vulnerability of a given object, expressed by the conditional probability that the i-th level of effects, emergency for this hazard situation, will occur; Cij—a measure of the consequences (e.g., human, environmental or economic losses) resulting from the emergency event under consideration; economic risk has a monetary unit value per year.
The vulnerability can be reduced by using appropriate technical (security rings, security technologies) and organisational solutions (e.g., training programs, procedures in the security management system). The risk is similarly defined in the context of functional safety:
R k j = f k P F D k j C k j
where: fk—the frequency of k-th risk situation due to internal or external interference; PFDkj—the probability of failure to perform the safety-related function on demand for the system of the j-th level of effect; PFDkj is determined based on models in reference to the requirements of the general standard IEC 61508 or sector standard IEC 61511.
Based on (4) and (5), assuming the additionality of the risk measures, the measure of aggregate risk associated with j-th level of effect can be estimated from the relationship:
R j = i R i j + k R k j
The determined risk measures can be used in the analysis of costs and effects of the proposed solutions of security systems, including layers of protection and ring ones, for functional safety and information security solutions, respectively. The practical importance, but also the challenge of developing new methods of risk analysis and assessment for the integrated functional safety and information security management of computer control and protection systems in conditions of usually high uncertainty should be stressed [9,31].
Table 5 contains a risk matrix on specific issues related to industrial network cybersecurity and its impact on the operation of the critical infrastructure system. The risk degree of Rcs (cs—cybersecurity) in a given case is related to the security assurance level SAL.
Table 6 presents a risk matrix regarding information security issues in the critical infrastructure facility [2]. The degree of risk Rsec (low, medium, high, or very high) in a given case is related to the evaluation assurance level EAL.
The next table (Table 7) presents the risk matrix regarding functional safety issues. The degree of risk Rfs (fs—functional safety) in a given case is referenced in safety integrity level SIL.
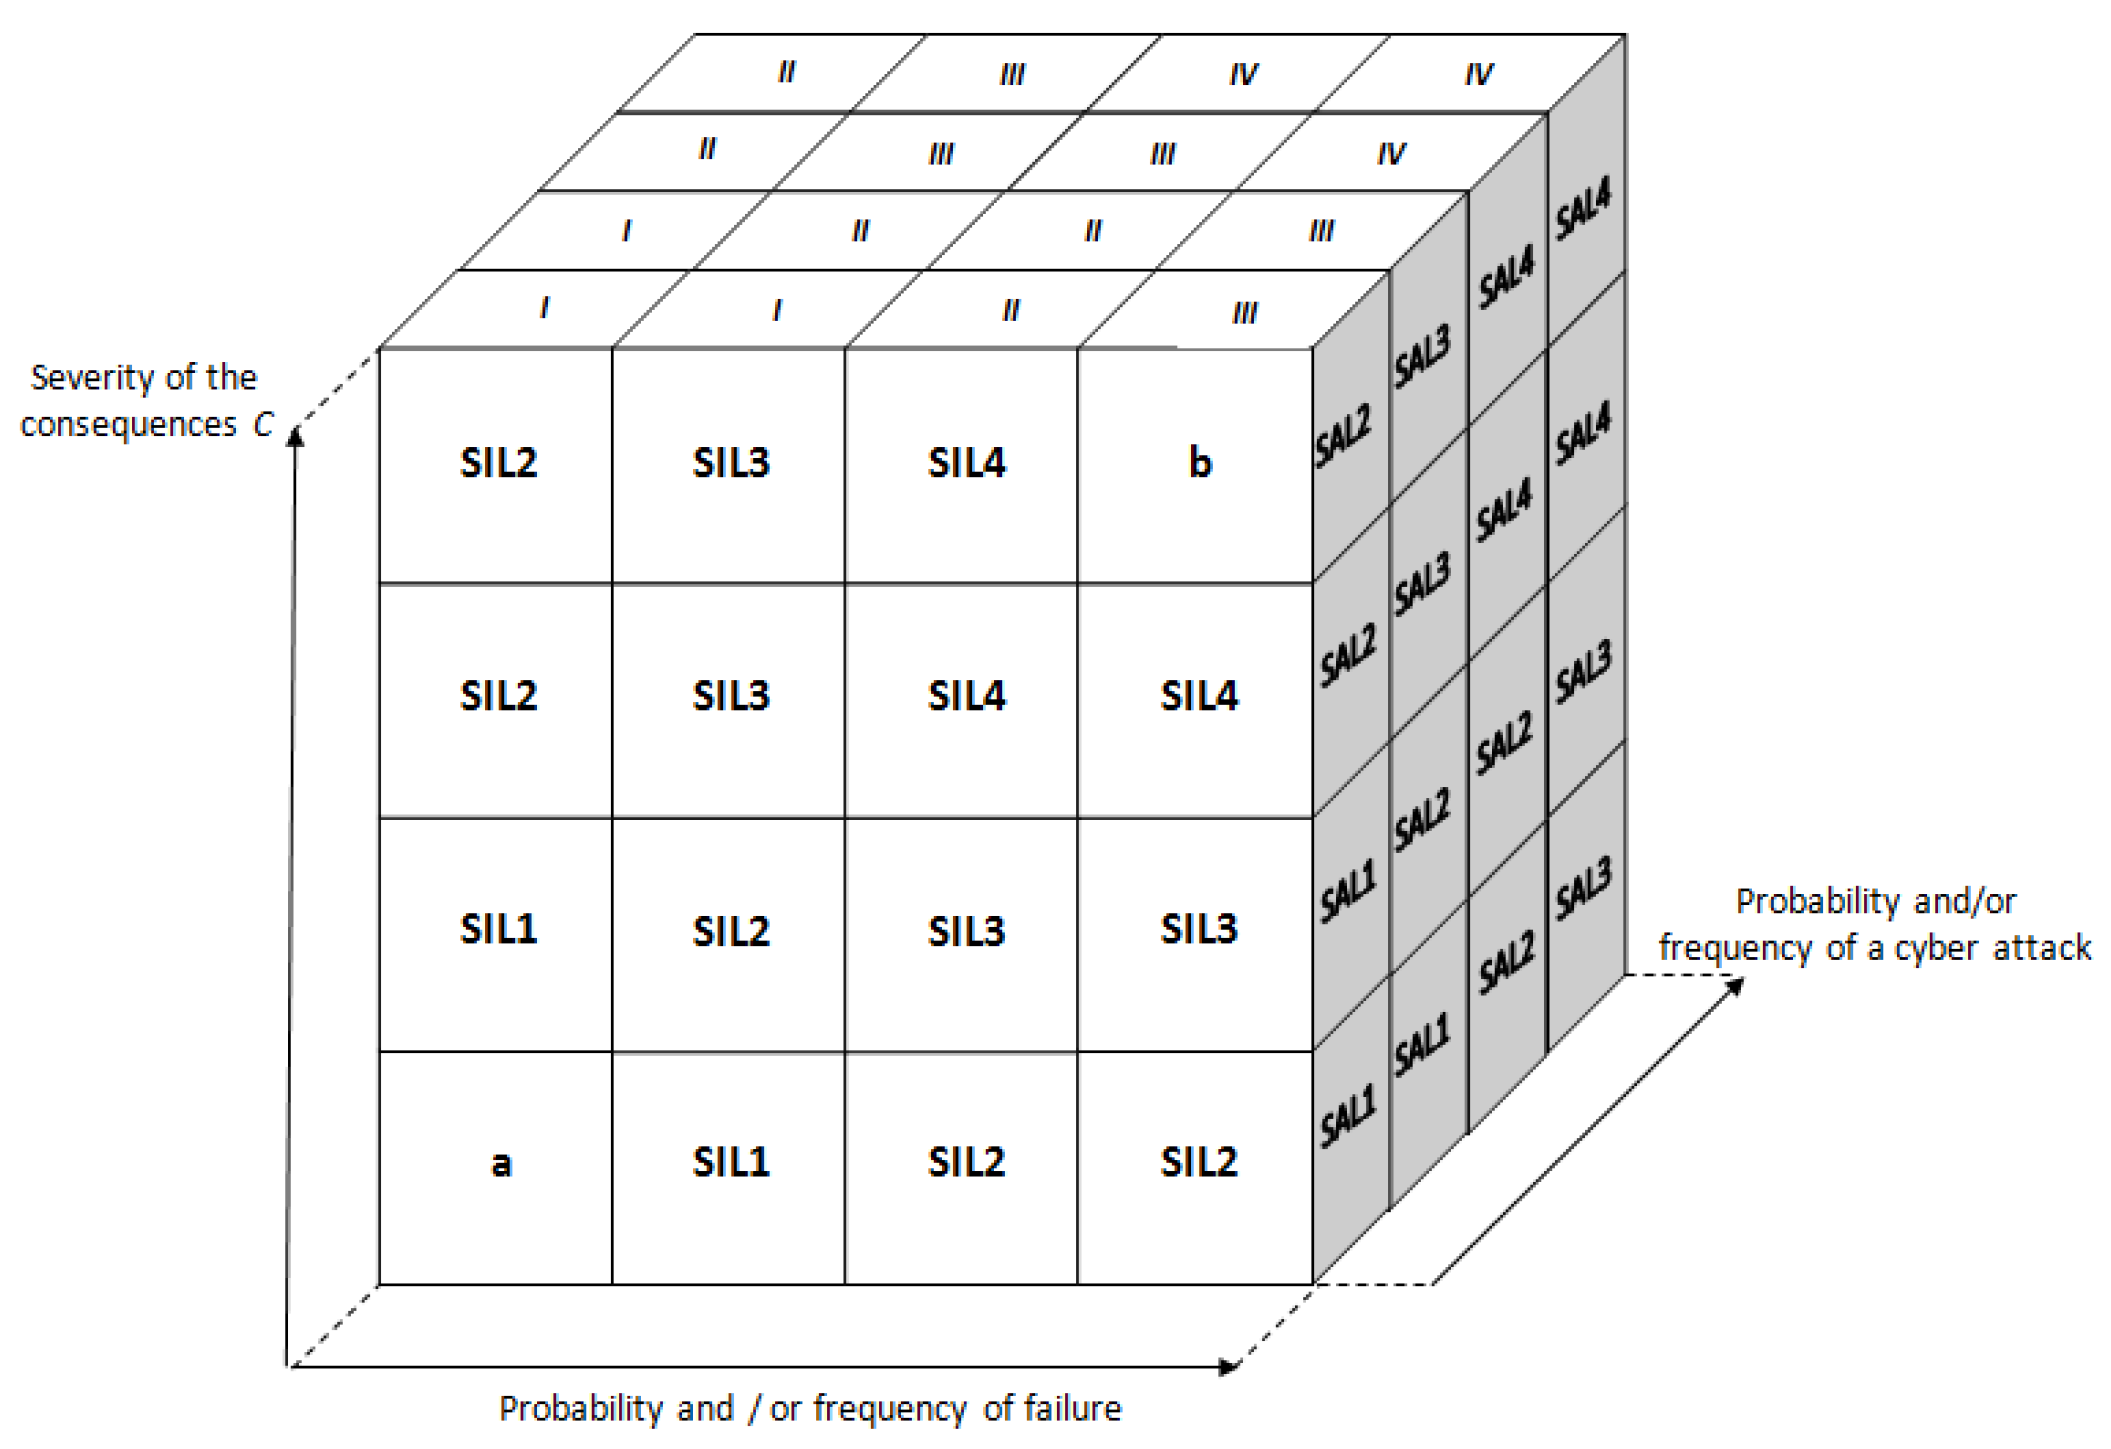
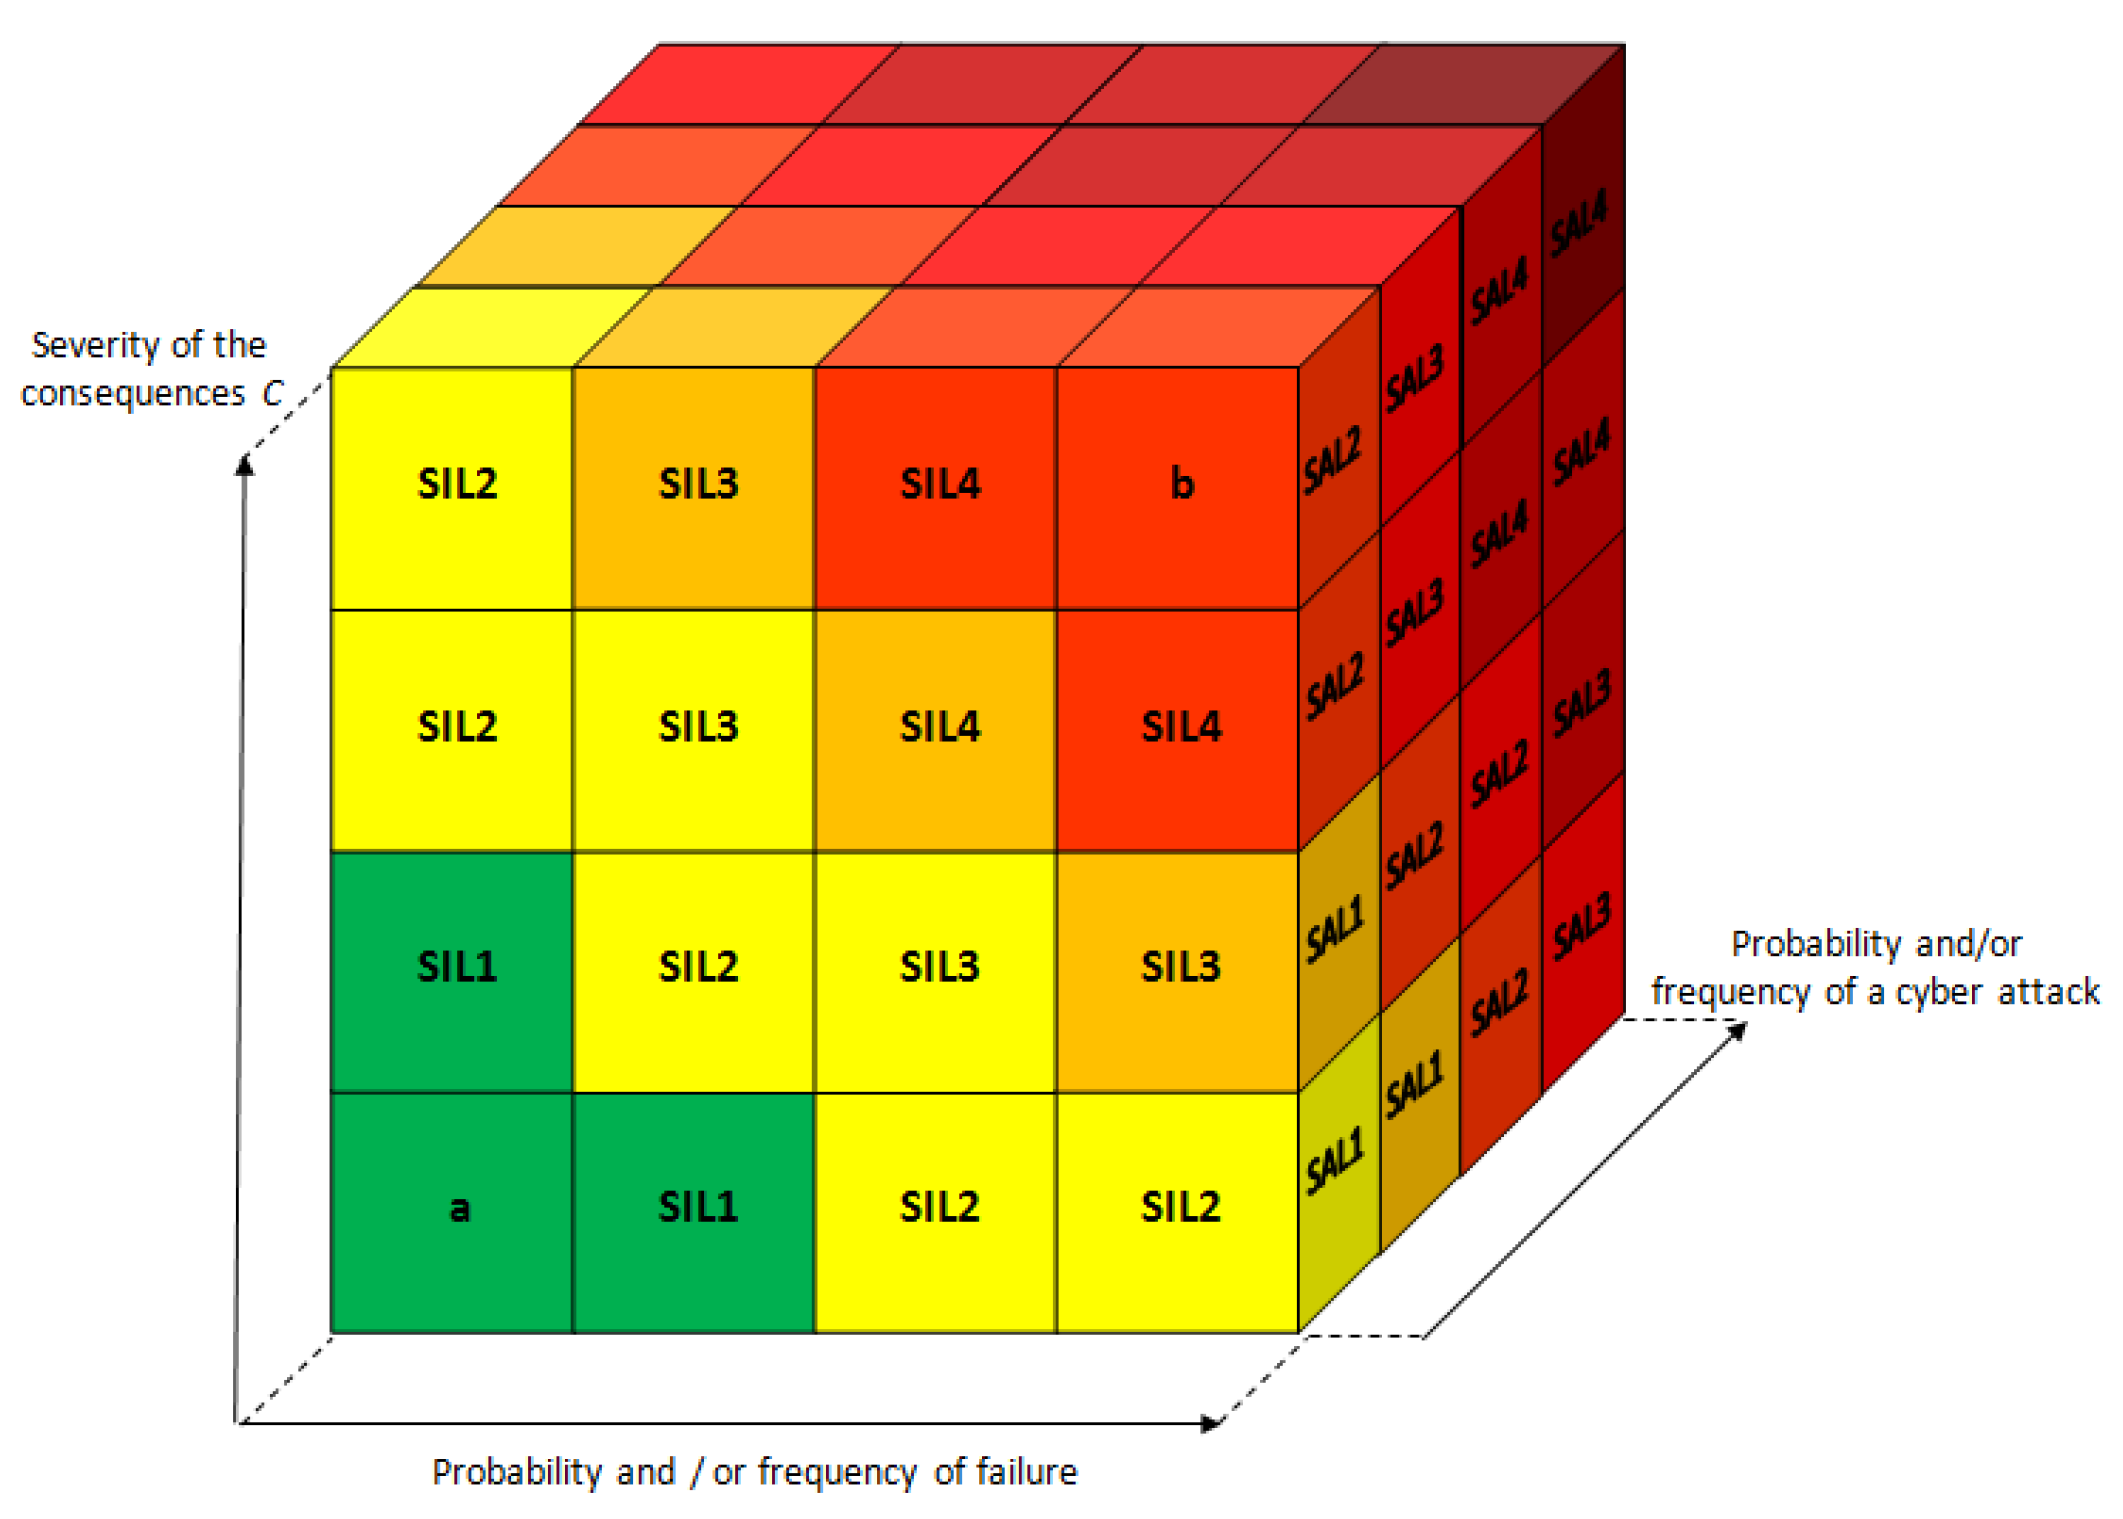
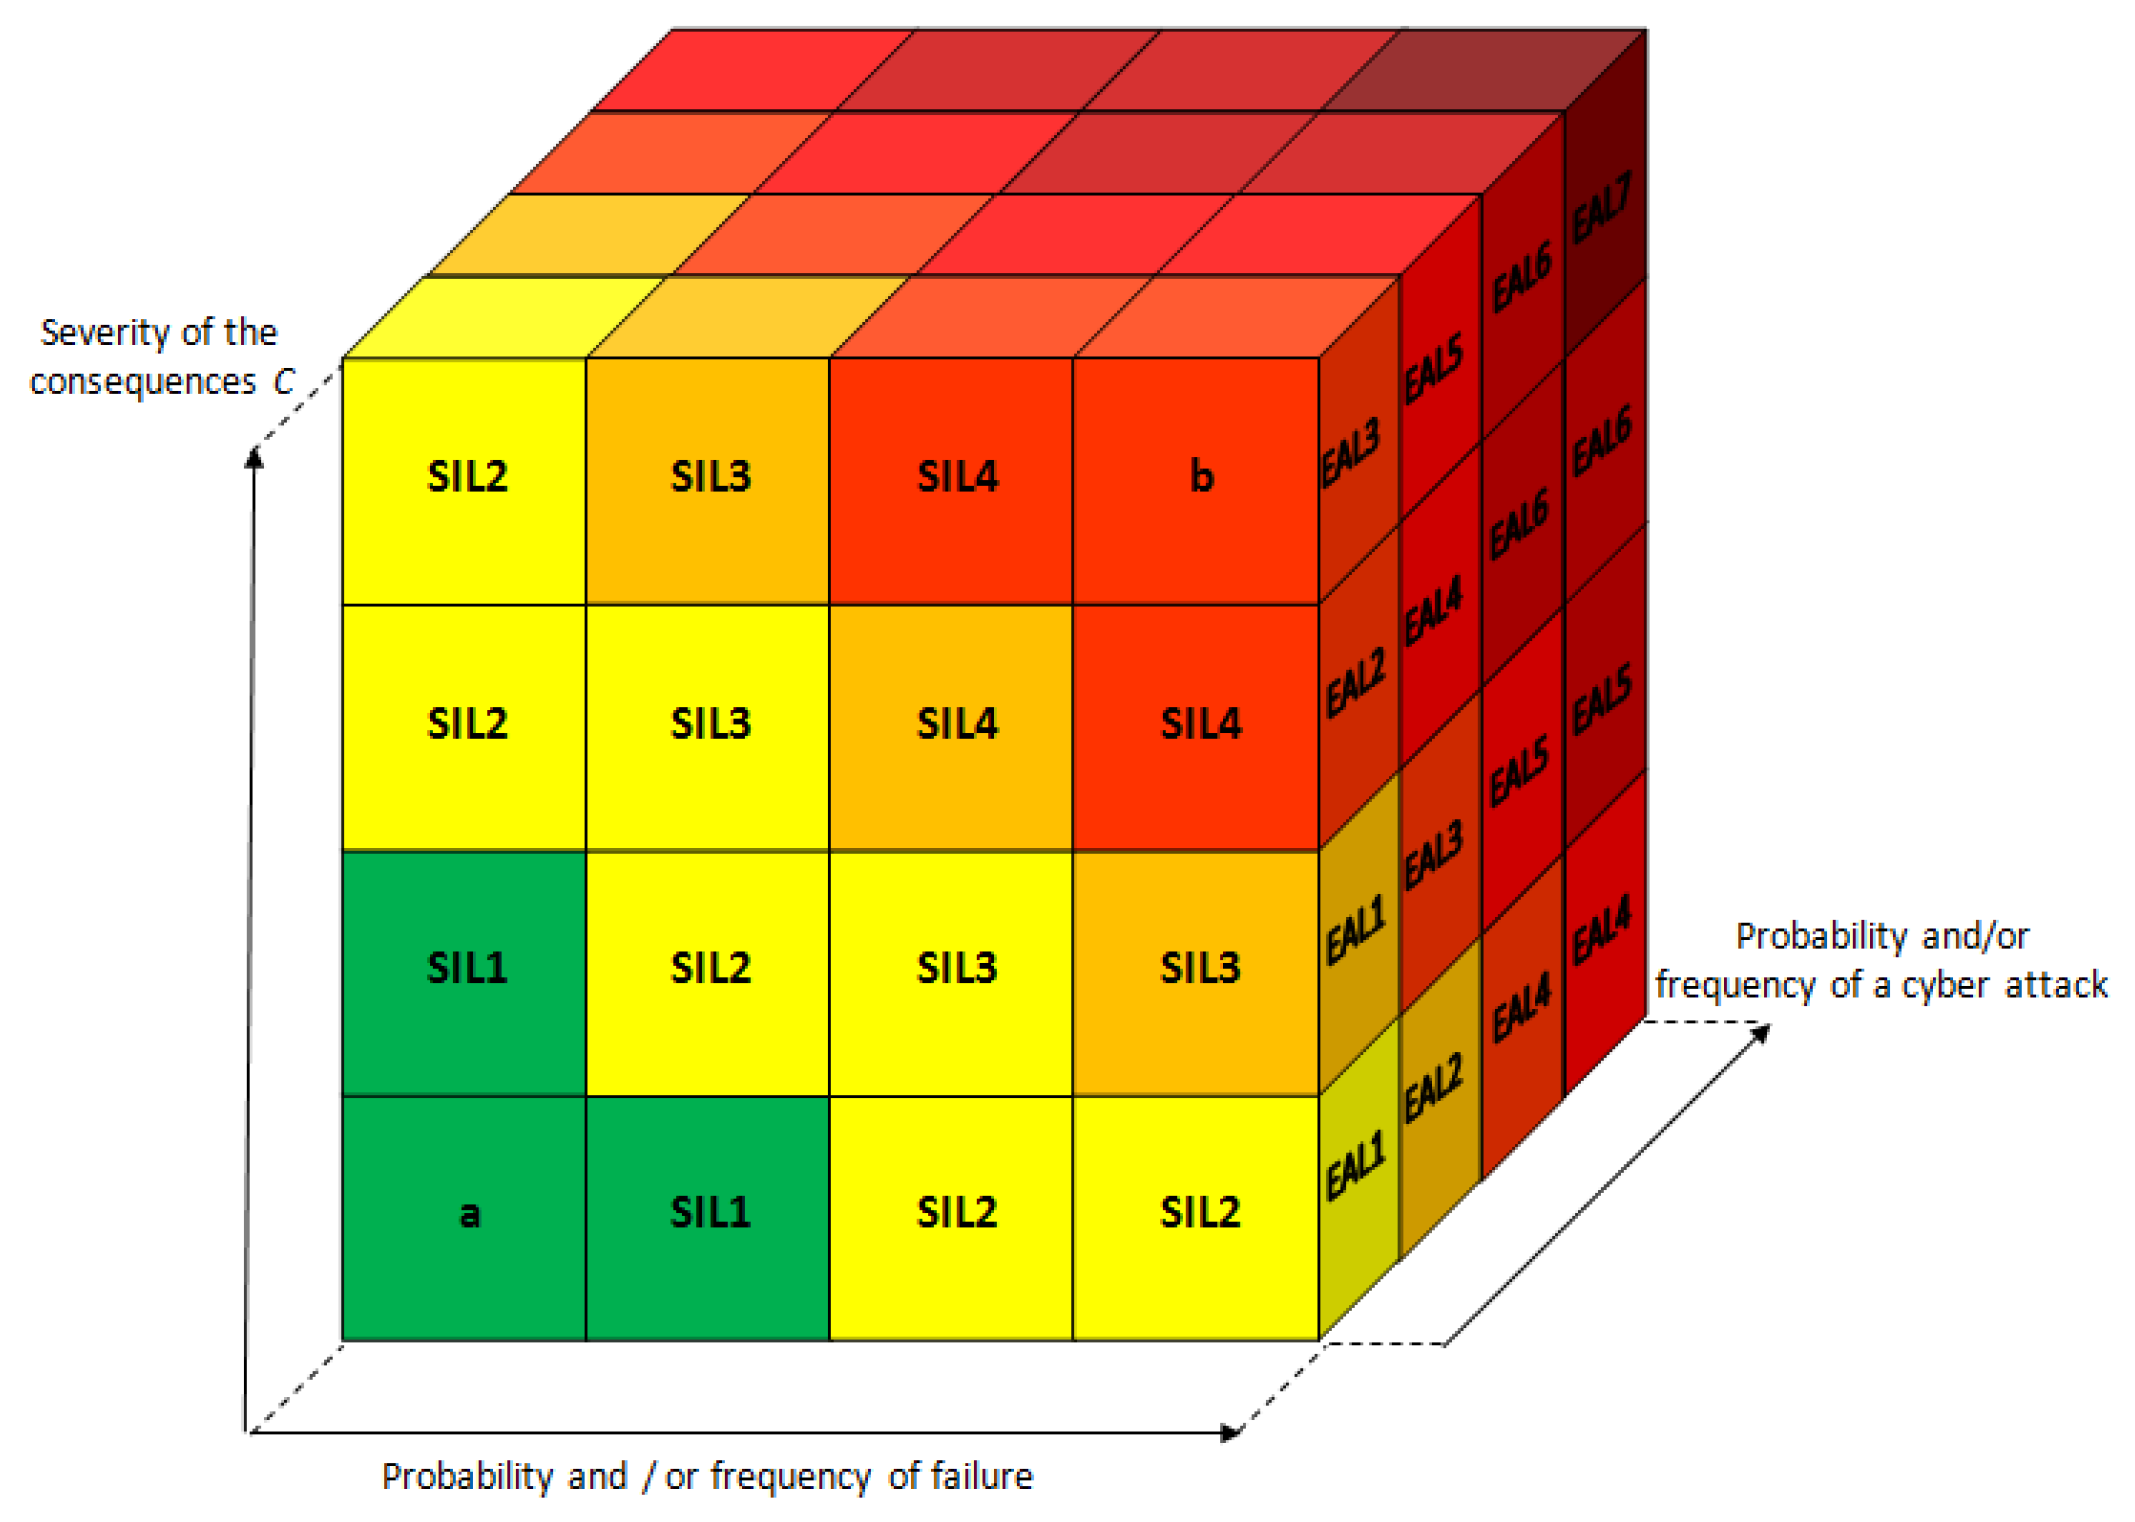
Assuming that the criticality of consequences for functional safety and cybersecurity impacts are the same Cfs = Ccs = C, the integration can be presented as a Risk Cube.
The proposed integration of functional safety and cybersecurity issues at the risk analysis stage (Figure 4 and Figure 5).
In this case:
R = R fs + R cs = = C fs P fs ( o r   F fs ) + C cs P cs ( o r   F cs ) = = C P ( o r   F )
Assuming that Cfs = Ccs = C:
R = C ( P fs ( o r   F fs ) + P cs ( o r   F cs ) )
where: R—risk; Rfs—risk related to functional safety aspects; Rcs—risk related to cyber threats; C—criticality of effects; Cfs—criticality of consequences related to functional safety aspects; Ccs—criticality of consequences related to cyber threats; Pfs—the probability of failure; Pcs—the probability of a cyber-attack; Ffs—frequency of failure; Fcs—frequency of a cyber-attack.
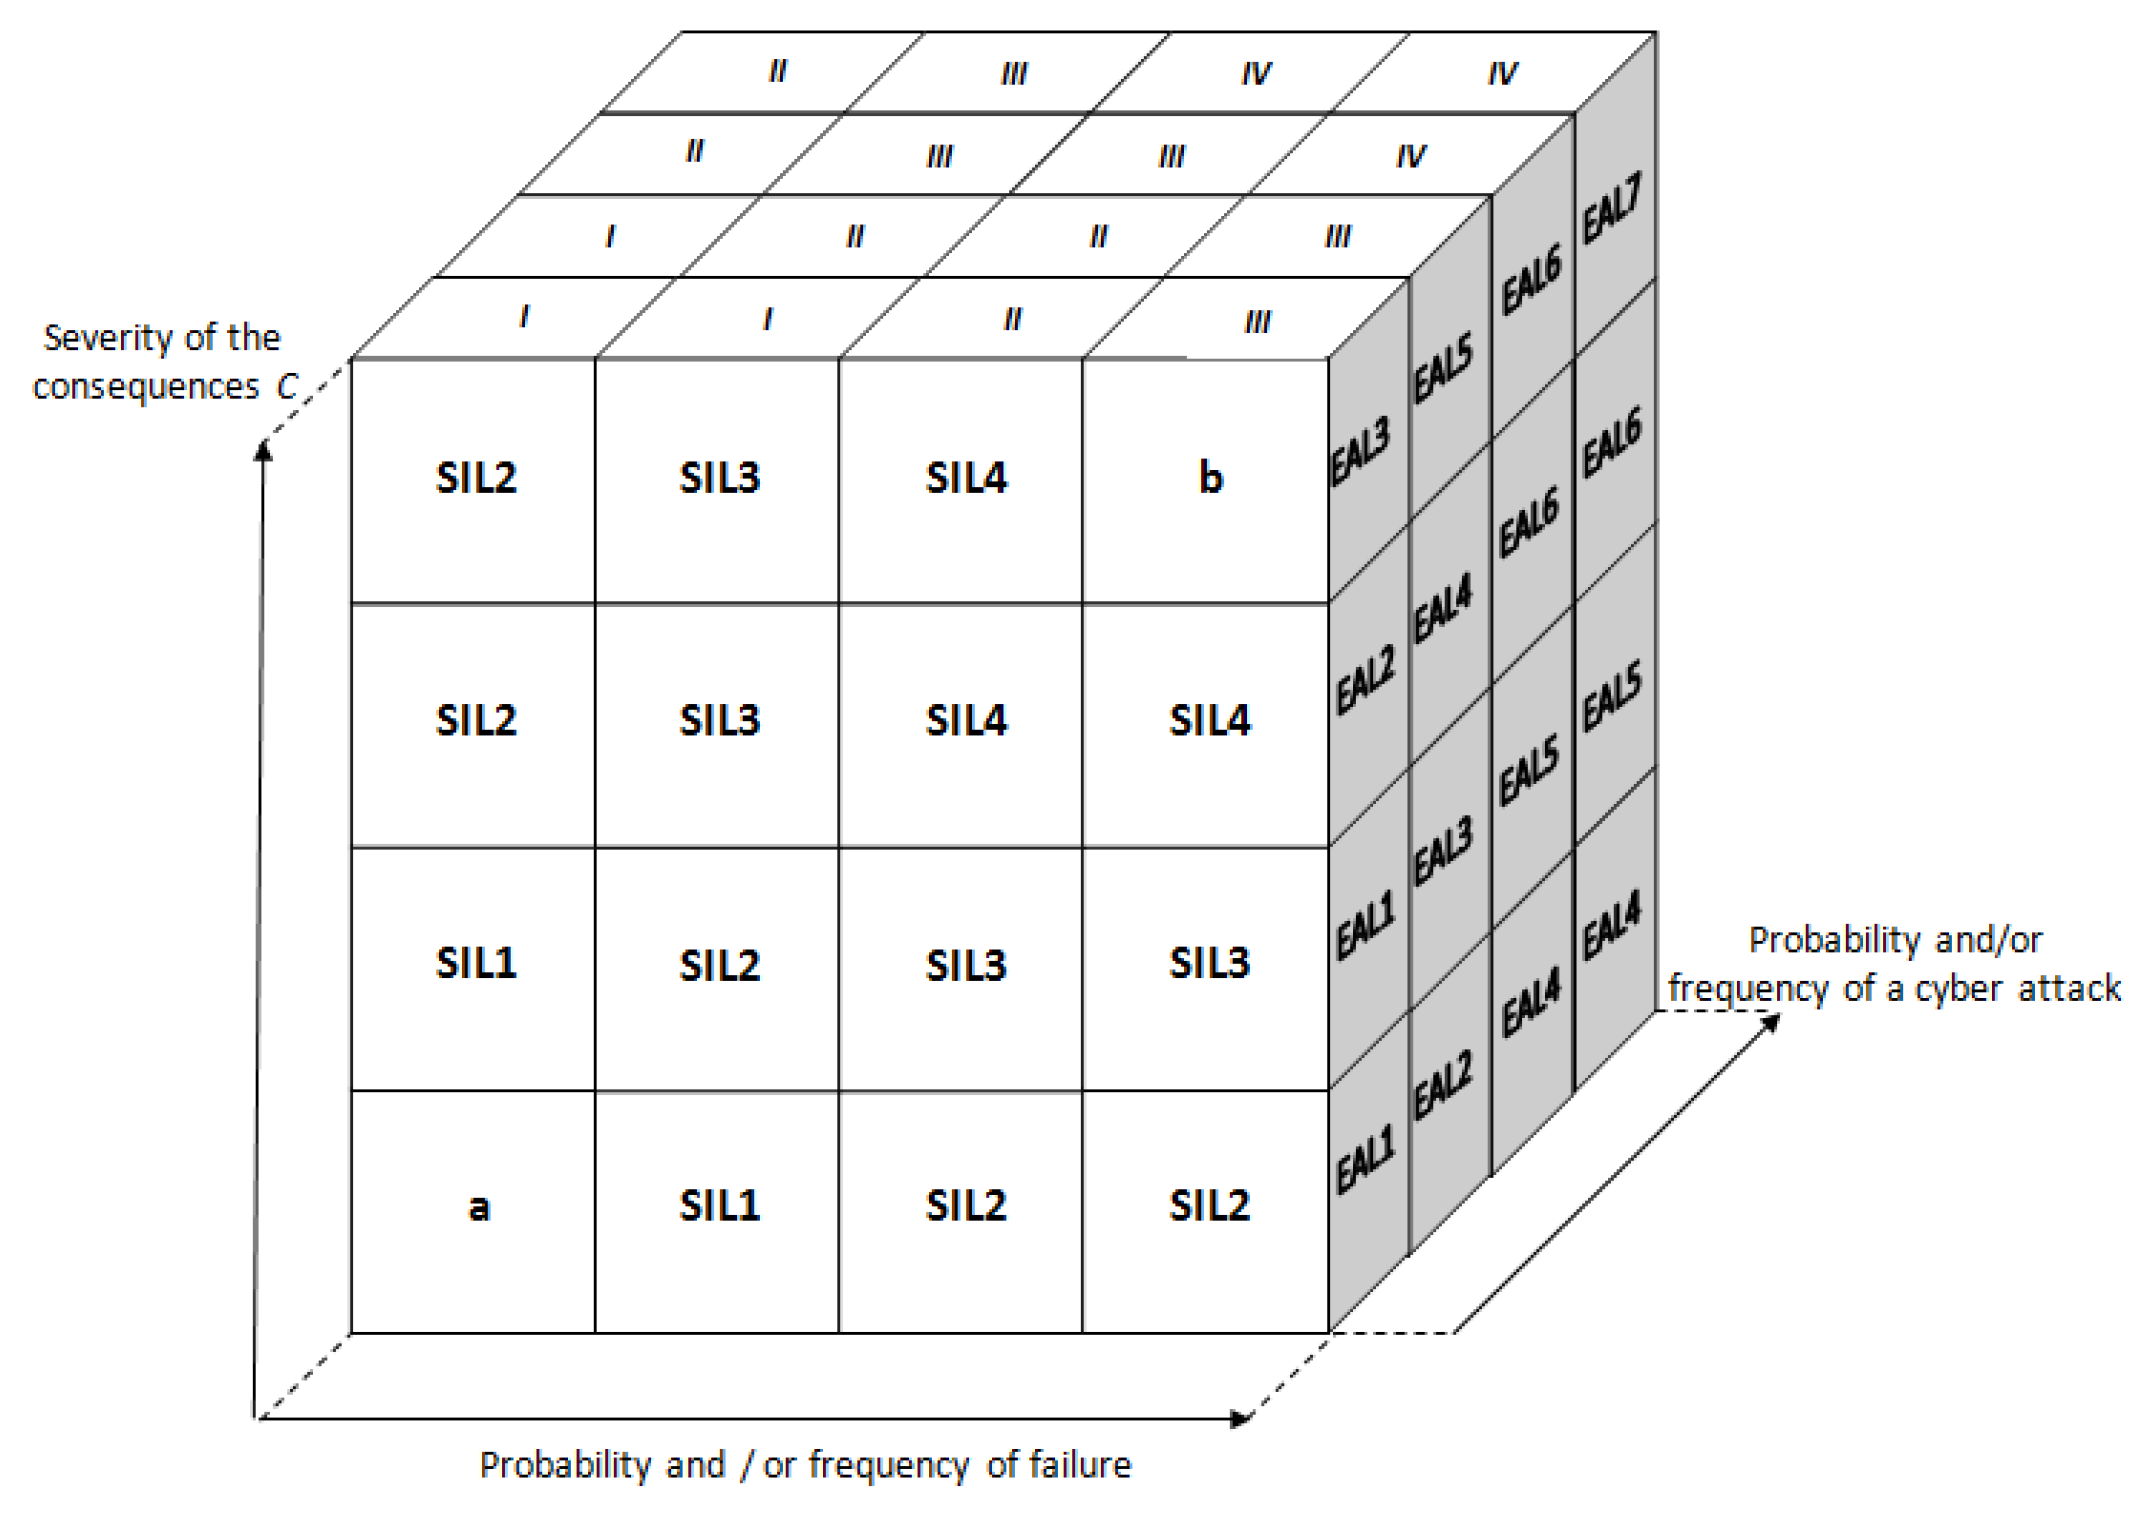
As above, functional safety and information security issues (expressed through the evaluation assurance level EAL) are integrated. Assuming that the criticality of consequences for functional safety and information security are the same Cfs = Csec = C, the integrated approach is presented in Figure 6 and Figure 7 (Risk Cube (SIL-EAL)).
In this case:
R = R fs + R sec = = C fs P fs ( o r   F fs ) + C sec P sec ( o r   F sec ) = = C P ( o r   F )
Assuming that Cfs = Csec = C:
R = C ( P fs ( o r   F fs ) + P sec ( o r   F sec ) )
Taking into account the definition of risk as a combination of the frequency or probability of the occurrence of a failure event and the consequences of that event, a simplified method is proposed below to determine the required SIL, taking into account information security and cybersecurity aspects.
Such an analysis is based on data obtained in the process of hazard identification occurring in the technical system, as well as an estimation of the level of risk associated with them. Some of the risk factors taken into account in carrying out such analysis have an impact on the estimated value of frequency or probability [30]. The part of the risk related to frequency parameters most often concerns the issues of hardware reliability [32,33].
In the process of integration of functional safety issues with information security, the concept of the so-called two-parameter function can be used [2]. If a low level of information security is estimated in the critical infrastructure system under consideration, the SIL requirements for the safety function may change. For the SIL requirements to remain unchanged, it becomes necessary to reduce the risks associated with the level of information security [34]. This involves raising the cybersecurity requirements (e.g., higher EAL level) for the system under analysis.

2.4. SIL Determining with Cybersecurity Aspects

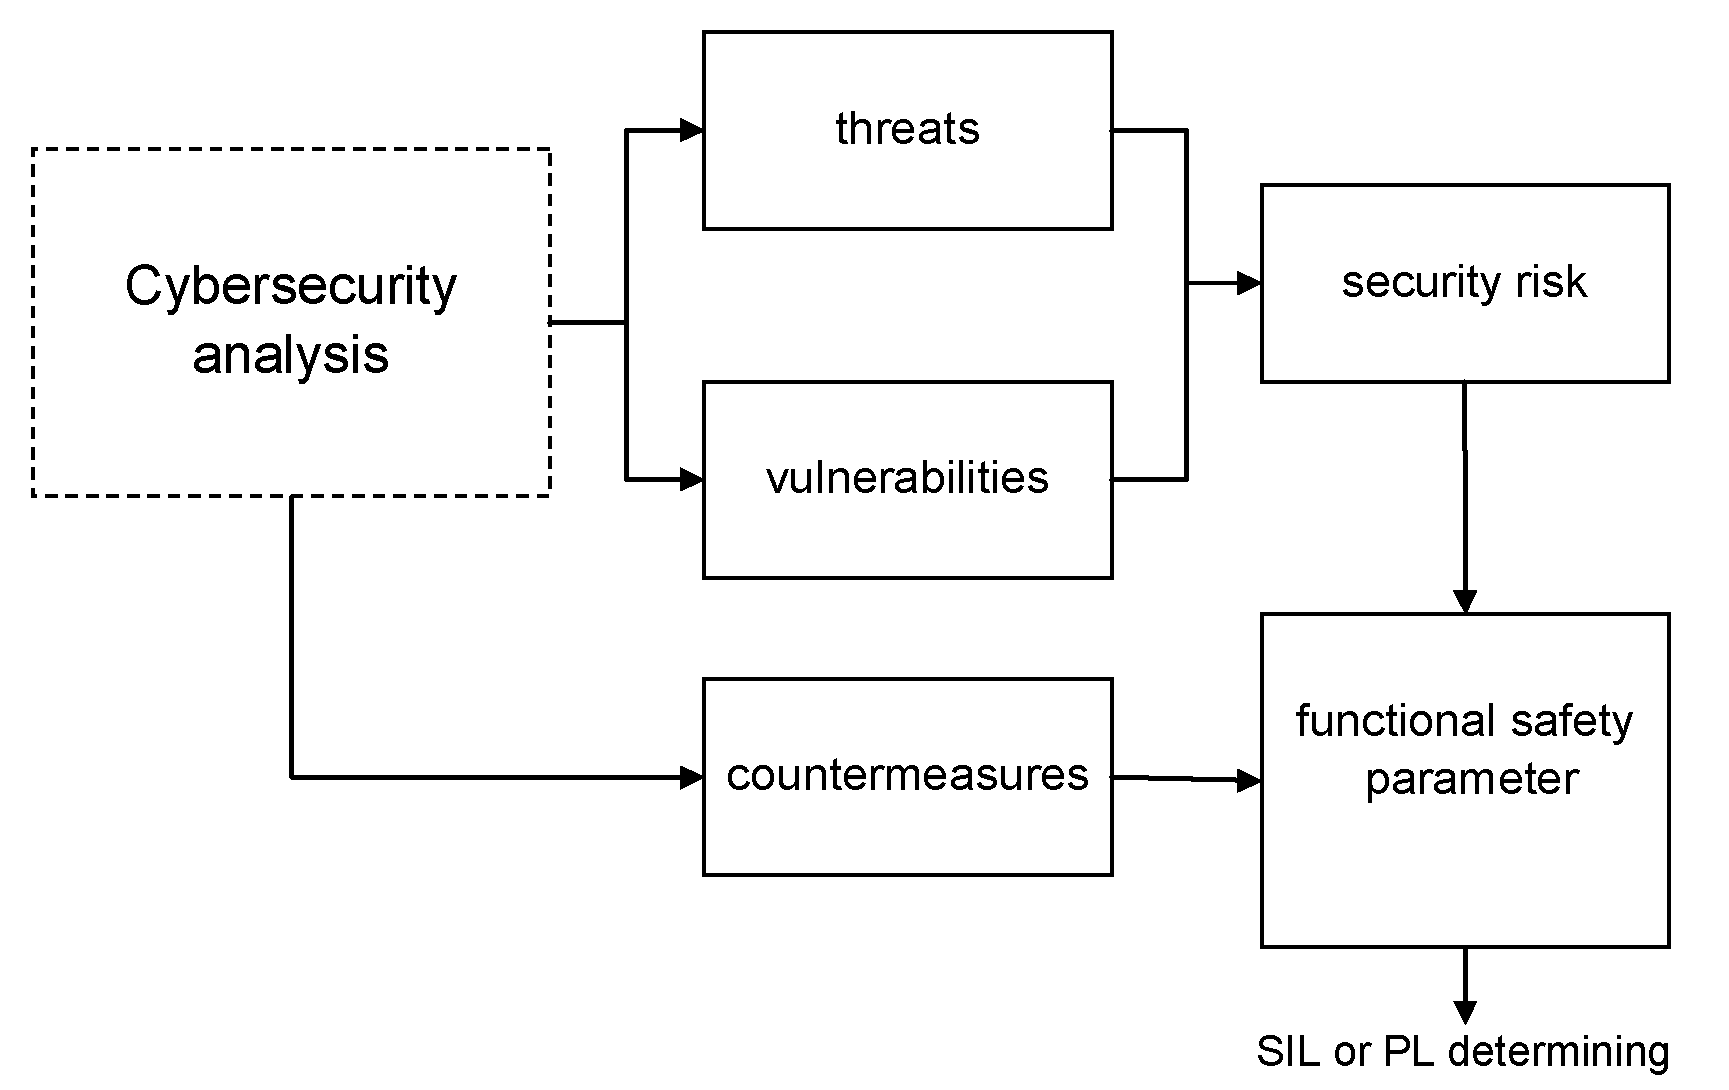
The functional safety and cybersecurity goals are now the input to derive functional safety and security requirements [11,35]. Both of those factors are responsible for the final level of security taken into account in the functional safety risk assessment process (Figure 8).
The SIL or PL is determined based on several quantitative factors in conjunction with qualitative factors during the process of development and safety life cycle management. There are several methods to determine the SIL or PL for a chosen safety function. Some of the popular ones include: Risk Matrix, Risk Graph [4,5,11,26,30].
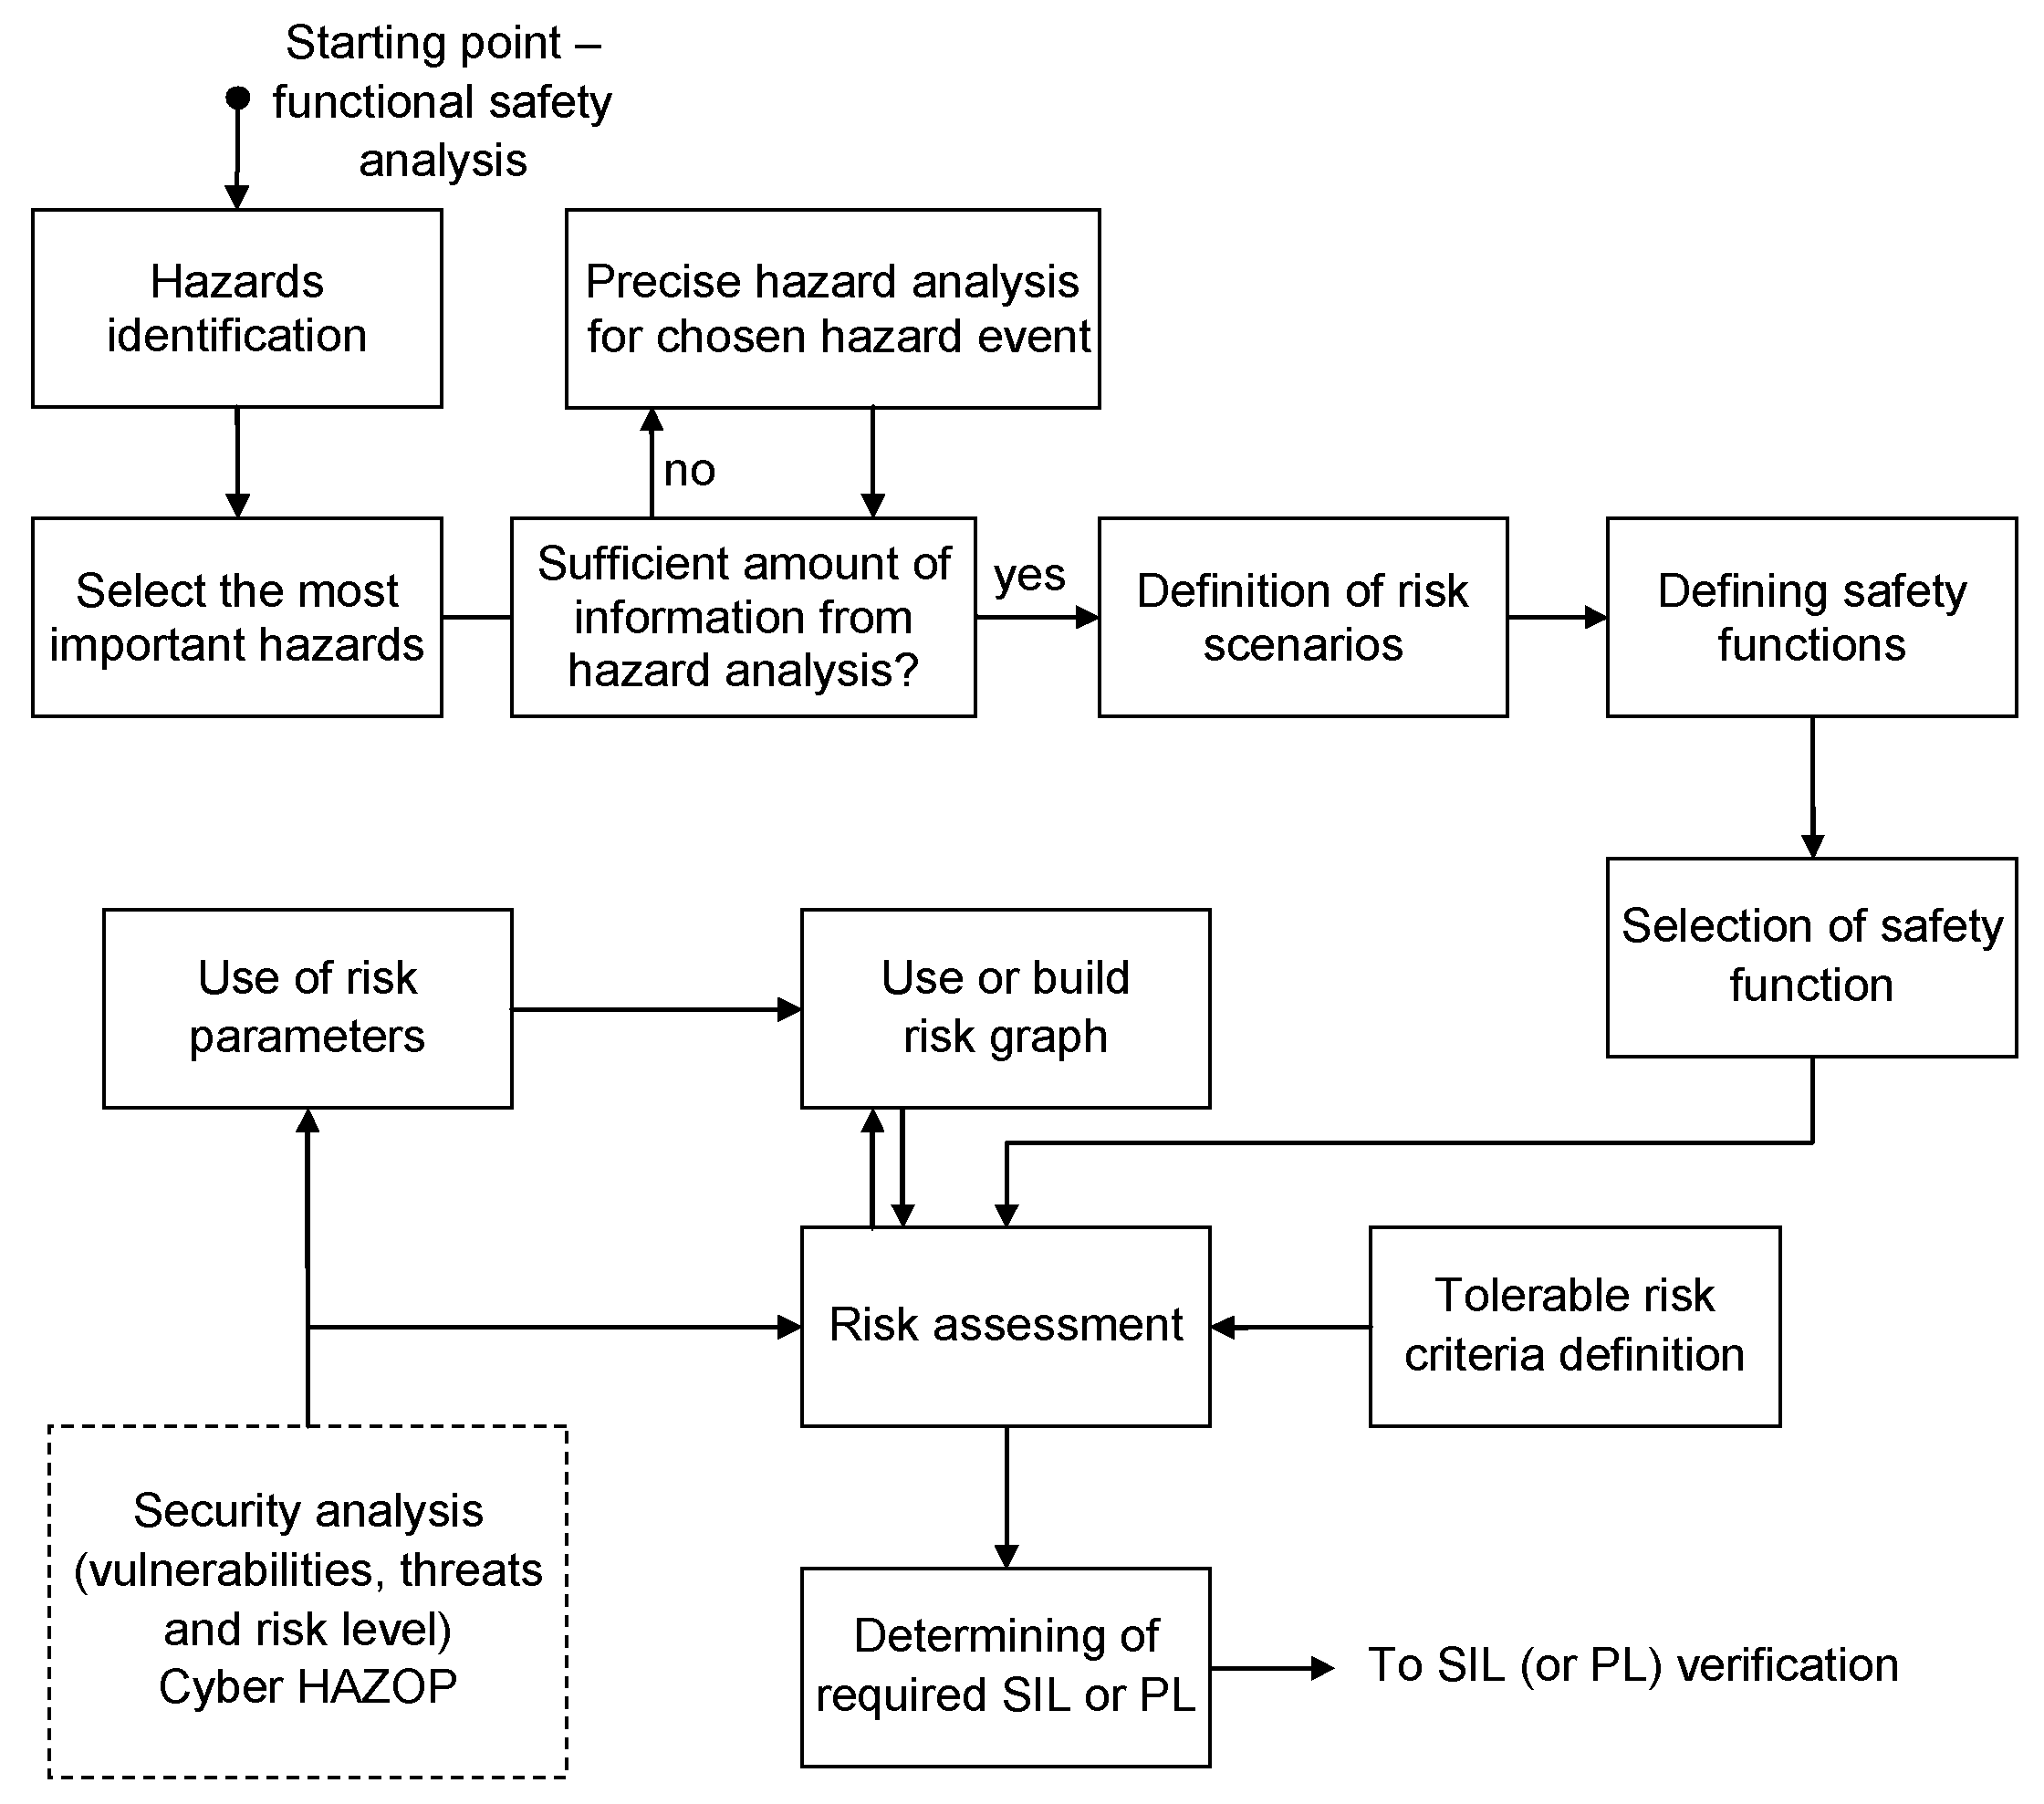
A general scheme of considering the security analysis results in the SIL or PL determining process is important to present the approach (Figure 9).

3. Safety Integrity Level Calculation

3.1. Probabilistic Modelling of Safety-Related Subsystems

The quantitative method based on the reliability block diagram (RBD) is used for verifying SIL. The probability of failure to perform the design safety function on demand can be evaluated the following formula:
P F D ( t ) ( 1 e λ D t ) 1 1 + λ D t λ D 2 t 2 2 ! + λ D 3 t 3 3 ! + w h e n   λ D t < < 1 P F D ( t ) ( 1 e λ D t ) λ D t
where: λD—dangerous failure rate; t—time.
The average probability, assuming that all subsystems are tested with the TI, is calculated as formula (12) [4]:
P F D avg = 1 T I 0 T I P F D ( t ) d t
where: TI—test interval.
The frequency of a dangerous failure can be evaluated based on a formula as shown below:
P F H F ( t ) t t ( 0 , T ) F ( T ) T 1 R ( T ) T = = 1 exp ( 0 T λ ( t ) d t ) T = 1 exp ( λ avg T ) T w h e n   λ avg T < < 1 P F H λ avg T T = λ avg
where: λavg—average failure rate; T—time interval.
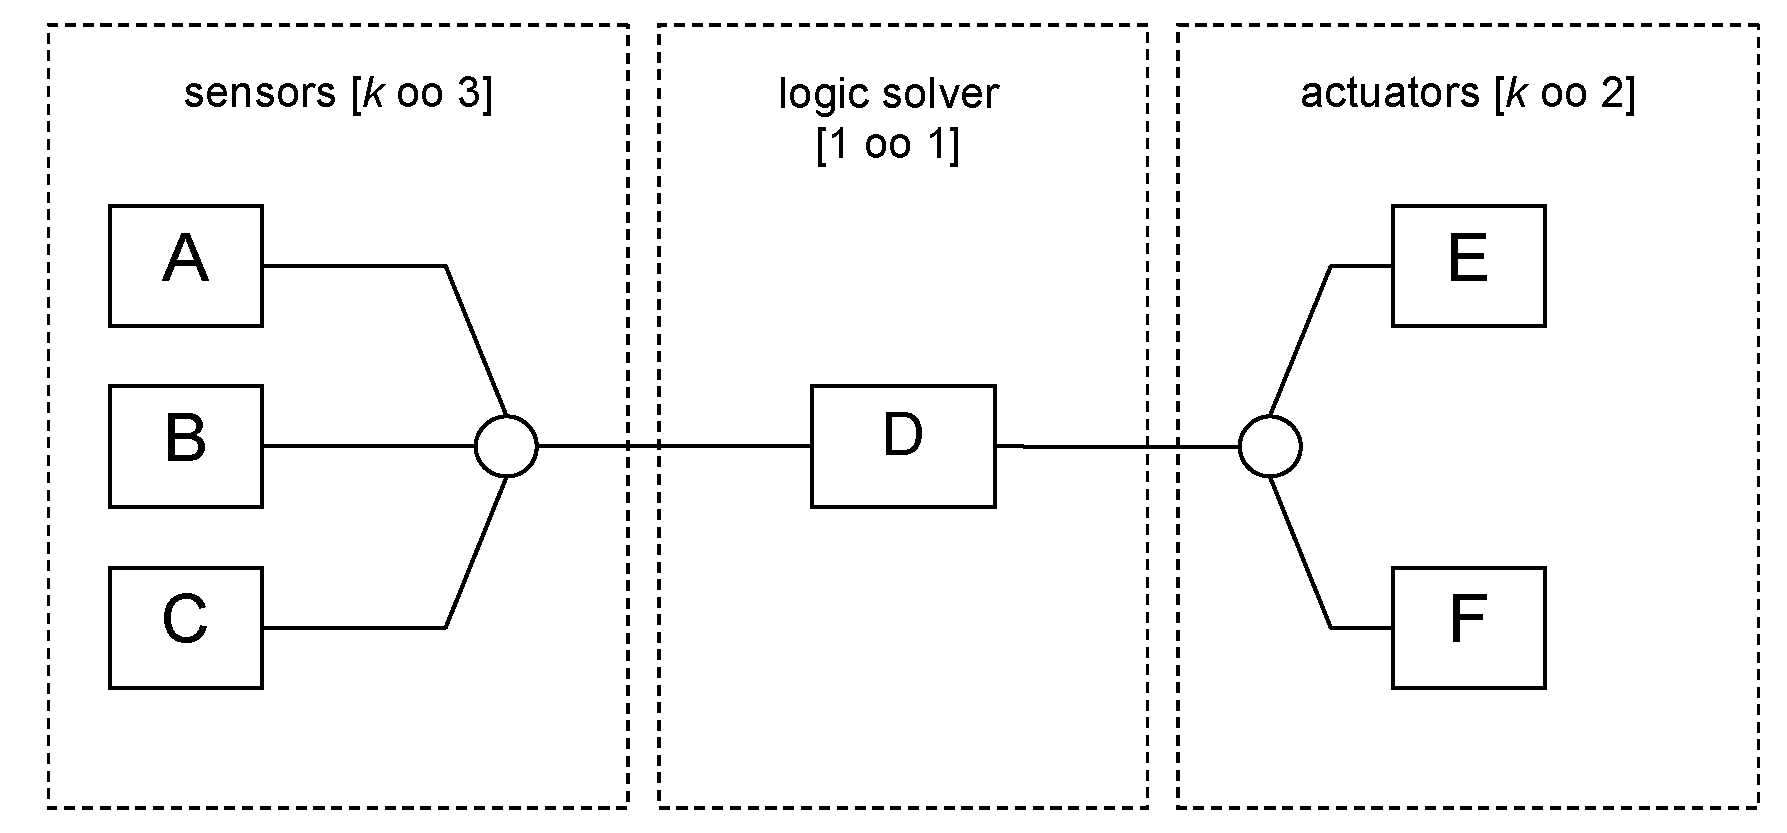
The architecture of equipment performing the safety function is represented by block diagrams distinguishing between subsystems and modules [36,37]. An example of the physical form of the E/E/PE system structure (BPCS or SIS) is shown in Figure 10.
There are three subsystems in the E/E/PE BPCS or SIS: sensors, logic solvers, and actuators. The presented structure consists of three sensors A, B, C configuration koo3, logical subsystem D (e.g., PLC), and actuators E and F (koo2).
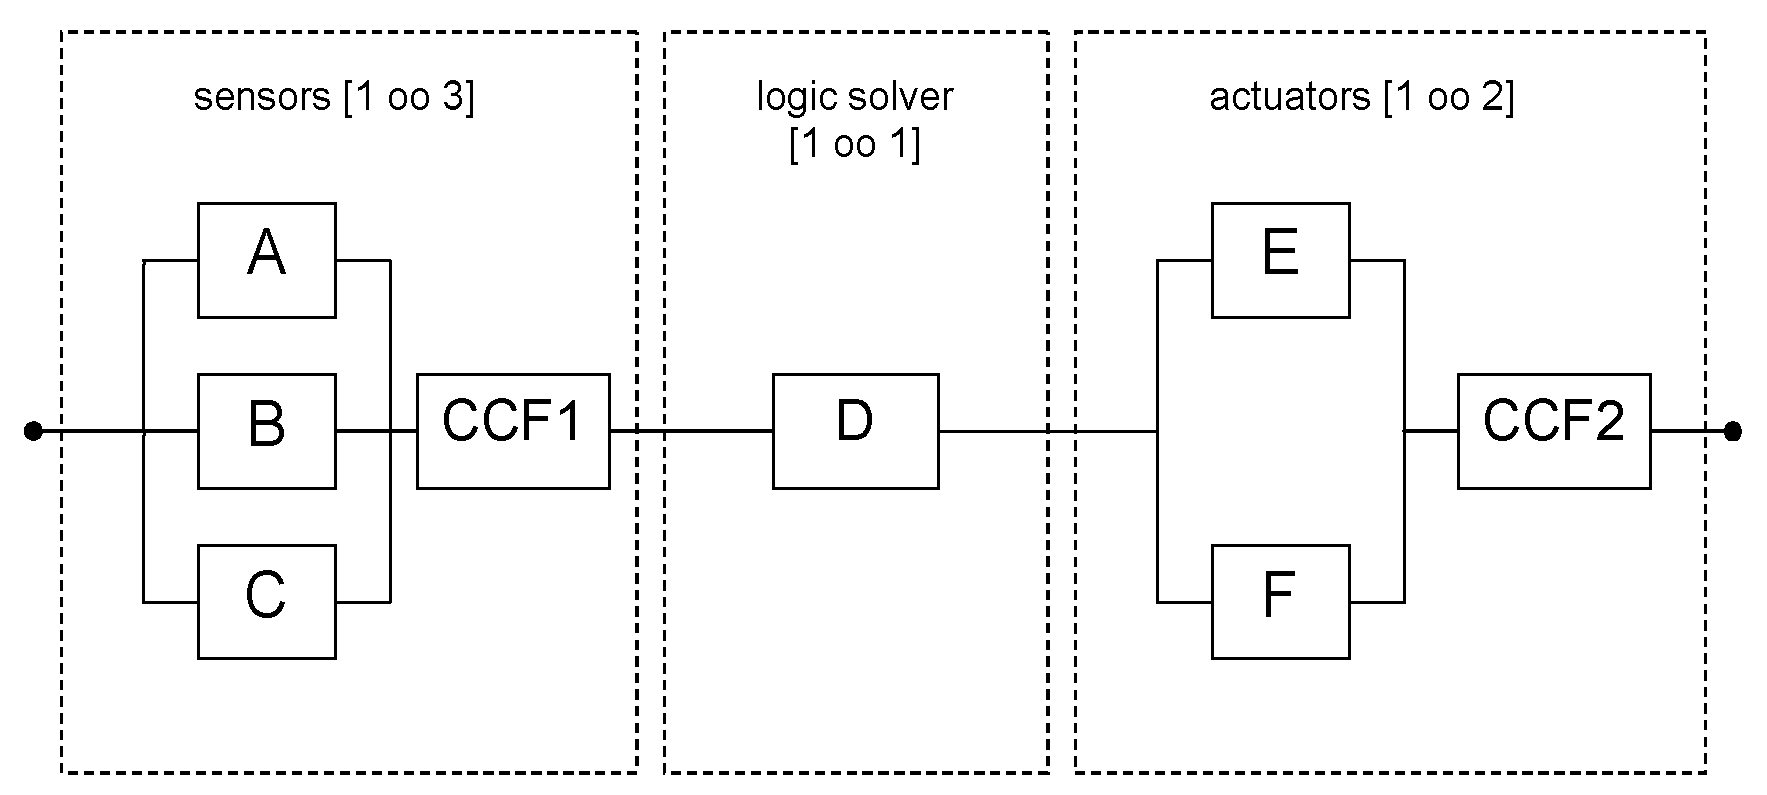
Figure 11 shows an example of the structure of an E/E/PE or SIS system in the form of a reliability block diagram, assuming that the sensors subsystem has a configuration 1oo3 and the actuators subsystem a configuration 1oo2.
In the above diagram the common cause failure (CCF) for the sensors’ subsystem from elements A, B and C and for the actuators’ subsystem CCF2 from elements E and F is considered [4,36,38]. In the system from Figure 10, five minimum cuts can be distinguished: {A, B, C}; {CCF1}; {D}; {E, F}; {CCF2}
Figure 12 shows the E/E/PE or SIS system fault tree from Figure 11 including the common cause failure.
The average probability of failure on demand safety function for the system in Figure 11 can be determined from the sum of the probabilities for the individual subsystems.
P F D avg P F D avg ABC + P F D avg CCF 1 + P F D avg D + P F D avg EF + P F D avg CCF 2
Similarly, the average frequency of a dangerous failure per hour PFH (for the system operating in high demand or continuous mode) can be determined as:
P F H P F H ABC + P F H CCF 1 + P F H D + P F H EF + P F H CCF 2
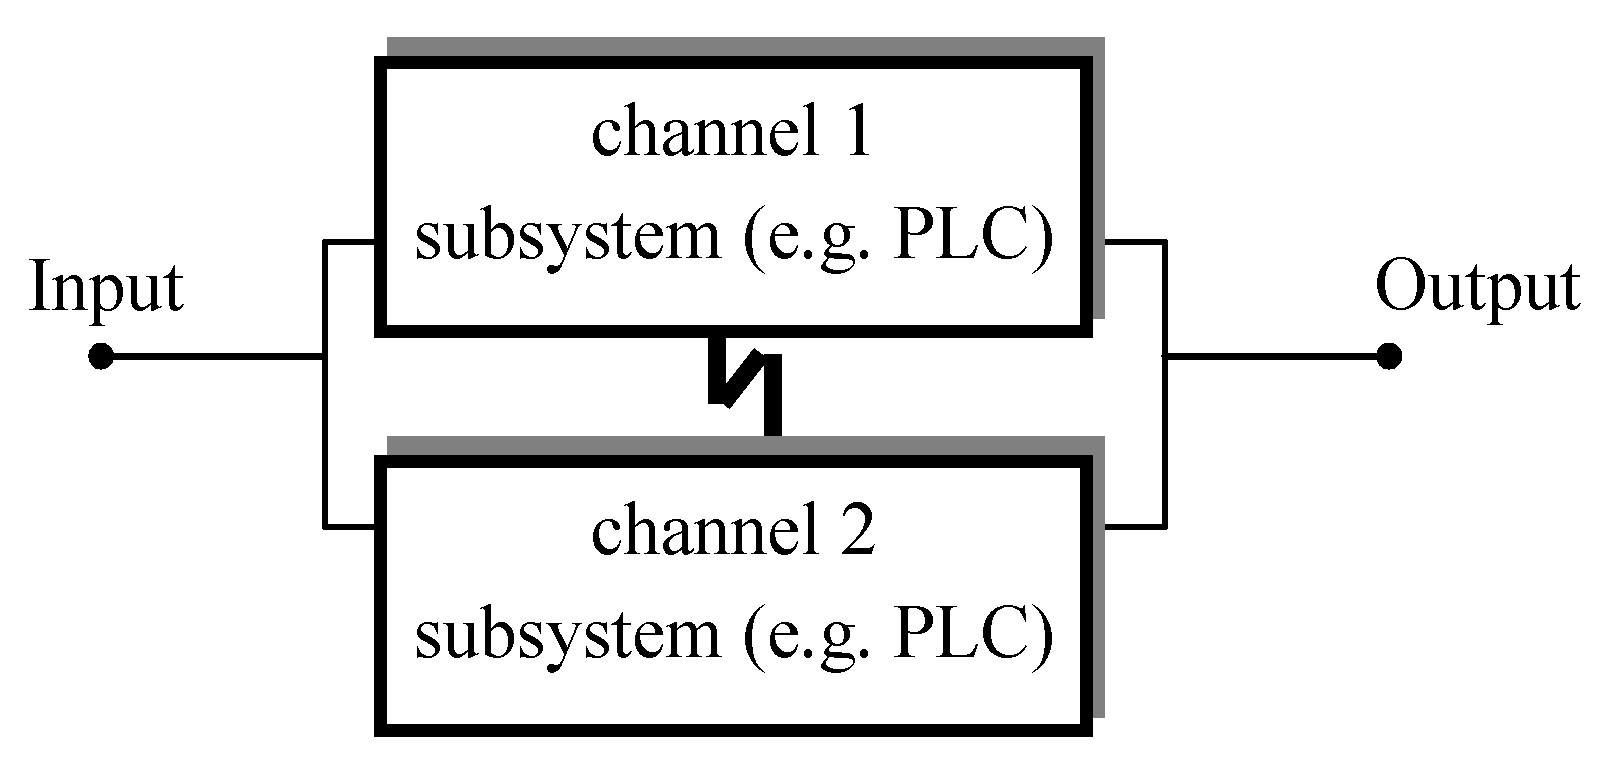
An example of the programmable electronic system with two channels (Figure 13) [4].
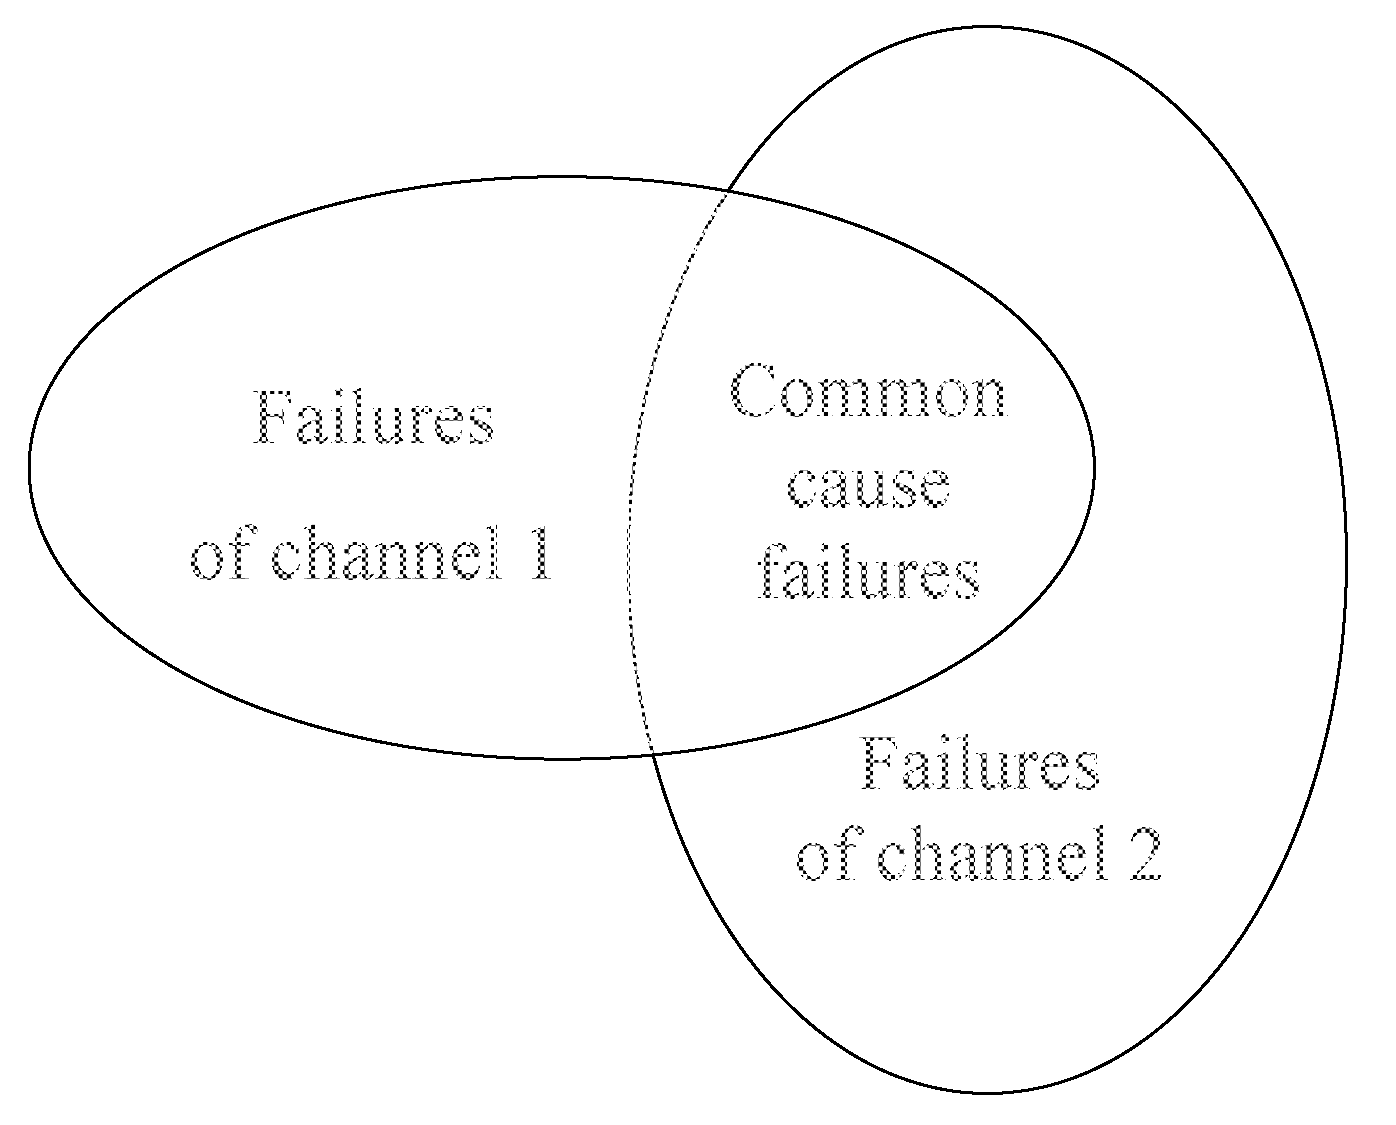
If the potential common cause failures were not included in the probabilistic evaluation of the system, the safety integrity level of the entire system would be incorrectly determined (or verified) [32,35,36,37,38]. The illustration of the contribution of common cause failures to the failures of individual channels and the entire 1oo2 system (Figure 14).
The β factor method is usually used in the modelling of potential common cause failures. The β factor method (Figure 15) can be also used to estimate the rate of the common cause failures, applicable to two channels operating in parallel with regard to the random hardware failures of these two channels [37,38].
The channel equivalent mean downtime tCE is evaluated from the equation [4]:
t CE = λ DU λ D ( T I 2 + M T T R ) + λ DD λ D M T T R
where: tCE—a channel equivalent mean downtime for 1oo2 architecture; λD—dangerous failure rate; λDD—dangerous detected failure rate; λDU—dangerous undetected failure rate; TI—proof test interval; MTTR—mean time to repair.
The voted group equivalent mean downtime tGE is expressed from the equation:
t GE = λ DU λ D ( T I 3 + M T T R ) + λ DD λ D M T T R
where tGE—the voted group equivalent mean downtime for 1oo2 architecture.
Taking into account Equations (16) and (17), the relations for the average probability of failure on demand for the 1oo2 architecture system is as follows:
P F D avg 1 o o 2 2 [ ( 1 β ) λ D ] 2 t CE t GE + β λ DU ( T I 2 + M T T R )
where: β—factor for common cause failure.
P F H 1 o o 2 2 [ ( 1 β ) λ D ] 2 t CE + β λ DU
The failure rate λ of a system with an excess structure koon, consisting of n different elements, can be presented as the sum of the average independent failure rate λIavg and the dependent failure rate λC
λ = λ Iavg + λ C
where: λIavg—average independent failure rate; λC—dependent failure rate.
The β factor takes the form:
β = λ C λ C + λ Iavg = λ C λ
Using formulas (20) and (21), the dependent failure rate can be described by the equation:
λ C = β λ
The average independent failure rate λIavg can be presented by the formula:
λ Iavg = i = 1 n λ I i n = i = 1 n ( 1 β ) λ i n
where: λIi—average independent failure rate for a single i-th element; n—number of elements.
Taking into account formulas (22) and (23), the dependent failure rate λC can be described as follows:
λ C = β λ Iavg ( 1 β ) = β ( i = 1 n λ I i n ) ( 1 β ) = β ( 1 β ) ( i = 1 n λ i n ) ( 1 β ) λ C = β ( i = 1 n λ i n )
Considering the average value of the independent failure rate λIavgg as the geometric mean, the dependent failure rate can be determined from the formula below:
λ C g = β λ Iavg g ( 1 β ) = β λ I 1 λ I 2 n λ I n ( 1 β ) = = β ( 1 β ) λ 1 λ 2 n λ n ( 1 β )      λ C g = β λ 1 λ 2 n λ n
The general β model is presented above. It is essential to take into account the common cause of failure in the constructed model. When the system will be composed of the same elements, the above formulas will be reduced to the form presented in the equations describing the case for identical elements. For the determination of the base value β for configuration 1oo2, the IEC 61508-6 score boards may be used [4].

3.2. Examples of Functional Safety Analysis with Cybersecurity

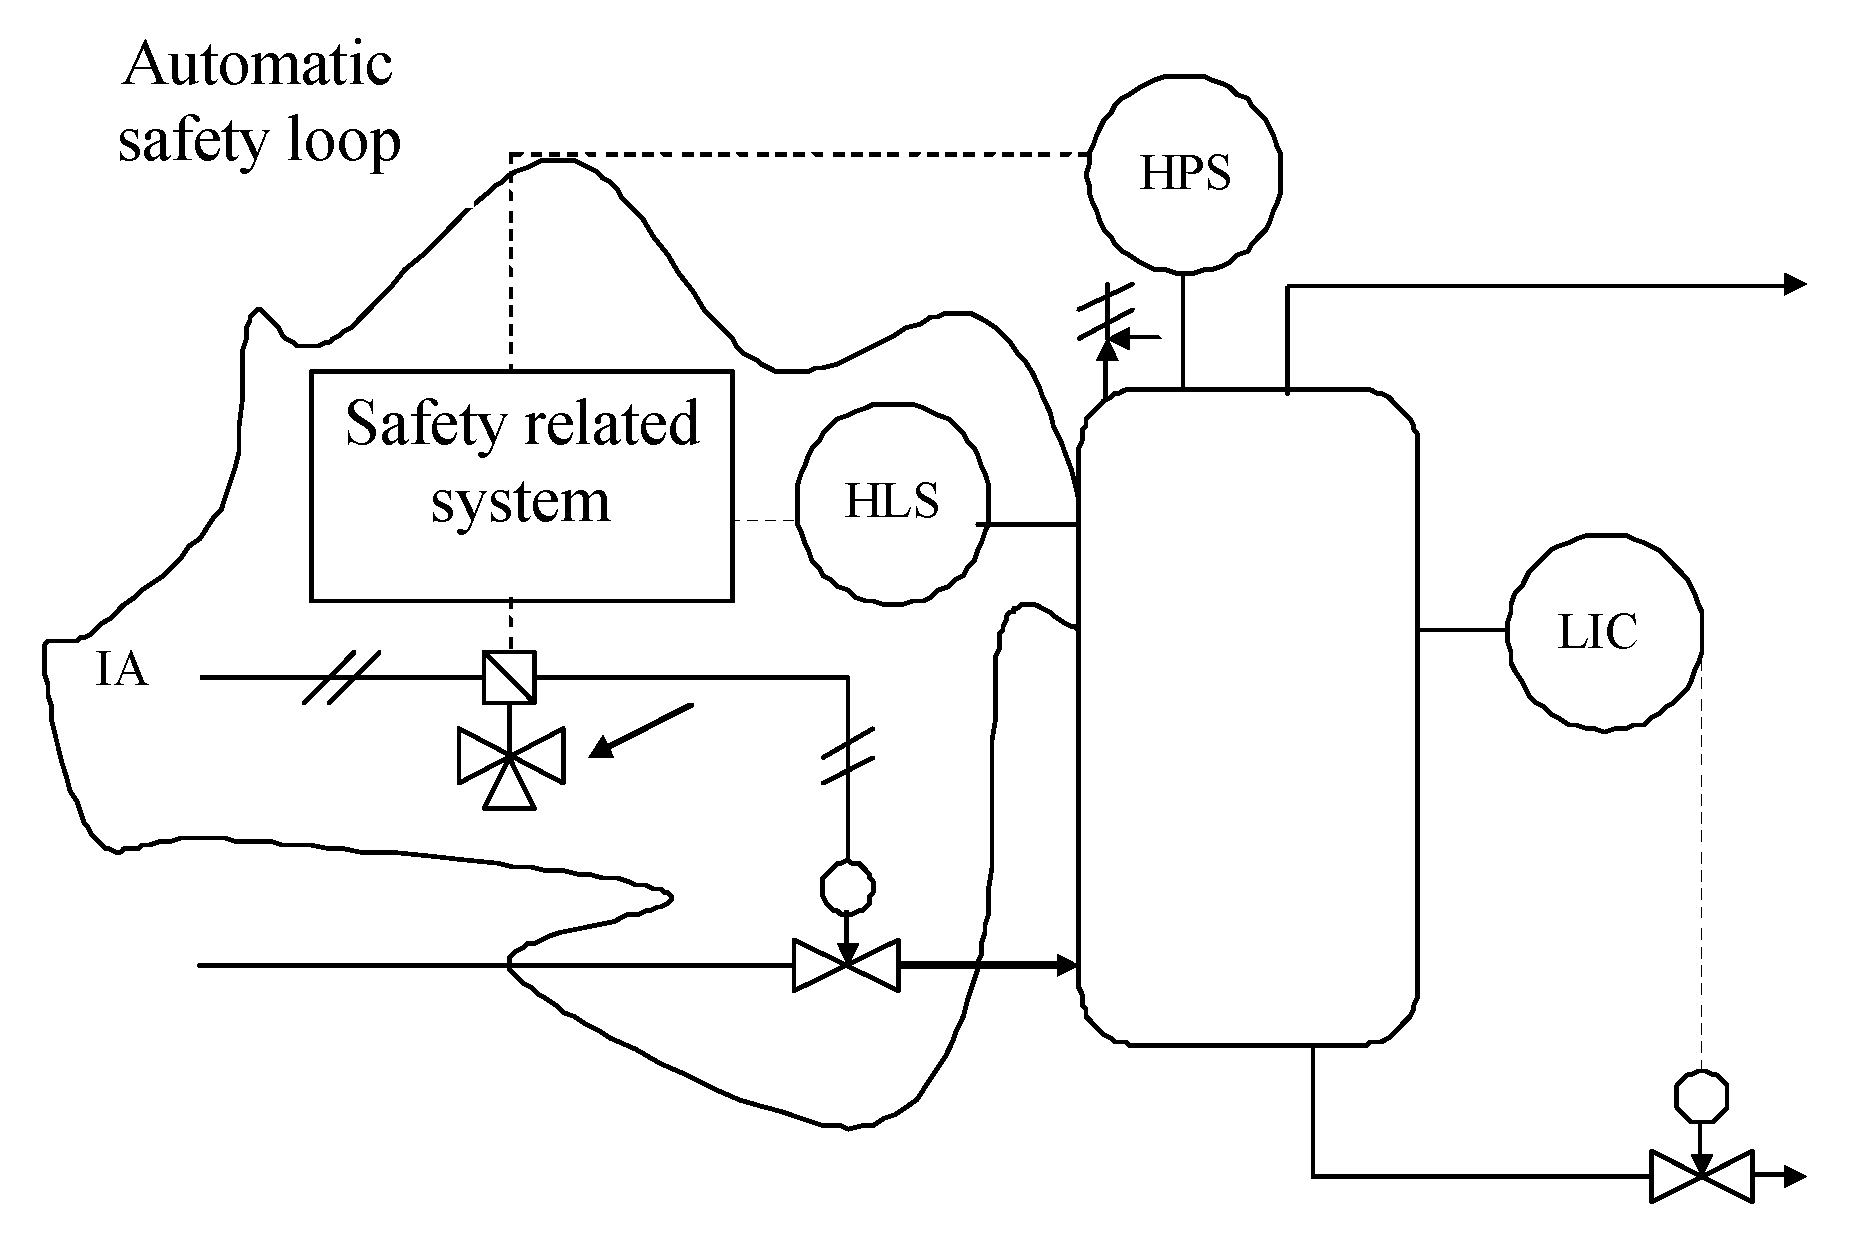
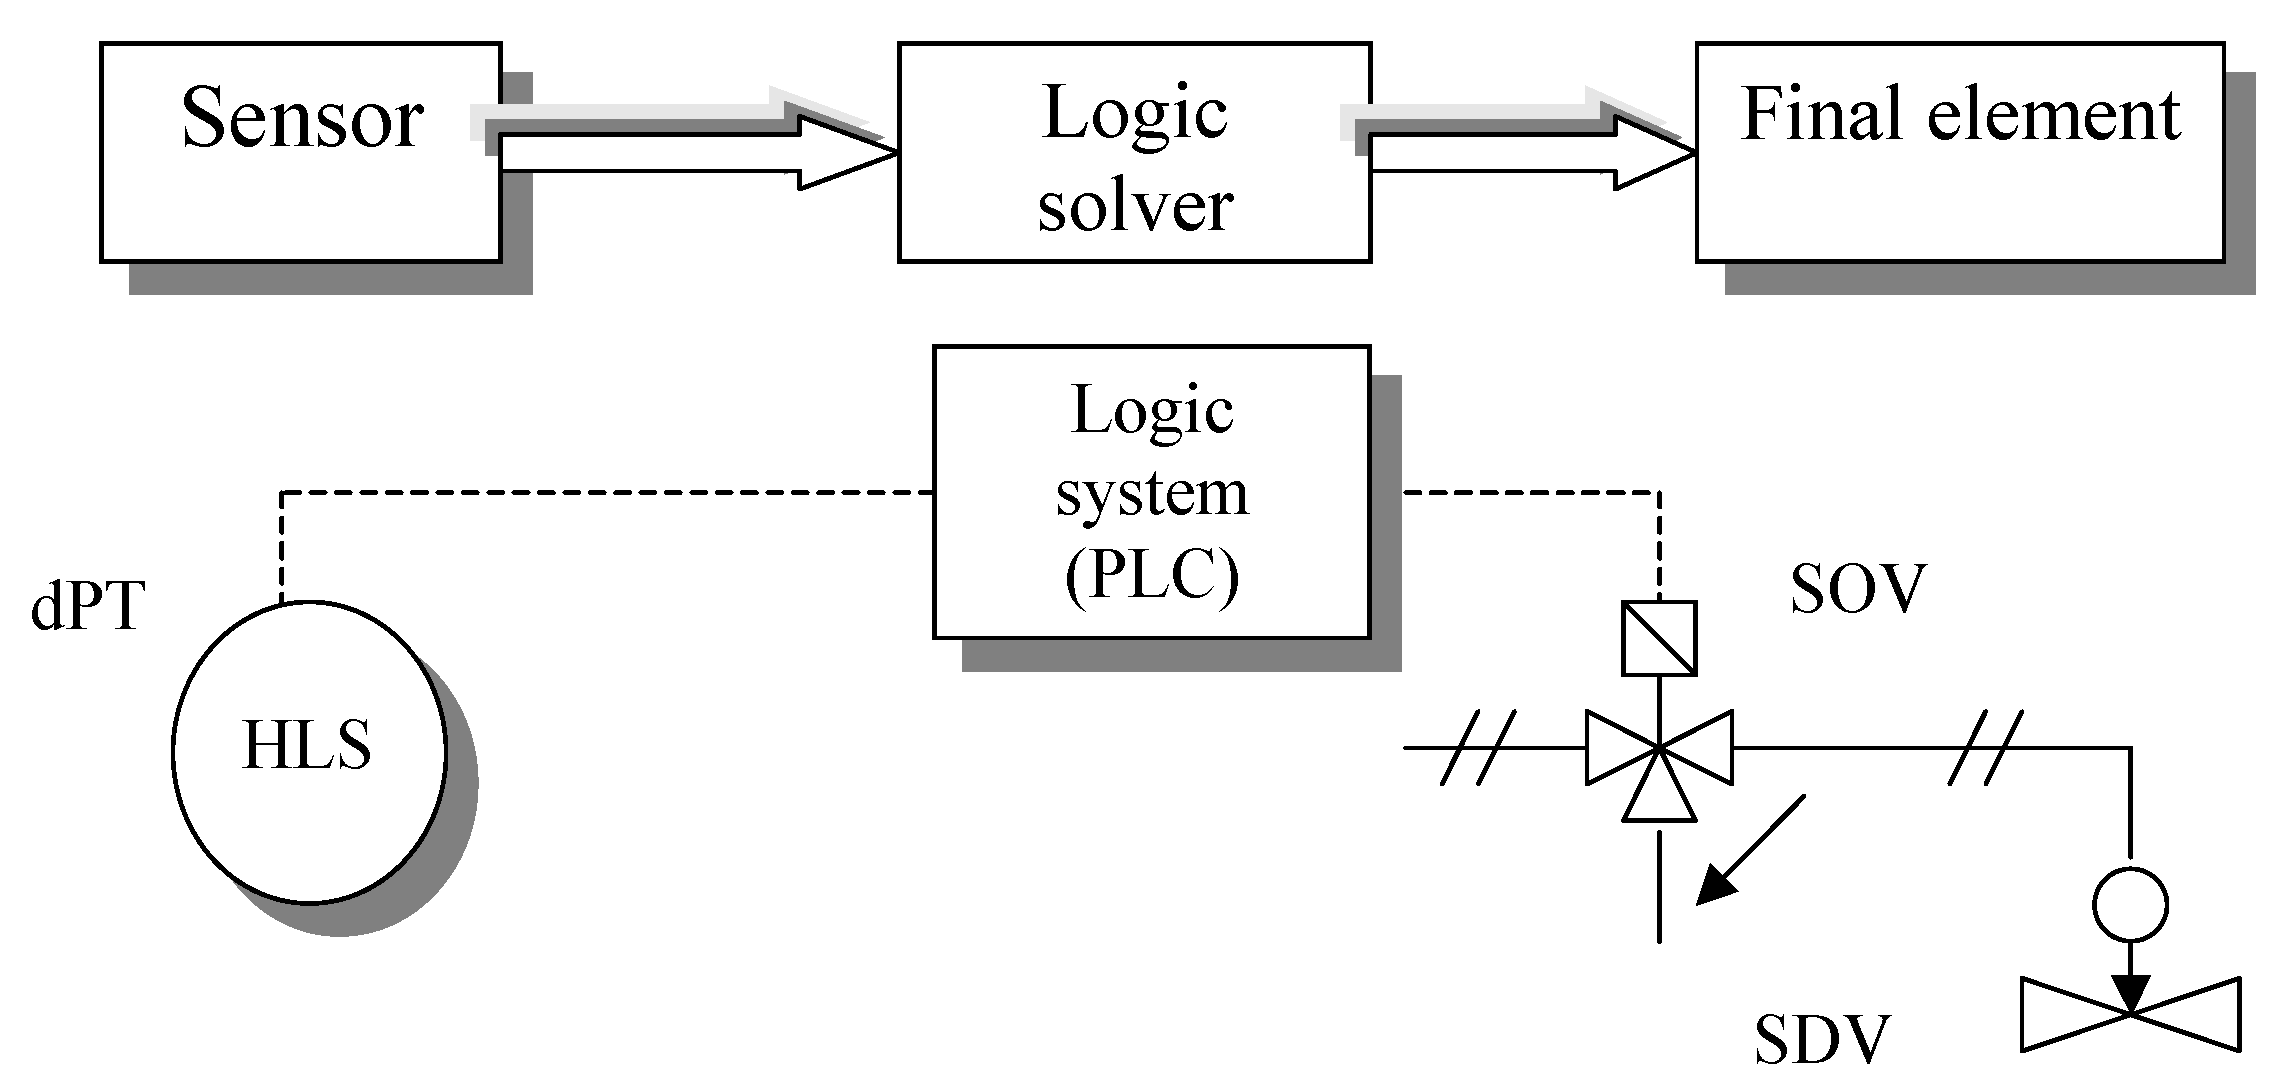
The high-pressure tank with liquid gas is considered, equipped with the E/E/PE safety-related system. The piping and instrumentation diagram (P&ID) with a safety loop of the protection system (Figure 16).
The E/E/PE safety-related system protecting the high-pressure tank should fulfil the requirement, according to the risk analysis results, of the safety integrity level SIL3 [10−4, 10−3) (Table 1). This system consists of the subsystems: the sensor, logic solver, and final element Figure 17.
In Figure 17. dPT—the pressure converter; I/I—the transducer, PLC—the programmable logic controller; SOV—the solenoid open valve; SDV—the shutdown valve; HLS—the high-level sensor.
Table 8 shows the data assumed for the automatic safety function considered. The initial calculations showed that for a single sensor in this system it is not possible to fulfil the requirement of SIL3.
Therefore, two paths of a sensor–converter (redundant architecture 1oo2) were then considered. The results (Table 9) of PFDavg are given for modified E/E/PE system with redundant sensors and different β factors assumed.
According to the results obtained, the E/E/PE safety-related system fulfils the criterion of SIL3. Taking into account the different values of β factor for the pressure converter dPT and transducer I/I, the results vary significantly. For instance, for β = 0.05 the value of PFDavg for the sensor subsystem changes by an order of magnitude, and β = 0.1 PFDavg the change is two orders of magnitude.
When the cybersecurity error failure event and related beta factor will be incorporated into the probabilistic model PFDavgCS = 0.01), the value of PFDavg for the E/E/PE system changes significantly [39,40]. For the case of β = 0.1, it is about 2 × 10⁻³. Taking into account the last column of Table 10 with PFDavg treated as the previous case, the SIL level of an E/E/PE system decreased from SIL3 to SIL2. Thus, incorporating dependency of events to the probabilistic model of the E/E/PE system usually increases significantly the PFDavg contributing to decreasing related SIL.
The contribution of probabilities described above on the average failure probability on demand PFDavg is shown in Figure 18. In this figure, TAT is the interval of periodic automatic tests of a subsystem and TI is the interval to carry out the functional tests of a subsystem.
In this figure, TAT is the interval of periodic automatic tests of a subsystem and TI is the interval to carry out the functional tests of a subsystem.

4. Verification of SIL under Uncertainty

As mentioned, for verifying the SIL the results of probabilistic modelling of the E/E/PE safety-related system are to be compared with the probabilistic criteria given in Table 1. In practice, these results are often the point values and, in some cases, can have values just on the upper/lower limits of intervals for consecutive SILs.
The results from a probabilistic model depend on its parameters, which in general are characterized by uncertainty, expressed by a distribution or interval. PFDavg is averaged in time, not for uncertain parameters of the model.
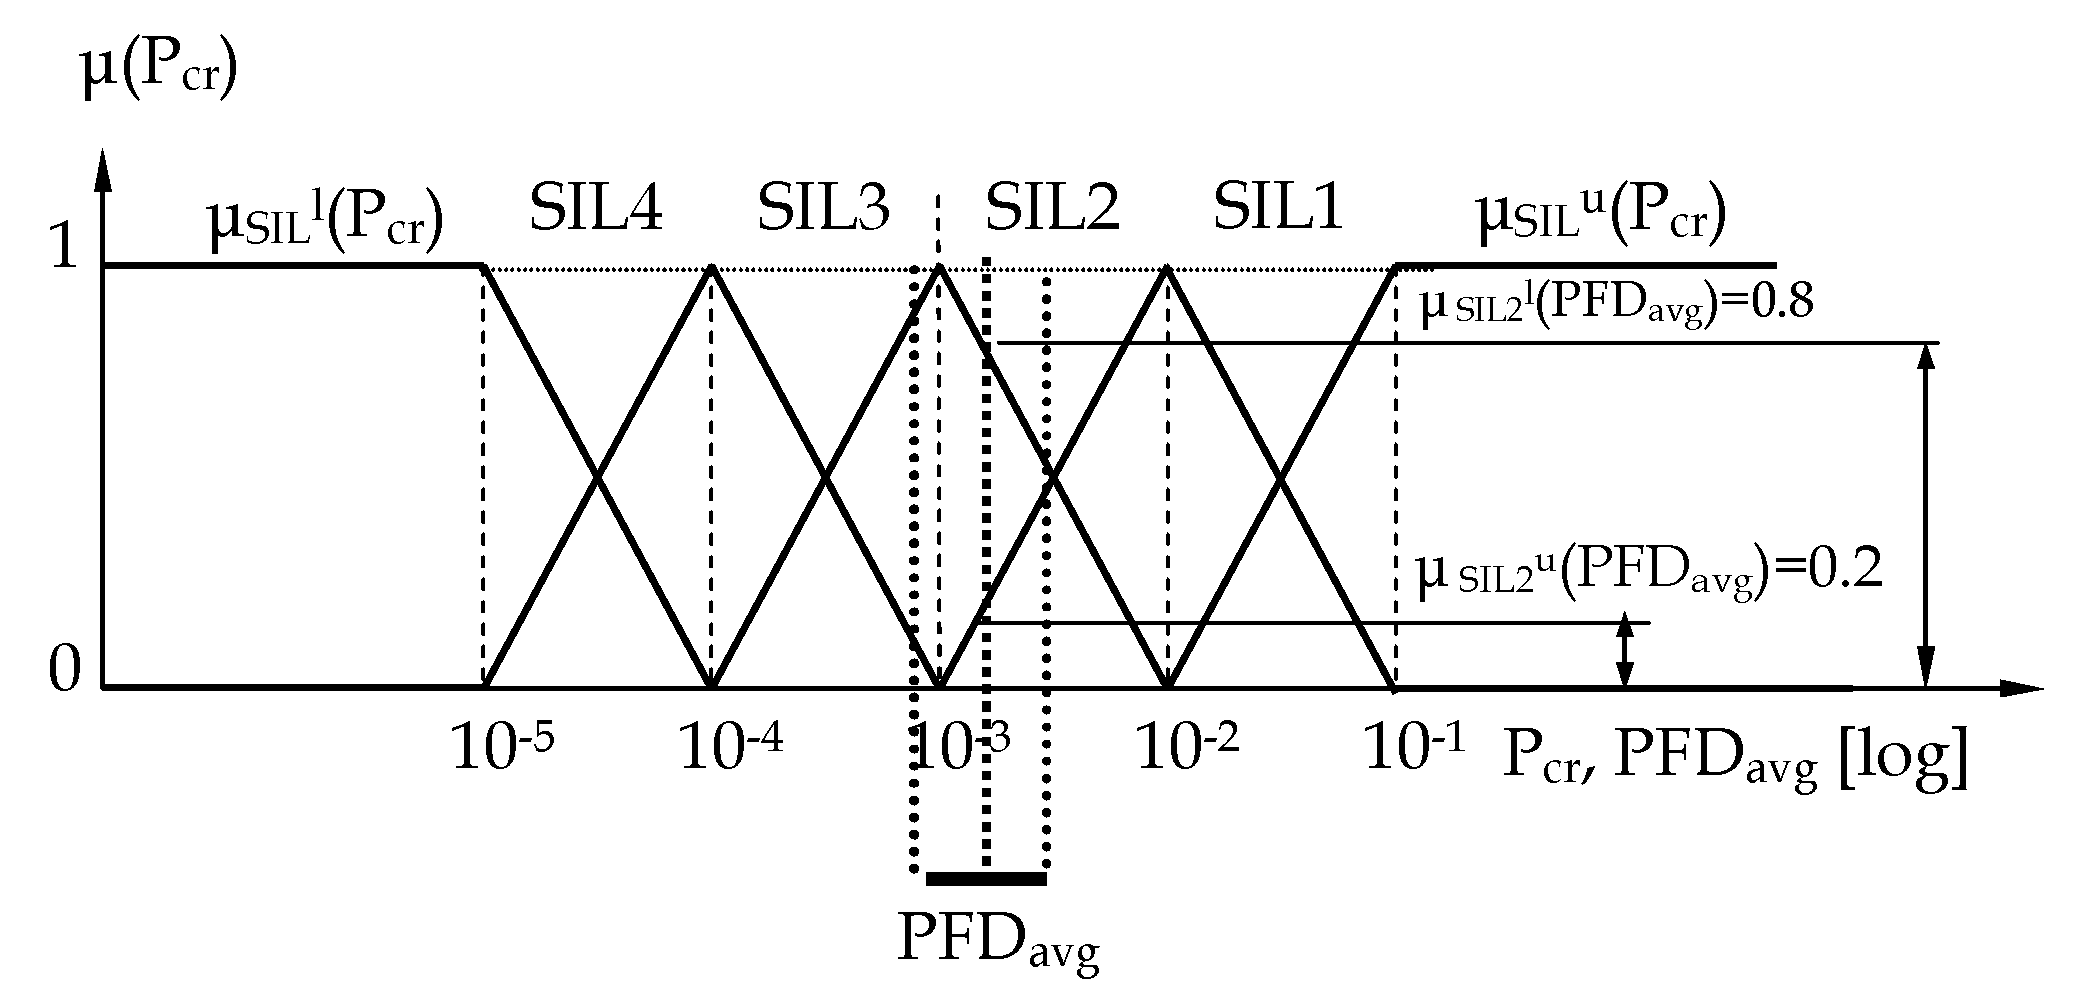
The results of probabilistic modelling can be represented by intervals (Figure 19) by the bold interval. In general, such an interval can be fuzzy, having some interesting properties. A method to verify uncertain results with fuzzy interval criteria is proposed in the monographs [1,2].
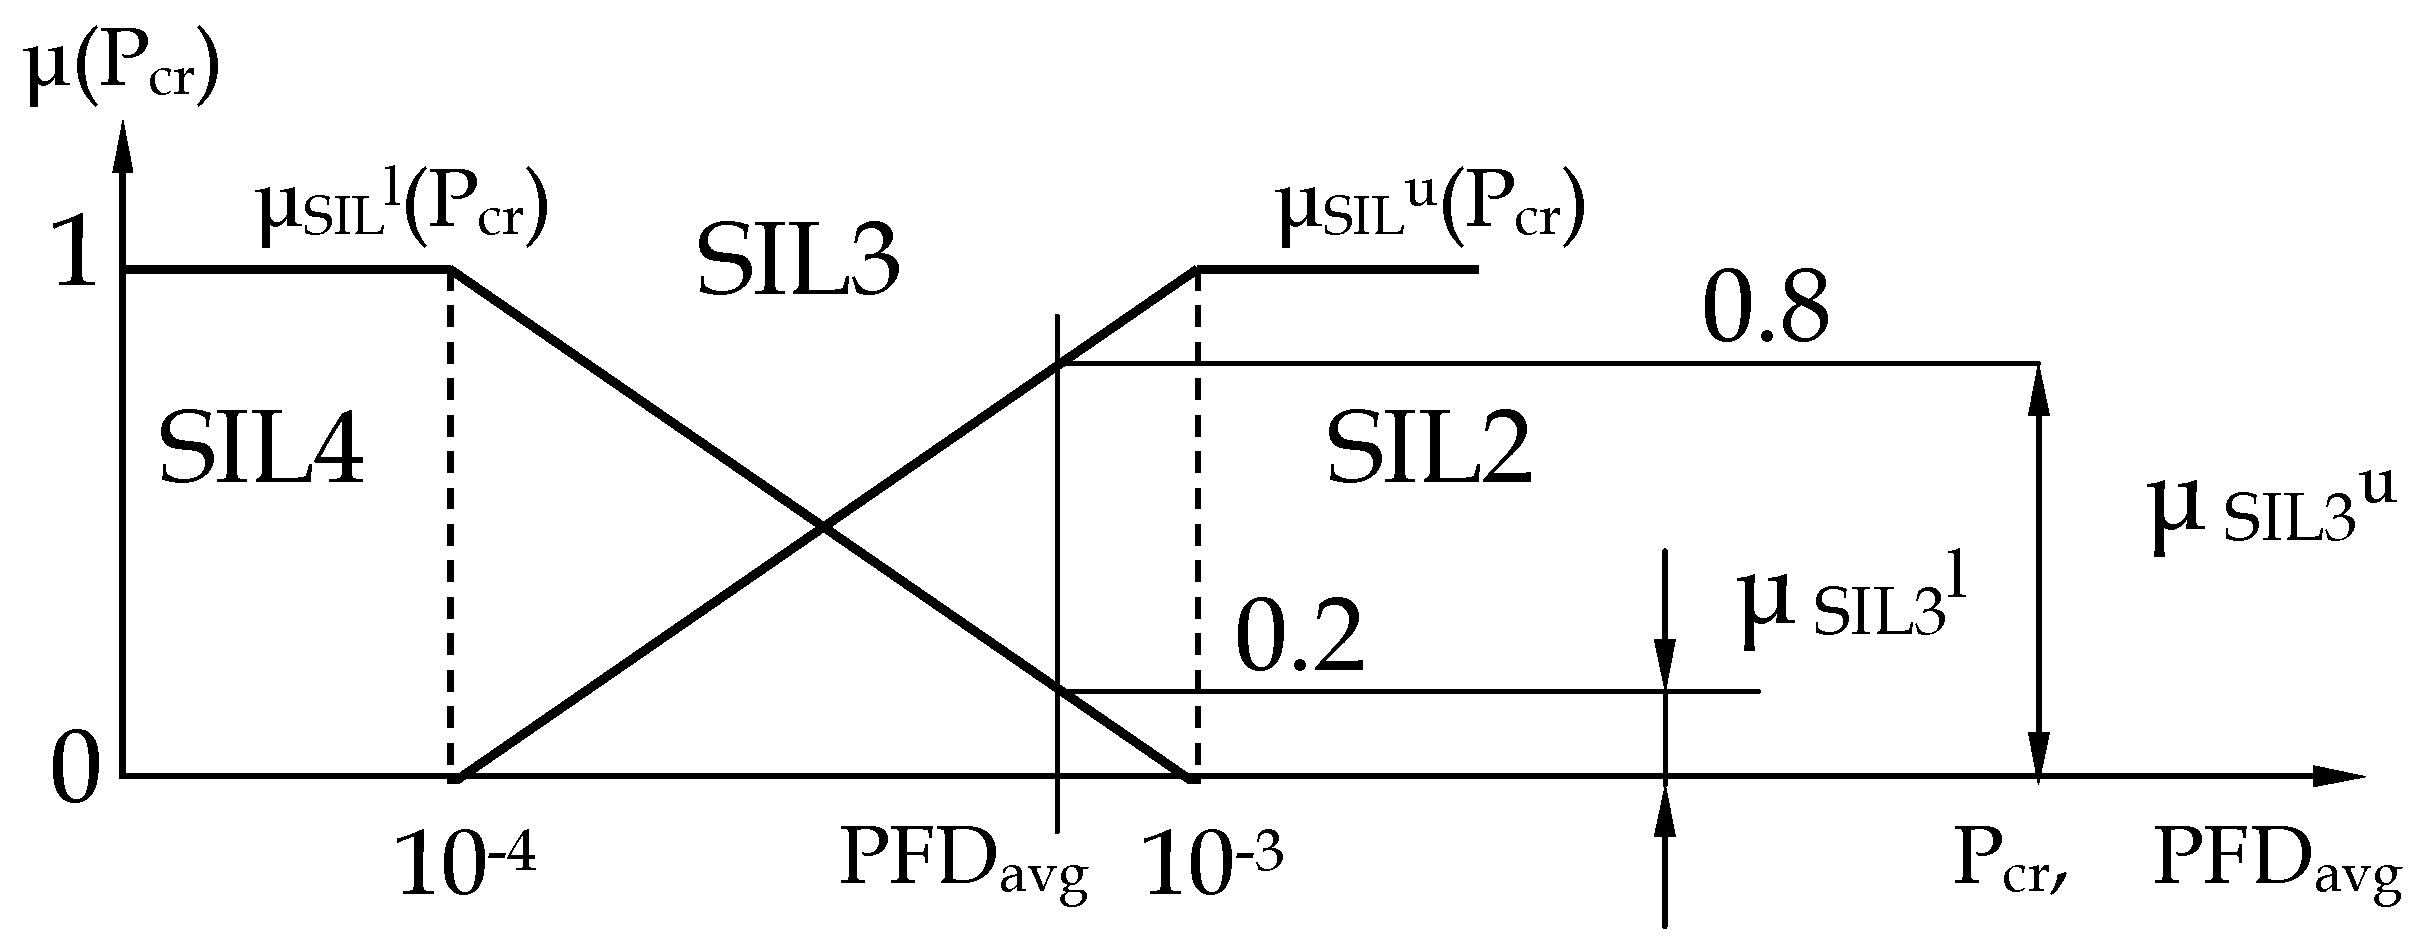
Below, a proposal is outlined for simplified verification of SIL for given E/E/PE system for the case when only point value of PFDavg is known but uncertainty issue will be incorporated in the verifying process through a more conservative determination of SIL. For instance, the point value of PFDavg was compared with fuzzy criteria values, l—lower and u—upper, (Figure 19) represented using the relevant membership function of a fuzzy criterion (for the given SIL), respectively µSILl(Pcr) and µSILu(Pcr).
In this figure, if we consider, for instance, SIL2, μSIL2l(PFDavg) as the possible level to fulfil SIL2 lower limit probabilistic criterion; μSIL2u(PFDavg)—the possibility level) to fulfil SIL2 upper limit probabilistic criterion. When μSILl(PFDavg) and μSILu(PFDavg) are equal to 0.5 the SIL level is indicated unconditionally. When the μSIL2l(PFDavg) and μSIL2u(PFDavg) are close to 0 or 1 (lower/upper limits of the probability interval), the SIL is determined conservatively (lower level of SIL assumed) or additional analysis is undertaken concerning assumptions and sensitivity analyses of the probabilistic model.
PFDavg in formula (12) for a subsystem of the given architecture is calculated e.g., according to formula (18). If the value of probability PFDavgSYS is lower than a relevant probabilistic criterion value for given SIL (Table 1), then the designed safety-related system is considered as fulfilling this criterion.
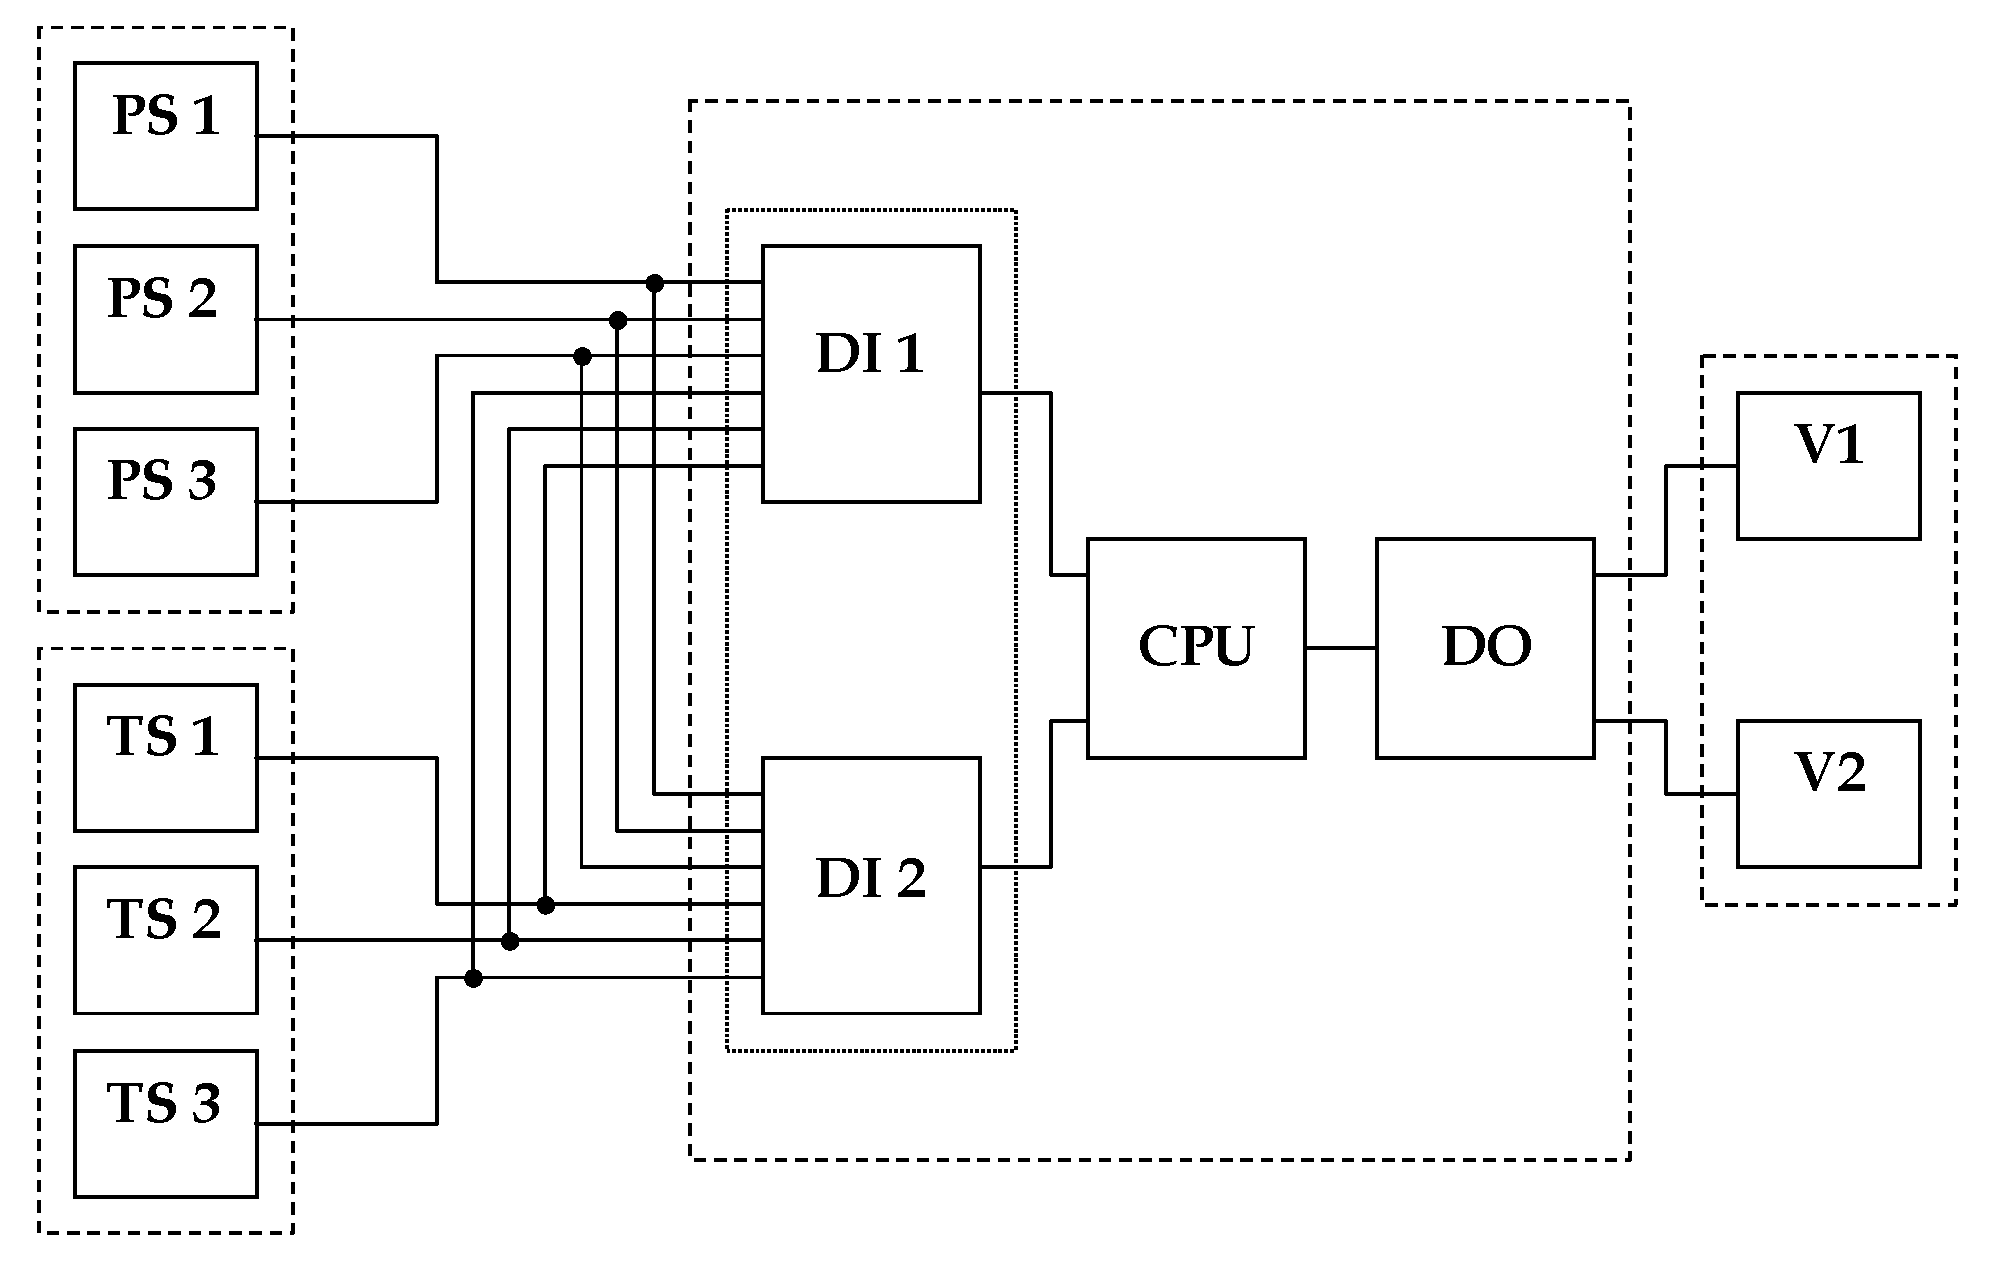
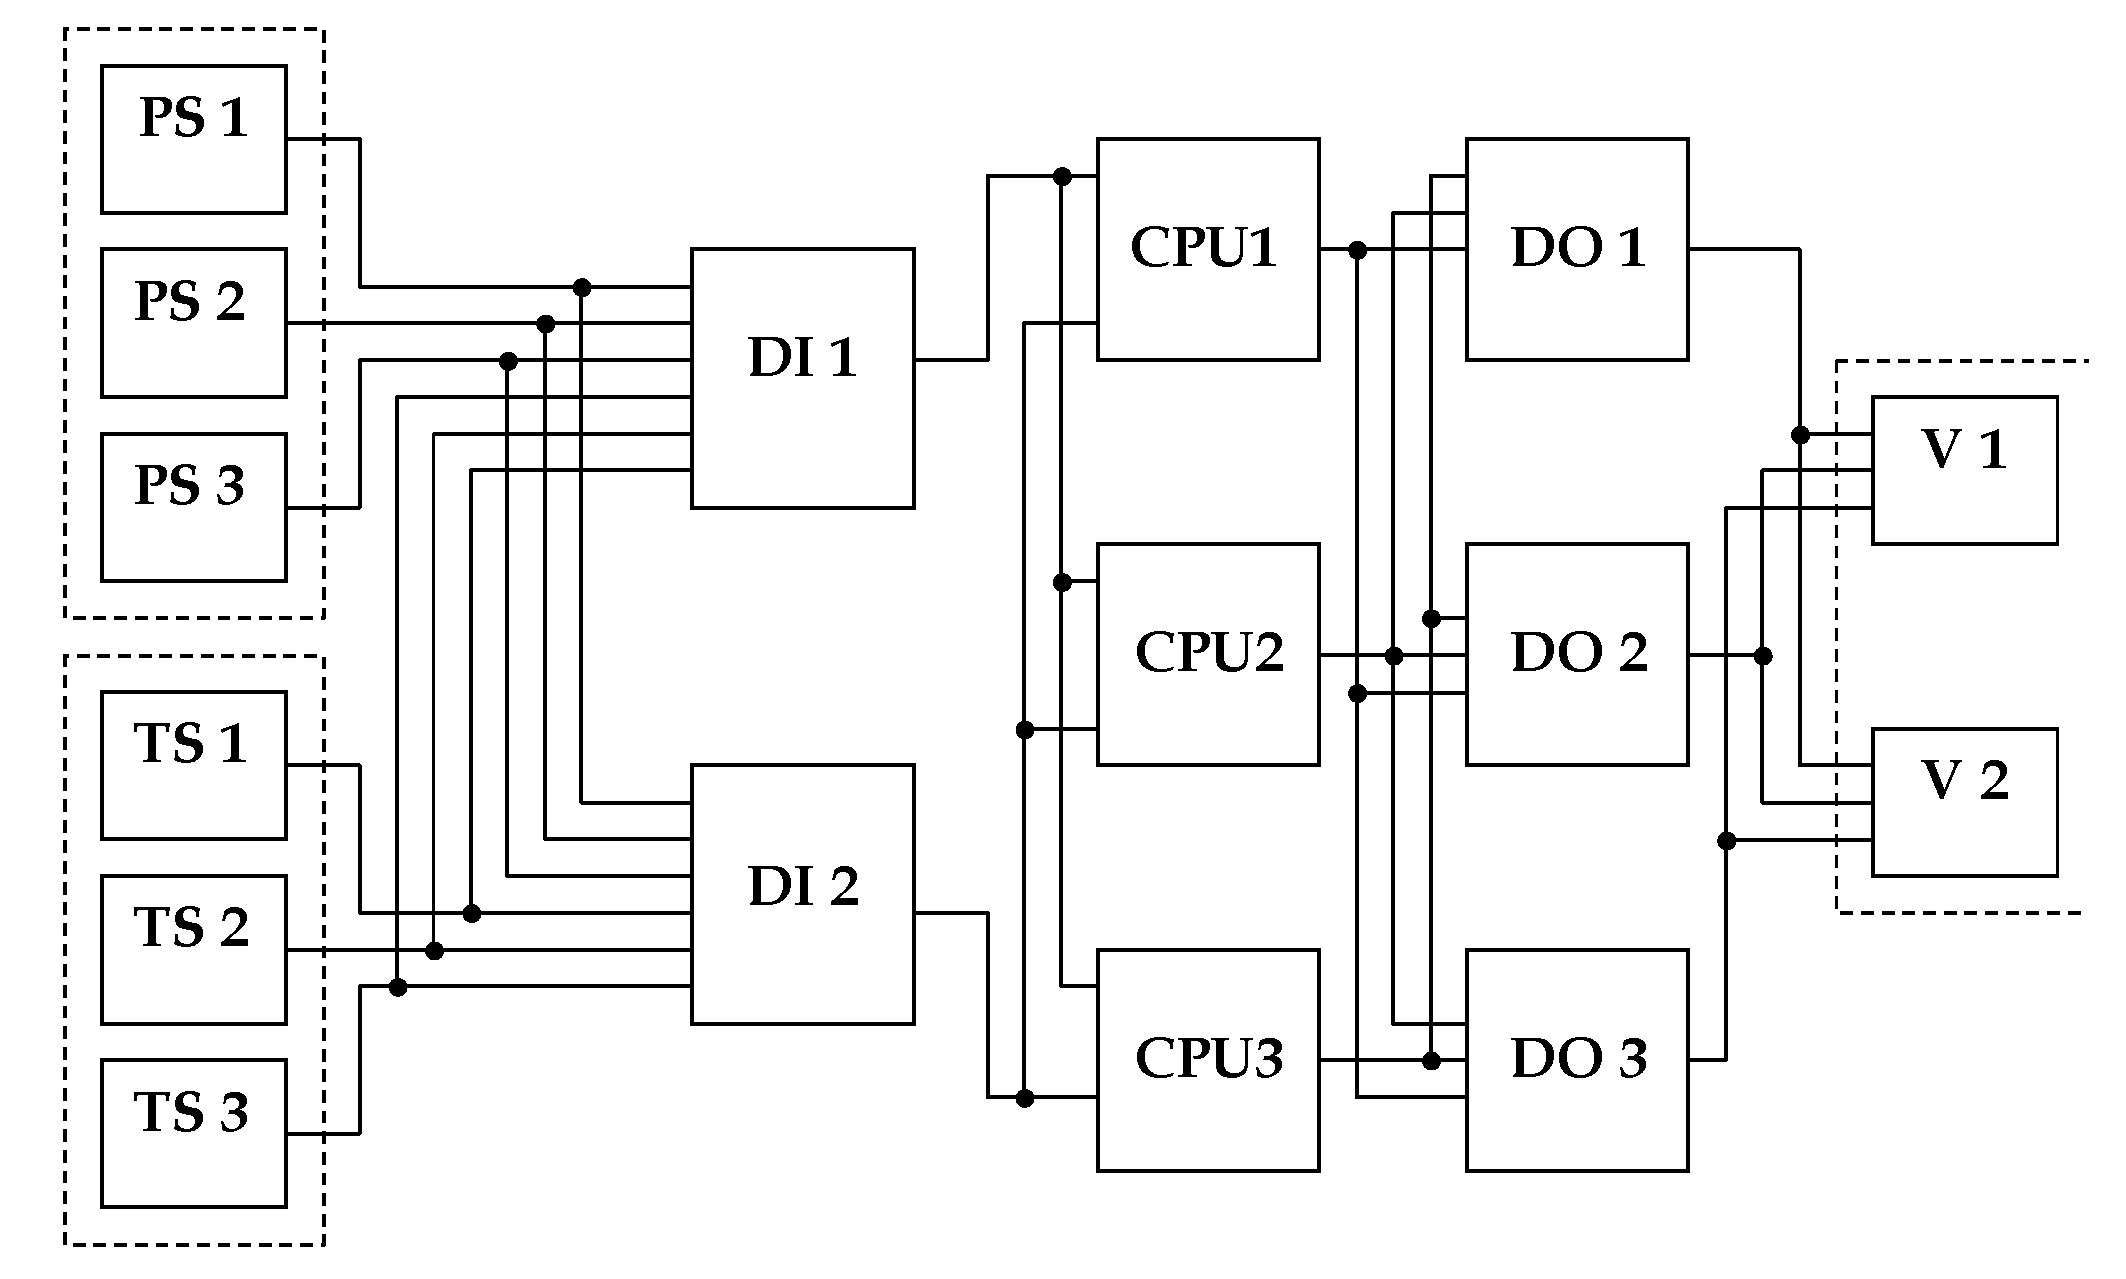
The structure (Figure 20 and Figure 21) of three E/E/PE safety-related systems that consist of subsystems: the pressure sensors (PS) of architecture (2oo3), the temperature sensors (TS) of architecture (2oo3), and valves (V) with redundancy (1oo2) and different structures of central processor unit (CPU), digital input modules (DI) and digital output modules (DO). In structure I the digital input module DI is 1oo2, CPU is 1oo1, and DO is 1oo1.
For the system in Figure 20 there are 10 minimal cuts sets:
K 1 = { PS 1 , PS 2 } , K 2 = { PS 1 , PS 3 } , K 3 = { PS 2 , PS 3 } , K 4 = { TS 1 , TS 2 } , K 5 = { TS 1 , TS 3 } , K 6 = { TS 2 , TS 3 } , K 7 = { DI 1 , DI 2 } , K 8 = { CPU } , K 9 = { DO } , K 10 = { V 1 , V 2 }
Therefore, the probability of PFD(t) takes the form:
P F D ( t ) q PS 1 ( t ) q PS 2 ( t ) + q PS 1 ( t ) q PS 3 ( t ) + q PS 2 ( t ) q PS 3 ( t ) +    + q TS 1 ( t ) q TS 2 ( t ) + q TS 1 ( t ) q TS 3 ( t ) + q TS 2 ( t ) q TS 3 ( t ) +    + q DI 1 ( t ) q DI 2 ( t ) + q CPU ( t ) + q DO ( t ) + q V 1 ( t ) q V 2 ( t )
where: q—the probability of failure on single elements in subsystem structure.
If the individual subsystems consist of the same elements, then the probability of PFD(t) is represented by the following relationship:
P F D ( t ) 3 q PS ( t ) 2 + 3 q TS ( t ) 2 + q DI ( t ) 2 + q CPU ( t ) + q DO ( t ) + q V ( t ) 2
Thus, for the example system in Figure 20, the average probability of failure PFDavg to perform the safety-related function on demand is:
P F D avg 3 ( ( 1 β PS ) λ D PS ) 2 ( T I 2 3 + T I M T T R PS + M T T R PS 2 ) + + β PS λ DU PS ( T I 2 + M T T R PS ) + 3 ( ( 1 β TS ) λ D TS ) 2 ( T I 2 3 + T I M T T R TS + M T T R TS 2 ) + + β TS λ DU TS ( T I 2 + M T T R TS ) + ( ( 1 β DI ) λ D DI ) 2 ( T I 2 3 + T I M T T R DI + M T T R DI 2 ) + + β DI λ DU DI ( T I 2 + M T T R DI ) + λ DU CPU T I 2 + λ D CPU M T T R CPU + λ DU DO T I 2 + + λ D DO M T T R DO + ( ( 1 β V ) λ D V ) 2 ( T I 2 3 + T I M T T R V + M T T R V 2 ) + + β V λ DU V ( T I 2 + M T T R V )
The average frequency PFH dangerous failures for safety-related system continuous mode operation is described by the formula:
P F H 6 ( ( 1 β PS ) λ D PS ) 2 ( T I 2 + M T T R PS ) + β PS λ DU PS + + 6 ( ( 1 β TS ) λ D TS ) 2 ( T I 2 + M T T R TS ) + β TS λ DU TS + + 2 ( ( 1 β DI ) λ D DI ) 2 ( T I 2 + M T T R DI ) + β DI λ DU DI + + λ DU CPU + λ DU DO + 2 ( ( 1 β V ) λ D V ) 2 ( T I 2 + M T T R V ) + β V λ DU V
Similarly, as for structure I, the probability relationships for systems II and III were determined. Structure II consists of digital input modules DI with redundancy (1oo2), the processors CPU (2oo3), and the digital output module DO (2oo3).
Structure III consists of digital input modules DI with redundancy (1oo2), the processors CPU (1oo2), and the digital output module DO (1oo2). PFDavg value for this E/E/PE safety-related system was calculated using the reliability data from Table 10 based on PDS Data Handbook. SINTEF [41].
Table 11 shows the results for different architectures of subsystems of the E/E/PE safety-related system considered.
The analyst can assess results (Table 11) PFDavgSYS for various architectures of subsystems. However, special attention was paid to results relevant to the system structures in Figure 20Figure 22 and Figure 23. The assessment of results obtained shows that for the structure on Figure 20 this value is equal to 2.41 × 10⁻³, fulfilling the requirement of SIL2. For structure on Figure 21, the results for subsystems are shown in Table 11 in bold, and the resulting value for the system is 9.7 × 10⁻⁴, fulfilling the requirement of SIL3. However, for the structure on Figure 22, this value is equal to 1.52 × 10⁻³, fulfilling the requirement only of SIL2.
In PFDavg calculation of the E/E/PE safety-related system, the point value near the upper/lower limit of the ranges (probabilistic criteria for SIL levels) can be obtained. For instance, for the structure in Figure 21 PFDavg is equal to 9.7 × 10⁻⁴, fulfilling formally the requirement of SIL3, but this value is near probabilistic criterion for SIL2. Similarly, for structure in Figure 22 PFDavg is equal to 1.52 × 10⁻³ (SIL2), but the resulting value is near the probabilistic criterion for SIL3.
The PFDavg for the safety-related system was calculated as a point value. In Figure 24 the PFDavg point value was compared with SIL3 [10−4, 10−3) interval criterion. A lower factor μSILl for SIL3 is equal to 0.2, but the upper factor μSILu for SIL3 level is equal to 0.8.
The result (μSIL3l = 0.2 and μSIL3u = 0.8) for the given PFDavg value is useful for making an easier decision in regards to the SIL classification for the E/E/PE safety-related system considered.

5. Conclusions

Functional safety is an important element of system safety. It addresses those parts of safety that relate to the function of a system and ensures that the system causes no harm in response to its potential inputs or failures. The task of a safety-related system in the critical industrial installation is the reduction of risk according to accident scenarios. In critical installations, safety functions are implemented through industrial automation and control systems. They are usually designed as electrical and programmable electronic systems according to the requirements of the IEC 61508 and the IEC 61511 for safety instrumented systems (SIS).
In this paper, the concept of integrated functional safety and cybersecurity analysis is outlined with an emphasis on uncertainty factors. System safety depends on the quality of the industrial installation, which can be enhanced by applying protection layers, e.g., basic process control system, alarm system, human operator, and safety instrumented system. The causes of accidents in critical infrastructure depend on prospective weaknesses, initiation events, and internal hazards. The main task of cybersecurity is to protect the system against potential threats (internal and external) that compromise its assets and the environment. These two issues, providing safety and providing security in engineering systems, have been treated separately for decades as two individual domains. Nowadays, when inadequate security impact safety, it is necessary to address them jointly.
Dealing in an integrated and comprehensive way with the functional safety and cybersecurity analysis in critical installations is extremely important and remains a challenging issue. It is relatively common during the early stages of analysis to omit the security issues related to data communication and access restrictions to the system and its associated components. Nevertheless, these aspects, when neglected, may significantly impact safety and negatively influence the results of the analysis. In this article, a methodology to integrate the functional safety and security issues was presented and outlined for the calculation of SIL’s.
The approach proposed is illustrated on an example of a critical installation. Comprehensive integration of the functional safety and cybersecurity analysis in installations critical infrastructures is very important and it is currently a challenging issue. There is also a challenge to include cybersecurity aspects in designing distributed industrial control systems (ICS).
Future works will focus on designed computer-aided functional safety and cybersecurity integrated analysis software. and there is a chance to include the human reliability analysis in the functional safety and cybersecurity integrity approach. The limitation, in that case, would be limited time for diagnosis and action (time-window) for human reaction to protect the systems. For that reason, layers of protection for safety and cybersecurity are implemented in the industrial installation.

Author Contributions

Conceptualization, M.Ś and E.P.; methodology, M.Ś.; validation, M.Ś.; formal analysis, E.P and M.Ś.; investigation, E.P.; resources, M.Ś.; writing—original draft preparation, M.Ś. and E.P.; writing—review and editing, E.P and M.Ś; visualization, E.P and M.Ś.; supervision, M.Ś. and E.P. All authors have read and agreed to the published version of the manuscript.

Funding

This research was supported by Gdańsk University of Technology.

Institutional Review Board Statement

Not applicable.

Informed Consent Statement

Not applicable.

Data Availability Statement

Not applicable.

Conflicts of Interest

The authors declare no conflict of interest.

References

  1. Kosmowski, K.T. Functional Safety and Reliability Analysis Methodology for Hazardous Industrial Plants; Gdansk University of Technology: Gdansk, Poland, 2013. [Google Scholar]
  2. Śliwiński, M. Functional Safety and Information Security in the Critical Infrastructure Systems and Objects; Monographs 171; Gdansk University of Technology: Gdansk, Poland, 2018. [Google Scholar]
  3. Security for Industrial Automation and Control Systems; IEC 62443; International Electrotechnical Commission: Geneva, Switzerland, 2013.
  4. Functional Safety of Electrical/Electronic/Programmable Electronic Safety-Related Systems; IEC 61508; International Electrotechnical Commission: Geneva, Switzerland, 2010.
  5. Functional Safety: Safety Instrumented Systems for the Process Industry Sector; IEC 61511; International Electrotechnical Commission: Geneva, Switzerland, 2015.
  6. LOPA: Layer of Protection Analysis, Simplified Process Risk Assessment; Center for Chemical Process Safety, American Institute of Chemical Engineers: New York, NY, USA, 2001.
  7. Torres-Echeverria, A.C. On the use of LOPA and risk graphs for SIL determination. J. Loss Prev. Process Ind. 2016, 41, 333–343. [Google Scholar] [CrossRef]
  8. Subramanian, N.; Zalewski, J. Quantitative Assessment of Safety and Security of System Architectures for Cyberphysical Systems Using NFR Approach. IEEE Syst. J. 2016, 10, 397–409. [Google Scholar] [CrossRef]
  9. Śliwiński, M. Verification of safety integrity level for safety-related functions enhanced with security aspects. Process Saf. Environ. Prot. 2018, 118, 79–92. [Google Scholar] [CrossRef]
  10. Kriaa, S.; Pietre-Cambacedes, L.; Bouissou, M.; Halgand, Y. Approaches combining safety and security for industrial control systems. Reliab. Eng. Syst. Saf. 2015, 139, 156–178. [Google Scholar] [CrossRef]
  11. Piesik, E.; Śliwiński, M.; Barnert, T. Determining the safety integrity level of systems with security aspects. Reliab. Eng. Syst. Saf. 2016, 152, 259–272. [Google Scholar] [CrossRef]
  12. Gabriel, A.; Ozansoy, C.; Shi, J. Developments in SIL determination and calculation. Reliab. Eng. Syst. Saf. 2018, 177, 148–161. [Google Scholar] [CrossRef]
  13. Śliwiński, M.; Piesik, E. Integrated functional safety and cybersecurity analysis. IFAC Pap. OnLine 2018, 51, 1263–1270. [Google Scholar] [CrossRef]
  14. Saleh, J.H.; Cummings, A.M. Safety in the mining industry and the unfinished legacy of mining accidents. Saf. Sci. 2011, 49, 764–777. [Google Scholar] [CrossRef]
  15. Subramanian, N.; Zalewski, J. Use of the NFR Approach to Safety and Security Analysis of Control Chains in SCADA. IFAC Pap. OnLine 2018, 51, 214–219. [Google Scholar] [CrossRef]
  16. CYBER Methods and Protocols. Part. 1: Method and Pro Forma for Threat, Vulnerability, Risk Analysis (TVRA); Technical Specs, ETSI TS 102 165-1; European Telecommunications Standards Institute: Sophia Antipolis, France, 2017. [Google Scholar]
  17. Kosmowski, K.T.; Śliwiński, M. Knowledge-based functional safety and security management in hazardous industrial plants with emphasis on human factors. In Advanced Control and Diagnostic Systems; PWNT: Gdańsk, Poland, 2015. [Google Scholar]
  18. Information Technology Security Techniques—Evaluation Criteria for IT Security; ISO/IEC 15408; ISO: Geneva, Switzerland, 2009.
  19. Safety of Machinery—Guidance to Machinery Manufacturers for Consideration of Related IT Security (Cyber Security) Aspects; ISO/DTR 22100; ISO: Geneva, Switzerland, 2018.
  20. Safety of Machinery—Security Aspects to Functional Safety of Safety-Related—Control Systems; IEC TR 63074; International Electrotechnical Commission: Geneva, Switzerland, 2019.
  21. Information Technology—Information Security Management Systems—Overview and Vocabulary; ISO/IEC 27000; ISO: Geneva, Switzerland, 2018.
  22. Information Technology, Security Techniques, Information Security Management Systems; ISO/IEC 27001; ISO: Geneva, Switzerland, 2007.
  23. Information Technology, Security Techniques, Information Security Risk Management; ISO/IEC 27005; ISO: Geneva, Switzerland, 2011.
  24. Białas, A. Semiformal Common Criteria Compliant IT Security Development Framework, Studia Informatica; Silesian University of Technology Press: Gliwice, Poland, 2008. [Google Scholar]
  25. Risk Management—Guidelines; ISO 31000; International Organization for Standardization: Geneva, Switzerland, 2018.
  26. Braband, J. What’s Security Level got to do with Safety Integrity Level? In Proceedings of the ERTS 2016, Toulouse, France, 27–29 January 2016. [Google Scholar]
  27. Aven, T. A Framework for Risk Analysis Covering both Safety and Security. Reliab. Eng. Syst. Saf. 2007, 92, 745–754. [Google Scholar] [CrossRef]
  28. Kanamaru, H. Bridging Functional Safety and Cyber Security of SIS/SCS. In Proceedings of the SICE Annual Conference 2017, Kanazawa University, Kanazawa, Japan, 19–22 September 2017. [Google Scholar]
  29. Chockalingam, S.; Hadžiosmanović, D.; Pieters, W.; Teixeira, A.; van Gelder, P. A Survey of Integrated Safety and Security Risk Assessment Methods. In Proceedings of the CRITIS 2016, Paris, France, 10–12 October 2016; pp. 50–62. [Google Scholar]
  30. Abdo, H.; Kaouk, M.; Flaus, J.M.; Masse, F. Safety and Security Risk Analysis Approach to Industrial Control Systems. Comput. Secur. 2018, 72, 175–195. [Google Scholar] [CrossRef] [Green Version]
  31. Guide for Conducting Risk Assessments; Report NIST SP 800-30 Rev. 1; NIST: Gaithersburg, MD, USA, 2012.
  32. Goble, W.; Cheddie, H. Safety Instrumented Systems Verification: Practical Probabilistic Calculations; ISA: Pittsburgh, PA, USA, 2015. [Google Scholar]
  33. Smith, D.J. Reliability. In Practical Methods for Maintainability and Risk, 9th ed.; Elsevier: London, UK, 2017. [Google Scholar]
  34. Subramanian, N.; Zalewski, J. Safety and Security Integrated SIL Evaluation Using the NFR Approach. In Integrating Research and Practice in Software Engineering; Springer: Berlin/Heidelberg, Germany, 2020; pp. 53–68. [Google Scholar]
  35. Kościelny, J.M.; Syfert, M.; Fajdek, B. Modern Measures of Risk Reduction in Industrial Processes. J. Autom. Mob. Robot. Intell. Syst. 2019, 13, 20–29. [Google Scholar] [CrossRef]
  36. Hoyland, A.; Rausand, M. System Reliability Theory. In Models and Statistical Methods, 2nd ed.; John Wiley & Sons, Inc: Hoboken, NJ, USA, 2004. [Google Scholar]
  37. Kumamoto, H. Satisfying Safety Goals by Probabilistic Risk Assessment; Springer Series in Reliability Engineering; Springer: London, UK, 2007. [Google Scholar]
  38. Hokstad, P. A generalisation of the beta factor model. In Proceedings of the European Safety & Reliability Conference, Berlin, Germany, 14–18 June 2004. [Google Scholar]
  39. Grøtan, T.O.; Jaatun, M.G.; Øien, K.; Onshus, T. The SeSa Method for Assessing Secure Access to Safety Instrumented Systems; Report SINTEF A1626; SINTEF: Trondheim, Norway, 2007. [Google Scholar]
  40. SESAMO. Security and Safety Modelling; Artemis JU Grant Agreement 295354, April 2014; European Commission: Brussels, Belgium, 2014. [Google Scholar]
  41. SINTEF. Reliability Data for Safety Instrumented Systems; PDS Data Handbook; SINTEF: Trondheim, Norway, 2010. [Google Scholar]
Figure 1. Allocation of requirements to the safety-related systems.
Energies 14 02227 g001
Figure 2. General configuration of a safety system (A)—sensors, (B)—safety PLC, (C)—final elements.
Energies 14 02227 g002
Figure 3. Relationship between functional safety and cybersecurity of ICS systems [19,20].
Energies 14 02227 g003
Figure 4. Risk Cube (SIL-SAL).
Energies 14 02227 g004
Figure 5. Risk Cube SIL-SAL (col.).
Energies 14 02227 g005
Figure 6. Risk Cube (SIL-EAL).
Energies 14 02227 g006
Figure 7. Risk Cube SIL-EAL (col.).
Energies 14 02227 g007
Figure 8. Procedure using cybersecurity factors in safety analysis [13].
Energies 14 02227 g008
Figure 9. The procedure of SIL or PL determining the cybersecurity aspects.
Energies 14 02227 g009
Figure 10. Example structure of the E/E/PE system (SIS or BPCS).
Energies 14 02227 g010
Figure 11. Reliability block diagram RBD of an example E/E/PE or SIS system structure.
Energies 14 02227 g011
Figure 12. Fault tree for SIS system.
Energies 14 02227 g012
Figure 13. Programmable electronic system with two channels.
Energies 14 02227 g013
Figure 14. Contribution of common cause failures to the failures of individual channels and the entire 1oo2 system [4,36,38].
Energies 14 02227 g014
Figure 15. Reliability block diagram for 1oo2 E/E/PE system.
Energies 14 02227 g015
Figure 16. P&ID of a high-pressure tank.
Energies 14 02227 g016
Figure 17. Automatic safety-related loop of E/E/PES.
Energies 14 02227 g017
Figure 18. Elements of the average probability of an E/E/PE subsystem failure on demand.
Energies 14 02227 g018
Figure 19. Verification of safety integrity level for a point value of PFDavg.
Energies 14 02227 g019
Figure 20. The structure I of E/E/PE safety-related system.
Energies 14 02227 g020
Figure 21. FT structure I model of E/E/PE safety-related system.
Energies 14 02227 g021
Figure 22. Structure II of E/E/PE safety-related system.
Energies 14 02227 g022
Figure 23. Structure III of E/E/PE safety-related system.
Energies 14 02227 g023
Figure 24. PFDavg evaluation with membership function for SIL3 [10−4, 10−3) probabilistic criterion.
Energies 14 02227 g024
Table 1. SIL probabilistic criteria.
SILPFDavgPFH [h−1]
4[10−5, 10−4)[10−9, 10−8)
3[10−4, 10−3)[10−8, 10−7)
2[10−3, 10−2)[10−7, 10−6)
1[10−2, 10−1)[10−6, 10−5)
Table 2. Example of an extended risk matrix for determining safety integrity level.
Categories:
Fatality →
Frequency ↓
NA
(10−3, 10−2]
Injury
NB
(10−2, 10−1]
More Injuries
NC
(10−1, 1]
Single Fatality
ND
(1, 10]
Several Fatalities
NE
(10, 102]
Many Fatalities
W3 [a−1],
Fd (1, 10]
Frequent
aSIL3x
SIL2y; ↓10−3
SIL1x
SIL4z
SIL3y; ↓10−4
SIL2x
bz
SIL4y; ↓10−5
SIL3x
bz
by
bx
W2 [a−1],
Fc (10−1, 1]
Probable
SIL2z
SIL1y; ↓10−2
ax
SIL3z
SIL2y; ↓10−3
SIL1x
SIL4z
SIL3y; ↓10−4
SIL2x
bz
SIL4y; ↓10−5
SIL3x
W1 [a−1],
Fb (10−2, 10−1]
Occasional
SIL1z
ay; ↓10−1
SIL2z
SIL1y; ↓10−2
ax
SIL3x
SIL2y; ↓10−3
SIL1x
SIL4z
SIL3y; ↓10−4
SIL2x
W0 [a−1],
Fa (10−3, 10−2]
Seldom
SIL1z
ay; ↓10−1
SIL2z
SIL1y; ↓10−2
ax
SIL3x
SIL2y; ↓10−3
SIL1x
Table 3. Cybersecurity levels (SAL).
SAL1Protection against casual or coincidental violation
SAL2Protection against intentional violation using simple means with low resources, generic skills, and low motivation
SAL3Protection against intentional violation using sophisticated means with moderate resources, system-specific skills and moderate motivation
SAL4Protection against intentional violation using sophisticated means with extended resources, system-specific skills, and high motivation
Table 4. Levels of cybersecurity (EALs and SALs).
Evaluation Assurance LevelSecurity Assurance LevelCybersecurity
EAL1SAL1Low
EAL2SAL1Low
EAL3SAL2Medium
EAL4SAL2Medium
EAL5SAL3High
EAL6SAL4High
EAL7SAL4High
Table 5. Risk Matrix Regarding Cybersecurity Issues at the Critical Infrastructure Facility.
The Degree of Risk Rcs and the Associated Security Assurance Level SALProbability and/or Frequency of a Cyber-Attack
LowMediumHighVery High
Severity of the consequences Ccatastrophicmedium Rcs
SAL2
high Rcs
SAL3
very high Rcs
SAL4
very high Rcs
SAL4
criticalmedium Rcs
SAL2
high Rcs
SAL3
very high Rcs
SAL4
very high Rcs
SAL4
marginallow Rcs
SAL1
medium Rcs
SAL2
medium Rcs
SAL2
high Rcs
SAL3
minorlow Rcs
SAL1
low Rcs
SAL1
medium Rcs
SAL2
high Rcs
SAL3
Table 6. Risk Matrix Regarding Information Security Issues in a Critical Infrastructure Facility.
The Degree of Rsec Risk and the Associated Evaluation Assurance Level EALProbability and/or Frequency of a Cyber-Attack
LowMediumHighVery High
Severity of the consequences Ccatastrophicmedium Rsec
EAL3
high Rsec
EAL5
very high Rsec
EAL6
very high Rsec
EAL7
criticalmedium Rsec
EAL2
medium Rsec
EAL4
very high Rsec
EAL6
very high Rsec
EAL6
marginallow Rsec
EAL1
medium Rsec
EAL3
high Rsec
EAL5
high Rsec
EAL5
minorlow Rsec
EAL1
low Rsec
EAL2
medium Rsec
EAL4
medium Rsec
EAL4
Table 7. Risk Matrix for Functional Safety Issues.
Rfs Risk and Associated SIL Safety Integrity LevelProbability and/or Frequency of Failure
LowMediumHighVery High
Severity of the consequences Ccatastrophicmedium Rfs
SIL2
high Rfs
SIL3
very high Rfs
SIL4
very high Rfs
b
criticalmedium Rfs
SIL2
high Rfs
SIL3
very high Rfs
SIL4
very high Rfs
SIL4
marginallow Rfs
SIL1
medium Rfs
SIL2
high Rfs
SIL3
high Rfs
SIL3
minorvery low Rfs
a
low Rfs
SIL1
medium Rfs
SIL2
medium Rfs
SIL2
Table 8. Reliability data.
SubsystemdPTI/IPLCSDVSOV
λDU [h−1]2.24 × 10−71.1 × 10−75.2 × 10−111 × 10−71.14 × 10−8
TI [y]11111
Table 9. Results for different β factor for redundant E/E/PE system.
SubsystemPFDavg
β = 0β = 0.05β = 0.1
dPT (1oo2)1.28 × 10−65.02 × 10−59.92 × 10⁻⁵
I/I (1oo2)3.09 × 10−72.44 × 10−54.84 × 10⁻⁵
PLC2.28 × 10−72.28 × 10−72.28 × 10−7
SDV4.38 × 10−44.38 × 10−44.38 × 10−4
SOV4.99 × 10−54.99 × 10−54.99 × 10−5
System5.38 × 10−45.63 × 10−46.36 × 10−4
SIL333
Table 10. Reliability data.
PSTSDICPUDOV
λ [h−1]4 × 10−62 × 10−61.2 × 10−62.2 × 10−66.5 × 10−71.6 × 10−6
FS [%]50%50%50%50%50%50%
λD [h−1]2 × 10−61 × 10−65.46 × 10−71.04 × 10−63.1 × 10−76.5 × 10−7
λS [h−1]2 × 10−61 × 10−65.46 × 10−71.04 × 10−63.1 × 10−76.5 × 10−7
DC [%]90%90%90%90%90%90%
λDD [h−1]1.8 × 10−69 × 10−74.91 × 10−79.38 × 10−72.79 × 10−75.85 × 10−7
λDU [h−1]2 × 10−71 × 10−75.46 × 10−81.04 × 10−73.1 × 10−86.5 × 10−8
λSD [h−1]1.8 × 10−69 × 10−74.91 × 10−79.38 × 10−72.79 × 10−75.85 × 10−7
λSU [h−1]2 × 10−71 × 10−75.46 × 10−81.04 × 10−73.1 × 10−86.5 × 10−8
MTTR [h]888888
TI [y]111111
β0.020.020.020.020.020.02
Table 11. Result for different E/E/PE architectures.
PSTSDICPUDOV
PFDavg1oo18.78 × 10−34.39 × 10−32.39 × 10−34.57 × 10−31.36 × 10−32.85 × 10⁻³
PFDavg1oo22.76 × 10−41.13 × 10−45.53 × 10−51.19 × 10−42.96 × 10−56.76 × 10⁻⁵
PFDavg2oo34.77 × 10−41.63 × 10−47.03 × 10−51.73 × 10−43.45 × 10−58.88 × 10⁻⁵
SILelem334344
PFDavgSYS9.7 × 10−4
SILSYS3
Publisher’s Note: MDPI stays neutral with regard to jurisdictional claims in published maps and institutional affiliations.