Article

Effect of Temperature Conditions on Flame Evolutions of Turbulent Jet Ignition

1
State Key Laboratory of Engines, Tianjin University, Tianjin 300072, China
2
Guangzhou Institute of Energy Conversion, Chinese Academy of Sciences, Guangzhou 510640, China
*
Author to whom correspondence should be addressed.
Energies 2021, 14(8), 2226; https://doi.org/10.3390/en14082226
Submission received: 24 March 2021 / Revised: 1 April 2021 / Accepted: 9 April 2021 / Published: 16 April 2021
(This article belongs to the Special Issue Trends and Prospects in Engine Combustion)

Abstract

:
Turbulent jet ignition technology can significantly improve lean combustion stability and suppress engine knocking. However, the narrow jet channel between the pre-chamber and the main chamber leads to some difficulties in heat exchange, which significantly affects combustion performance and mechanical component lifetime. To clarify the effect of temperature conditions on combustion evolutions of turbulent jet ignition, direct numerical simulations with detailed chemical kinetics were employed under engine-relevant conditions. The flame propagation in the pre-chamber and the early-stage turbulent jet ignition in the main chamber were investigated. The results show that depending on temperature conditions, two types of flame configuration can be identified in the main chamber, i.e., the normal turbulent jet flame propagation and the spherical flame propagation, and the latter is closely associated with pressure wave disturbance. Under low-temperature conditions, the cold jet stoichiometric mixtures and the vortexes induced by the jet flow determine the early-stage flame development in the main chamber. Under intermediate temperature conditions, pre-flame heat release and leading pressure waves are induced in the jet channel, which can be regarded as a transition of different combustion modes. Whereas under high-temperature conditions, irregular auto-ignition events start to occur, and spherical flame fronts are induced in the main chamber, behaving faster flame propagation.

1. Introduction

Lean combustion has an enormous potential in improving thermal efficiency while reducing pollution emissions [1,2]. However, lean combustion often suffers from combustion instabilities due to poor ignition robustness and slow flame propagation. Therefore, various ignition enhancement technologies have been proposed, including plasma ignition [3], laser ignition [4], and turbulent jet ignition [5,6]. Among them, turbulent jet ignition can enhance turbulence, and it extends combustion limits as well as engine knocking inhibition [7,8].
Turbulent jet ignition has been extensively studied during the past decade. On the experimental side, the effect of spark-ignition position [9], nozzle geometry [10,11], and the number of jet nozzles [12] on turbulent jet ignition systems have been studied. With the development of ignition and combustion technology, the turbulent jet ignition system (i.e., pre-chamber) becomes generally small in volume (only 1~5%). Due to the difficulties in experiments, most relevant studies have been conducted using numerical simulations [13,14,15,16]. Reddy et al. [17] numerically found that the flame kernel size in the pre-chamber did not play any role in ignition processes when flame diameter reached a critical threshold. Qin et al. [18] numerically studied ignition and flame propagation characteristics, and they found that the primary influence of the pre-chamber on the main chamber was mainly ascribed to seeding unburned mixture, intermediate radicals, and promoting turbulent flame propagation. Recently, Validi et al. [19,20] numerically observed an extensive localized fame extinction and re-ignition event in the ultra-lean mixtures through direct numerical simulations.
In the above studies, useful insights into ignition and combustion characteristics have been provided. However, few studies address the influence of temperature conditions on turbulent jet ignition, which can significantly affect combustion performance at a wide range of conditions. In the actual engines, the pre-chamber and the main chamber are connected through narrow jet orifices, which inevitably results in poor heat exchange and thereby a high-temperature condition in the pre-chamber. The combustion evolutions will become more complicated, and irregular combustion events may be encountered (e.g., irregular ignition events [21]). In severe cases, there will be irreversible damage to pre-chamber components. Besides, pressure wave refection and superposition will become more prevalent in the confined pre-chamber. However, the role of pressure wave disturbance in combustion evolutions and turbulent jet ignition remains unclear.
With the above considerations, the objectives of the current work were to clarify the effect of temperature conditions on the combustion evolutions of turbulent jet ignition, allowing for pressure wave disturbance. Two-dimensional direct numerical simulations were employed to investigate the flame development in the pre-chamber and the early-stage turbulent jet ignition in the main chamber. Hydrogen fuel with fast flame speed and clear chemistry pathways was employed in the turbulent jet ignition system with a constant-volume configuration [22,23]. Stoichiometric and lean hydrogen/air mixtures were filled in the pre-chamber and the main chamber, respectively. The current work may provide useful insights into the combustion optimization of turbulent jet ignition systems.

2. Computation Modeling and Methodology

2.1. Governing Equations

In this work, the conservation equations for two-dimensional multi-components unsteady reactive compressible flows were solved in the followings:
U t + F x + H y = S c h e m
U = ( ρ u ,   ρ v , ρ e , ρ Y 1 , , ρ Y N ) T
  S c h e m = ( 0 , 0 , 0 , ω ˙ 1 , , ω ˙ N ) T
F = ( ρ u 2 + p τ x x ρ u v τ x y ( ρ e + p ) u ( u τ x x + v τ x y q x ) ρ Y 1 ( u V x , 1 ) ρ Y N ( u V x , N ) )
H = ( ρ u v τ y x ρ v 2 + p τ y y ( ρ e + p ) v ( u τ y x + v τ y y q y ) ρ Y 1 ( v V y , 1 ) ρ Y N ( v V y , N ) )
where ρ ,   p ,   u ,   v , and e are the density, the pressure, the velocity in the x-axis, the velocity in the y-axis, and the total energy per unit mass, respectively; Y i , ω ˙ i , V x , i , and V y , i are the mass fraction, the mass production rate, the diffusion velocity in the x-axis, and the diffusion velocity in the y-axis of the i th species, respectively; N is the number of species considered.
The viscous stress tensors can be expressed by:
τ x x = μ ( 4 3 u x 2 3 v y )
τ x y = τ y x = μ ( v x + u y )
τ y y = μ ( 4 3 v y 2 3 u x )
where μ is the kinetic viscosity.
The heat flux is given by:
q x = k T x ρ i = 1 N h i D i Y i x
q y = k T y ρ i = 1 N h i D i Y i y
where h i is the specific enthalpy of the i th species, k is the coefficient of thermal conductivity, D i is the diffusion coefficient of the i th species to the rest of the mixture, and T is the temperature.
The specific enthalpy of the mixture is given by:
h = i = 1 N Y i h i .
The total energy per unit mass is given by:
e = h p ρ + u 2 + v 2 2 .
The ideal gas state equation can be expressed by:
p = ρ R u T i = 1 N Y i W i
where R u is the universal gas constant, and W i is the molar mass of the i th species. More information about governing equations can be found in the previous literature [24,25].

2.2. Numerical Methods

In the simulations, the Godunov splitting method was employed to decouple the chemically reactive source term and hydrodynamic transport equations. A fourth-order semi-implicit Runge–Kutta method was used for time integration. The second-order weighted essentially non-oscillatory (WENO) scheme was used for convection terms, and the second-order central difference (CD) scheme was used for diffusion terms. The structured mesh with adaptive mesh refinement was employed to resolve the multi-physical issues involving flame propagation, pressure wave, and turbulence flow. The dynamic time step was adjusted during computation, and the Courant–Friedrichs–Lewy (CFL) number was maintained at 0.6. These numerical methods have been extensively adopted in the studies of auto-ignition, flame propagation, shock wave, and detonation development. More details on numerical schemes and code validation can be found in the literature [26,27,28,29,30]. Besides, a detailed chemical mechanism for hydrogen oxidation with 9 species and 25 elementary reactions was employed [31].

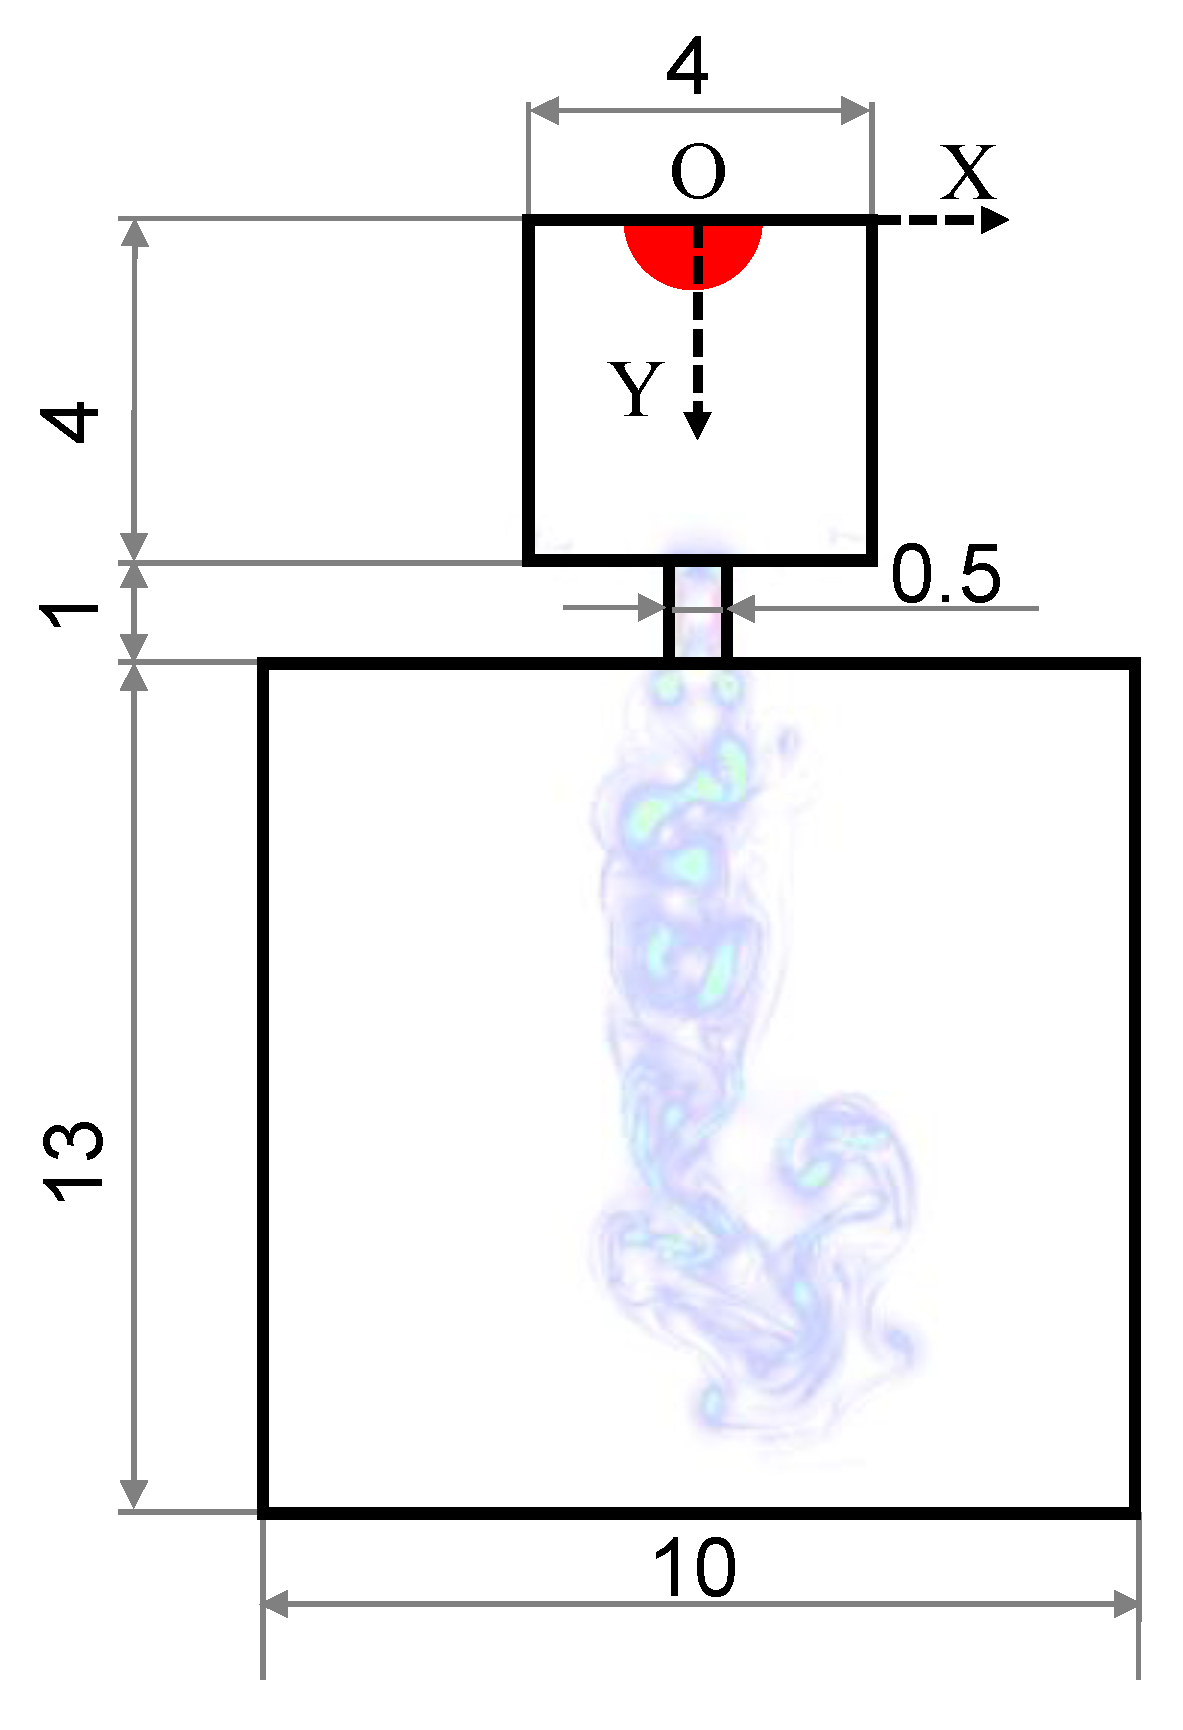
2.3. Computation Conditions

Figure 1 shows the structure and geometry parameters. A two-dimensional computation domain was employed, with a quadrate pre-chamber by 4 × 4 mm, a rectangular main chamber by 13 × 10 mm, and a rectangular jet nozzle by 1 × 0.5 mm. In this configuration, the area ratio between the pre-chamber and the main chamber was 0.12. Adiabatic reflective boundary conditions were employed for simulations. The main purpose of the current work was to clarify the effect of temperature conditions on turbulent jet ignition, addressing the role of pressure waves and auto-ignition events in flame development. Since it does not involve quantitative analysis of turbulence but qualitatively explores the flame-pressure interaction, a simplified two-dimensional model is used [18]. A similar simplified two-dimensional model has been proven to be reliable [32,33]. Stoichiometric H2/air mixtures ( φ P = 1.0) were employed in the pre-chamber, and lean mixtures with φ M = 0.6 were employed in the main chamber. The spark-ignition was located at the top center of the pre-chamber, and flame kernel was initiated by a spherical hot-spot with a radius of 0.75 mm and a homogeneous temperature of 2000 K. Four different initial temperatures were performed in the pre-chamber, i.e., T P = 900, 1000, 1100, and 1200 K. Considering the difference in heat exchange capability, the initial temperature of the main chamber (TM) was lower than the pre-chamber by 40 K. For all simulation cases, the initial pressure was maintained at P = 8.5 atm. Table 1 gives the initial thermodynamic conditions for numerical simulations.

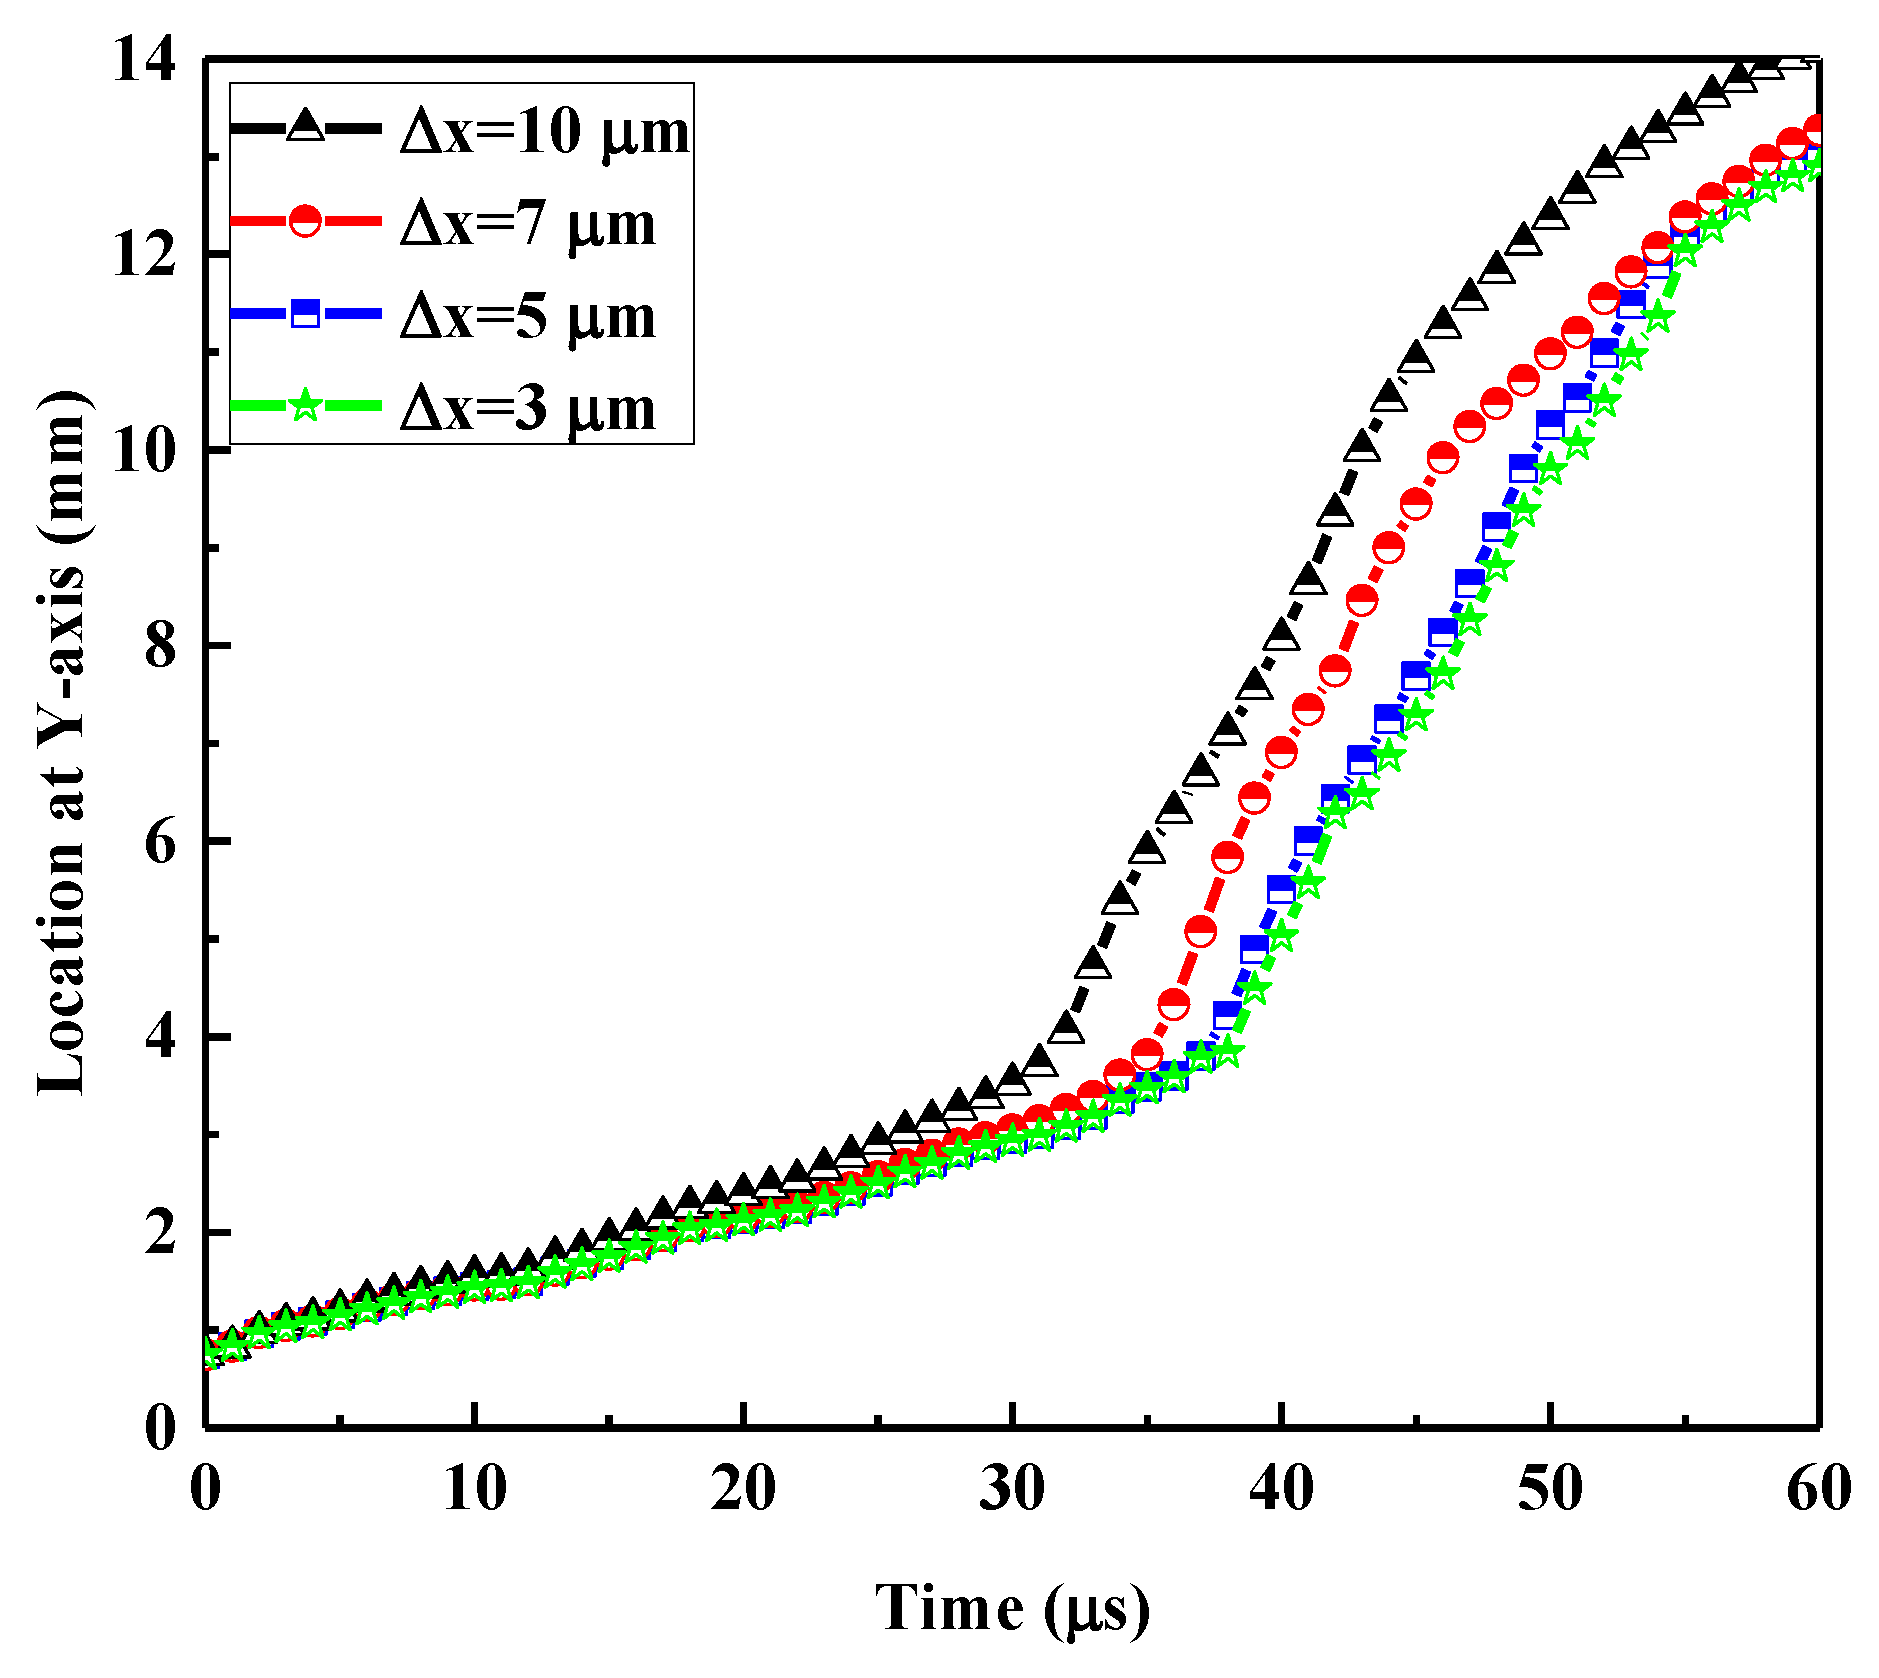
2.4. Independence of Computation Mesh

To demonstrate the independence of computation mesh, four different levels of adaptive mesh refinement were performed based on basic mesh size of 40 μ m . Figure 2 shows the evolutions of flame front location predicted by different computation meshes for Case A. With the adaptive mesh refinement strategy, the smallest mesh size could reach Δ x = 10, 7, 5, and 3 μ m , respectively. It was observed that flame propagation was non-sensitive to the variations of mesh size for the pre-chamber. However, the discrepancy in the flame front location became much larger when the flame front reached the jet orifice and the main chamber. Specifically, the cases with Δ x = 5 and 3 μ m almost shared an identical trajectory, whereas the cases with Δ x = 10 and 7 μ m overpredicted flame propagation. Considering the balance of computation expense and computation accuracy, the smallest mesh size of Δ x = 5 μ m with a basic mesh size of 40 μ m was eventually adopted. At this resolution, one case took about 20,160 CPU core-hours with a Cray XE6 cluster.

3. Results

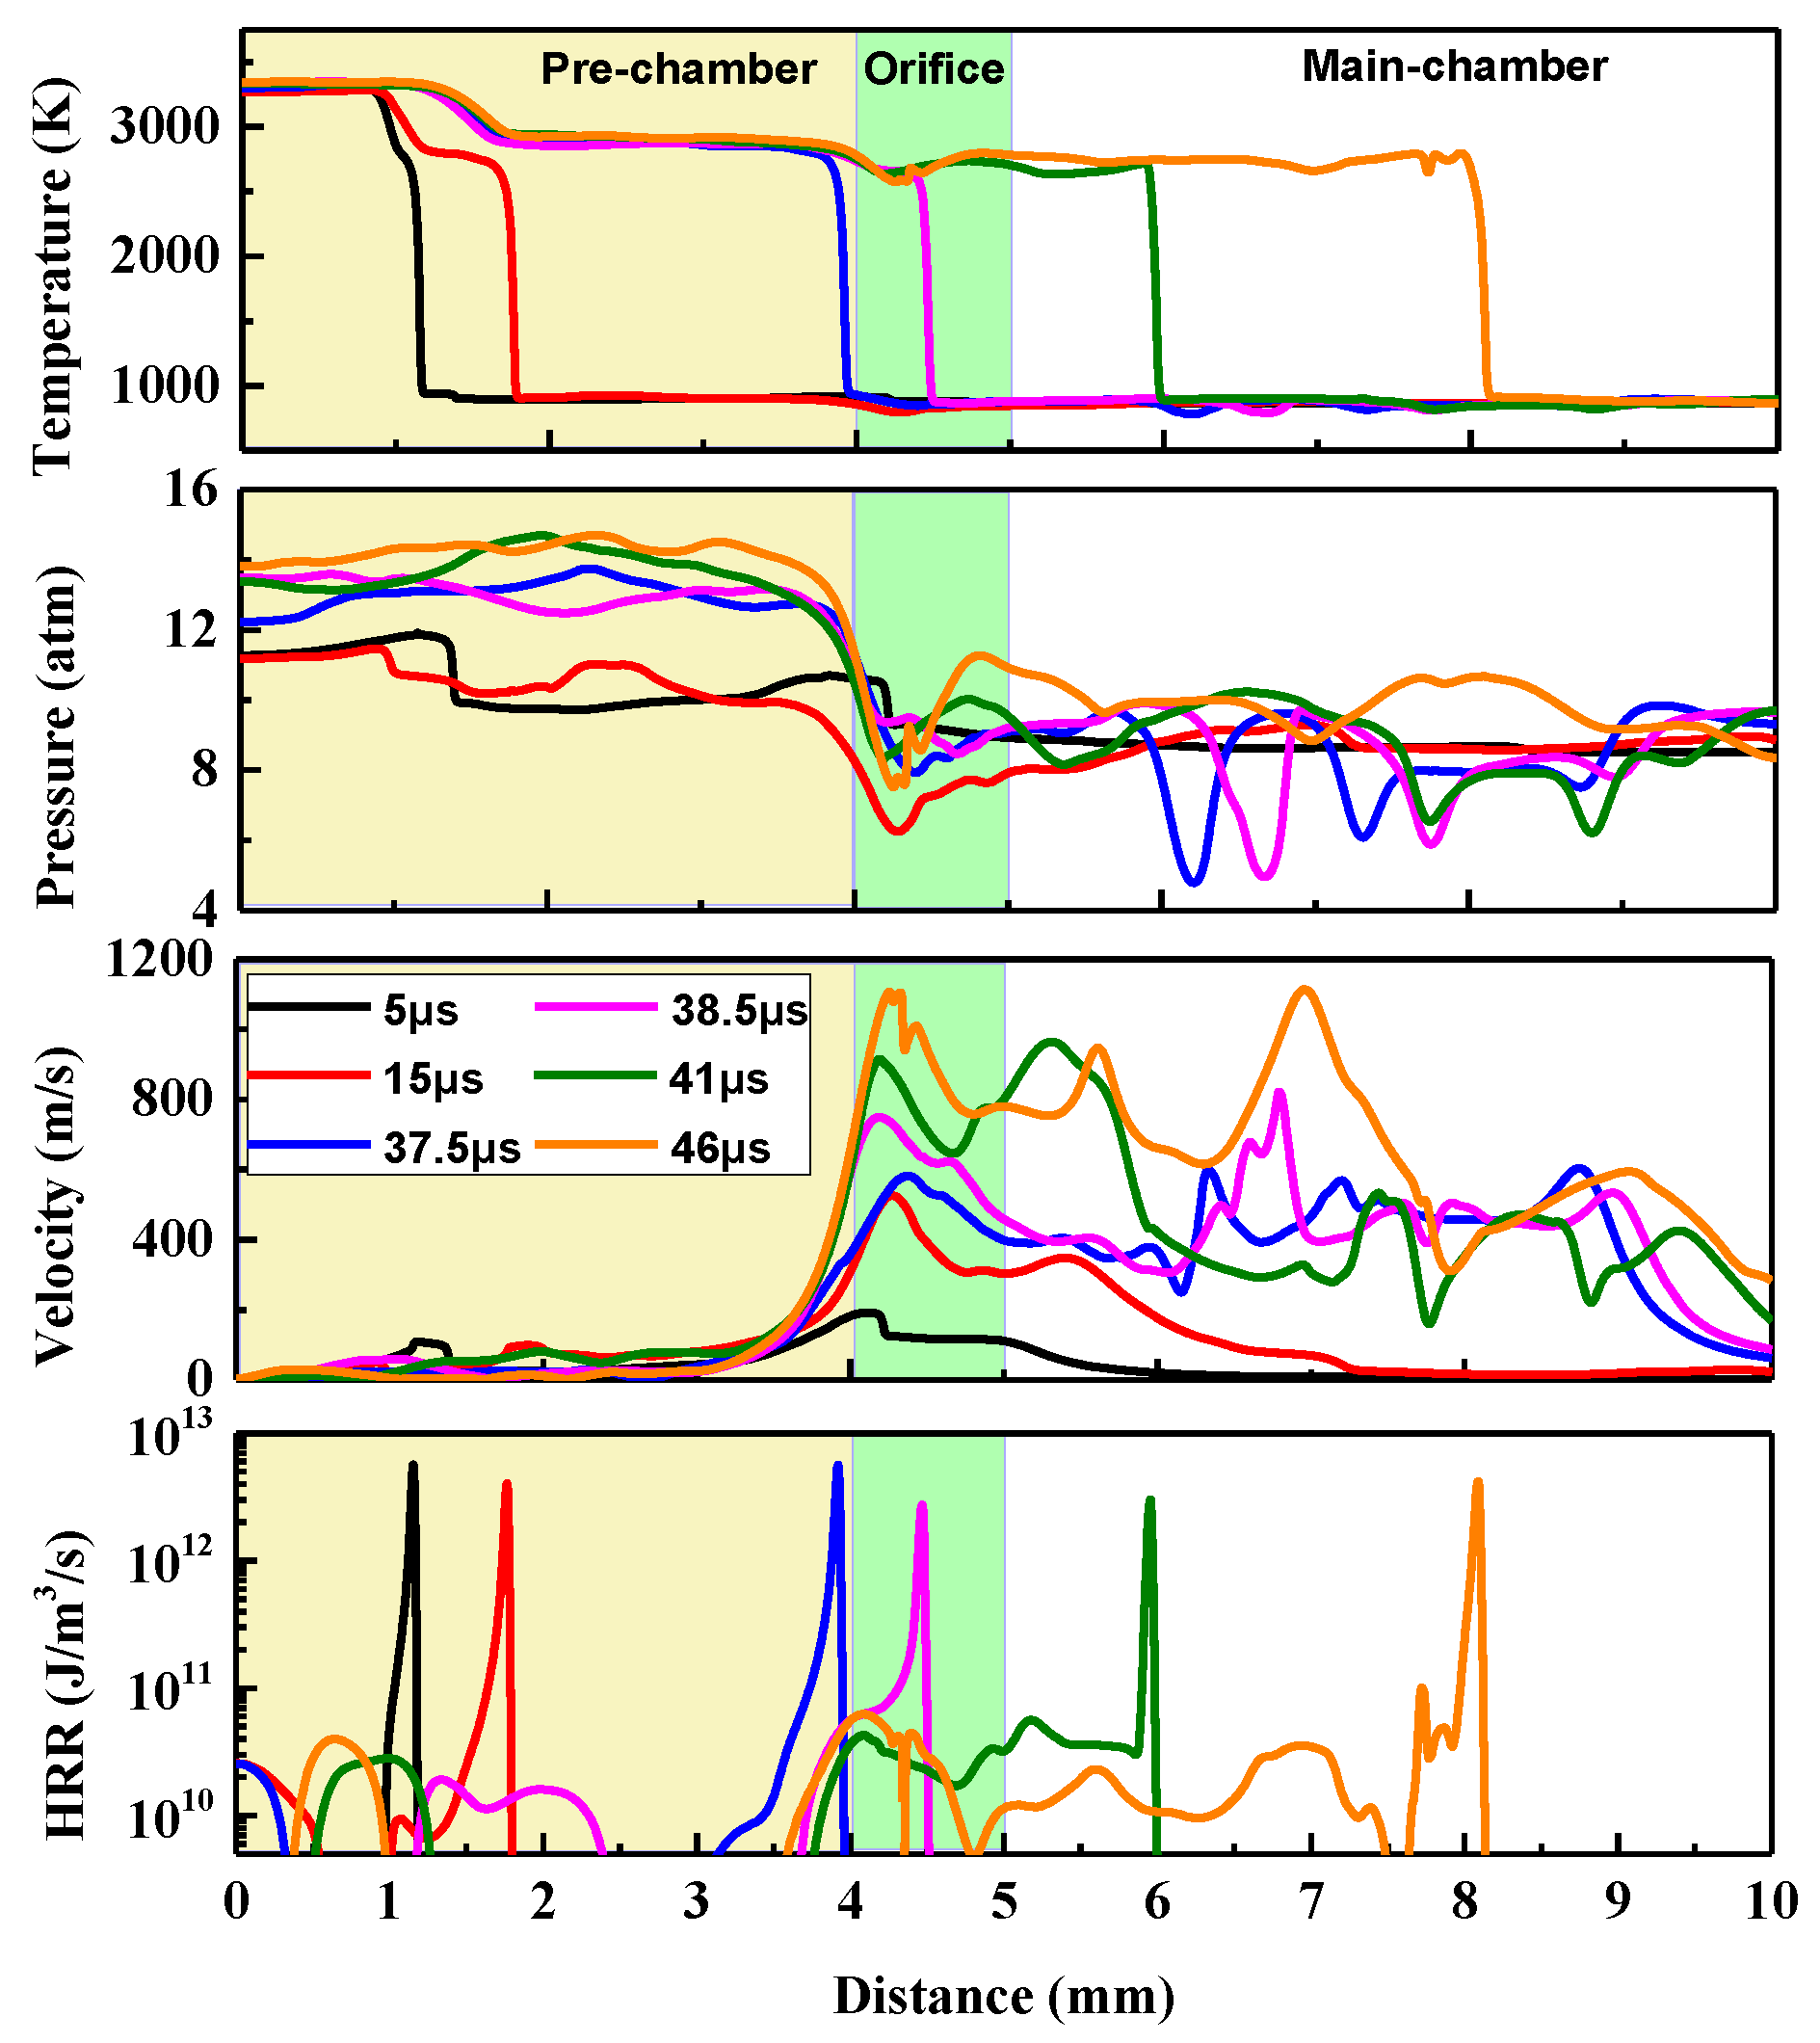
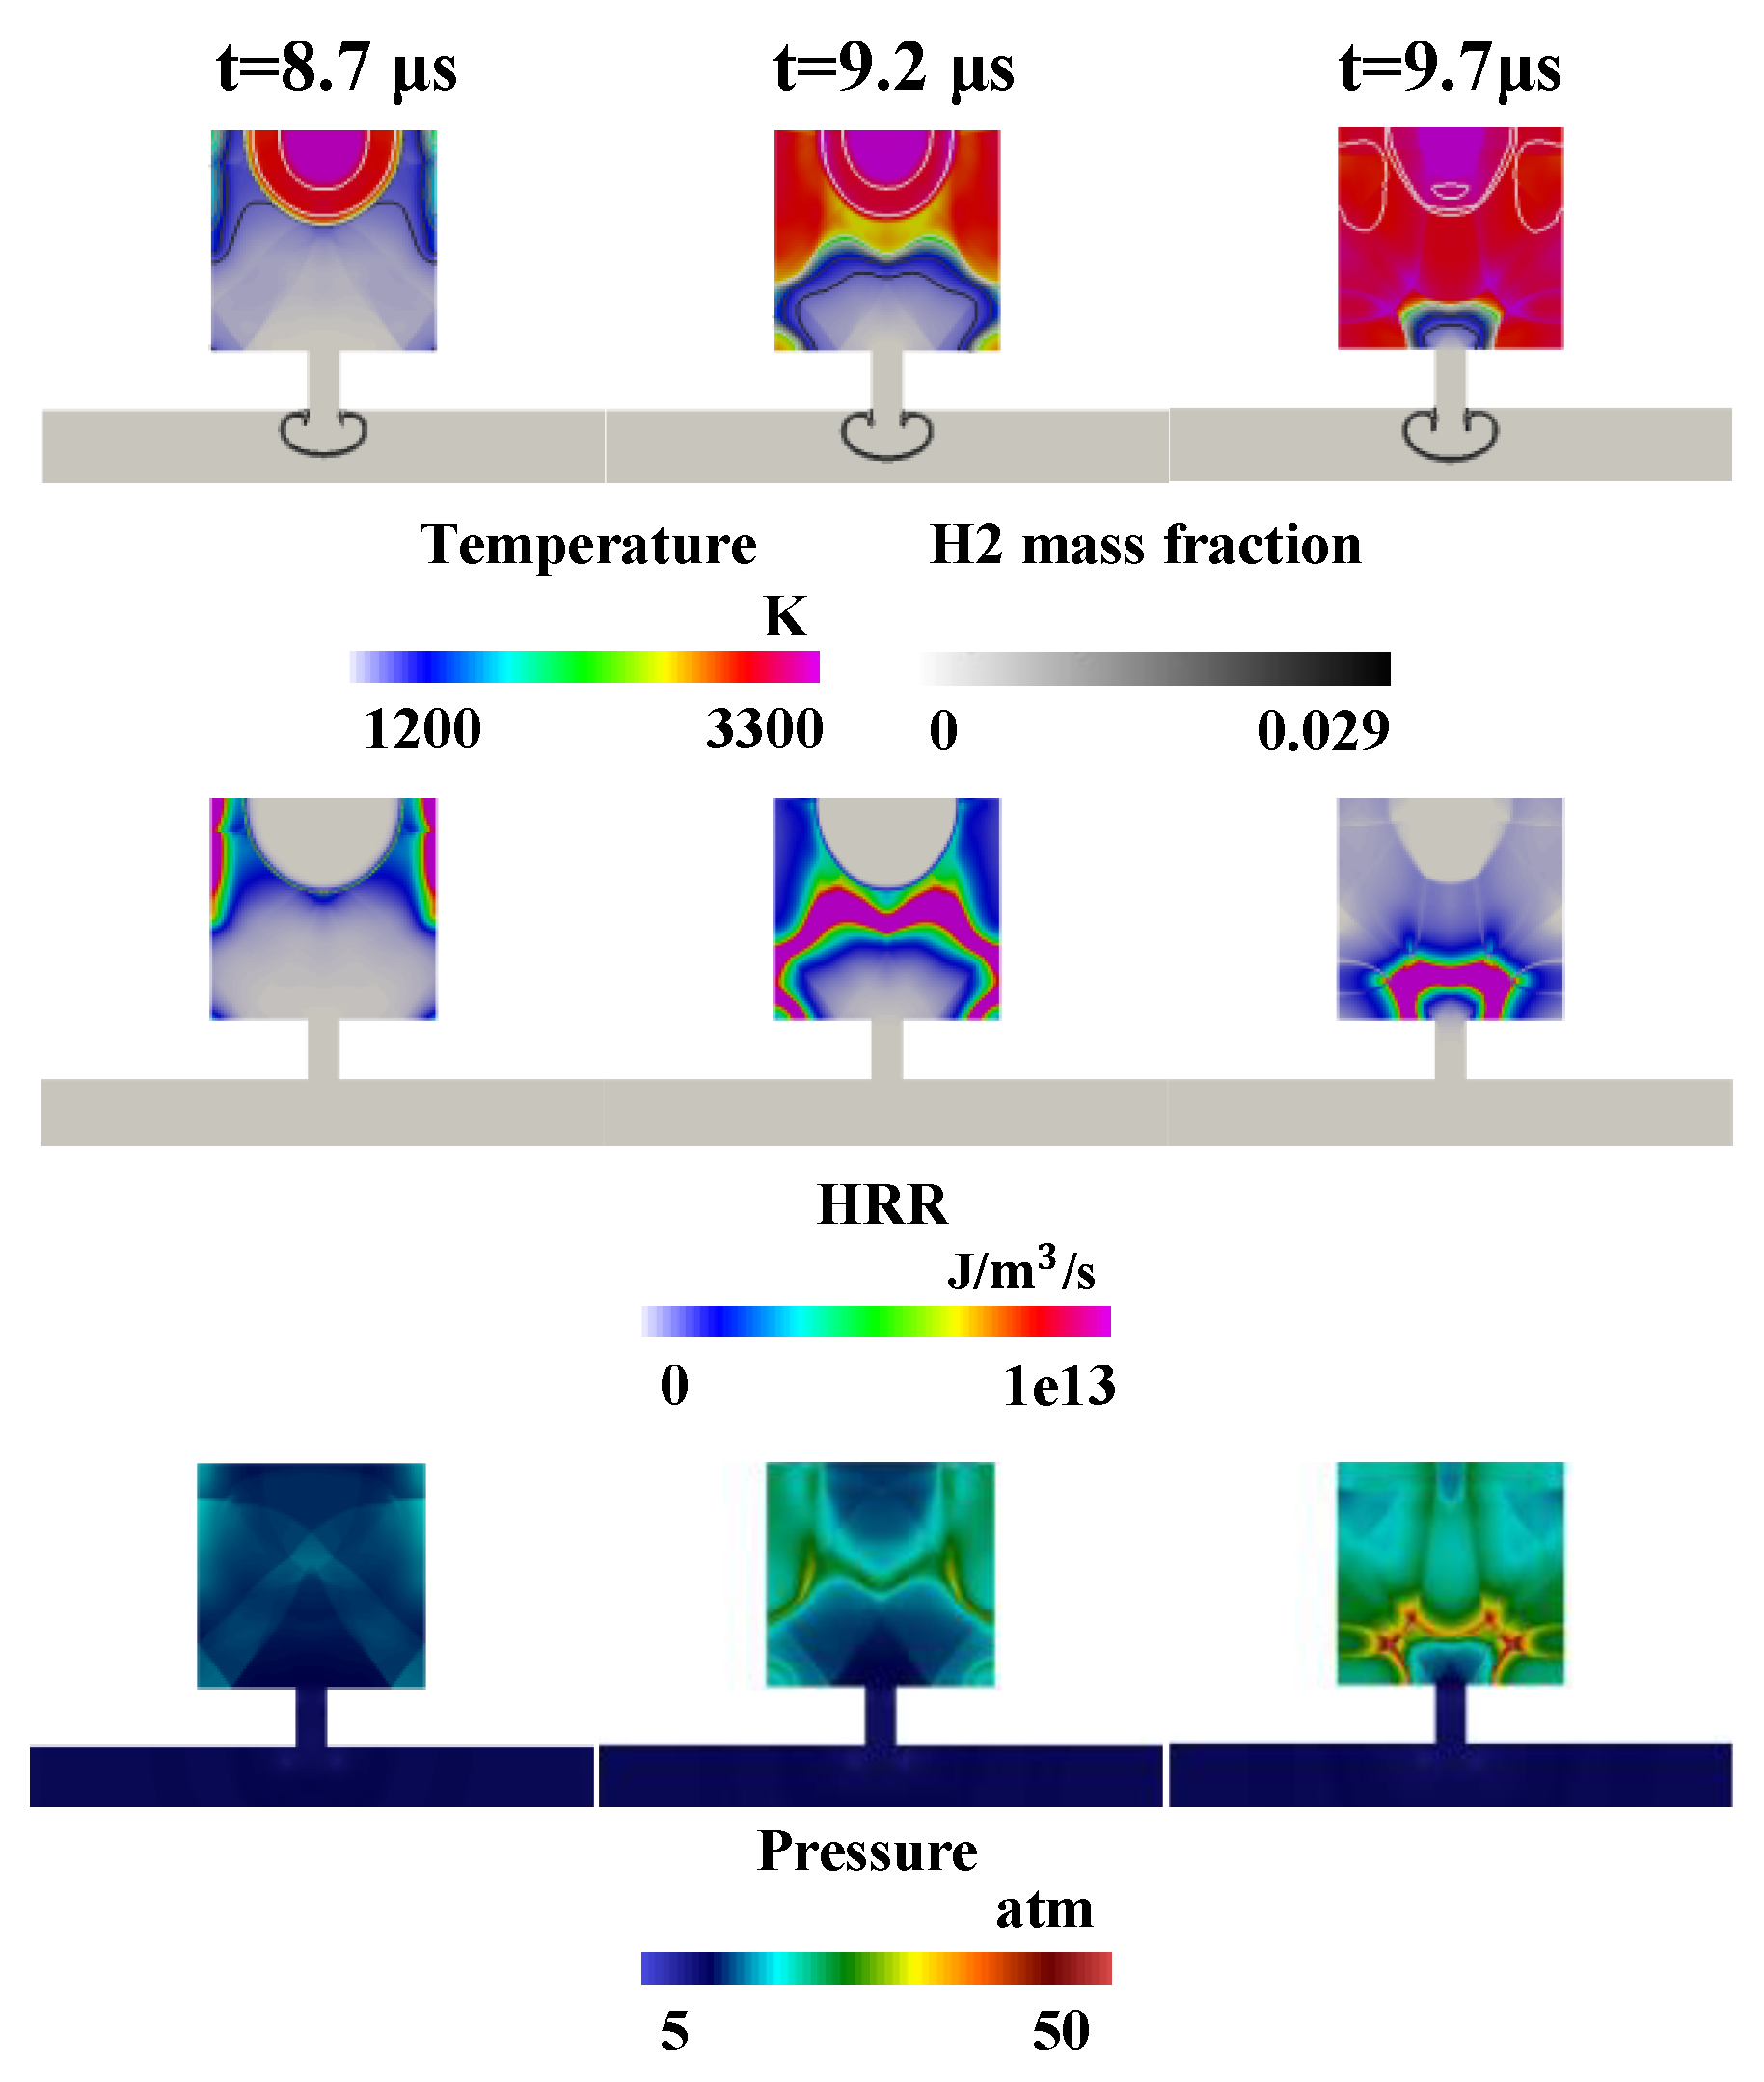
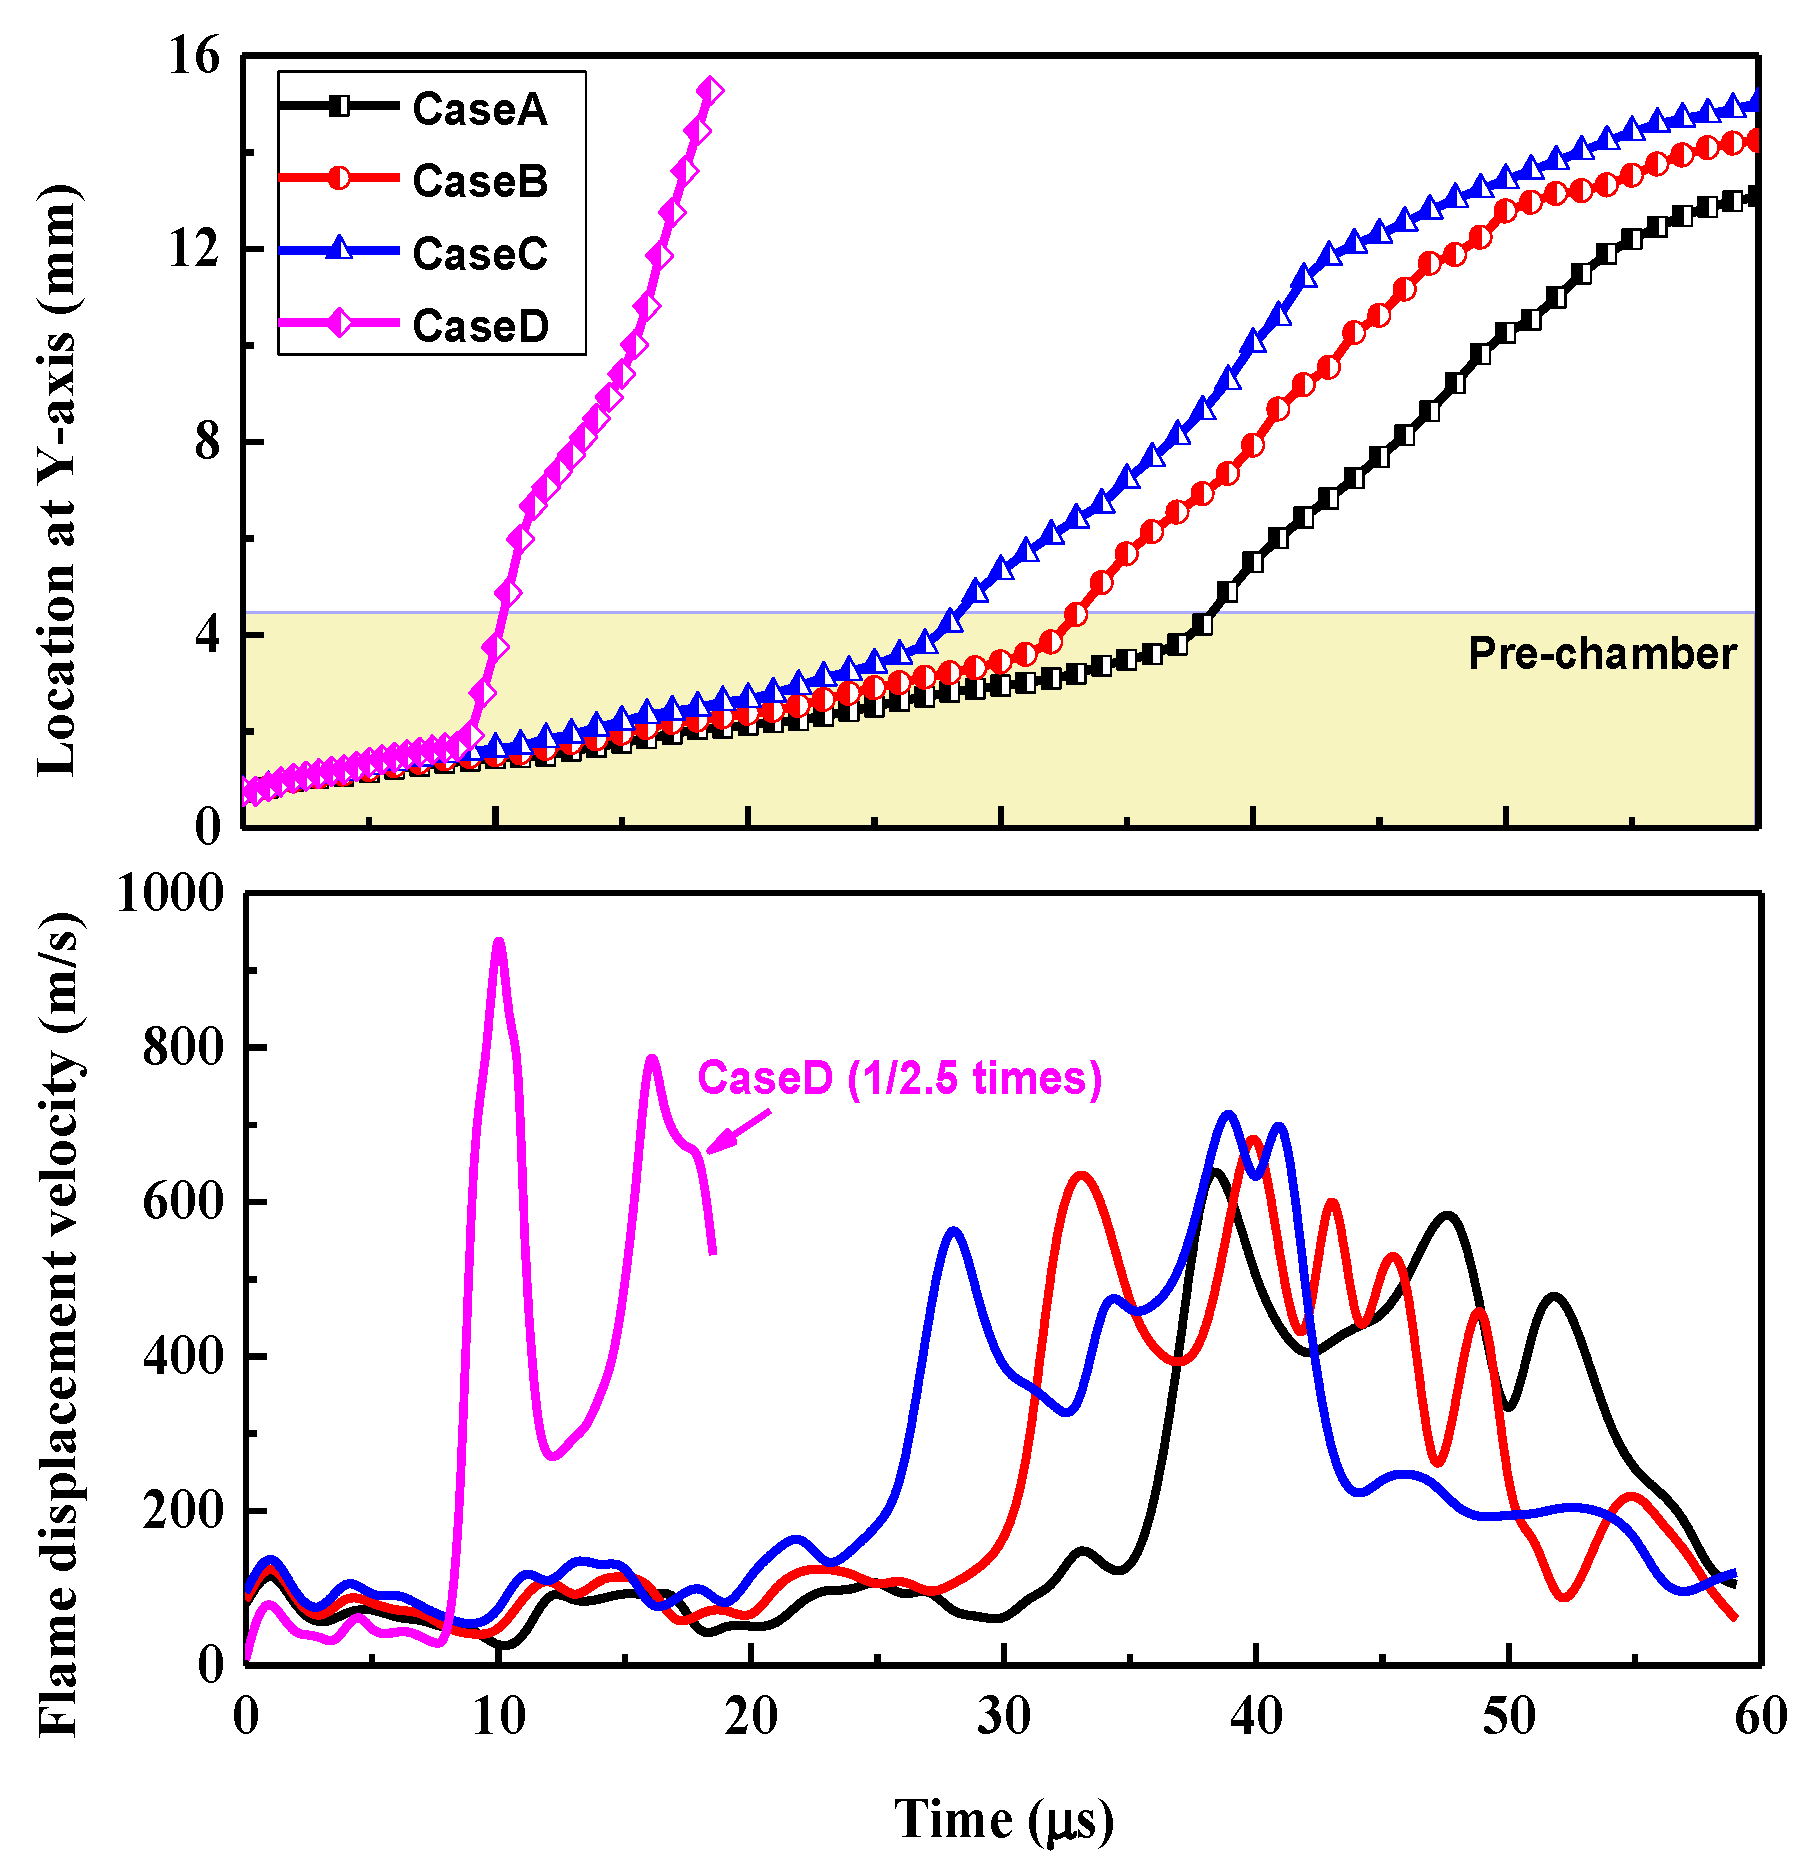
3.1. Normal Combustion for Turbulent Jet Ignition at Low Temperatures

Figure 3 shows the contours of temperature, H2 mass fraction, and density gradient in the pre-chamber at T p = 900 K. It is observed that a normal combustion globally proceeds under low-temperature conditions. Initially, a semicircular laminar flame is initiated and propagates towards the jet channel. Soon after that, the flame shape quickly develops into an oval shape at t = 15 μ s , which is ascribed to the reflection and superposition of pressure waves in the confined pre-chamber (as shown by the density gradient field). In this process, some pressure waves with the local sound speed pass through the jet orifice and arouse obvious disturbance in the stationary main chamber. Meanwhile, caused by the thermal expansion of pre-chamber combustion, the release of some cold stoichiometric mixtures into the main chamber becomes pronounced (as shown by the H2 mass fraction field). Subsequently, the flame front becomes wrinkled when the flame front approaches the jet orifice at t = 37.5 μ s due to the hydrodynamic instability caused by density disparity across flame fronts. With the development of the flame in the pre-chamber, the cold stoichiometric mixture has a longer propagation distance in the main chamber, and a lot of vortexes are formed in the main chamber (as shown by the density gradient field). The cold jet mixture will affect the initiation and combustion evolutions in the main chamber.
Figure 4 shows the contours of temperature, H2 mass fraction, and velocity in the main chamber at T p = 900 K. It can be observed that the early-stage combustion evolutions are significantly affected by the distributions of the cold stoichiometric mixtures released from the pre-chamber. Specifically, a flame tongue comes across the jet orifice and propagates along with the released stoichiometric mixtures at t = 41 μ s . Due to the previous cold jet, the vortexes are mainly distributed in front of the flame when the flame enters the main chamber. After that, affected by the shear flow, lots of vortexes appear at the lateral of jet flame at t = 46 μ s , which promotes the mixing and combustion of the surrounding mixtures. Flame evolution correlates closely with the jet flow and vortex motion in subsequent processes. The flame front tends to propagate towards the center of jet flow and then develops along the rotation direction of vortexes at the lateral at t = 51 μ s . This is because jet penetration and its induced vortexes initially go far beyond the flame front location as the local flow velocity reaches a supersonic level in the jet orifice and downstream (as manifested by the H2 mass fraction). As combustion proceeds, flame shape and later development proceed along with the vortexes in the front and side of the jet flame. Eventually, the stoichiometric mixtures from the pre-chamber into the main chamber are consumed at t = 60 μ s , and the lean mixtures at the outlet of the jet orifice and the main chamber begin to be consumed, featuring lower combustion temperature.
To clarify the detailed combustion characteristics of turbulent jet ignition, Figure 5 shows the distributions of temperature, pressure, flow velocity, and heat release rate (HRR) at different locations along the y-axis. Herein the flow velocity refers to the magnitude of velocity. It is seen that after the spark ignition, a flame front is induced in the pre-chamber and propagates towards the main chamber. Due to the shrinking effect of the jet orifice, the pressure difference between the pre-chamber and the main chamber increases (reaching a maximum amplitude over 6 atm), which results in an acceleration in flame propagation in the jet orifice and downstream. Meanwhile, the pressure difference also causes the cold jet to be generated, which makes the stoichiometric mixtures enter the main chamber earlier than the flame. It is worth noting that the local flow velocity continuously increases during the propagation of flame front from the pre-chamber to the main chamber. The amplitude of the local flow velocity can be as high as 1000 m/s, depending on the progress of turbulent jet ignition. Compared with pre-chamber scenarios, the mean combustion temperature is 500 K lower in the main chamber due to the lean equivalence ratio. Although the combustion temperature has decreased, the heat release rate at the front of the flame has not decreased significantly because the stoichiometric mixtures previously released into the main chamber have not been exhausted. The flame front is characterized as deflagration as the peak of the HRR stays at 1 e13 J/m3/s.

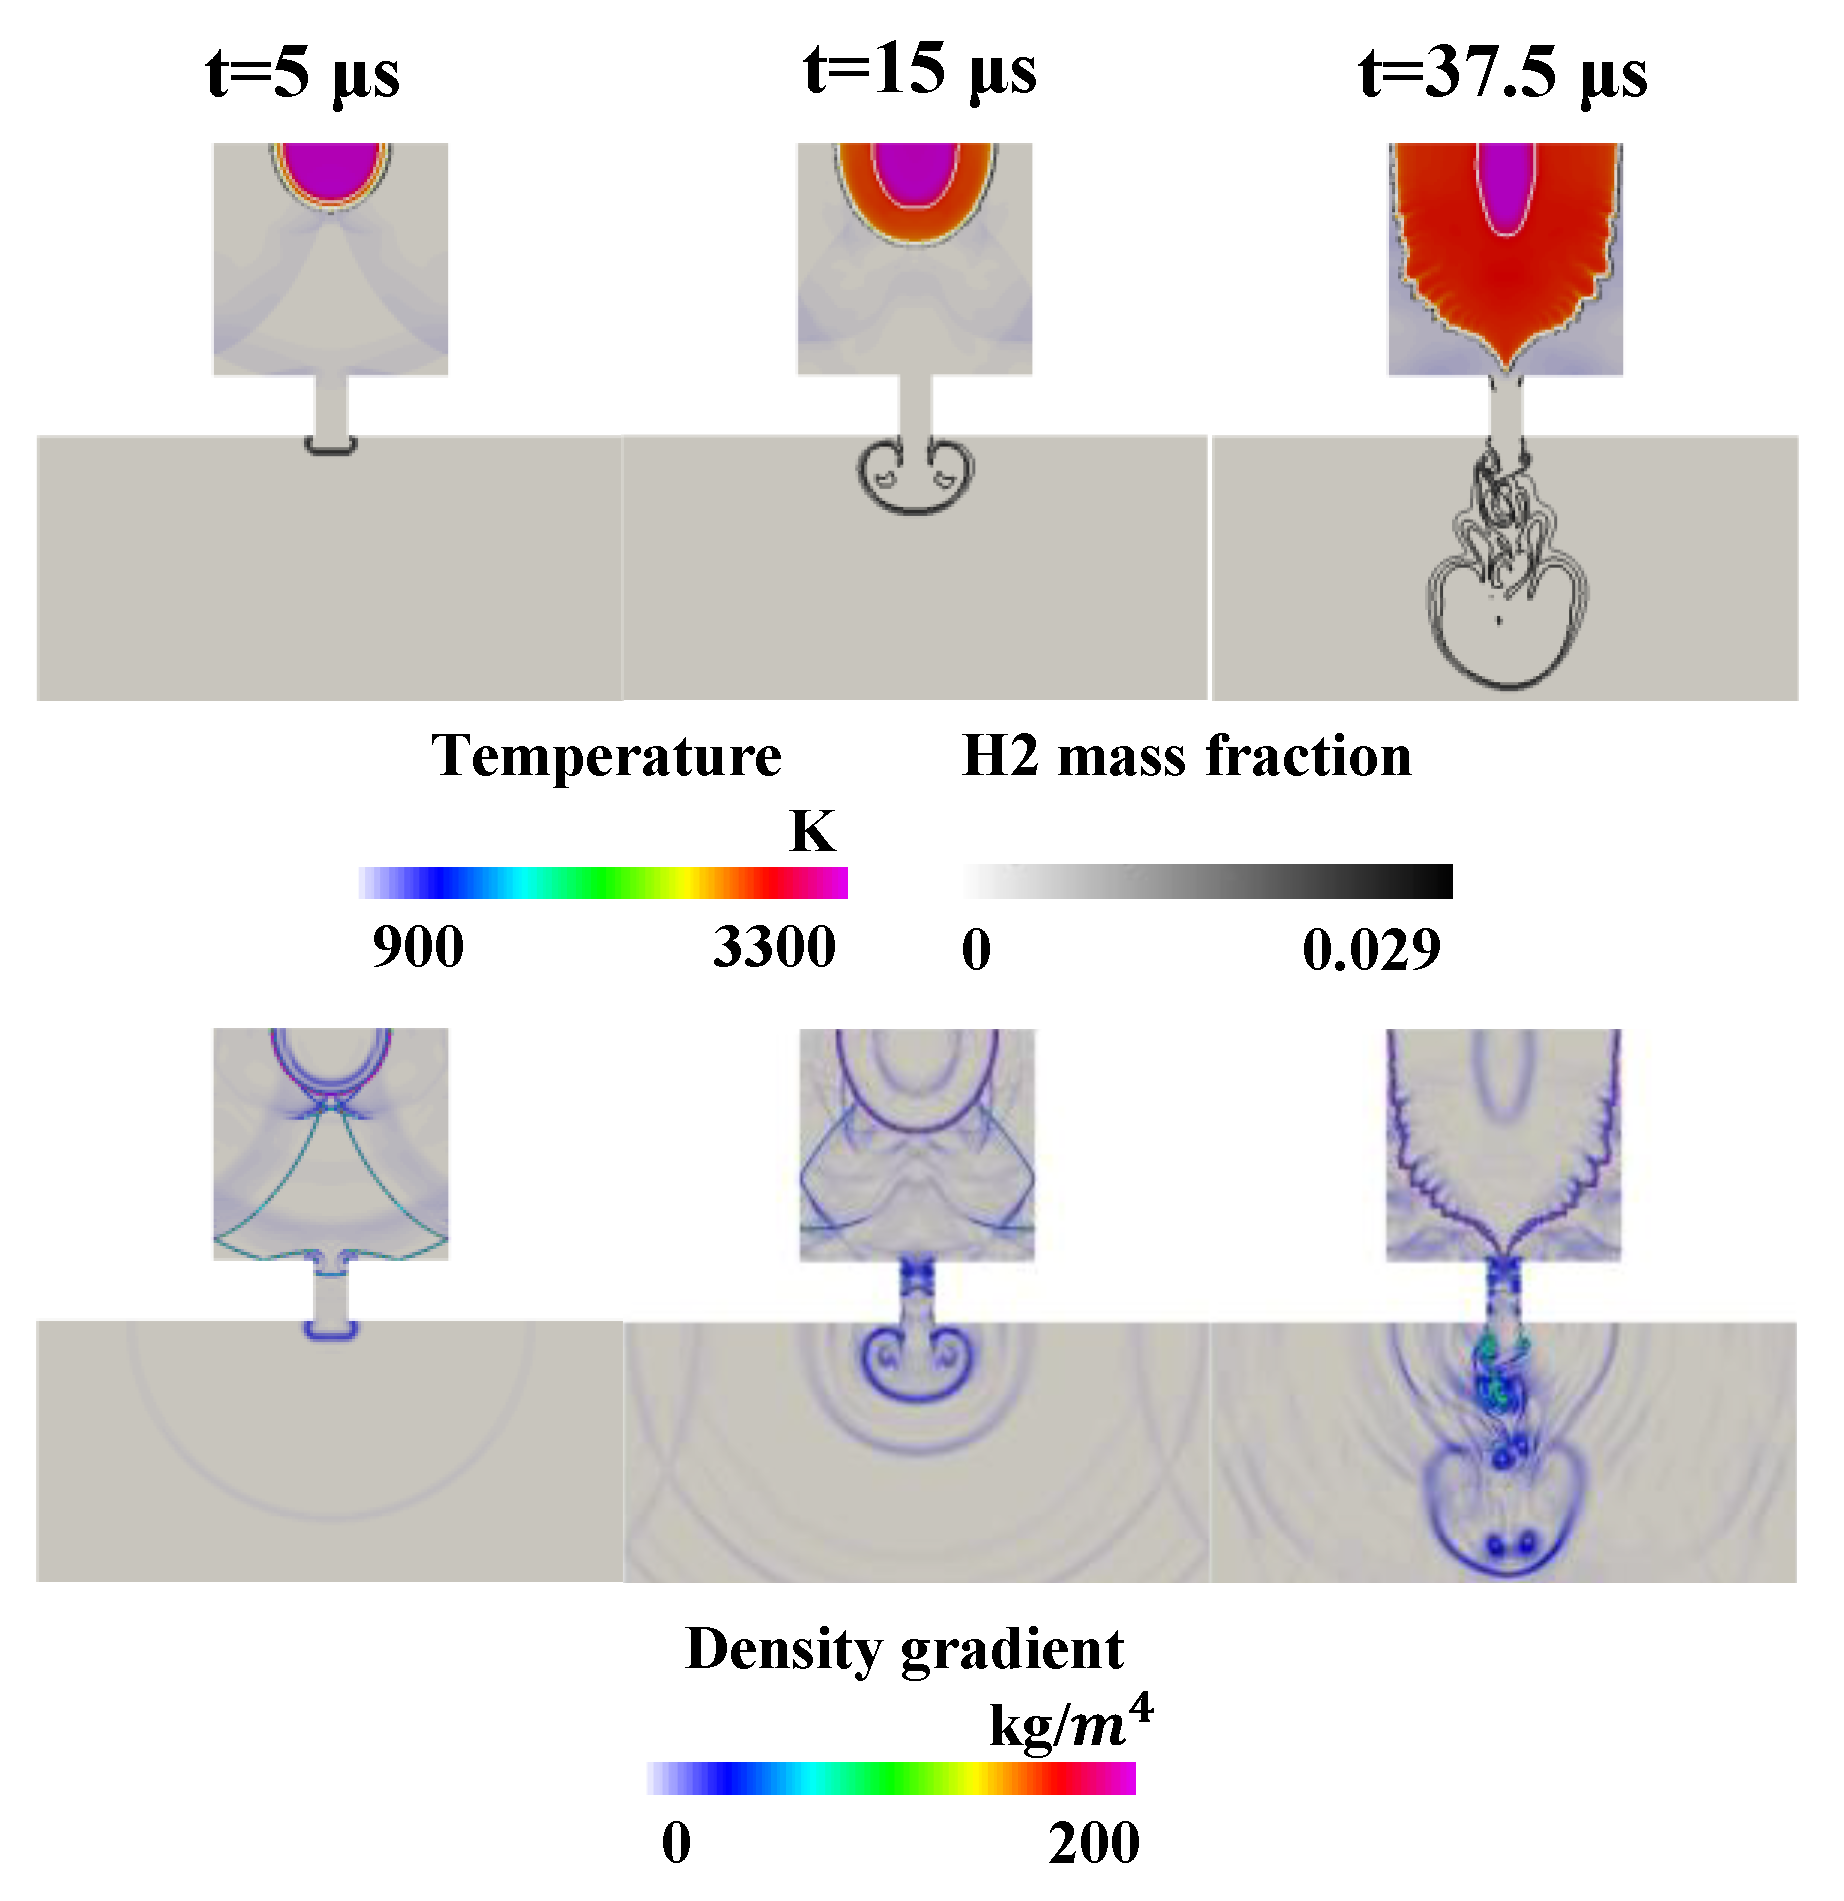
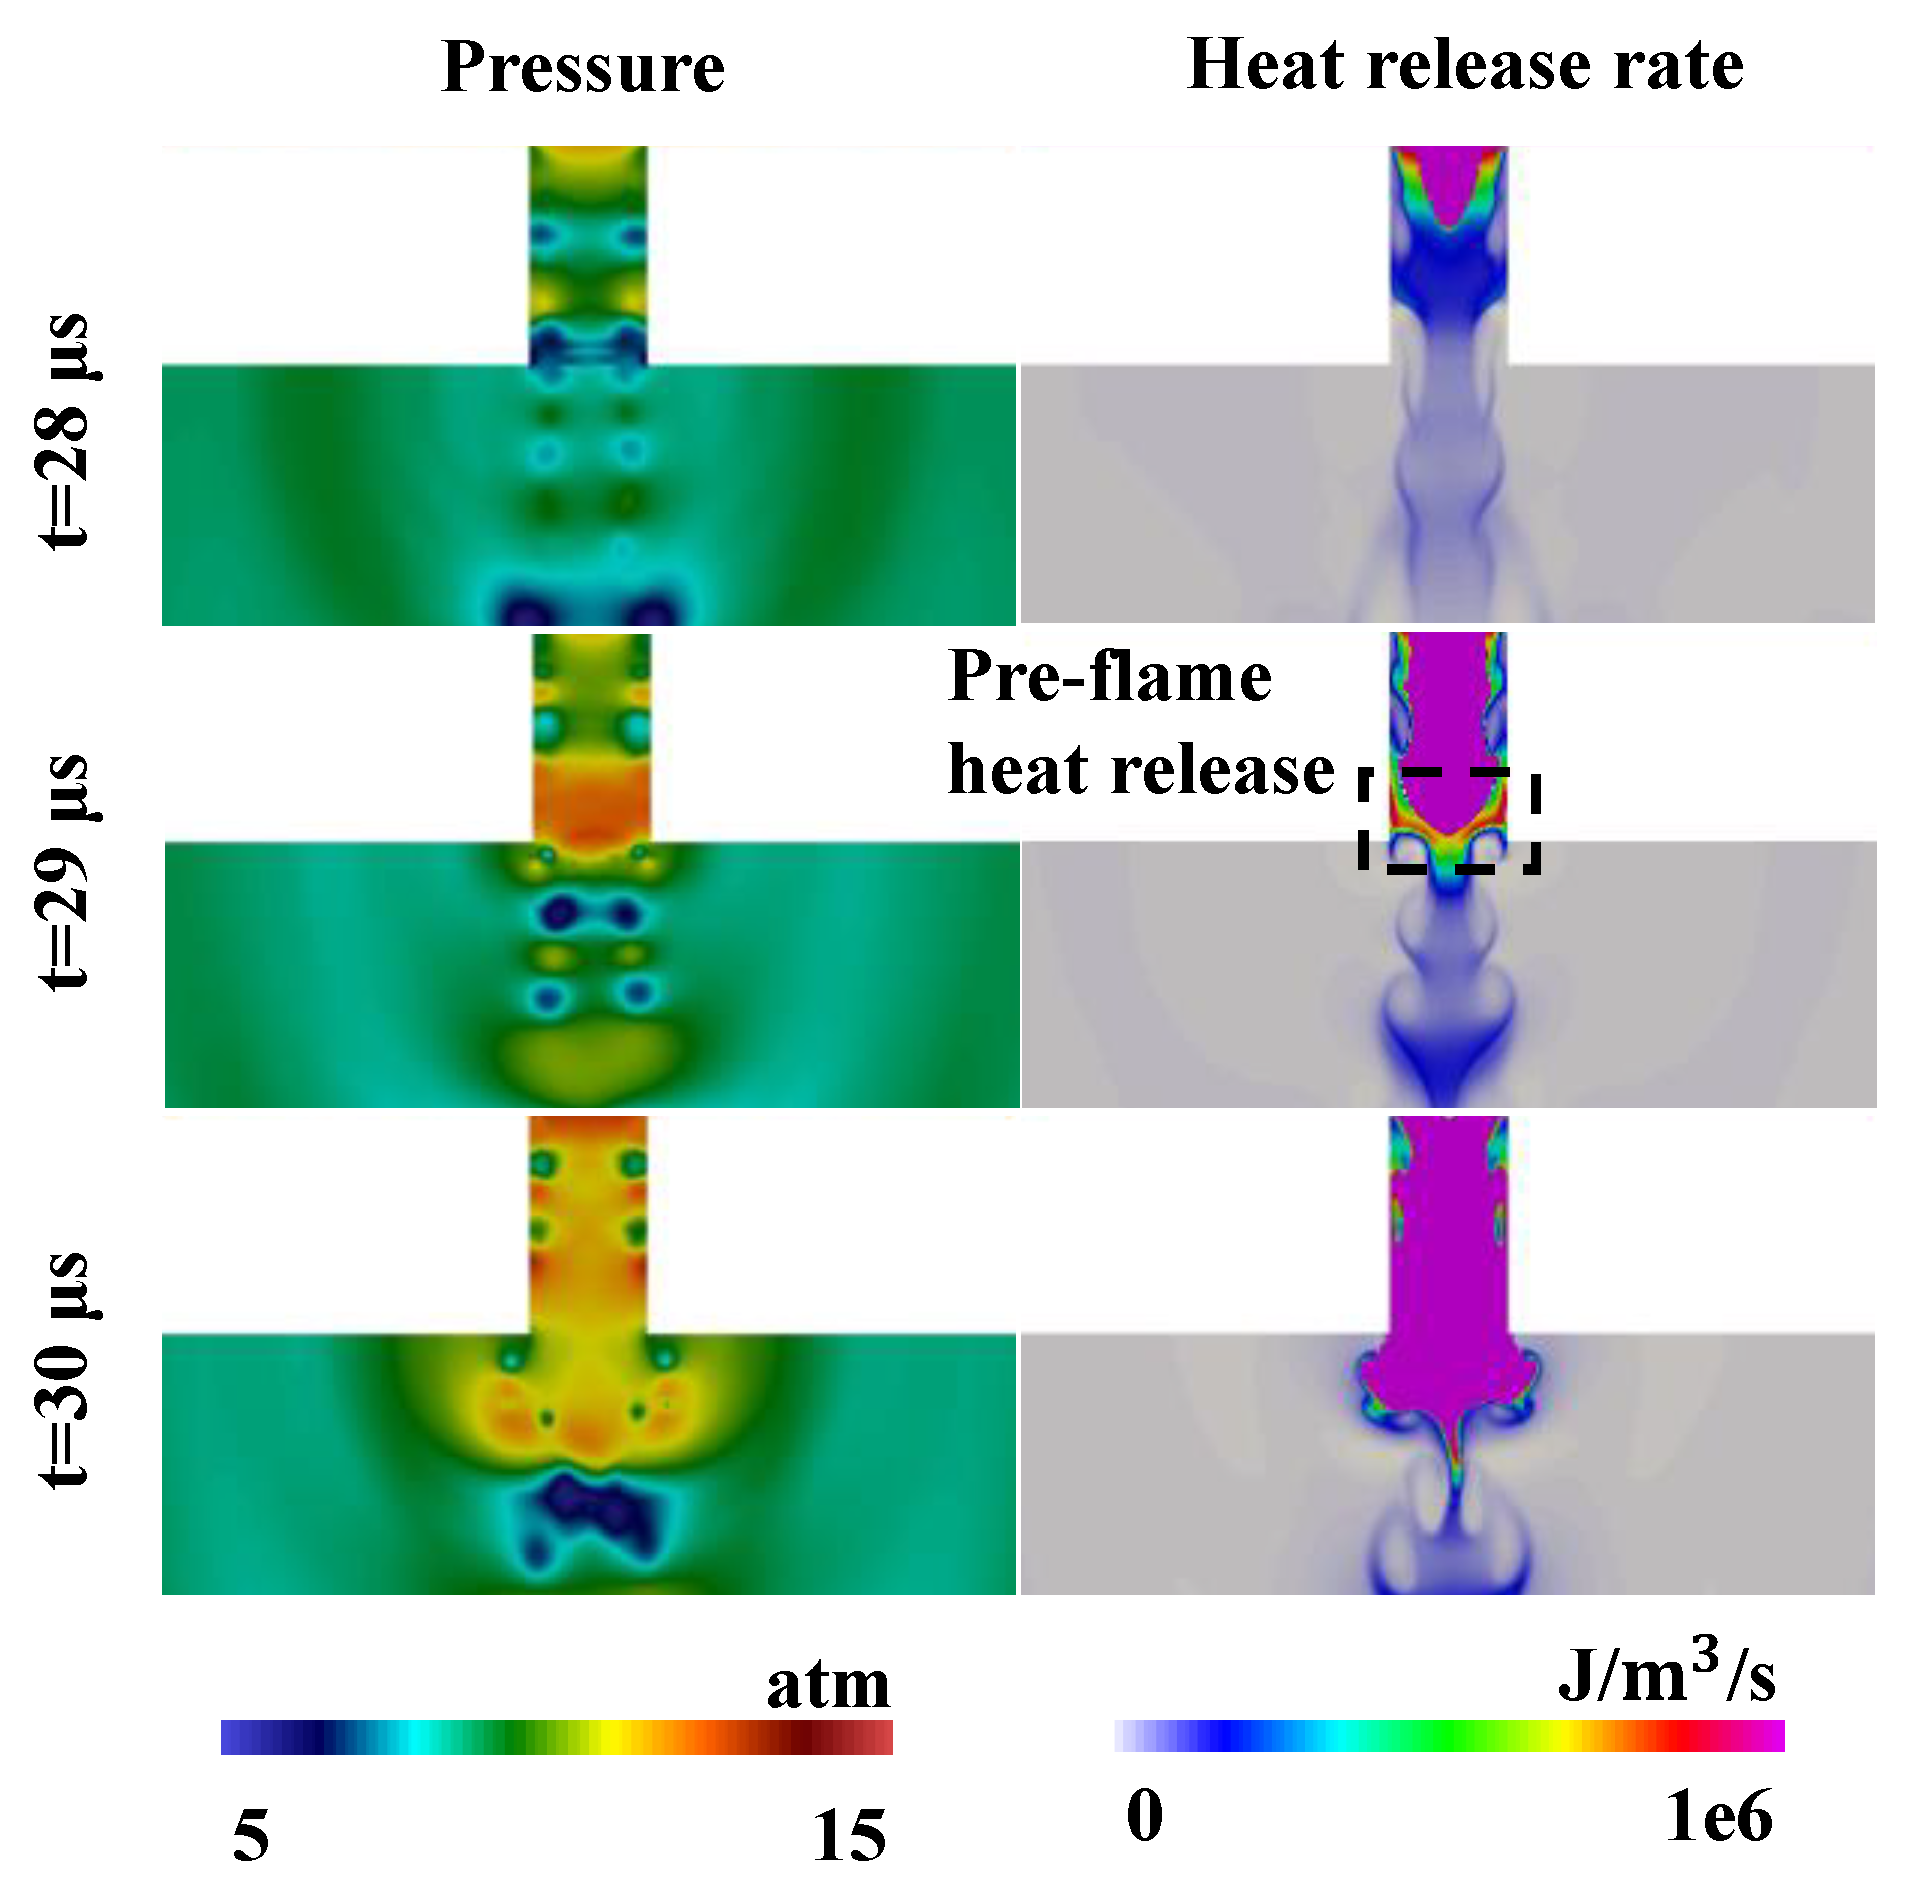
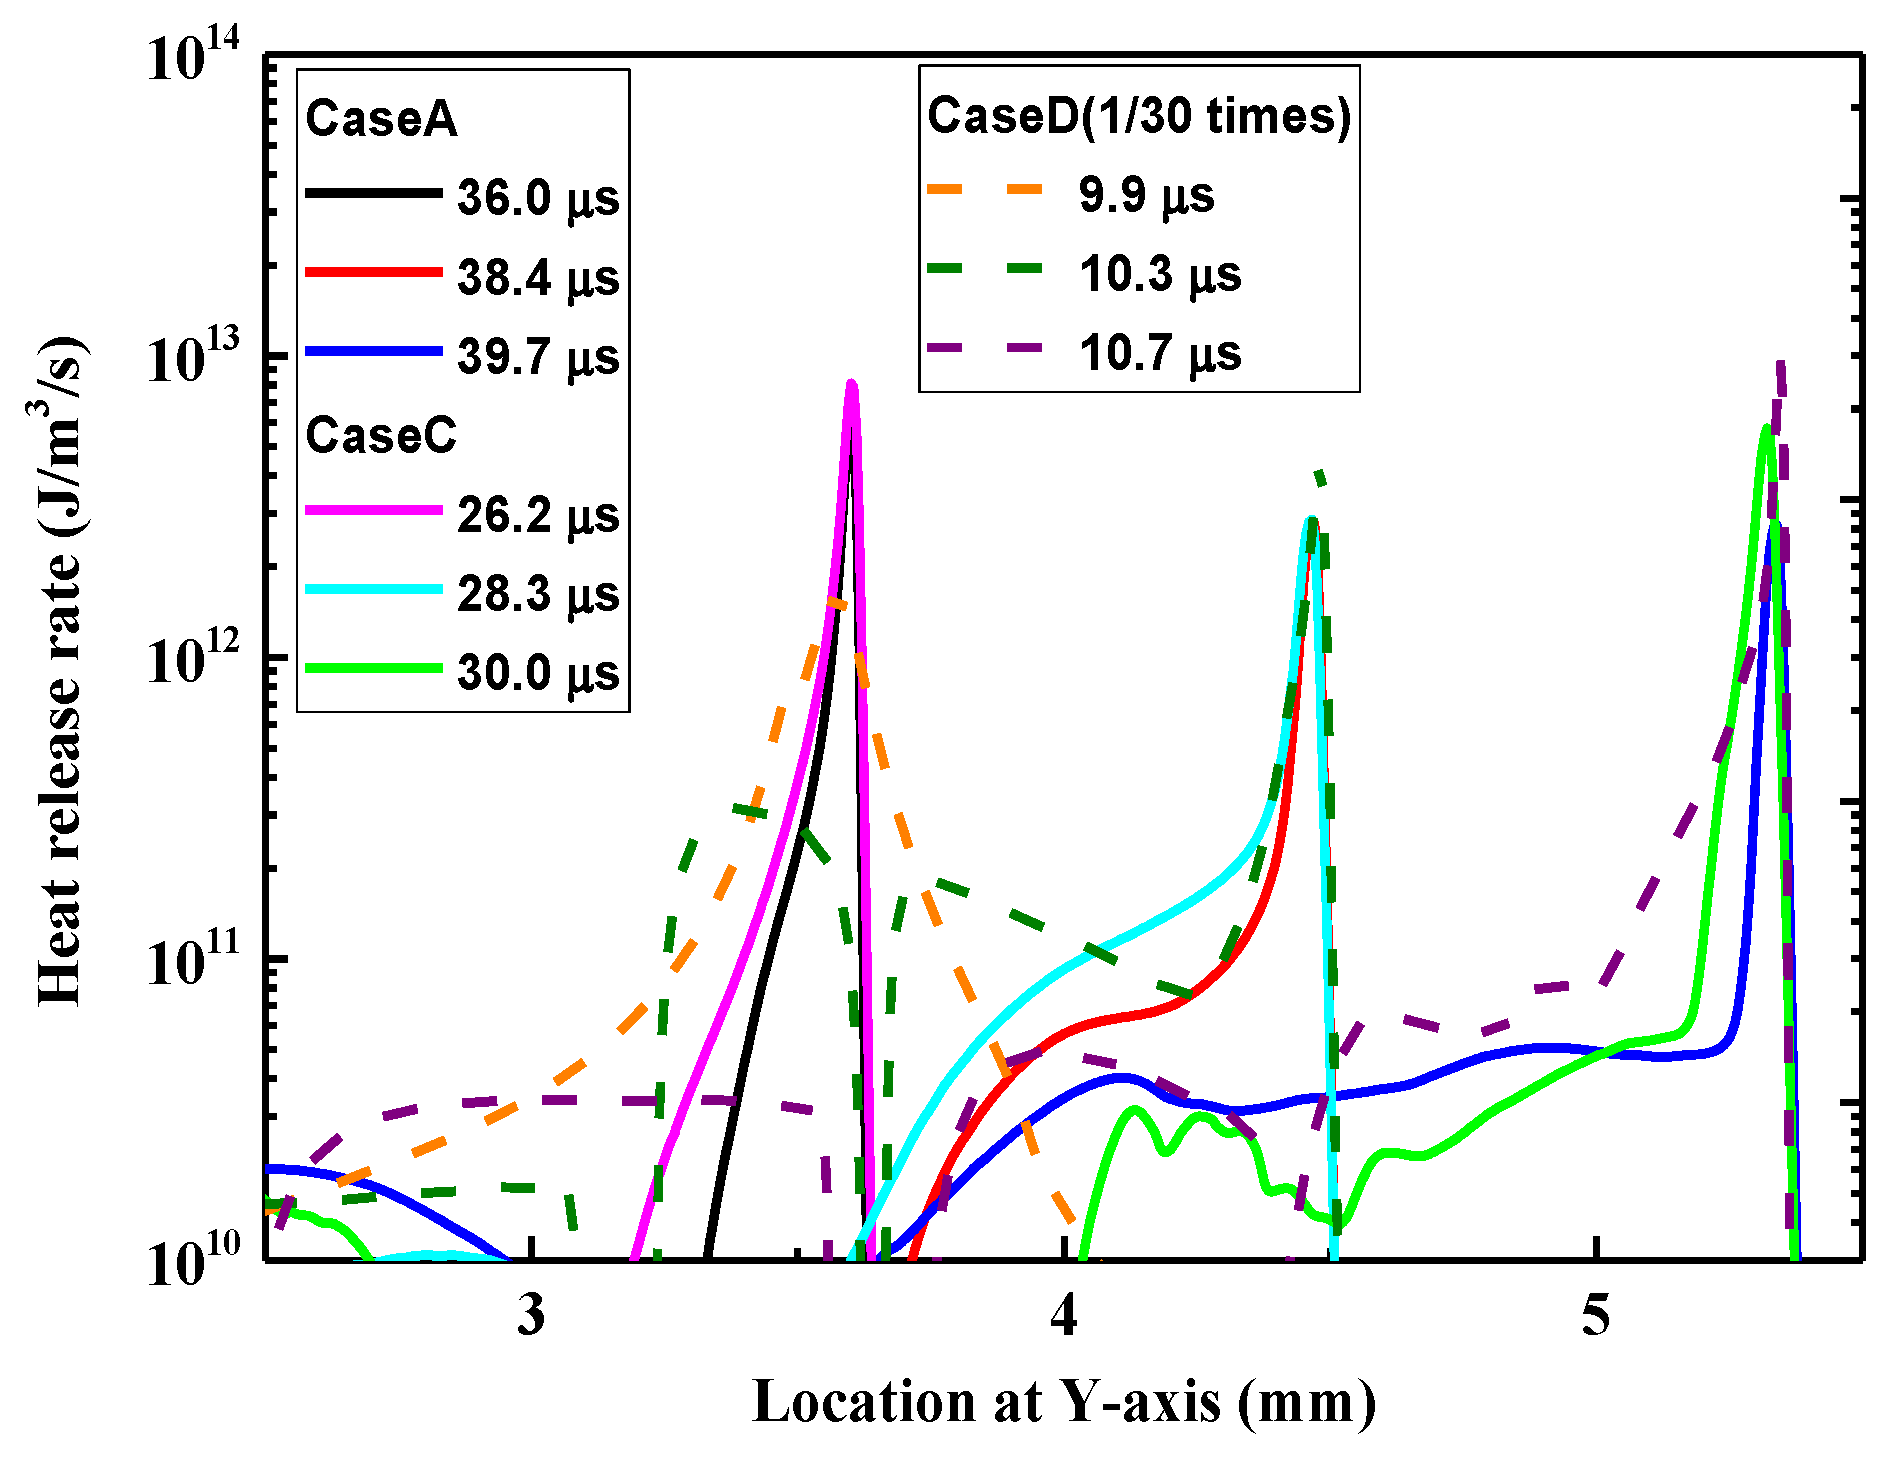
3.2. Pre-Flame Heat Release in Jet Nozzle at High Temperatures

Different from the normal combustion at low temperatures, pre-flame heat release may be encountered in jet orifice as the initial temperature is elevated, which then affects subsequent combustion processes. Figure 6 shows the distributions of pressure and heat release rate in the jet orifice and the main chamber. Herein the heat release of 0~1 e6 J/m3/s is plotted to give a better vision for the local ignition kernels. When the flame passes through the jet nozzle, two small areas of heat release appear in front of the flame, and their pressure increases significantly at t = 28   μ s . As the flame propagates, the heat release in the area is increased, and obvious pre-flame heat release is observed in the outlet of the jet orifice. The unburned mixture releases a large amount of heat, and then the expansion of the gas causes a local high-pressure region to be formed in front of the flame at t   =   30   μ s . The pressure difference in the high-pressure region and the surrounding region will affect the flow velocity and the flame shape. It is worth noting that the above combustion behavior only occurs at a sufficiently high temperature (e.g., T p = 1100 K), where ignition delay is much sensitive to the variations of thermodynamic conditions. Similar observations can also be found in the previous work [34] in which a pre-flame ignition, affected by pressure wave disturbance, occurs at the location adjacent to the flame front as the initial temperature is elevated up to 1100 K, which then induces a supersonic reaction wave propagation.
To demonstrate the effect of pre-flame heat release on the subsequent flame evolution, Figure 7 shows the contours of heat release rate and pressure at different initial temperatures. Pre-flame heat release increases the pressure in the region in front of the flame, and the high-pressure region is subsequently developed into a leading pressure wave of the jet flame. It is observed that the pressure wave appears in different positions around the flame for Case A and Case B, while the pressure wave appears in front of the flame and propagates stably for Case C. The flame tends to develop longitudinally at the early-stage combustion for Case A and Case B, whereas the leading pressure wave makes the flame tends to develop horizontally for Case C. To clarify the underlying reasons, Figure 8 shows the horizontal flow velocity (the component of the flow velocity on the x-axis) and the pressure distribution at t = 32 μ s for Case C. It can be observed that the horizontal velocity of Case C is 50 m/s greater than that of Case A, and the peak velocity immediately follows the leading pressure wave. The leading pressure wave increases the horizontal flow velocity and causes the flame to tend to develop horizontally. As the leading pressure wave decays, the shape of the flame becomes similar again, as shown in Figure 7. The increase in temperature causes the lean mixtures in the vortex to ignite faster, and the flame front develops with smooth curvature.

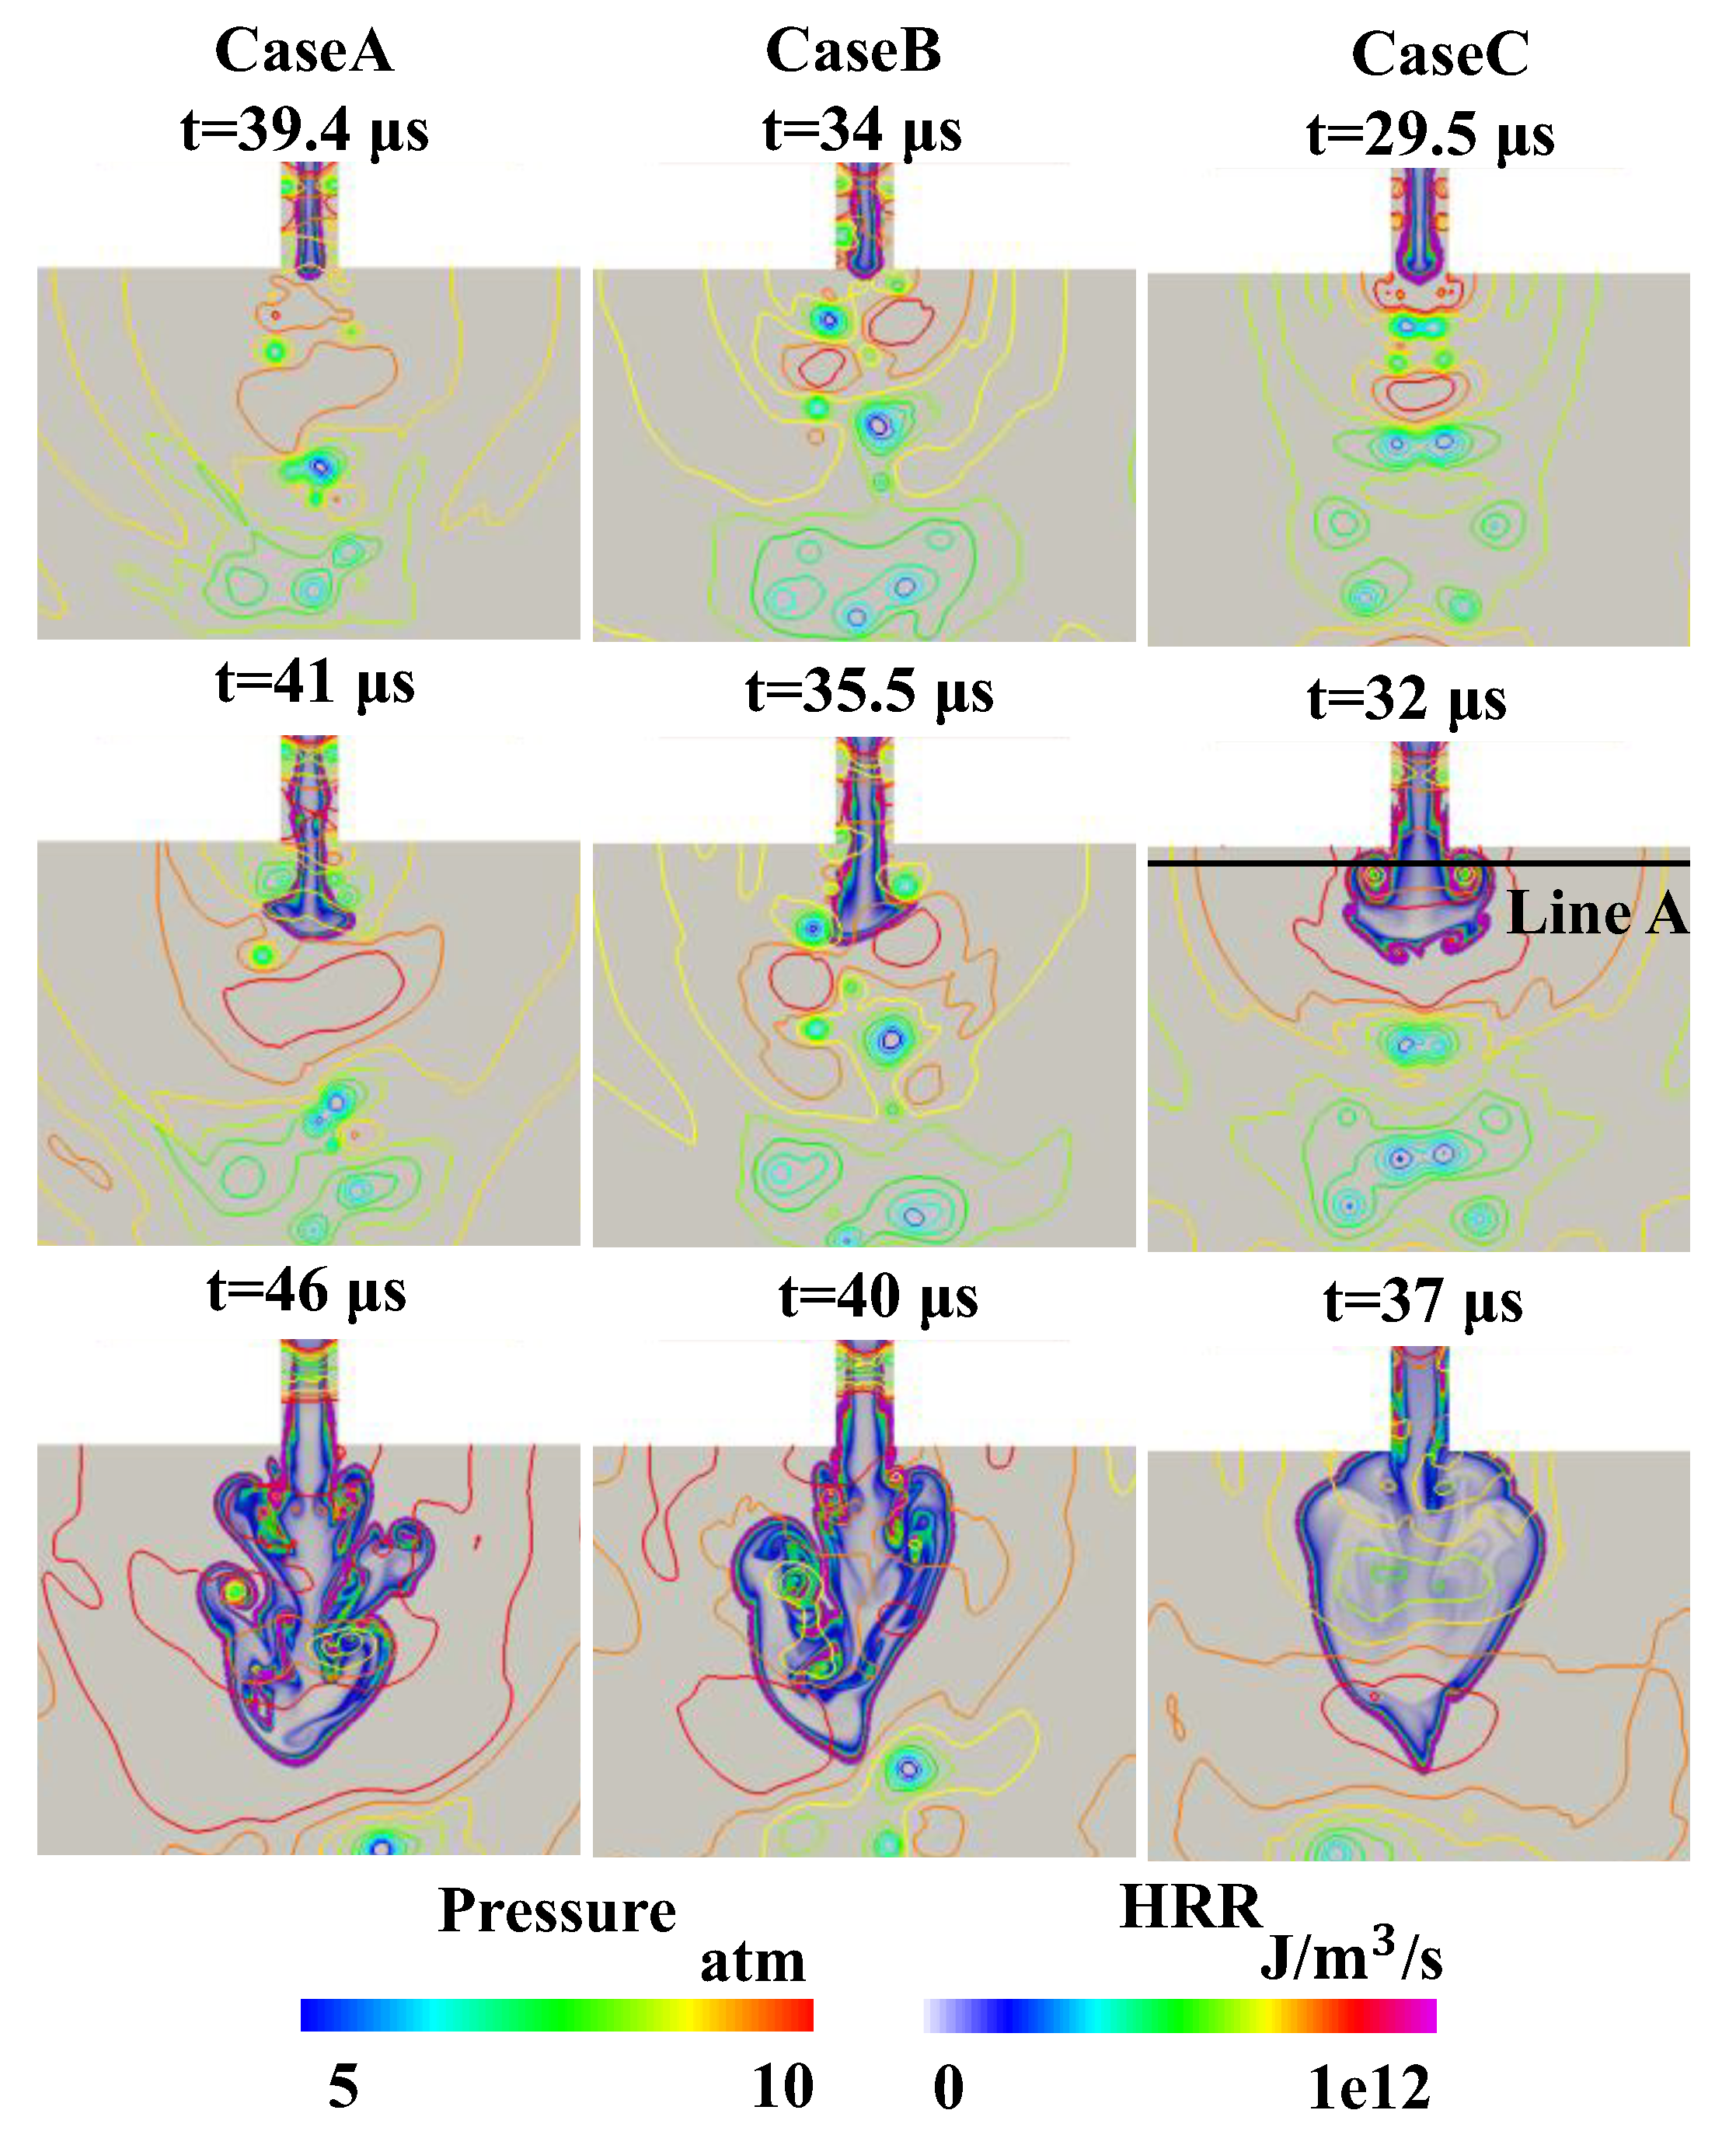
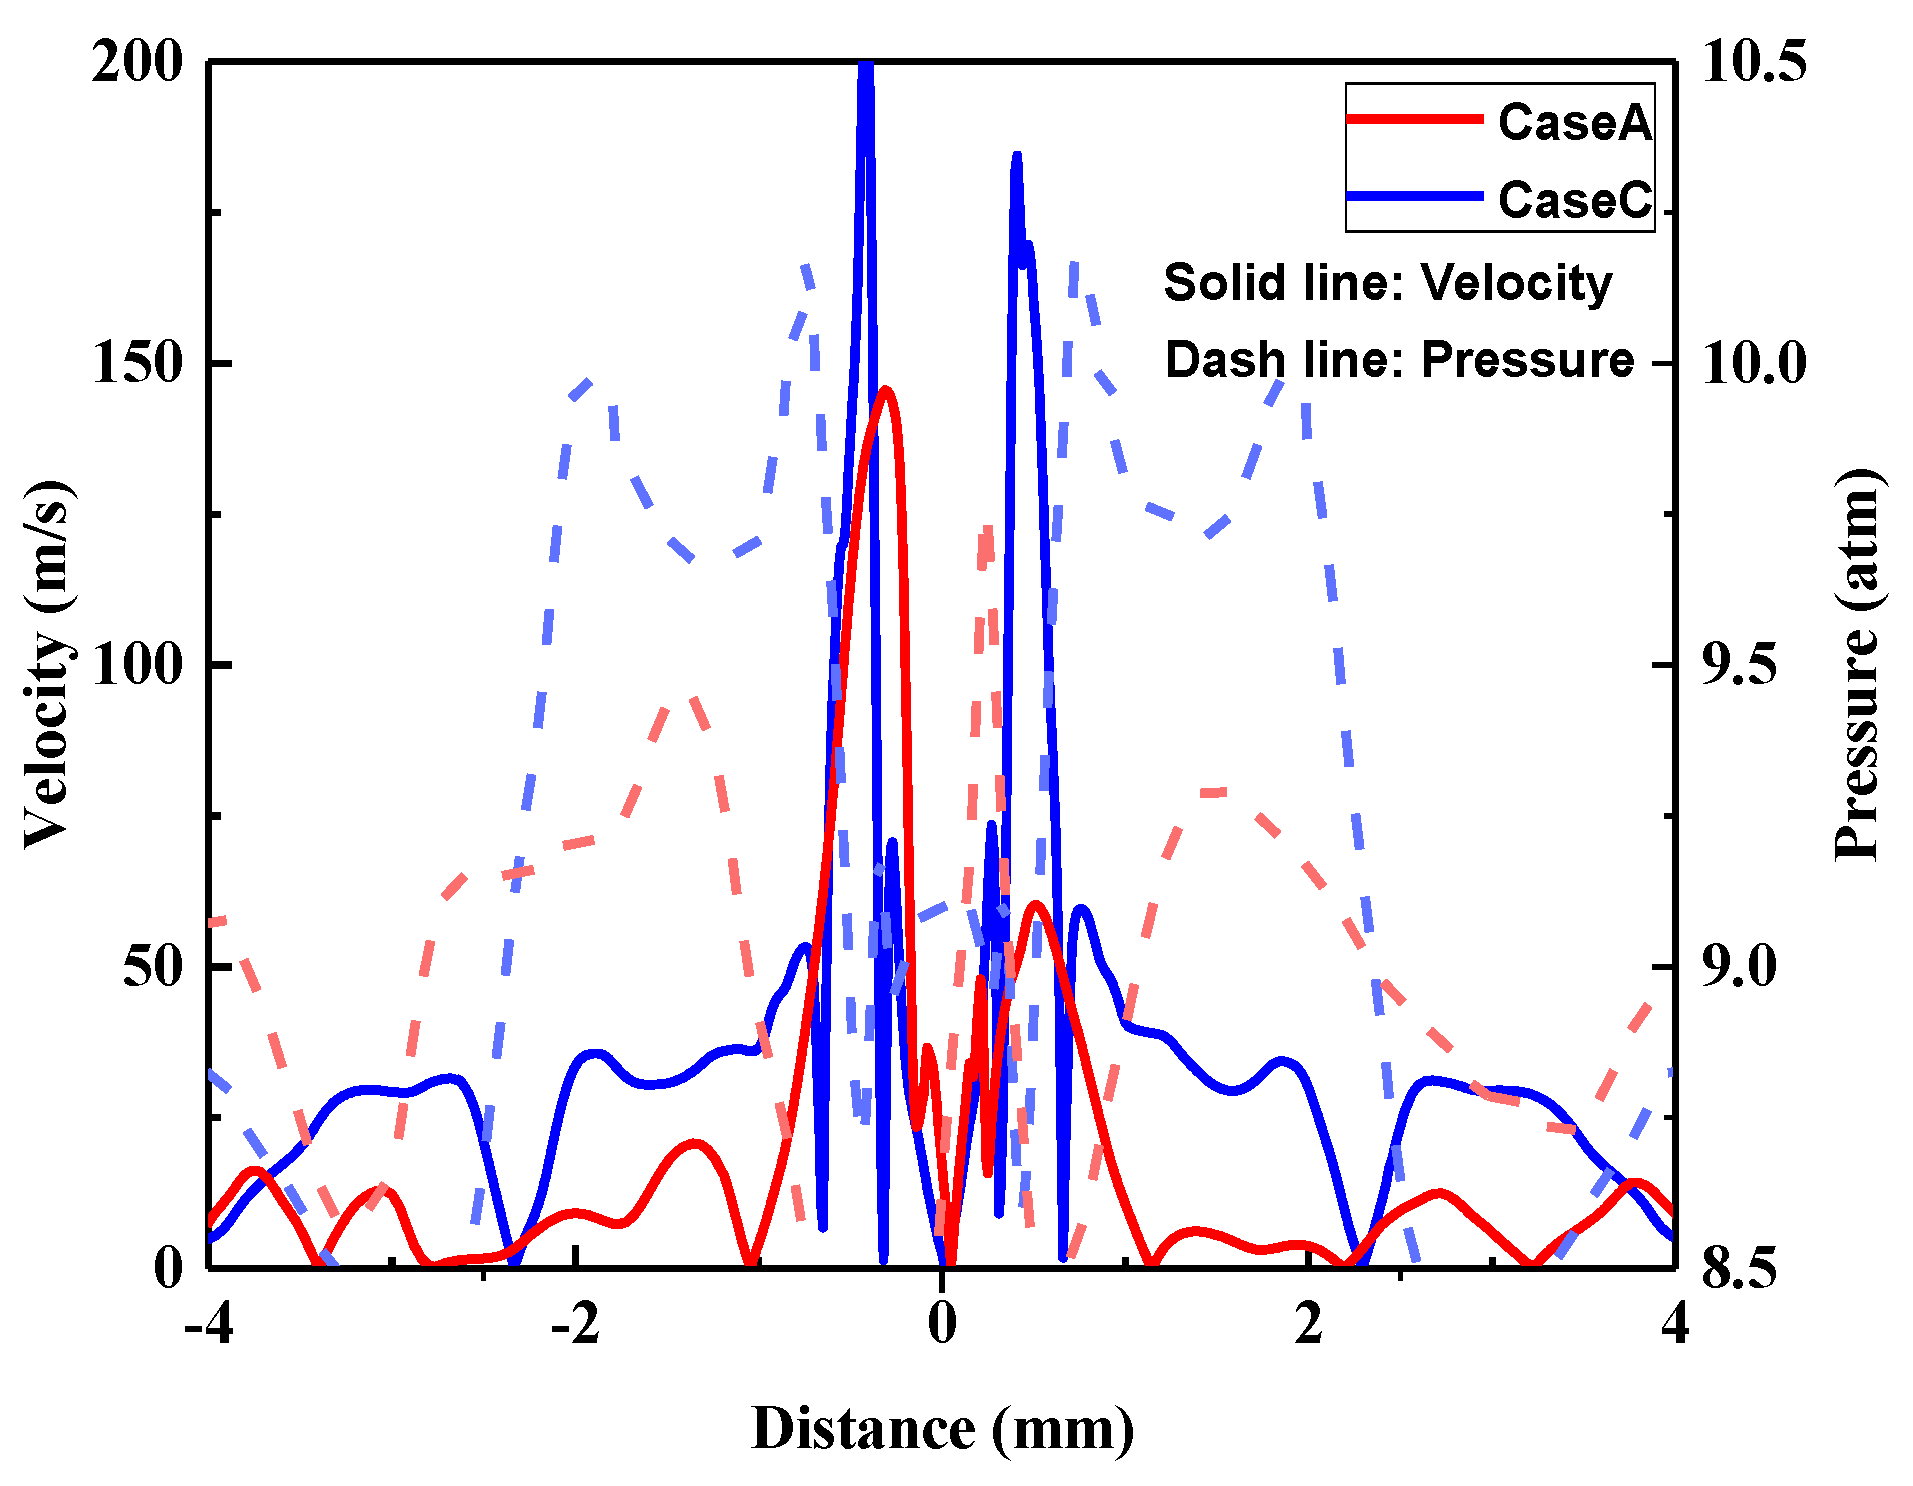
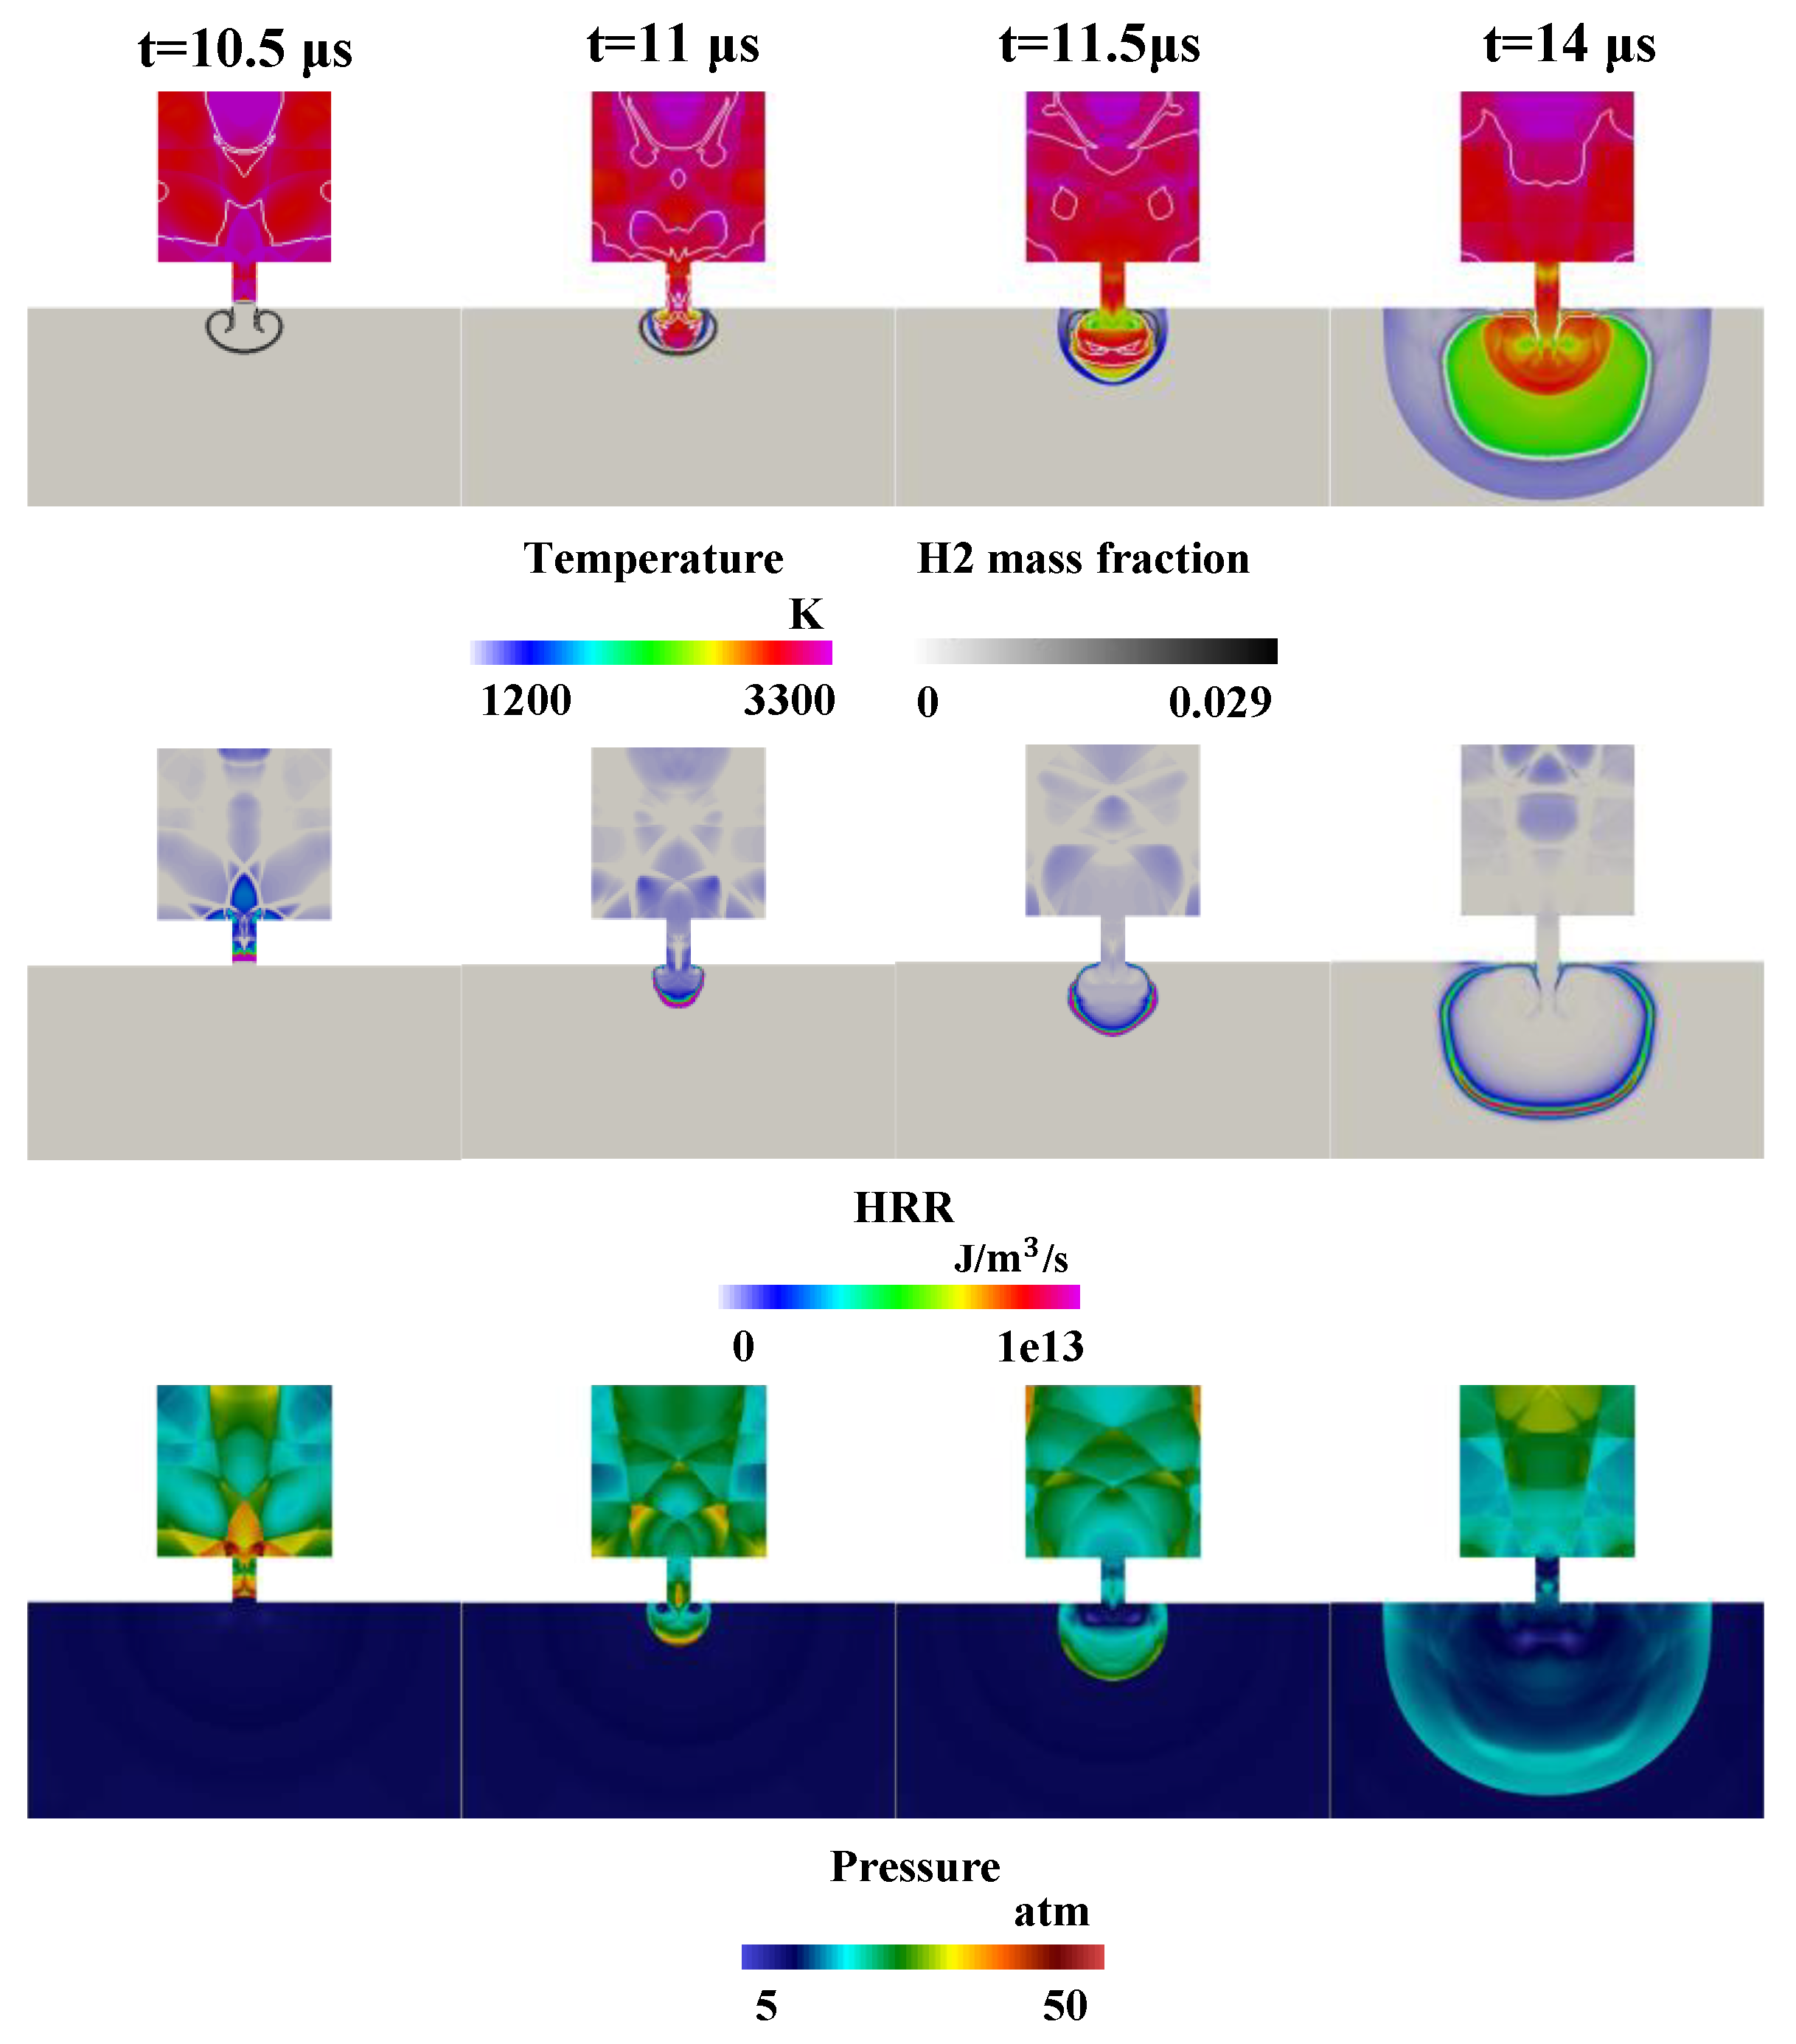
3.3. Auto-Ignition in the Pre-Chamber at High Temperatures

With the further increases in the initial temperature, ignition delay time becomes more sensitive to the variations of thermodynamic conditions, such that auto-ignition events may occur in the pre-chamber. Figure 9 shows the contours of temperature, H2 mass fraction, heat release rate, and pressure of the pre-chamber at T p = 1200 K. It is observed that primary auto-ignition events symmetrically occur in the near-wall region at t = 8.7 μ s , which results from pressure wave reflection and flame front compression and heating (as shown by temperature and pressure sequences). Soon after that, a fast reaction front is induced and then consumes the remaining mixtures within one microsecond in the pre-chamber. It is worth noting that the reaction front is supersonic deflagration rather than detonation since the propagation speed is far beyond 2300 m/s (higher than the Chapman–Jouguet detonation speed at 1936 m/s), and there are no interactions between shock waves and reaction fronts. Such an observation is different from the previous work [35], in which detonation becomes prevalent with pressure wave disturbances in a largely confined chamber. The main reasons may be ascribed to the temperature gradient inside the auto-ignition kernel, which is lower to initiate the detonation [36,37]. Moreover, secondary auto-ignition events also occur in the bottom corner of the pre-chamber at t = 9.2 μ s , followed by multiple pressure waves convergence around the inlet of the jet orifice. It is noted that different from T p = 900 K case, there are few pressure waves passing through the jet orifice, and the jet flame is characterized by an inverted mushrooming pattern (as shown by H2 mass fraction at t = 9.7 μ s ).
Figure 10 shows the contours of temperature, H2 mass fraction, heat release rate, and pressure of the main chamber at T p = 1200 K. It is observed that under sufficiently high-temperature conditions, the jet flame is characterized by a spherical flame with distinct combustion modes in the main chamber. Due to the occurrence of auto-ignition events, a strong leading pressure wave is formed in front of the flame in the main chamber at t = 11 μ s . It is observed that the pressure wave has a heating effect on the unburned mixture (as manifested by the temperature field), which has an advantage in the ignition and flame propagation of the lean mixture. Besides, the pressure waves and flame front are not coupled, indicating that the reaction front is propagated in a deflagration mode in the main chamber. The leading pressure wave will remain in the main chamber and affect the combustion mode in the main chamber. As mentioned earlier, the pressure difference caused by the leading pressure wave affects the flow velocity, which, in turn, affects the flame shape. When auto-ignition events occur (Case D), the amplitude of the leading pressure wave is much higher than that of pre-flame heat release (Case C), which weakens the influence of the vortex on the flame shape and makes the flame develop into a spherical flame completely. Compared with the previous combustion mode, the spherical flame propagates faster in the main chamber, and the penetration length of the jet flame is reduced obviously. As the flame develops, a large amount of lean mixture is ignited at t = 11.5 μ s , which reduces the heat release rate of the flame and the amplitude of the leading pressure wave. Finally, a spherical flame is propagated within the main chamber at t = 14 μ s , and the outer side of the flame front is the unburned mixture heated by the leading pressure wave. Because of the difference in equivalence ratio, the combustion temperature of the flame edge is significantly lower than that of the flame center.
Figure 11 shows the contours of density (by numerical schlieren) and OH mass fraction to illustrate the evolutions of pressure waves and reaction fronts. It is observed that a reaction front propagation is induced by the local auto-ignition at the location ahead of pressure waves in the pre-chamber at t = 9 μ s , manifesting the supersonic deflagration. The reaction front is always in front of the pressure wave in the pre-chamber. As the reaction front approaches the jet orifice (at t = 10 μ s ), multiple pressure waves are aggregated and coupled with reaction fronts, resulting in the formation of a detonation wave. Detonation wave propagates in the jet orifice (at t = 10.5 μ s ), which is characterized by the coupling of reaction front and pressure wave. As the reaction front reaches the main chamber, the pressure wave decouples from the reaction front due to the decrease in the equivalence ratio. Consequently, there is a transition in combustion mode from supersonic deflagration to subsonic deflagration.
Figure 12 shows the distributions of temperature, pressure, flow velocity, and heat release rate (HRR) at different locations along the y-axis for Case D. It is observed that the auto-ignition events in the pre-chamber make combustion temperature rise significantly in the jet orifice, but the combustion temperature in the main chamber becomes lower as the lean mixtures are consumed. Different from T p = 1100 K cases, when auto-ignition events just occur in the pre-chamber, the reaction front is manifested by a supersonic deflagration (as shown by pressure at t = 9.7 μ s ). The feature of a supersonic deflagration is that the pressure is higher than the equilibrium pressure of 19.7 atm but lower than the Chapman–Jouguet pressure of 35.0 atm. Then, the reaction front develops into the developing detonation in the jet orifice, but the subsonic deflagration is observed in the main chamber. This indicates that combustion chamber structure and equivalent ratio have an important influence on flame evolutions. Caused by the auto-ignition events in the pre-chamber, the flow velocity reaches 1500 m/s in the jet orifice and further reaches 2000 m/s in the main chamber. Correspondingly, the heat release at first increases and then decreases, which is closely related to the transition of combustion modes.

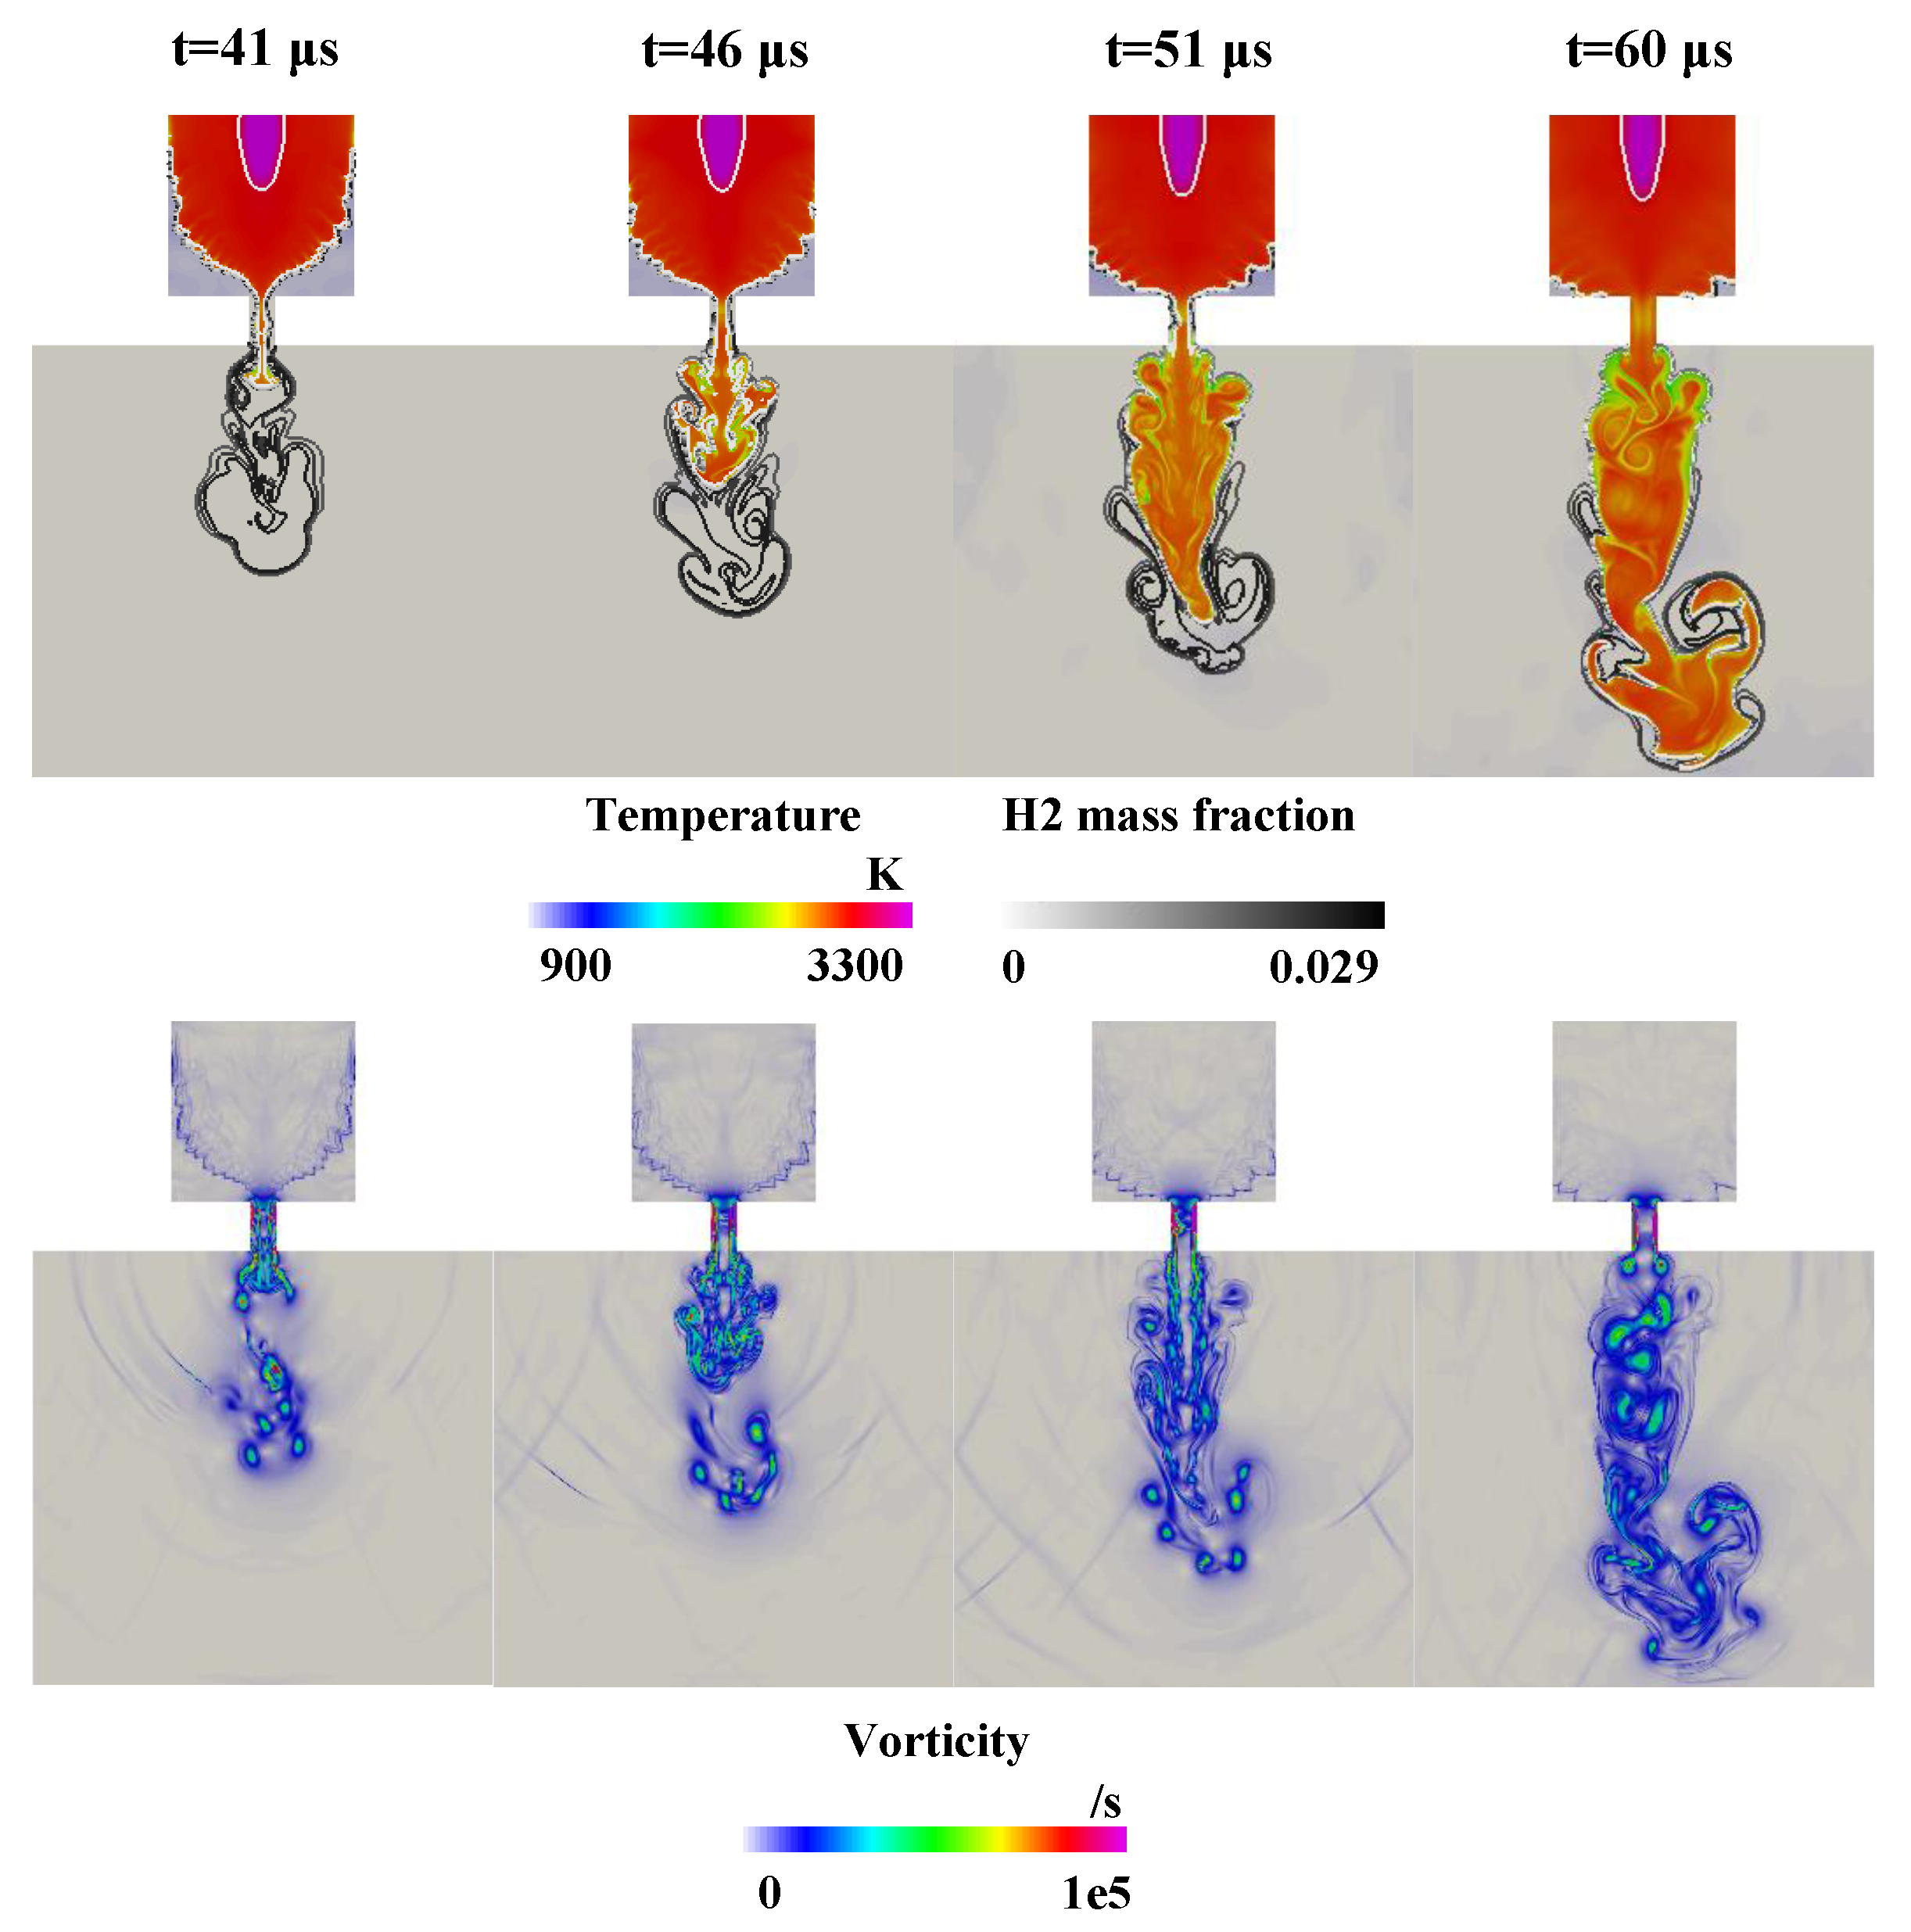
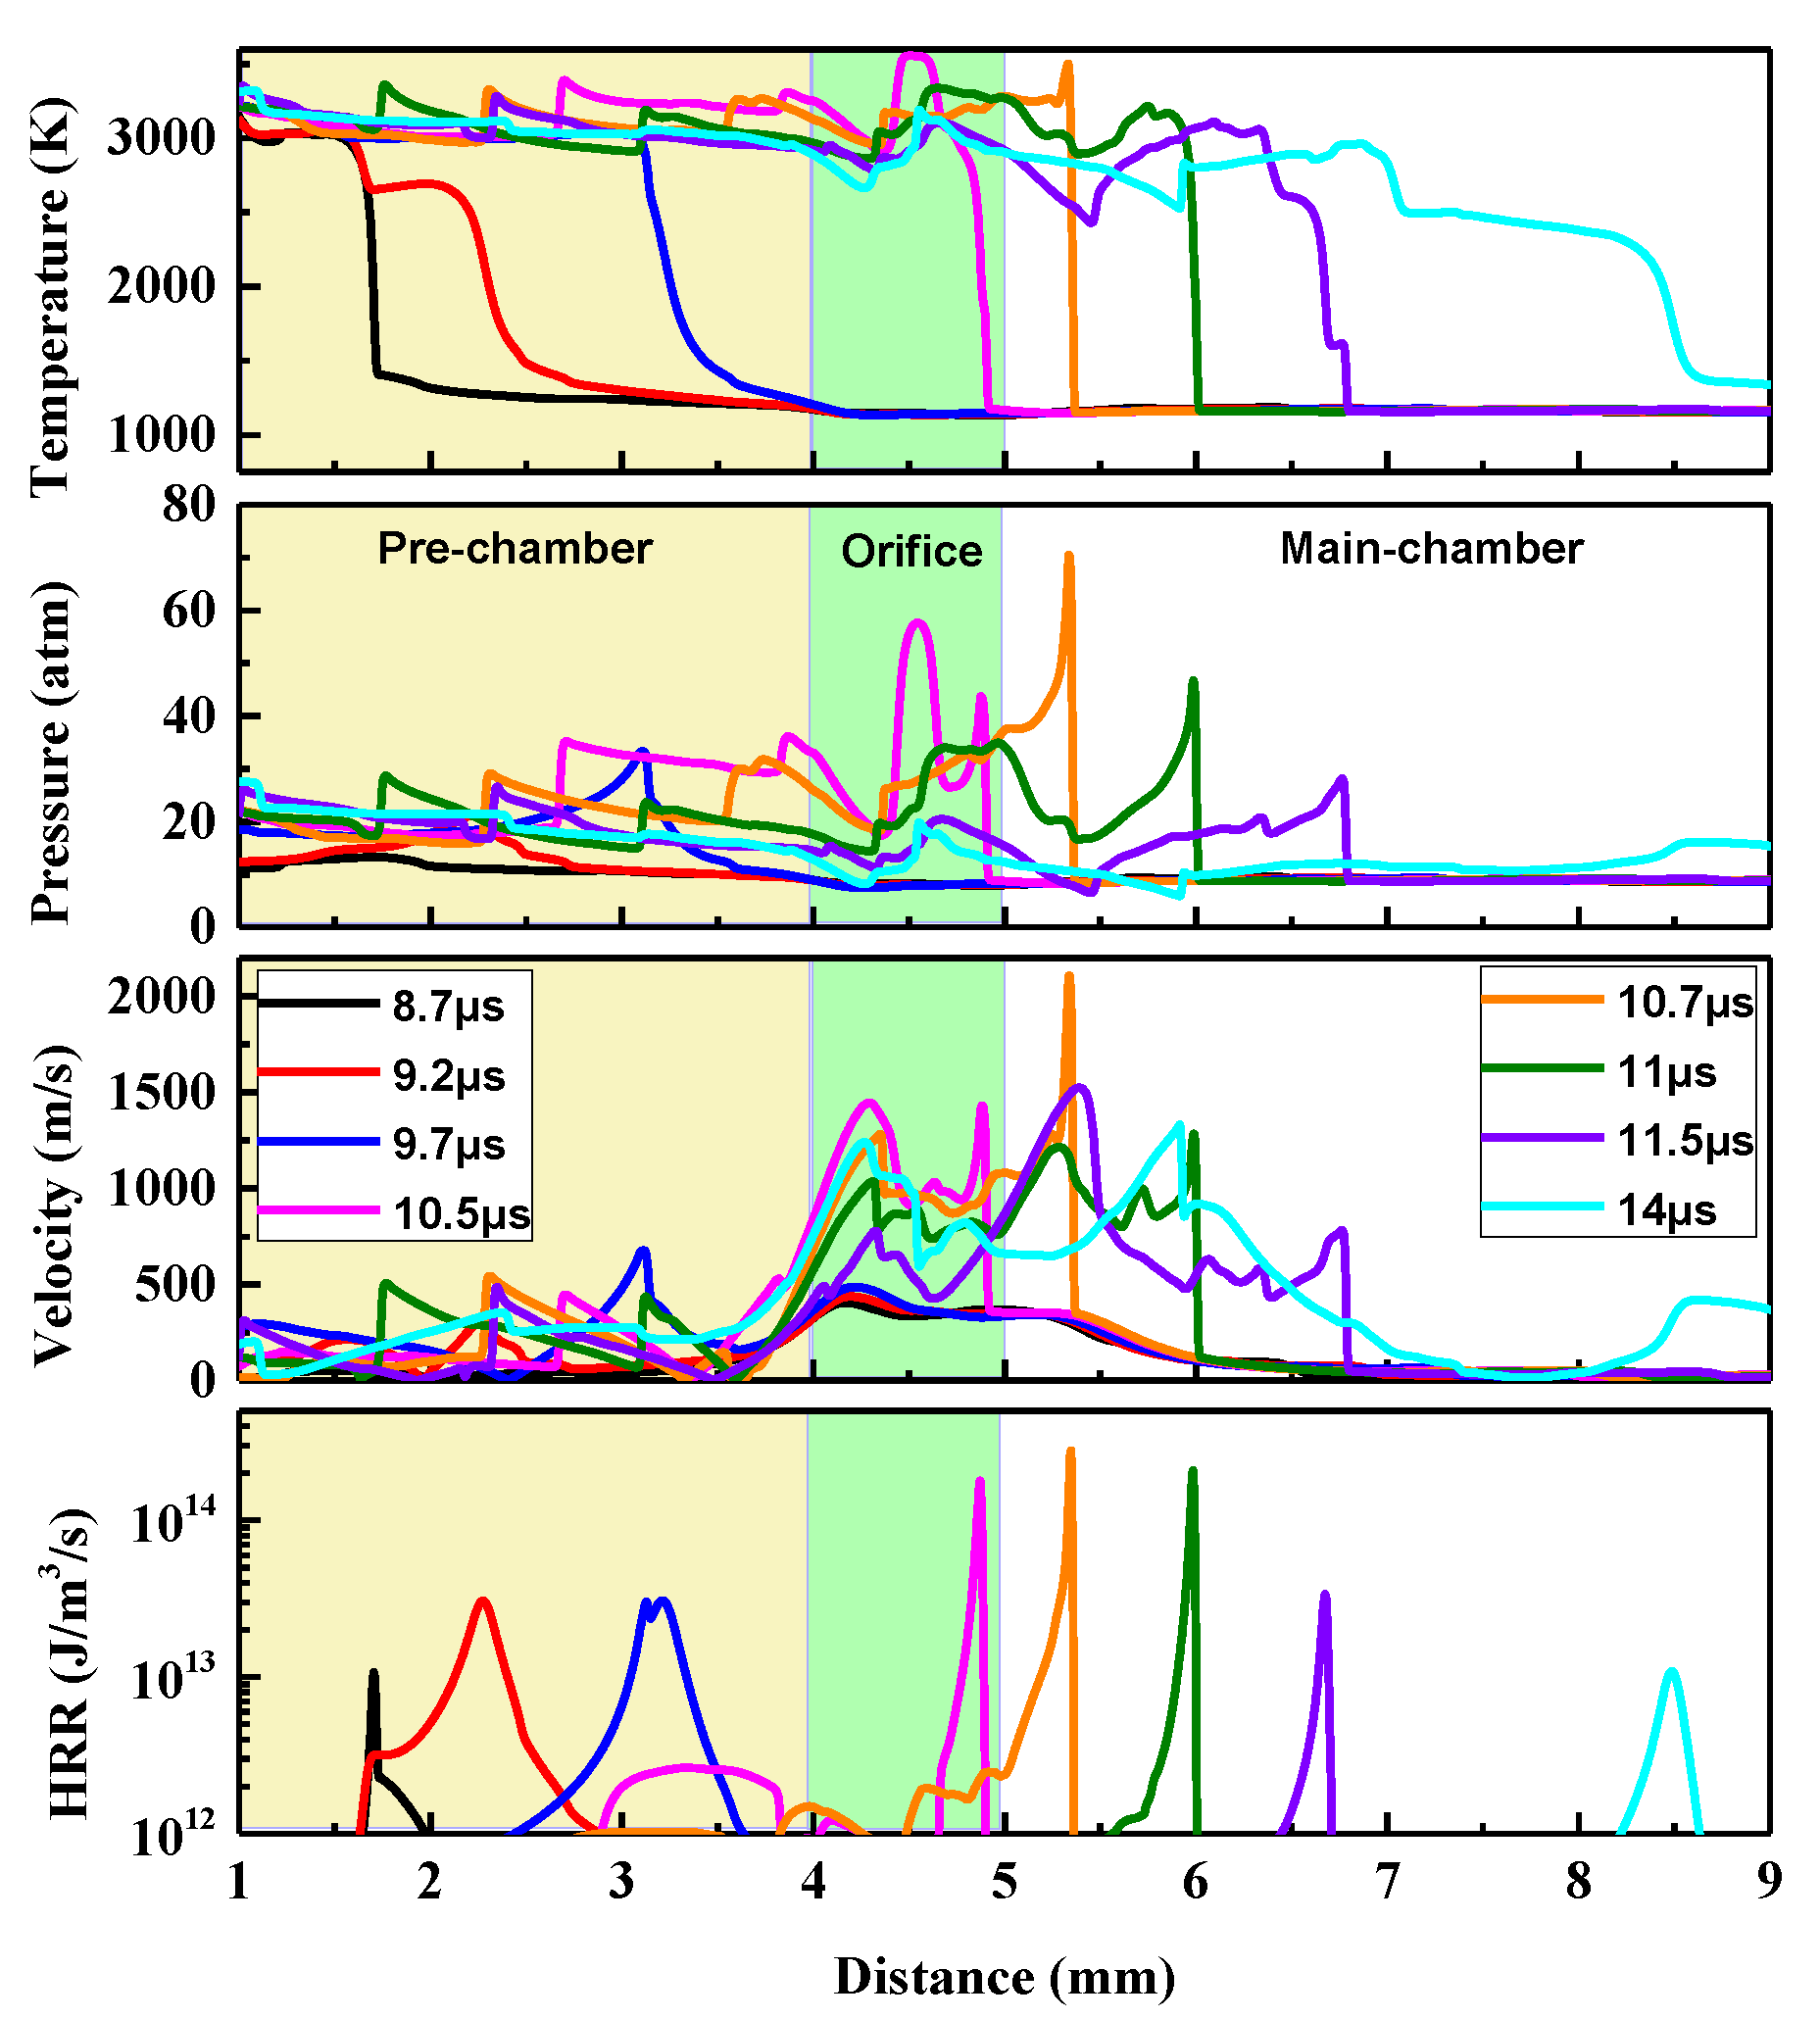
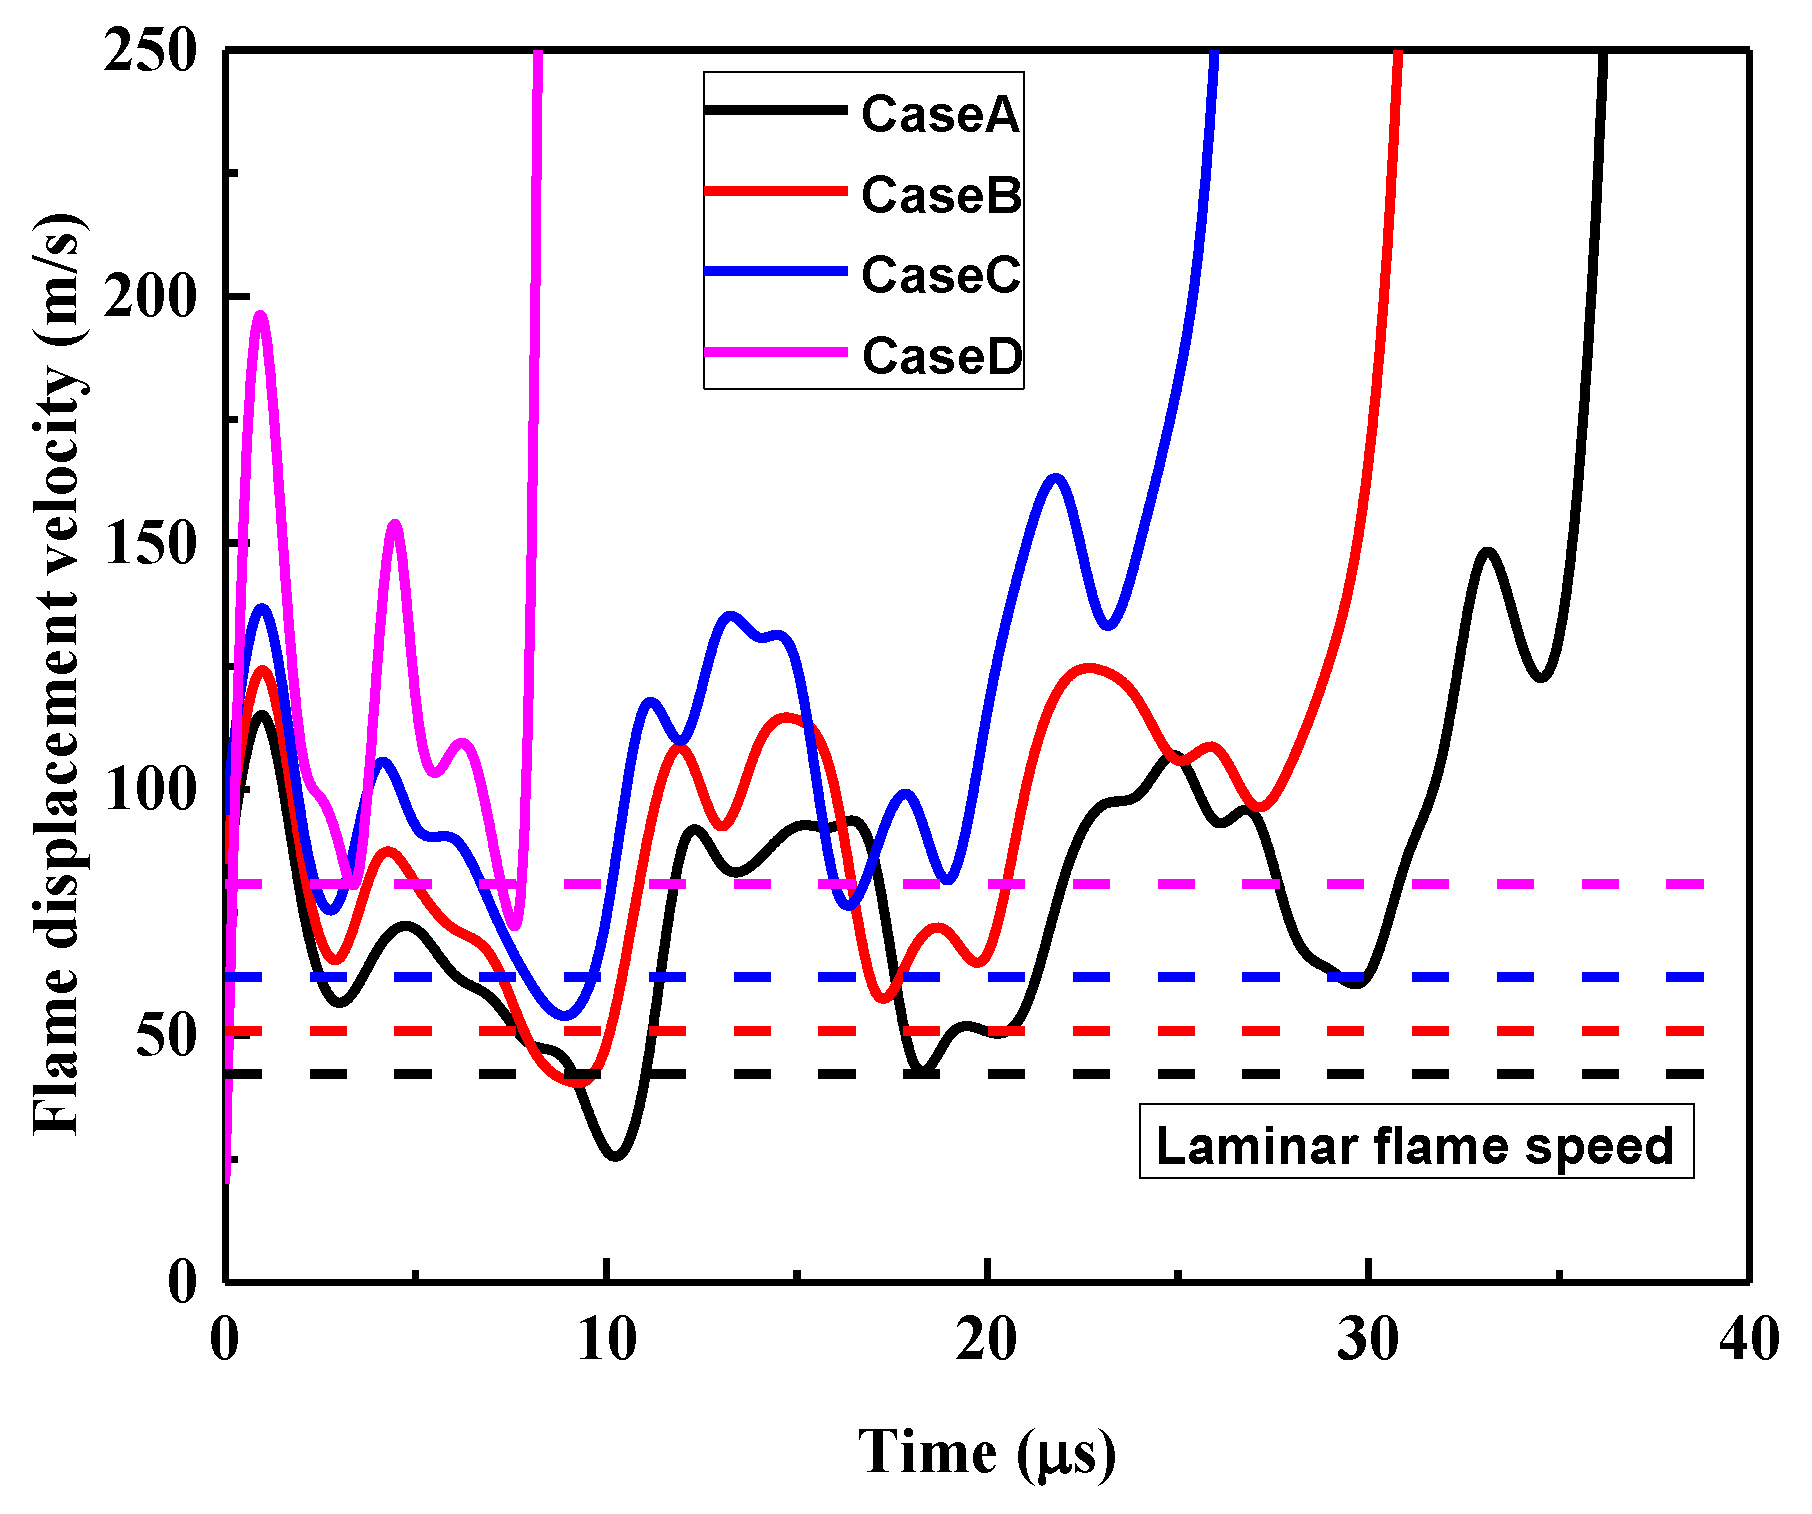
3.4. Flame Propagation and Flame Structure

To quantify the flame evolutions under different temperature conditions, Figure 13 shows the flame displacement velocity as a function of time, with the laminar flame speed for comparisons. Herein the flame front is defined as the location with the maximum heat release rate, and the flame displacement velocity is obtained by the derivatives of the flame front location to time variations. It is observed that caused by pressure wave disturbance in the confined pre-chamber, there are significant oscillation behaviors in flame displacement velocity, and the largest amplitude can reach beyond 60 m/s. Moreover, flame propagation positively correlates with the increase of initial temperatures, but there are no obvious variations in oscillation amplitude, such that the flame front passes the jet orifice at an earlier time under higher initial temperatures. However, compared with the laminar flame speed, the mean flame displacement velocity is approximately 1.5 times higher in all cases, indicating the promotion of pressure wave in flame propagation. Especially when the local auto-ignition events occur at T p = 1200 K, the flame displacement velocity is suddenly increased to a supersonic level.
Figure 14 shows the evolutions of the flame front location and flame displacement velocity at different initial temperatures. It is observed that, globally, flame displacement velocity is increased at higher initial temperatures in the pre-chamber (i.e., Y   4.0 mm). When coming across the jet orifice, flame displacement velocity is significantly increased up to a level close to the local sound speed for T p 1100 K cases. Whereas for T p = 1200 K case with auto-ignition occurrence in the pre-chamber, the flame displacement velocity is directly increased up to a supersonic level. Herein the second peak of flame displacement velocity of Case D represents the auto-ignition events in the main chamber. Furthermore, there are significant oscillations in flame displacement velocity in the main chamber, which are ascribed to the interactions between mixture distributions and turbulent vortexes downstream. On the other hand, oscillation behaviors are weakened in combustion dominated by leading pressure waves when auto-ignition events occur.
Finally, Figure 15 compares the evolutions of the heat release rate of T p = 900, 1100, and 1200 K cases. For a better comparison, the heat release rate of Case D shown in the picture is reduced by 30 times. It is observed that with the increase of initial temperatures, the flame thickness is significantly enlarged in the pre-chamber and main chamber. Whereas for the jet nozzle scenarios (i.e., 4.0 mm   Y   5.0 mm), the flame thickness and flame structure do not change obviously. After the flame front comes across the jet orifice, the peak heat release rate almost maintains at 2.0 × 10¹² J/m3 · s 1 for T p = 900 cases, whereas there is an obvious increase up to 6.0 × 10¹² J/m3 · s 1 at T p = 1100 K, indicating the enhancement of turbulent jet combustion. When initial temperatures are increased up to T p = 1200 K, the heat release rate is continuously increased after coming across the jet orifice, approaching 3.0 × 10¹⁴ J/m3 · s 1 , which is approximately 50 times higher than T p = 900 K case. This indicates that the heat release rate of the auto-ignition wave is much higher than that of the normal flame front, and the heat release rate is largely dependent on combustion modes.

4. Conclusions

To clarify the influence of temperature conditions on combustion evolutions of turbulent jet ignition systems, direct numerical simulations with detailed chemical kinetics were employed, allowing for pressure wave disturbance and irregular auto-ignition. It is found that depending on temperature conditions, two distinct flame evolutions are observed, i.e., the normal turbulent jet flame and the fast spherical flame. Flame evolutions are significantly affected by pressure wave disturbance in the pre-chamber, with obvious oscillation behaviors in flame displacement velocity. Flame propagation speed positively correlates with temperature conditions, but there are no obvious variations in oscillation amplitude.
Under low-temperature conditions (e.g., T p = 900 and 1000 K), some cold stoichiometric mixtures are released into the main chamber before the flame front arrives at the jet orifice, which induces obvious vortexes and enhanced mixing between lean and stoichiometric mixtures. The early-stage jet flame in the main chamber is found to be determined by the distributions of cold stoichiometric mixtures and the vortexes induced by the jet flow. Under medium temperature conditions (e.g., T p = 1100 K), pre-flame heat release can be encountered in the jet orifice, which causes the emergence of weak, leading pressure waves, which can be considered as the transition status of different combustion modes.
Under sufficient high-temperature conditions (e.g., T p = 1200 K), auto-ignition and supersonic deflagration become prevalent in the pre-chamber, resulting in faster flame propagation, greater heat release rate, and larger flame thickness. Consequently, developing detonation and subsonic deflagration can be observed in the jet orifice and the main chamber, depending on whether the pressure wave and flame front are coupled or not. Eventually, a spherical flame rather than the normal jet flame develops in the main chamber. The spherical flame propagation has a faster flame propagation speed and stronger combustion stability, and the strong pressure wave causes adverse effects on turbulent jet ignition.

Author Contributions

Conceptualization, J.P. and Y.H.; methodology, T.L.; software, Y.H.; validation, T.L.; formal analysis, Y.H.; investigation, L.W.; resources, H.W.; data curation, J.P.; writing—original draft preparation, Y.H.; writing—review and editing, J.P.; visualization, Y.H.; supervision, G.S.; project administration, J.P.; funding acquisition, J.P. All authors have read and agreed to the published version of the manuscript.

Funding

This research was funded by the National Key R&D Program of China (2017YFE0102800) and the National Natural Science Foundation of China (52076149, 51825603).

Institutional Review Board Statement

Not applicable.

Informed Consent Statement

Not applicable.

Data Availability Statement

Data is available on request from the authors. The data that support the findings of this study are available from the corresponding author upon reasonable request.

Conflicts of Interest

The authors declare no conflict of interest.

References

  1. Alvarez, C.E.C.; Couto, G.E.; Roso, V.R.; Thiriet, A.B.; Valle, R.M. A review of prechamber ignition systems as lean combustion technology for SI engines. Appl. Eng. 2018, 128, 107–120. [Google Scholar] [CrossRef]
  2. Pera, C.; Knop, V.; Chevillard, S.; Reveillon, J. Effects of Residual Burnt Gas Heterogeneity on Cyclic Variability in Lean-burn SI Engines. Flow Turbul. Combust. 2014, 92, 837–863. [Google Scholar] [CrossRef]
  3. Hwang, J.; Bae, C.; Park, J.; Choe, W.; Cha, J.; Woo, S. Microwave-assisted plasma ignition in a constant volume combustion chamber. Combust. Flame 2016, 167, 86–96. [Google Scholar] [CrossRef]
  4. Srivastava, D.K.; Agarwal, A.K. Combustion characteristics of a variable compression ratio laser-plasma ignited compressed natural gas engine. Fuel 2018, 214, 322–329. [Google Scholar] [CrossRef]
  5. Ślefarski, R.; Gołębiewski, M.; Czyżewski, P.; Grzymisławski, P.; Wawrzyniak, J. Analysis of Combustion Process in Industrial Gas Engine with Prechamber-Based Ignition System. Energies 2018, 11, 336. [Google Scholar] [CrossRef] [Green Version]
  6. Tian, H.; Cui, J.; Yang, T.; Fu, Y.; Tian, J.; Long, W. Experimental Research on Controllability and Emissions of Jet-Controlled Compression Ignition Engine. Energies 2019, 12, 2936. [Google Scholar] [CrossRef] [Green Version]
  7. Gombosuren, N.; Yoshifumi, O.; Hiroyuki, A. A Charge Possibility of an Unfueled Prechamber and Its Fluctuating Phenomenon for the Spark Ignited Engine. Energies 2020, 13, 303. [Google Scholar] [CrossRef] [Green Version]
  8. Sens, M.; Binder, E. Pre-Chamber Ignition as a Key Technology for Future Powertrain Fleets. MTZ Worldw. 2019, 80, 44–51. [Google Scholar] [CrossRef]
  9. Tanoue, K.; Kimura, T.; Jimoto, T.; Hashimoto, J.; Moriyoshi, Y. Study of prechamber combustion characteristics in a rapid compression and expansion machine. Appl. Eng. 2017, 115, 64–71. [Google Scholar] [CrossRef]
  10. Gentz, G.; Thelen, B.; Gholamisheeri, M.; Litke, P.; Brown, A.; Hoke, J.; Toulson, E. A study of the influence of orifice diameter on a turbulent jet ignition system through combustion visualization and performance characterization in a rapid compression machine. Appl. Eng. 2015, 81, 399–411. [Google Scholar] [CrossRef]
  11. Gholamisheeri, M.; Givler, S.; Toulson, E. Large eddy simulation of a homogeneously charged turbulent jet ignition system. Int. J. Engine Res. 2017, 20, 181–193. [Google Scholar] [CrossRef]
  12. Biswas, S.; Qiao, L. Ignition of ultra-lean premixed H2/air using multiple hot turbulent jets generated by pre-chamber combustion. Appl. Eng. 2018, 132, 102–114. [Google Scholar] [CrossRef]
  13. Karimi, A.; Nalim, M.R. Ignition by Hot Transient Jets in Confined Mixtures of Gaseous Fuels and Air. J. Combust. 2016, 2016, 1–13. [Google Scholar] [CrossRef] [Green Version]
  14. Reddy, H.; Abraham, J. A numerical study of vortex interactions with flames developing from ignition kernels in lean methane/air mixtures. Combust. Flame 2011, 158, 401–415. [Google Scholar] [CrossRef]
  15. Sidey, J.A.M.; Mastorakos, E. Pre-Chamber Ignition Mechanism: Simulations of Transient Autoignition in a Mixing Layer Between Reactants and Partially-Burnt Products. Flow Turbul. Combust. 2018, 101, 1093–1102. [Google Scholar] [CrossRef] [Green Version]
  16. Malé, Q.; Staffelbach, G.; Vermorel, O.; Misdariis, A.; Ravet, F.; Poinsot, T. Large Eddy Simulation of Pre-Chamber Ignition in an Internal Combustion Engine. Flow Turbul. Combust. 2019, 103, 465–483. [Google Scholar] [CrossRef] [Green Version]
  17. Reddy, H.; Abraham, J. Ignition kernel development studies relevant to lean-burn natural-gas engines. Fuel 2010, 89, 3262–3271. [Google Scholar] [CrossRef]
  18. Qin, F.; Shah, A.; Huang, Z.-W.; Peng, L.-N.; Tunestal, P.; Bai, X.-S. Detailed numerical simulation of transient mixing and combustion of premixed methane/air mixtures in a pre-chamber/main-chamber system relevant to internal combustion engines. Combust. Flame 2018, 188, 357–366. [Google Scholar] [CrossRef]
  19. Validi, A.; Jaberi, F. Numerical Study of Turbulent Jet Ignition in a Lean Premixed Configuration. Flow Turbul. Combust. 2018, 100, 197–224. [Google Scholar] [CrossRef]
  20. Validi, A.; Schock, H.; Jaberi, F. Turbulence–Combustion Interactions in Premixed and Non-premixed Flames Generated by Hot Active Turbulent Jets. Flow Turbul. Combust. 2020, 106, 849–880. [Google Scholar] [CrossRef]
  21. Pan, J.; Zheng, Z.; Wei, H.; Pan, M.; Shu, G.; Liang, X. An experimental investigation on pre-ignition phenomena: Emphasis on the role of turbulence. Proc. Combust. Inst. 2020. [Google Scholar] [CrossRef]
  22. Rimkus, A.; Žaglinskis, J.; Stravinskas, S.; Rapalis, P.; Matijošius, J.; Bereczky, Á. Research on the Combustion, Energy and Emission Parameters of Various Concentration Blends of Hydrotreated Vegetable Oil Biofuel and Diesel Fuel in a Compression-Ignition Engine. Energies 2019, 12, 2978. [Google Scholar] [CrossRef] [Green Version]
  23. Verhelst, S.; Wallner, T. Hydrogen-fueled internal combustion engines. Prog. Energy Combust. Sci. 2009, 35, 490–527. [Google Scholar] [CrossRef] [Green Version]
  24. Deiterding, R. Parallel Adaptive Simulation of Multi-Dimensional Detonation Structures. Ph.D. Thesis, Brandenburgische Technische Universität Cottbus-Senftenberg, Cottbus, Germany, 2003. [Google Scholar]
  25. Deiterding, R. High-Resolution Numerical Simulation and Analysis of Mach Reflection Structures in Detonation Waves in Low-Pressure H2–O2–Ar Mixtures: A Summary of Results Obtained with the Adaptive Mesh Refinement Framework AMROC. J. Combust. 2011, 2011, 18. [Google Scholar] [CrossRef] [Green Version]
  26. Cai, X.; Liang, J.; Deiterding, R.; Mahmoudi, Y.; Sun, M. Experimental and numerical investigations on propagating modes of detonations: Detonation wave/boundary layer interaction. Combust. Flame 2018, 190, 201–215. [Google Scholar] [CrossRef] [Green Version]
  27. Cerminara, A.; Deiterding, R.; Sandham, N. Direct Numerical Simulation of Blowing in a Hypersonic Boundary Layer on a Flat Plate with Slots. In Proceedings of the Fluid Dynamics Conference, AIAA AVIATION Forum, American Institute of Aeronautics and Astronautics, Barcelona, Spain, 25–29 June 2018. [Google Scholar]
  28. Liang, J.; Cai, X.; Lin, Z.; Deiterding, R. Effects of a hot jet on detonation initiation and propagation in supersonic combustible mixtures. Acta Astronaut. 2014, 105, 265–277. [Google Scholar] [CrossRef]
  29. Peng, H.; Huang, Y.; Deiterding, R.; Luan, Z.; Xing, F.; You, Y. Effects of jet in crossflow on flame acceleration and deflagration to detonation transition in methane–oxygen mixture. Combust. Flame 2018, 198, 69–80. [Google Scholar] [CrossRef] [Green Version]
  30. Wei, H.; Zhang, X.; Zeng, H.; Deiterding, R.; Pan, J.; Zhou, L. Mechanism of end-gas autoignition induced by flame-pressure interactions in confined space. Phys. Fluids 2019, 31, 076106. [Google Scholar] [CrossRef]
  31. Li, J.; Zhao, Z.; Kazakov, A.; Dryer, F.L. An updated comprehensive kinetic model of hydrogen combustion. Int. J. Chem. Kinet. 2004, 36, 566–575. [Google Scholar] [CrossRef]
  32. Benekos, S.; Frouzakis, C.E.; Giannakopoulos, G.K.; Bolla, M.; Wright, Y.M.; Boulouchos, K. Prechamber ignition: An exploratory 2-D DNS study of the effects of initial temperature and main chamber composition. Combust. Flame 2020, 215, 10–27. [Google Scholar] [CrossRef]
  33. Benekos, S.; Frouzakis, C.E.; Giannakopoulos, G.K.; Altantzis, C.; Boulouchos, K. A 2-D DNS study of the effects of nozzle geometry, ignition kernel placement and initial turbulence on prechamber ignition. Combust. Flame 2021, 225, 272–290. [Google Scholar] [CrossRef]
  34. Pan, J.; Wei, H.; Shu, G.; Chen, R. Effect of pressure wave disturbance on auto-ignition mode transition and knocking intensity under enclosed conditions. Combust. Flame 2017, 185, 63–74. [Google Scholar] [CrossRef] [Green Version]
  35. Pan, J.; Dong, S.; Wei, H.; Li, T.; Shu, G.; Zhou, L. Temperature gradient induced detonation development inside and outside a hotspot for different fuels. Combust. Flame 2019, 205, 269–277. [Google Scholar] [CrossRef]
  36. Dai, P.; Chen, Z.; Chen, S.; Ju, Y. Numerical experiments on reaction front propagation in n-heptane/air mixture with temperature gradient. Proc. Combust. Inst. 2015, 35, 3045–3052. [Google Scholar] [CrossRef]
  37. Gu, X.J.; Emerson, D.R.; Bradley, D. Modes of reaction front propagation from hot spots. Combust. Flame 2003, 133, 63–74. [Google Scholar] [CrossRef]
Figure 1. Physical model of the turbulent jet ignition system (unit: mm).
Energies 14 02226 g001
Figure 2. Evolutions of flame front location predicted by various computation meshes.
Energies 14 02226 g002
Figure 3. Contours of temperature, H2 mass fraction, and density gradient for the pre-chamber at Case A: T p = 900 K.
Energies 14 02226 g003
Figure 4. Contours of temperature, H2 mass fraction, and vorticity for the main chamber at Case A: T p = 900 K.
Energies 14 02226 g004
Figure 5. Distributions of temperature, pressure, flow velocity, and heat release rate (HRR) at different locations along the y-axis for Case A: T p = 900 K.
Energies 14 02226 g005
Figure 6. Contours of pressure and heat release rate of the jet orifice and the main chamber for Case C: T p = 1100 K.
Energies 14 02226 g006
Figure 7. Contours of heat release rate and pressure at different initial temperatures. Case A: T p = 900 K, Case B: T p = 1000 K, and Case C: T p = 1100 K.
Energies 14 02226 g007
Figure 8. The magnitude of the horizontal velocity at line A.
Energies 14 02226 g008
Figure 9. Contours of temperature, H2 mass fraction, heat release rate, and pressure of the pre-chamber for Case D: T p = 1200 K.
Energies 14 02226 g009
Figure 10. Contours of temperature, H2 mass fraction, heat release rate, and pressure of the main chamber for Case D: T p = 1200 K.
Energies 14 02226 g010
Figure 11. Contours of density (black lines) and OH mass fraction (colored lines) for Case D: T p = 1200 K.
Energies 14 02226 g011
Figure 12. Distributions of temperature, pressure, flow velocity, and heat release rate (HRR) at different locations along the y-axis for Case D: T p = 1200 K.
Energies 14 02226 g012
Figure 13. Flame displacement velocity at different locations along the y-axis.
Energies 14 02226 g013
Figure 14. Evolutions of the flame front (upper) and flame displacement velocity (lower) at different initial temperatures. Case A: T p = 900 K, Case B: T p = 1000 K, Case C: T p = 1100 K, and Case D: T p = 1200 K.
Energies 14 02226 g014
Figure 15. The heat release rate of flame front for Case A: T p = 900 K, Case C: T p = 1100 K, and Case D: T p = 1200 K.
Energies 14 02226 g015
Table 1. Initial thermodynamic conditions of pre-chamber and main chamber.
CasesTP (K)TM (K)P (atm)φPφM
A9008608.51.00.6
B10009608.51.00.6
C110010608.51.00.6
D120011608.51.00.6
Publisher’s Note: MDPI stays neutral with regard to jurisdictional claims in published maps and institutional affiliations.

