Article

Model-Predictive-Control-Based Reference Governor for Fuel Cells in Automotive Application Compared with Performance from a Real Vehicle

1
Institut für Mechanik und Mechatronik, Technische Universität Wien, Getreidemarkt 9, 1060 Vienna, Austria
2
AVL List GmbH, Hans-List-Platz 1, 8020 Graz, Austria
*
Author to whom correspondence should be addressed.
Energies 2021, 14(8), 2206; https://doi.org/10.3390/en14082206
Submission received: 24 March 2021 / Revised: 7 April 2021 / Accepted: 12 April 2021 / Published: 15 April 2021

Abstract

:
In this paper, a real-time capable reference governor superordinate model predictive controller (RG-MPC) is developed for fuel cell (FC) control suitable for automotive application. The RG-MPC provides reference trajectories for the subordinate proportional-integral (PI) controllers, which act directly on the FC system. Antiwindup and decoupling schemes, which are common problems in multivariable PI control, are unnecessary, given that the RG-MPC can inherently consider constraints and multivariable systems. The PI dynamics are incorporated into the prediction model used for control, ensuring the feasibility of the provided references for the PI controllers. The successive linearization technique is used in the RG-MPC to cope with the model’s nonlinear nature in real-time. The concept has been illustrated in a simulation scenario featuring efficient and safe power control of an FC stack in automotive application using real driving data obtained from an in-house-built FC vehicle. This work is the first step towards upgrading an existing, PI-based control scheme without the necessity of completely rebuilding the interface.

1. Introduction

In the ever-increasing public awareness of the presence of accelerated environmental pollution processes in the world, researchers from many fields of expertise have focused their efforts into finding energy sources alternative to fossil fuels and new sources altogether [1,2]. Development of hydrogen-powered fuel cells (FC) is of particular interest due to their zero-emission nature and wide area of applicability such as in portable, mobile, and stationary devices. The fact that there is a vast quantity of hydrogen present on Earth in the form of water, in theory, removes the problem of energy shortage in the world. In this paper, automotive application of fuel cells will be of special interest. In the world’s attempt to use clean energy in automotive applications, zero-emission polymer electrolyte membrane (PEM) fuel cells qualify as an interesting solution because of their high power density, fast start-up, and low operating temperature. To deliver the required power demand to the vehicle, an appropriate control strategy must be developed. Apart from the power request, additional objectives have to be considered, namely, safety and efficiency. It is important that, during operation, the FC stack powering the vehicle does not run into degrading operating conditions such as hydrogen/oxygen starvation, excess pressure difference across the membrane, nitrogen accumulation, membrane dryout, flooding, etc. On the economic side, the control strategy should aim to reduce the parasitic power losses (e.g., compressor, recirculation pump) as much as possible as well as increase the FC stack efficiency by operating in favorable voltage regions, i.e., at higher voltages.
Much research has been done regarding fuel cell control. A recent fuel cell control review paper brings forth the most popular control methods used in this field [3]. The well-known proportional-integral-derivative (PID) control was used in [4,5] for fuel starvation prevention by manipulating the current or air/hydrogen flow. Adaptive control of oxygen stoichiometry in terms of sliding mode control and robust adaptive control was used in [6,7,8], where the controller’s parameters were estimated by closed-loop least square parameter identification algorithms. Neural optimal control (NOC) was used in [9] to control the current demand by training the cerebellar model articulation controller. Its long-term memory would be trained offline, reducing the computational effort needed during operation. Its short-term memory only was trained online, then the controller was compared to a PI controller and showed better results. In addition, another concept superior to PI control is dynamic neural network control (DDNC) used in [10], where the neural network learns continuously. The existence of all mentioned control strategies clearly shows that fuel cells have many interesting problems that can be tackled by different advanced approaches. The question that arises is how to effectively use the control theory knowledge in dynamic practical applications such as a vehicle, as opposed to only partially controlling a certain subsystem. In this work, one way of using advanced control schemes in automotive application will be proposed.
When it comes to vehicle level control, the majority of manufacturers and industries still prefer to use rule-based and/or PI-based control algorithms since they are simple to understand and implement, unlike some of the above reported methods that require advanced implementation techniques or control engineering knowledge.
A more sophisticated control algorithm than PI, but still intuitive enough to be understood easily, is model predictive control (MPC) which uses a model to predict future operating conditions of the fuel cell and act on the plant so that all the control goals are fulfilled. Such an approach is appropriate for fuel cell control since it can inherently deal with multivariable systems due to its knowledge of the whole system dynamics, and incorporate constraints, both of which are drawbacks of PI-based control. Due to the mentioned strong characteristics of MPC, researchers have used this concept in fuel cell control for a variety of objectives. MPC was popularly used in reactant starvation prevention as reported in [11,12,13,14,15]. The membrane pressure difference was controlled by MPC in [16], as well as in [11,12], where protection against compressor surge/choke was the control goal. The concept of MPC was even used in an experimental setup to achieve a power request, however, the reported load profile was in the range of a few kilowatts and stayed at a single steady-state power value for a long time, not representing a real drive cycle [17,18]. A recent paper stands out, showing an interesting approach to using linear time by varying MPC with the goal of controlling the power of the fuel cell in simulated driving conditions while imposing constraints on many critical physical quantities (e.g., pressure, temperature, humidity) ensuring safe operation of the fuel cell, partly sharing the paradigm of this paper [19]. MPC shows the most promise compared to other control strategies in the sense that it exhibits all the elements necessary for safe and efficient operation of multivariable constrained systems [20]. However, even though the advantages of MPC over PI are known and obvious, it is usually not used in industries for a few reasons. Firstly, PI controllers are easily understandable, and secondly, much effort must be invested in designing and tuning the controllers. Both reasons give points to the reluctance of changing the existing setup. In this paper, the concept of reference governor MPC (RG-MPC) is introduced into the world of fuel cell control, serving as a bridge between the sophisticated MPC approach and the well-known, easy-to-use PI concept. The idea of MPC-based reference governors is not new, but their usage is scarce in fuel cell control theory. An RG-MPC provides optimized references for the PI controllers acting directly on the plant [21,22,23,24]. This approach gives two major advantages. First, the reference trajectories are given by the RG-MPC so that all the constraints are satisfied, removing the necessity of using any antiwindup scheme or retuning the PI controllers, both of which can deteriorate performance. Second, MPC inherently handles multivariable systems meaning that no decoupling schemes are needed, unlike in a purely PI-based scheme, since an individual controller is not aware of the existence of the other PI controllers. Additionally, if the PI controllers have been already well tuned and implemented, and if during operation of the RG-MPC something goes wrong, the operating strategy can be easily switched back to the one with PIs only. With that in mind, placing the RG-MPC on top of the existing PI controllers as a superordinate control layer shows more promise towards implementing an optimal control scheme to an industrial plant rather than completely replacing the PIs with MPC. To test and illustrate the above-described control idea in a simulation environment, a nonlinear state-space plant model describing the fuel cell stack was used. The plant model was then augmented with the PI dynamics resulting in the prediction model used by the RG-MPC to provide optimized references for the PIs. The control goal was to deliver the power demand from a research fuel cell vehicle presented in Section 2, while ensuring safe and efficient operating conditions. A schematic illustration of the above explained scenario is shown in Figure 1. Since the model is nonlinear, the successive linearization technique was used [25,26,27,28]. For more detail regarding the model and the successive linearization-based MPC, the reader is referred to the authors’ previous work [29,30]. The problem of state estimation is not treated in this paper for brevity. The state observer implementation used in this work can be found in [31]. This paper is organized as follows. In Section 2, the vehicle is briefly presented and discussed. In Section 3, the model is shown and the incorporation of PI dynamics into the model is discussed. Also, the development of the RG-MPC is brought, detailing the control goals and constraints, as well as the formulation of the optimization problem. In Section 4, results showing the tracking of a real vehicle’s power demand using the RG-MPC are presented. Finally, in Section 5, the paper is concluded with a proposal for future work on implementing optimal control into the control units of fuel cell vehicles.

2. Vehicle as Validation Data Generator

The RG-MPC was tested in a simulation environment mimicking a real drive cycle performed by a research vehicle developed in the scope of the Keytech4EV project [32]. In the hybrid electric vehicle, the engine bay was replaced with a fuel cell system. The car is shown in Figure 2 and more information on it can be found in [29,30].

Vehicle Control Strategy

In the vehicle control unit, the low-level controllers represented by the middle column in Figure 3, receive their setpoints from experimentally obtained and calibrated optimization maps. Clearly, the effort for obtaining the proper set-point calculation strategy is considerable and consists of some important elements:
  • Tuning the controllers: it takes a lot of time, especially since decoupling has to be achieved and antiwindup schemes implemented. Further, the number of controllers to be tuned is high.
  • Experimental work: to relate the requested power to the current, and then the current to all the other variables, the system has to be identified and a series of experiments with different levels of excitation at multiple operating points need to be conducted. This obviously includes a significant financial investment.
  • Recalibration: in the case that a component is replaced (e.g., new compressor), the calibration process has to be repeated to some degree.

3. Methods

3.1. Plant Model

In this subsection, the model used for the study is briefly presented as the detailed derivation can be found in [29,30]. The model structure is shown in Figure 4.

3.1.1. Cathode Submodel

Three interconnected zero-dimensional manifolds represent the cathode channel of the fuel cell. The first in the series, called the supply manifold, is described by a single dynamic state, the supply manifold pressure p s m c a . The center manifold is described by four states, namely, the masses of oxygen, nitrogen, water vapor, and liquid water: m O 2 c a , m N 2 c a , m v a p c a , m l i q c a , respectively. The exit manifold is described by one state, the exit manifold pressure p e m c a .
Entering the cathode channel is the inlet air mass-flow W i n c a , and at the end of the channel is a backpressure valve characterized by its opening position α c a . Oxygen stoichiometry is defined as the ratio between the inlet oxygen flow and the rate of oxygen consumption in the reaction. It is denoted as λ O 2 .

3.1.2. Anode Submodel

Similar with the cathode side, the anode channel is described by three interconnected zero-dimensional manifolds. The first of the three is described by the anode supply manifold pressure p s m a n . The center manifold is described by the masses of hydrogen, nitrogen, water vapor, and liquid water: m H 2 a n , m N 2 a n , m v a p a n , m l i q a n , respectively. The exit manifold pressure p e m a n describes the last volume.
Hydrogen entering the anode supply manifold is quantified with the inlet mass-flow W i n a n . At the end of the channel, there exists a purge valve, the opening of which is described with α p u r g e . Hydrogen stoichiometry is defined as the ratio between the inlet hydrogen flow and the rate of hydrogen consumption in the reaction. It is denoted as λ H 2 .

3.1.3. GDL Submodel

The dynamics of the GDL on the anode side are neglected due to hydrogen being a highly diffusive gas, but on the cathode, they are described by 3 states—the masses of oxygen, nitrogen, water vapor: m O 2 G D L , m N 2 G D L , m v a p G D L , respectively. The mass exchange between the GDL and the cathode channel is through the diffusion law.

3.1.4. Power and Efficiency

The electrochemical submodel, i.e., the dependence of the FC voltage V on the current I and internal states, is adopted from [33]. The power produced by the FC stack is defined as P s t = V I . The power used by the compressor P c p is defined as in [34]:
P c p = C p T a t m η c p [ ( p s m c a p a t m ) γ 1 γ 1 ] W i n c a ,
where C p = 1004 J kg 1 K 1 is the specific heat capacity of air, T a t m = 25 °C is the temperature of inlet air, η c p = 0.62 is the compressor efficiency, p a t m = 101,325 Pa is the pressure of air entering the compressor, and γ = 1.4 is the ratio of the specific heats of air. The net power is then the difference between the produced power and the parasitic compressor power: P n e t = P s t P c p . The consumed hydrogen power is defined as
P H 2 = E 0 N c e l l s I ,
where E 0 is the open circuit voltage of a single cell and N c e l l s is the total number of cells in the stack. The system efficiency η s y s is defined as the ratio between the net power and the consumed hydrogen power
η s y s = P n e t P H 2 .
Inserting the expressions for P n e t and P H 2 into Equation (3), one obtains the expression for the system efficiency:
η s y s = V I P c p E 0 N c e l l s I .
Analyzing the above equation, one can conclude that in order to maximize efficiency, the FC stack should operate at higher voltages and lower compressor powers.

3.1.5. Surge and Choke Margin

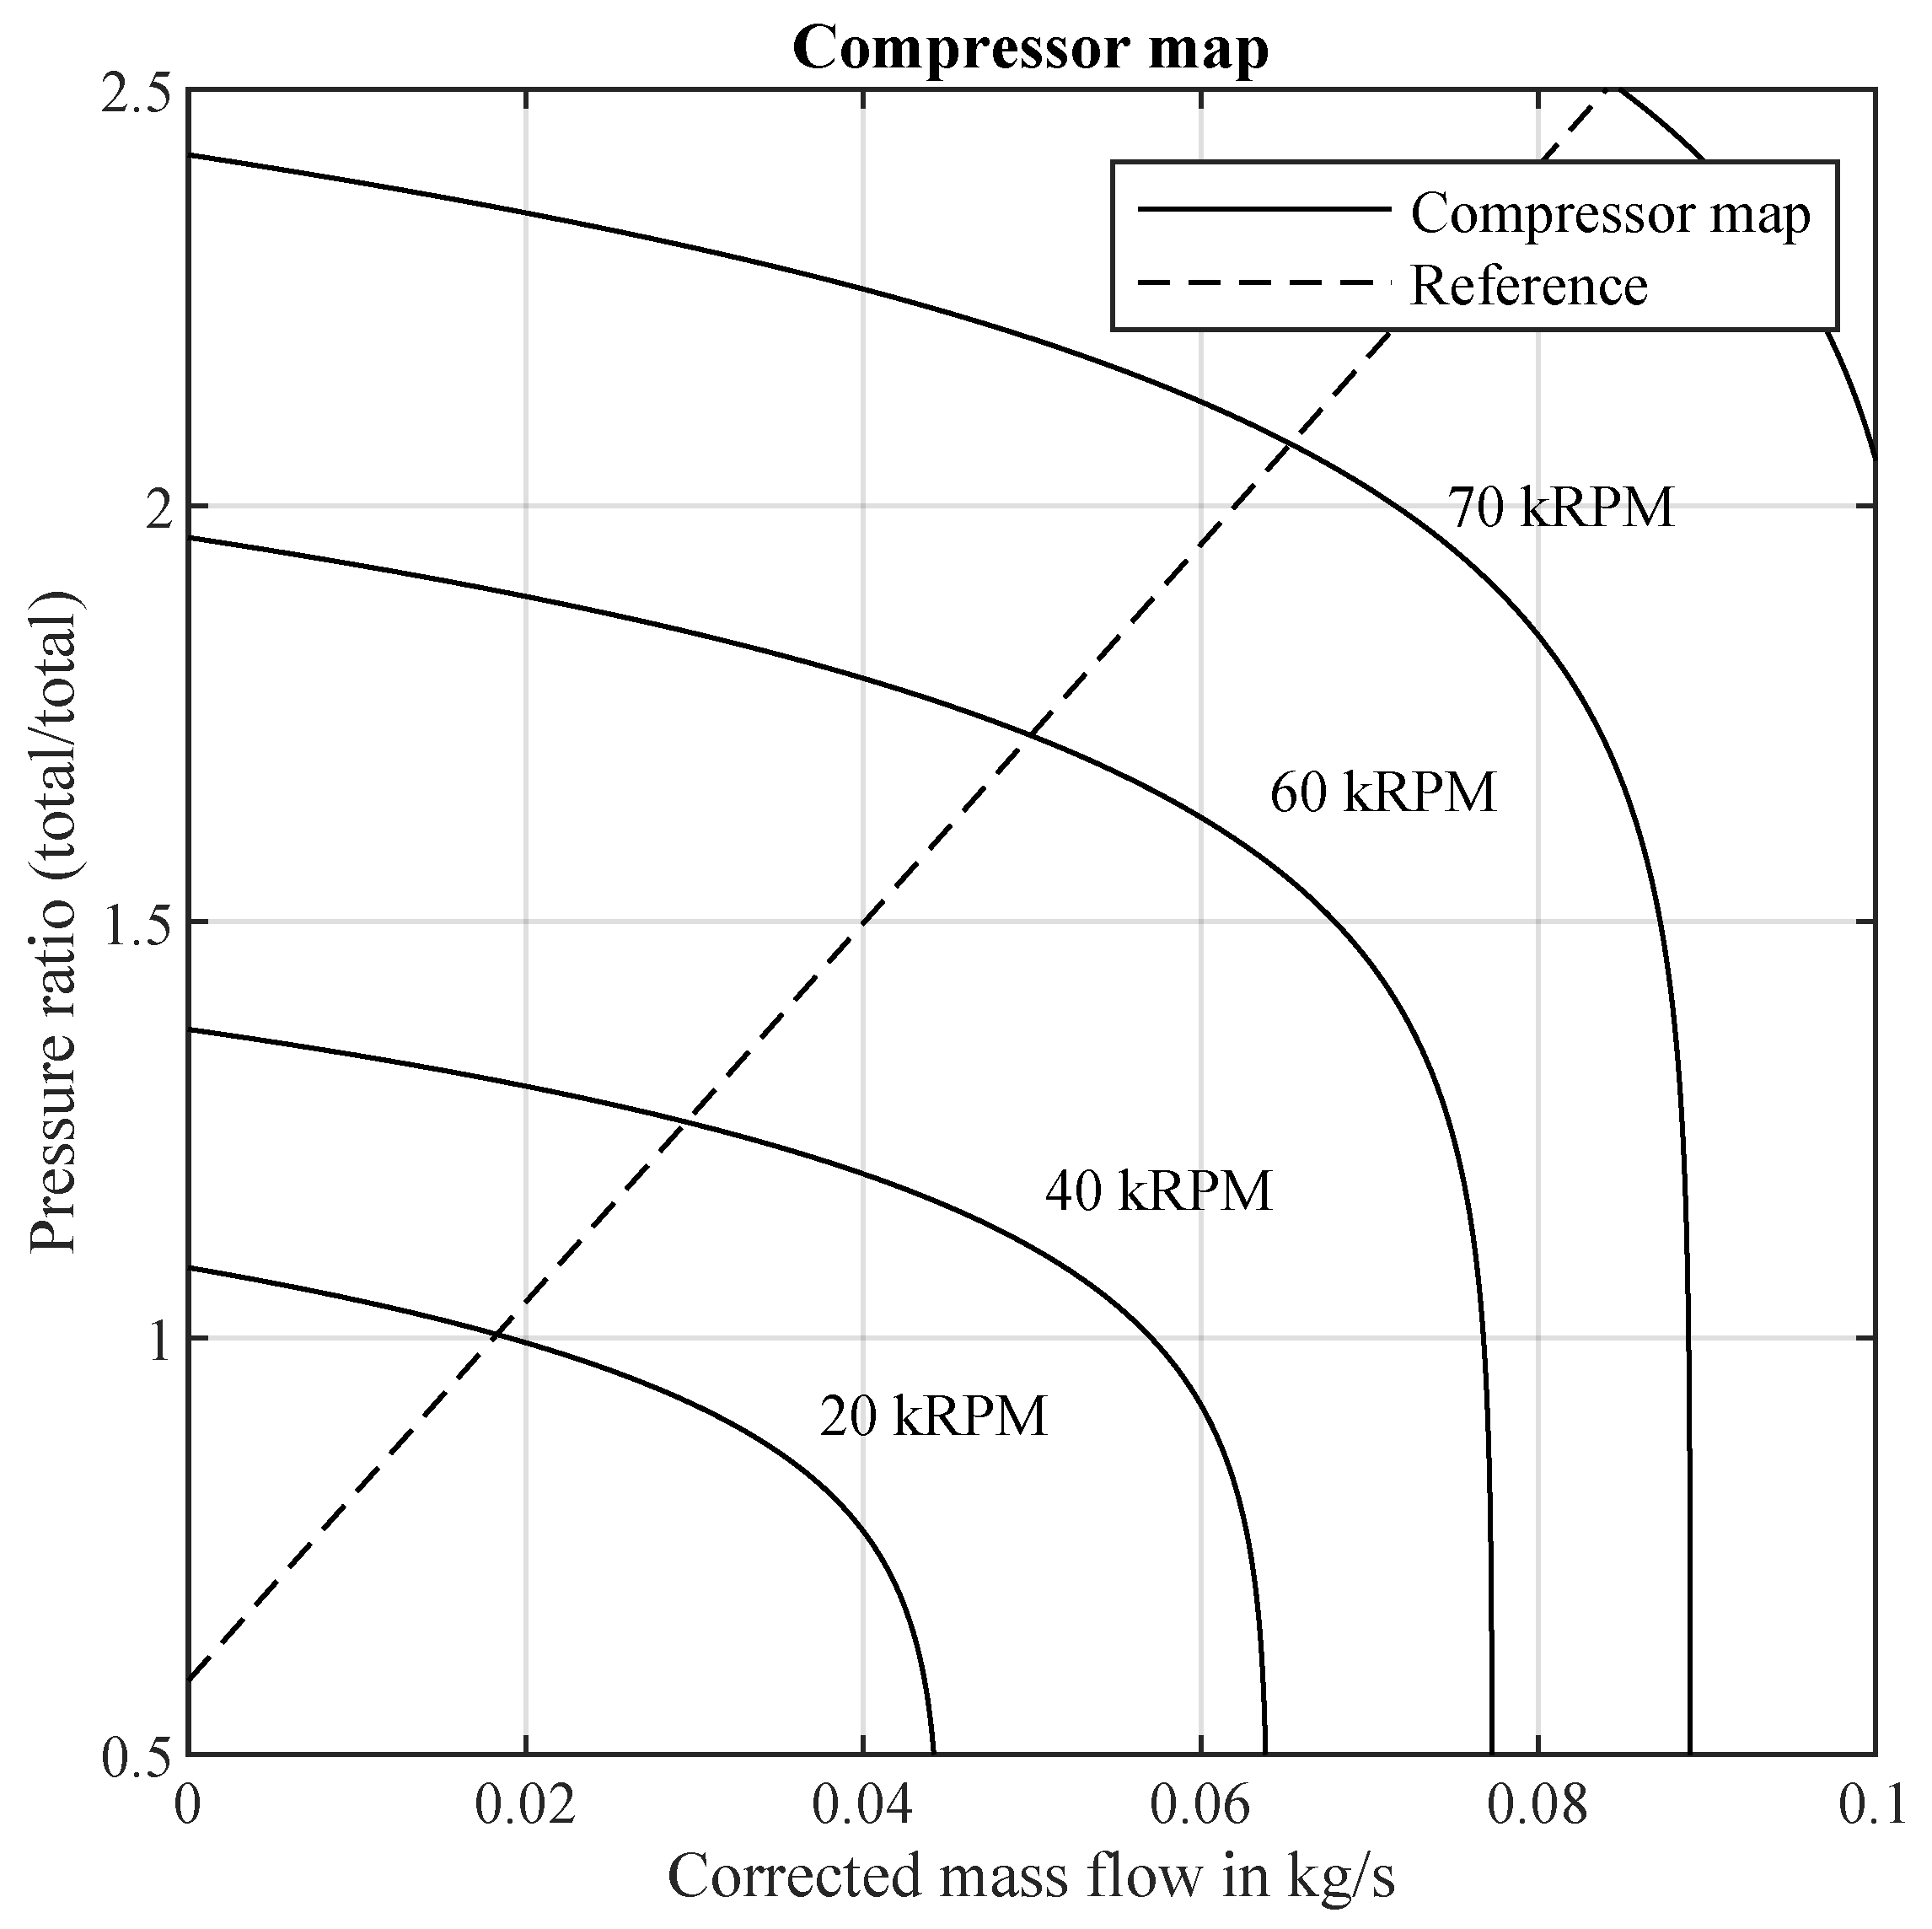
A major concern in FC operation control is keeping the compressor operation in a safe area, namely, far from the surge and choke lines, preventing compressor damage. In this work, a hand-tuned reference is given to the controller to track so it has the drive to operate far from dangerous regions. The reference is a linear relation between the pressure ratio of the air exiting and entering the compressor p r a t i o and the corrected air mass-flow exiting the compressor W c r , shown in Figure 5.
p r a t i o = 22.74 W c r + 0.5885 .
The distance between the current operating point and the closest point on the reference line is denoted as d and defined as
d = | 22.74 W c r + 0.5885 p r a t i o | 1 + ( 22.74 ) 2 .

3.1.6. Plant Model Summary

In summary, the FC model is described with the state vector x F C , the input vector u F C , and the output vector y F C :
x F C = [ p s m c a m O 2 c a m N 2 c a m v a p c a m l i q c a p e m c a p s m a n m H 2 a n m N 2 a n m v a p a n m l i q a n p e m a n a m , d m O 2 G D L m N 2 G D L m v a p G D L ] T
u F C = [ W i n c a W i n a n I α c a α p u r g e ] T
y F C = [ P n e t η s y s Δ p d λ O 2 λ H 2 ] T ,
where a m , d is a state describing the dynamic wetting and drying of the membrane and Δ p = p s m a n p s m c a is the pressure difference across the membrane.
Finally, the nonlinear state-space model reads
x ˙ F C = f ( x F C , u F C )
y F C = h ( x F C , u F C ) .

3.2. Prediction Model

In Figure 1, it is shown that the PI controllers provide the signals for the control inputs. The inputs in question are the hydrogen mass-flow and cathode backpressure valve position:
W i n a n = K p , a n ( p s m , r e f a n p s m a n ) + K i , a n 0 t ( p s m , r e f a n p s m a n ) d τ
α c a = K p , c a ( p s m , r e f c a p s m c a ) + K i , c a 0 t ( p s m , r e f c a p s m c a ) d τ .
For simplicity, the following definitions are introduced:
e a n = p s m , r e f a n p s m a n
e c a = p s m , r e f c a p s m c a
I ˙ a n = e a n
I ˙ c a = e c a ,
leading to a more readable expression for the PI outputs:
W i n a n = K p , a n e a n + K i , a n I a n
α c a = K p , c a e c a + K i , c a I c a .
To obtain a model capable of predicting the dynamics of the system, including the PI controllers, it is necessary to augment the plant model with the integrator states of said controllers:
x p r e d = [ x F C I a n I c a ] .
Furthermore, the inputs for the prediction model are different from the ones for the plant model in the following way:
u F C = [ W i n c a W i n a n I α c a α p u r g e ] u p r e d = [ W i n c a p s m , r e f a n I p s m , r e f c a α p u r g e ] .
The outputs of the prediction model are divided into the ones to be controlled, constrained, and observed. The latter refers to those outputs neither controlled nor constrained, but needed for the evaluation of the PI output, namely, the cathode and anode supply manifold pressure.
y p r e d = [ y p r e d , c o n t r o l l e d y p r e d , c o n s t r a i n e d y p r e d , o b s e r v e d ] = [ P n e t η s y s Δ p d λ O 2 λ H 2 W i n a n α c a p s m a n p s m c a ] .
Specific values of the constrained inputs and output will be discussed in Section 3.6, where the MPC design is addressed.

3.3. Successive Linearization

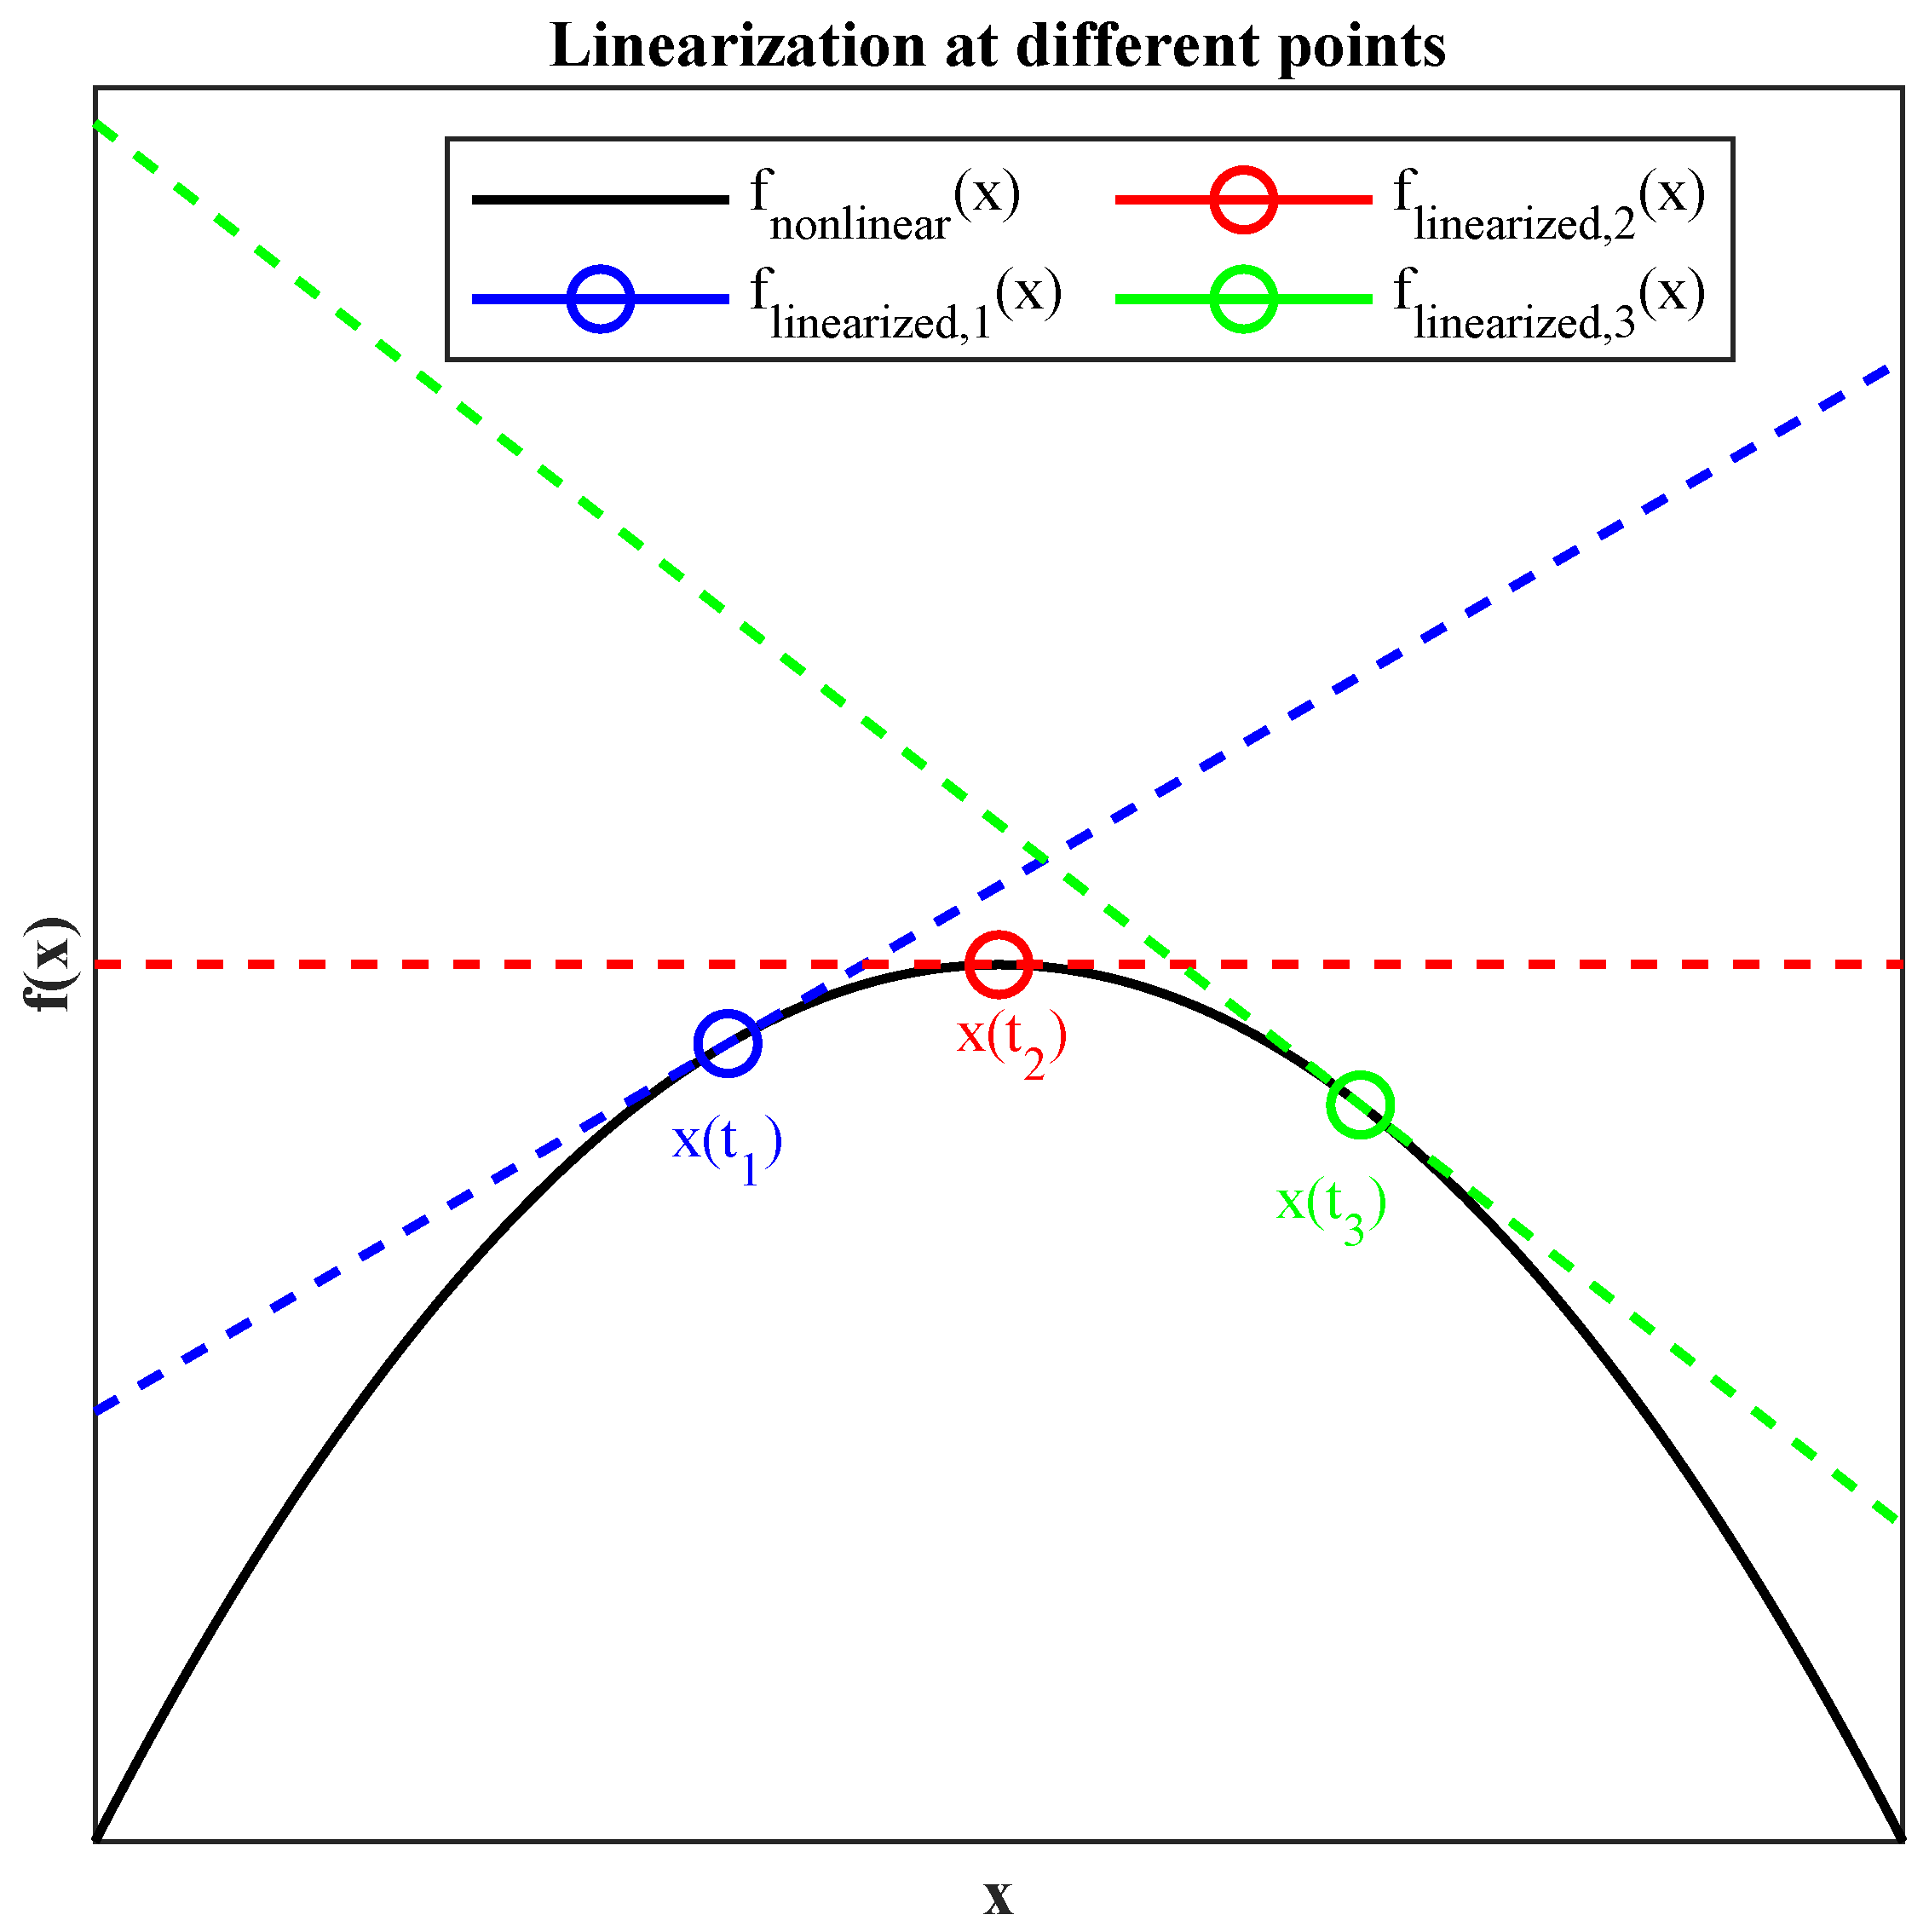
In this subsection, the successive linearization framework will be presented and later on used by the controller. This way, nonlinear systems can be easily controlled using the concept of the successive-linearization-based MPC [19,25,27,28,30]. An illustration of the concept can be seen in Figure 6.
The nonlinear prediction model is linearized around the current state ( x k , u k ) at each time step k. The linearized model is then discretized using zero-order-hold and a discrete time prediction model is obtained. Since the linearization point is typically not stationary, off-equilibrium terms have to be accounted for. This is done by using the velocity form or so-called “delta formulation” of the MPC, where the off-equilibrium terms cancel out. The full derivation of the concept can be found in [30], here, only the end result is shown here. The prediction model is
Δ x i + 1 = A d , k Δ x i + B d , k Δ u i ,
where x is the state vector; u is the input vector; i is the prediction index; and A d and B d are the current system and input matrix, respectively, which are updated at every time step k. The subscript d denotes that the matrices are in discrete time.

3.4. MPC Formulation

In the previous subsection, the method of obtaining a linear prediction model each time step has been explained. In this subsection, the formulation of the MPC using the obtained linear model is presented. Firstly, it is important to emphasize that in this work, as already stated, the velocity form MPC is used, having Δ x i = x i x i 1 as its state vector and Δ u i = u i u i 1 as its input vector, where i is the running index in the prediction. In some literature, this is referred to as the “delta formulation” MPC. To obtain offset-free reference tracking, an integrator is added for every output. Following the algorithm, the differential state vector Δ x is augmented with the output vector:
x a u g = [ Δ x p r e d y p r e d ] .
The augmented system instantaneously linearized at time k is then as follows:
[ Δ x p r e d y p r e d ] i + 1 = [ A k 0 C k A d , k I ] [ Δ x p r e d y p r e d ] i + [ B d , k C d , k B d , k ] Δ u i + [ 0 D d , k ] Δ u i + 1
y p r e d i = [ 0 I ] [ Δ x p r e d y p r e d ] i .
Due to present direct-feedthrough in the model, the D k matrix shows up in Equation (25). To address this issue, the optimal control move is calculated for the next time step i + 1 , incorporating the last solution Δ u i as a predicted disturbance and rendering the system causal.

3.5. Objective Formulation

The reference values of the controlled outputs are as follows:
  • System net power—the reference is taken from the vehicle in Section 2.
  • System efficiency—the reference value is 1.
  • Pressure difference across the membrane—the reference value is 200 mbar.
  • Distance from optimal line in the compressor map—the reference value is 0.
The goal of the controller is the minimization of the cost function J:
J = i = 1 N p | | y r e f k + i y ^ k + i | | Q y 2 + j = 1 N c | | Δ u k + j | | R 2 ,
where N p and N c are the prediction and control horizon; y r e f k + i , y ^ k + i , and Δ u k + j are the reference output, prediction output, and control move value i and j steps into the prediction from the linearization instant k, respectively; and Q y and R are the outputs and inputs weighing matrices, respectively.
The outputs are weighted as follows:
Q y = [ 1 100 k W 2 0 0 0 0 1 0 0 0 0 1 b a r 2 0 0 0 0 1 20 ] .
The values in this matrix suggest that following the net power trajectory has highest priority, where the other two tracking control goals, system efficiency and membrane overpressure, are lower in priority. This choice of priorities coincides with real life operation, where it is important to achieve a certain power while specific control of another quantity (e.g., membrane overpressure) and efficiency are to be achieved if possible, but are not mandatory.

3.6. Constraints

Two types of constraints are present in this study: input and output constraints. One should be careful not to mix the notion of input and actuator constraints. It should be kept in mind that the prediction model has as its inputs, among others, the reference values for the PI controllers, whereas the plant itself has actuators as its inputs. The actuators W i n a n and α c a are actually part of the output vector of the prediction model. From this point forward, constraints are always given with reference to the prediction model.
Input constraints are as follows:
0 W i n c a 0.1 kg s 1
1 bar p s m , r e f a n 3 bar
40 A I 360 A
1 bar p s m , r e f c a 3 bar .
Output constraints are as follows:
0.1 bar Δ p 0.3 bar
1 λ O 2
0 λ H 2
0 W i n a n
0 α c a 1 .
The vector of control moves
Δ U = [ Δ u k + 1 Δ u k + 2 Δ u k + N c ]
is the solution of the optimization
Δ U = arg   min Δ U   J
subject to the constraints
Equations   ( 29 ) ( 37 )
Only the first step Δ u k + 1 is applied to the system, according to the receding horizon principle.

4. Results and Discussion

In this section, the results of a simulation scenario of tracking the power demand measured from the vehicle and comparison between the RG-MPC and vehicle operation are presented. Moreover, the benefits of the RG-MPC approach are discussed.

4.1. Simulation Results

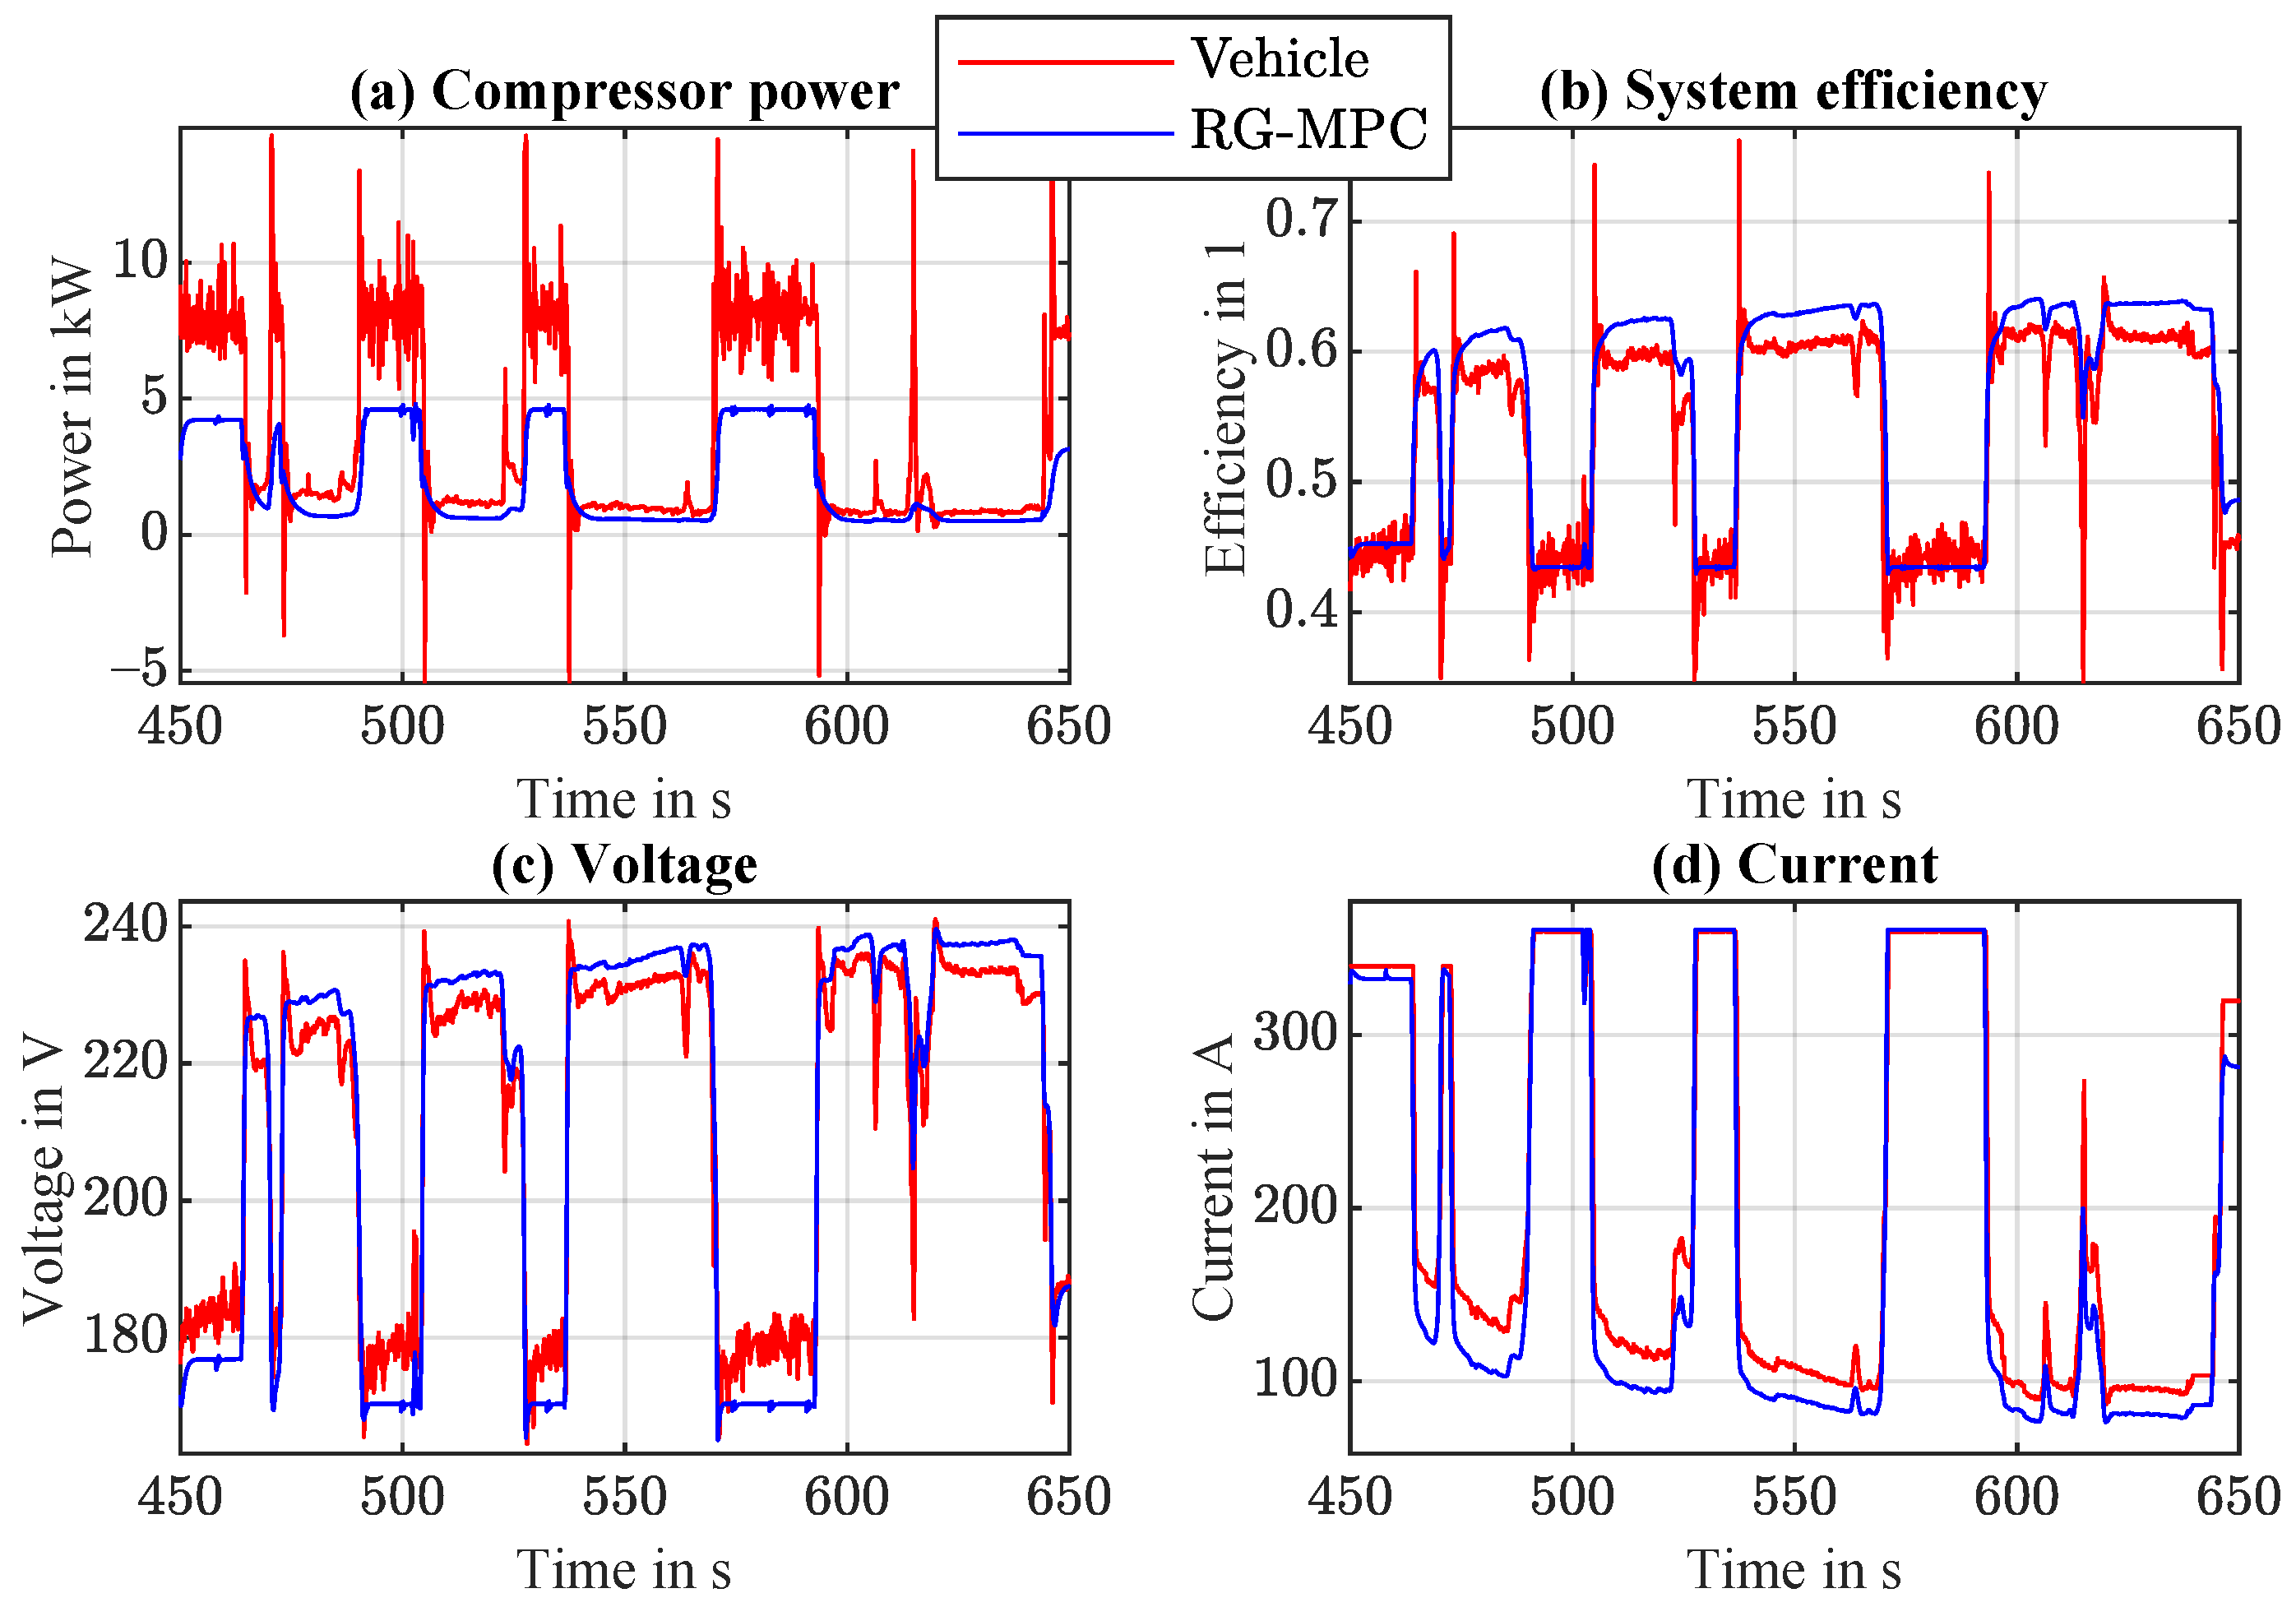
The end goal of designing the controller described above is to control an FC system in an automotive application. This entails delivering the required net power as efficiently as possible while taking into consideration all the safety requirements. Clearly, in a real vehicle, a vast number of details have to be considered and rigorous testing of the control system has to be done for it to function properly. Therefore, the results of the simulation tests mimicking the vehicle operation in which the RG-MPC tries to deliver the measured power demand compared to the performance of the PID-controlled vehicle are presented in this section. The RG-MPC fulfills the delivery of the required net power in the vehicle shown in Figure 7, except in the region of high power demand of 60 kW, where the performance limitation is hit, since the current is constrained at 360 A (Figure 8d) and the compressor power (Figure 8a) cannot be further reduced, as it would cause operating in dangerous regions—as it will be demonstrated later on. It can be seen in Figure 7 that the power demand on regions of lower power is not followed correctly in the vehicle, presumably because of some other requirement in the vehicle at the time of operation.
As defined in Equation (4), the system efficiency is evaluated and compared to the vehicle. In Figure 8b, one can see that the RG-MPC matches the vehicle efficiency in the region of high power demand, but the compressor power (Figure 8a) and stack voltage (Figure 8c) do not match the ones measured by the vehicle sensors. The RG-MPC is driven to maximize efficiency, as defined in its cost function (Equation (27)), but not explicitly instructed in which state to operate. Obviously, since the voltage is lower, the stack power will be lower as well, but the compressor power is also lower, leading to an equal net power as already discussed and operating at the same current as the vehicle; the efficiencies match.
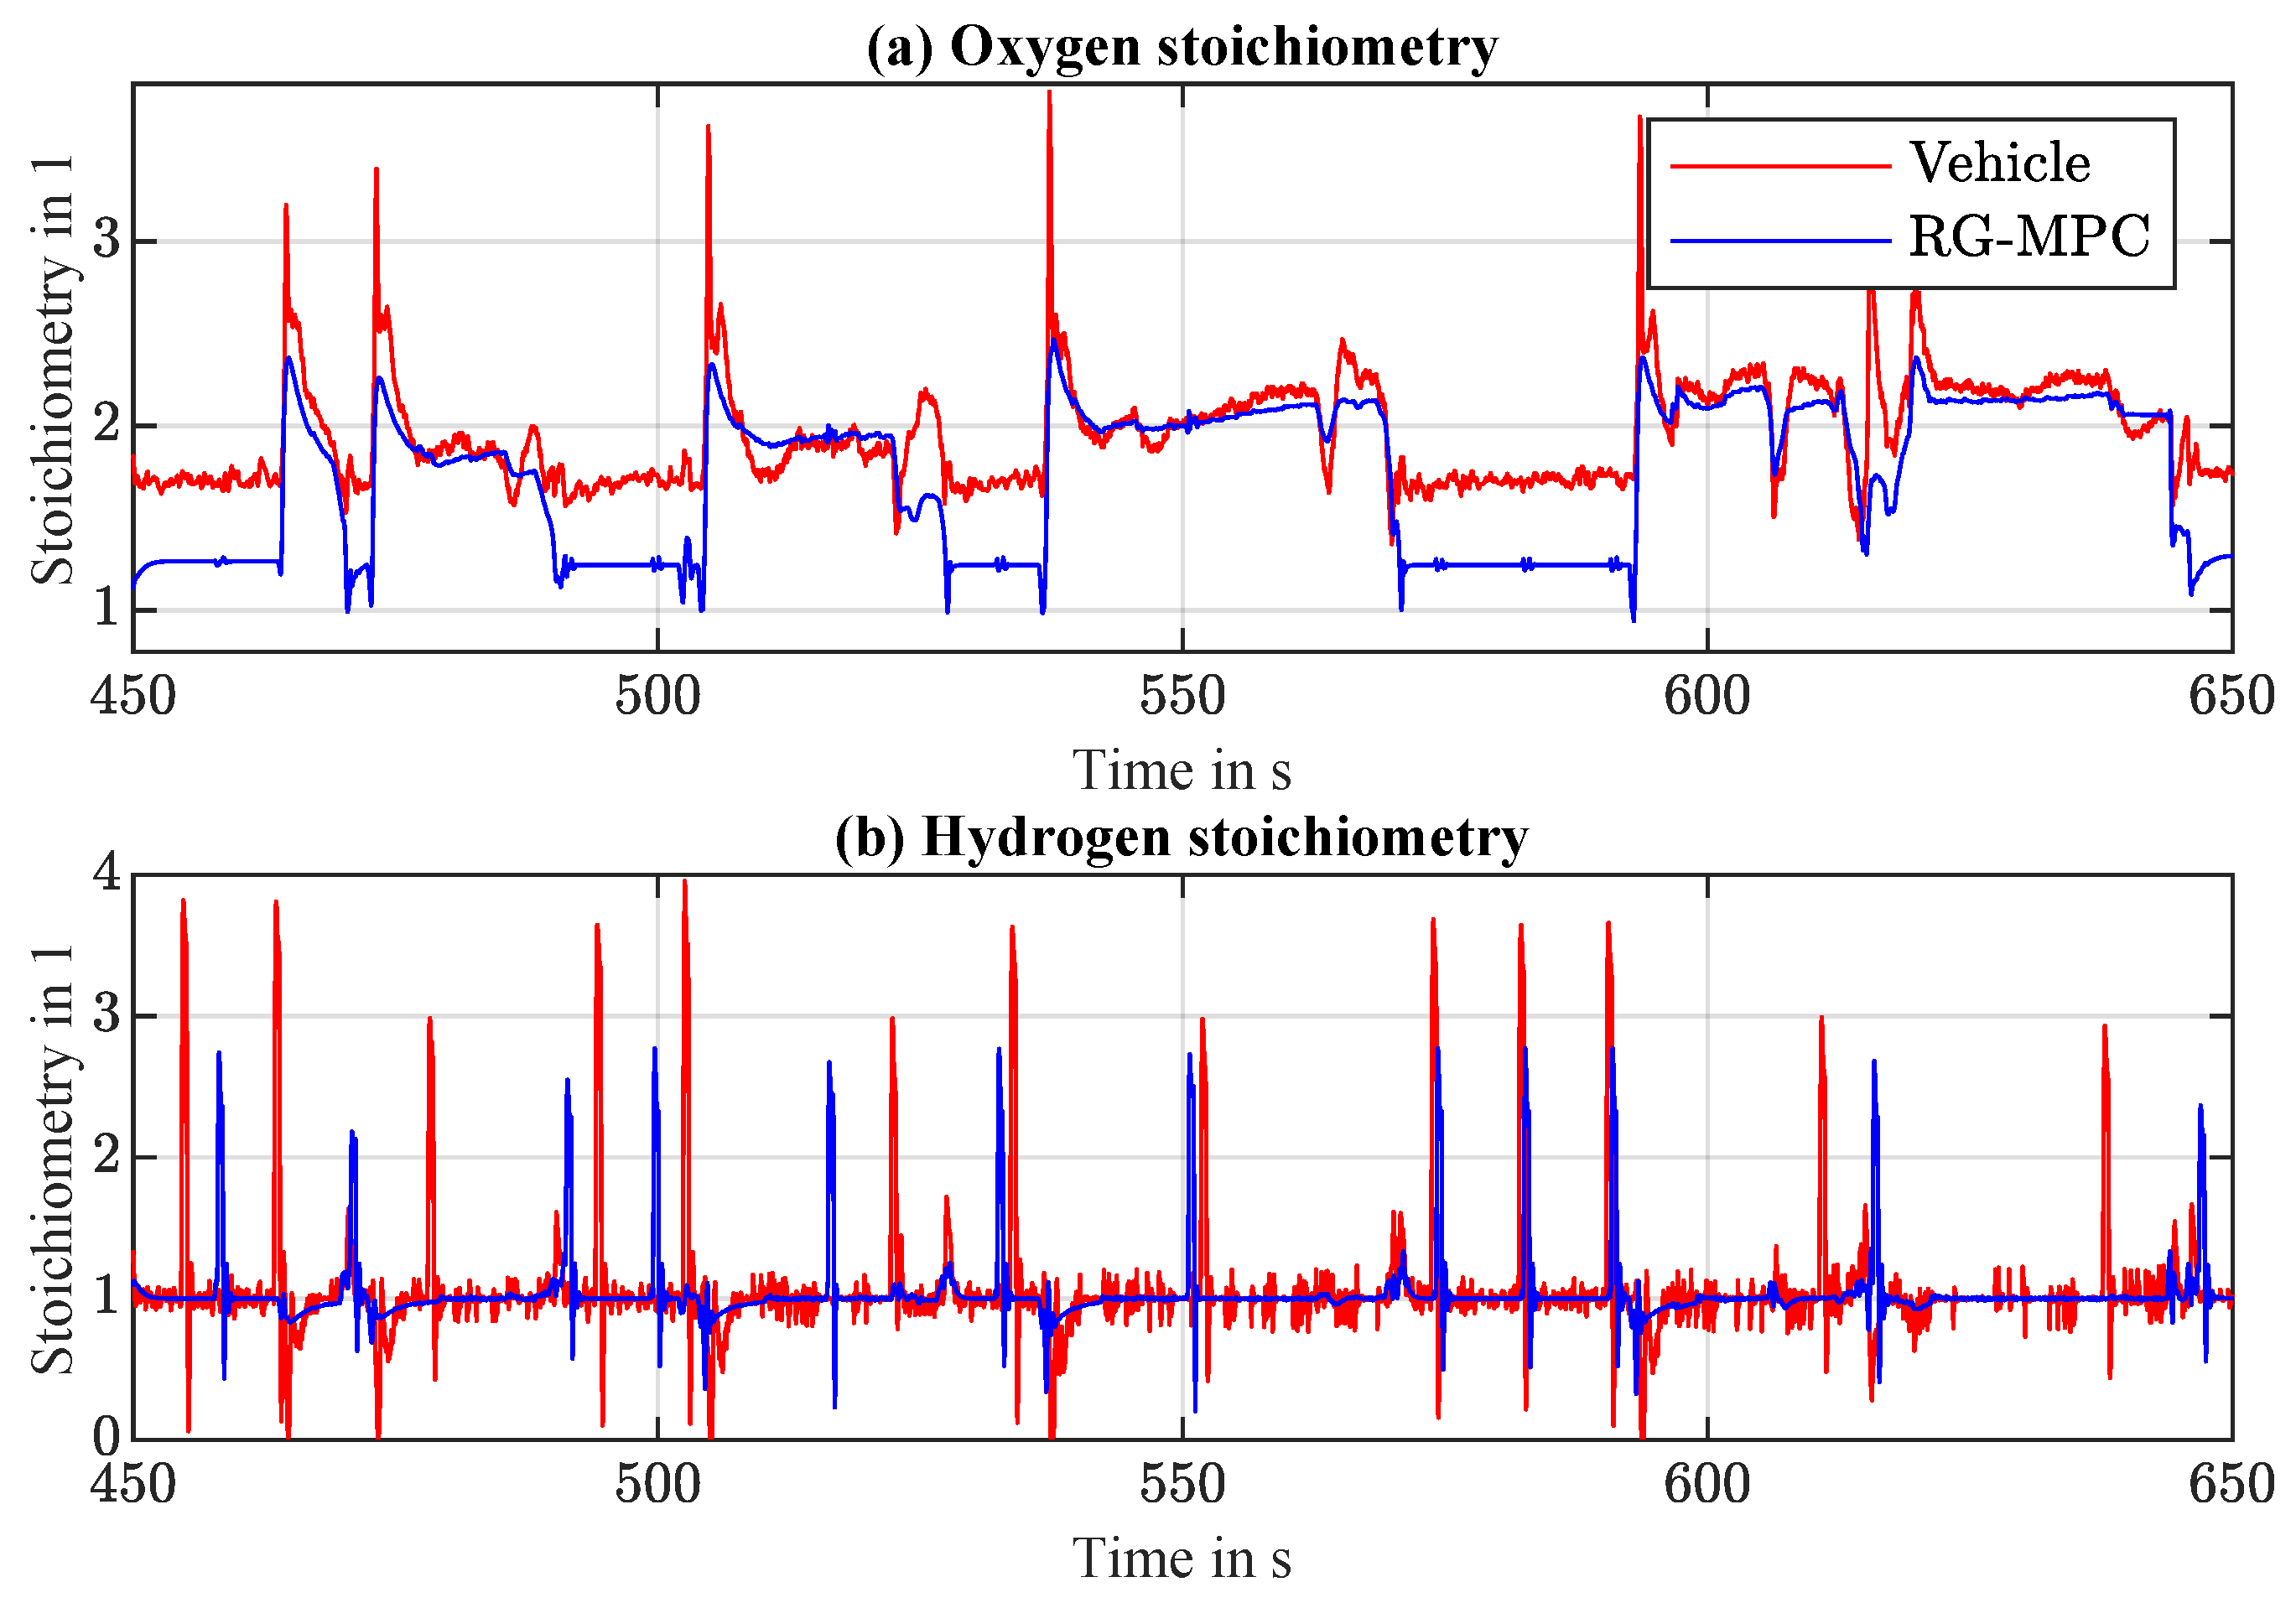
With the goal of preventing oxygen starvation, the controller is keeping the oxygen stoichiometry above its limit of 1 (Figure 9a) and thanks to the anode-to-cathode pressure difference requirement, the hydrogen stoichiometry implicitly takes the value of 1, except during transients of power demand and during purging events, visible as spikes in Figure 9b. The controller could easily incorporate a stricter constraint on the oxygen stoichiometry, leading to an operation in regions of higher compressor power, since the air-flow entering the cathode should be higher. The decision on the exact number would be left to experts operating the actual system.
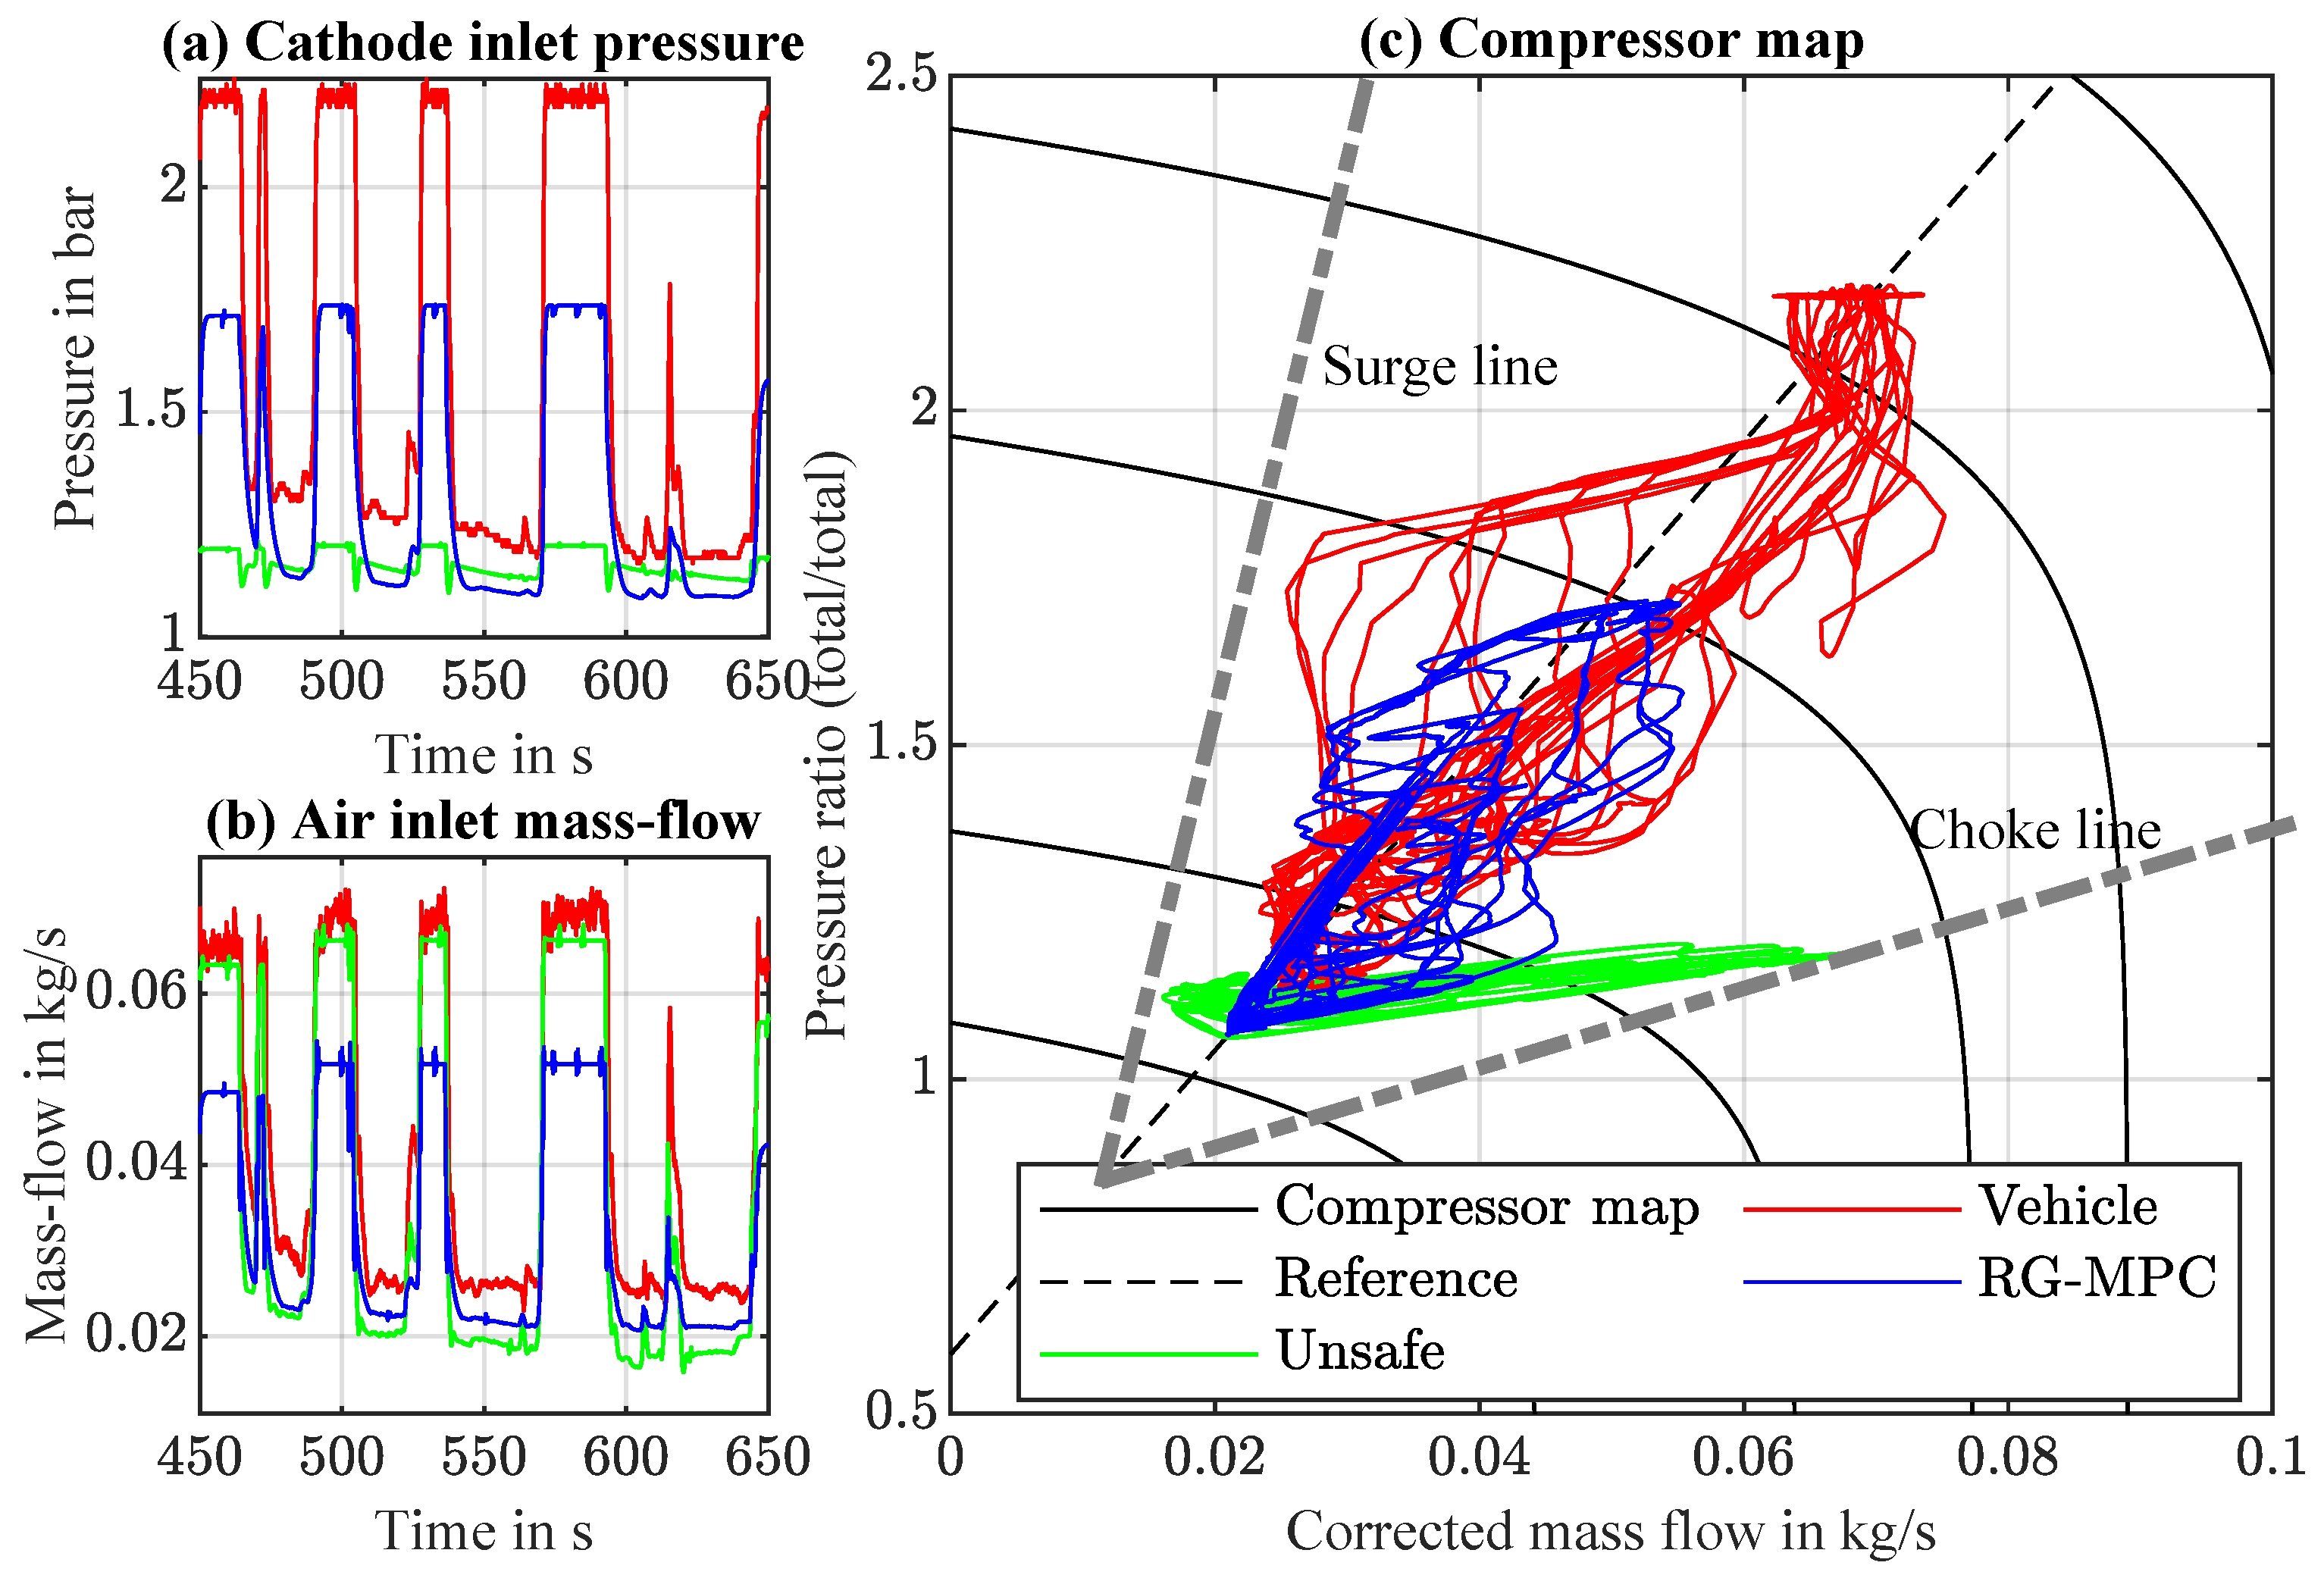
An important safety requirement is keeping the pressure difference across the membrane inside a safety bandwidth. The predictive capability of the RG-MPC gives the system the opportunity to counteract disturbances such as purging events. In Figure 10a, purging events in the performance of the RG-MPC can be clearly seen as regular small spikes, whereas in the vehicle operation, they are even more visible as large deviations from the setpoint of 0.2 bar. A big absolute value of the pressure difference can cause irreversible damage by rupturing the membrane of the fuel cell. It is important, therefore, for the controller to have a good strategy of keeping the pressure difference inside safety limits. In the RG-MPC, it is done by simply imposing a constraint on it (Equation (33)). In Figure 10b, the sudden burst of inlet hydrogen-flow is the result of the controller’s requirement to keep the pressure difference between constraints and the same conclusion goes for the cathode backpressure valve position (Figure 10c), but to a smaller degree, since the cathode pressure would not be abruptly changed by an encountered purging event. A major concern in the safe operation of fuel cells is the compressor’s behavior. One would want the compressor to operate far from the surge and choke lines, the far-left and far-right region of the solid black lines in Figure 11c, respectively. In the RG-MPC setup, the normal distance of the operating state to the reference black dashed line in Figure 11c is minimized (Equation (6)), leading to an operation far from the unsafe region. In the vehicle setup, a series of experimentally obtained optimization maps was used to determine the best operating state. In Figure 11a,b, the cathode inlet pressure and air inlet mass-flow are shown for comparison purposes. The reference control setup that was used on the vehicle tends to operate at higher pressures and mass-flows than the RG-MPC, increasing the used compressor power as already seen in Figure 8a; since the pressure is higher, the voltage is higher as well (Figure 8c), leading to an overall net power and efficiency matching the one obtained by the RG-MPC.
The RG-MPC was tested without the compressor safety requirement, only with the efficiency requirement, which drives the compressor power to be as small as possible. The result is shown in green in Figure 11. Mathematically, the difference between the blue line and the green line is in the weighting matrix from Equation (28). The weight on the minimization of the distance between the current state and the compressor reference line is set to a very low value, effectively meaning that it is not considered by the controller.
Q y = [ 1 100 k W 2 0 0 0 0 1 0 0 0 0 1 b a r 2 0 0 0 0 1 2000 ] .
In this case, the controller reduces the cathode inlet pressure (Figure 11a) to reduce the work done by the compressor and thus reducing the effort to provide a certain air-flow needed to get the desired power and keeping the other safety requirements fulfilled. This simulation experiment was conducted to highlight the importance of including the compressor’s safe operating strategy into the controller. In the case of the operation shown with the green lines, the compressor would not properly work.

4.2. Benefits and Possible Applications of RG-MPC

The RG-MPC could be used in two different ways. The first one is by replacing the “Setpoint calculation” box in Figure 3 with the RG-MPC. This effectively means that during operation, the RG-MPC provides optimal reference trajectories for the lower-level controllers and tuning, further, the addition of new criteria can be done intuitively as is the case regularly with MPC based controllers.
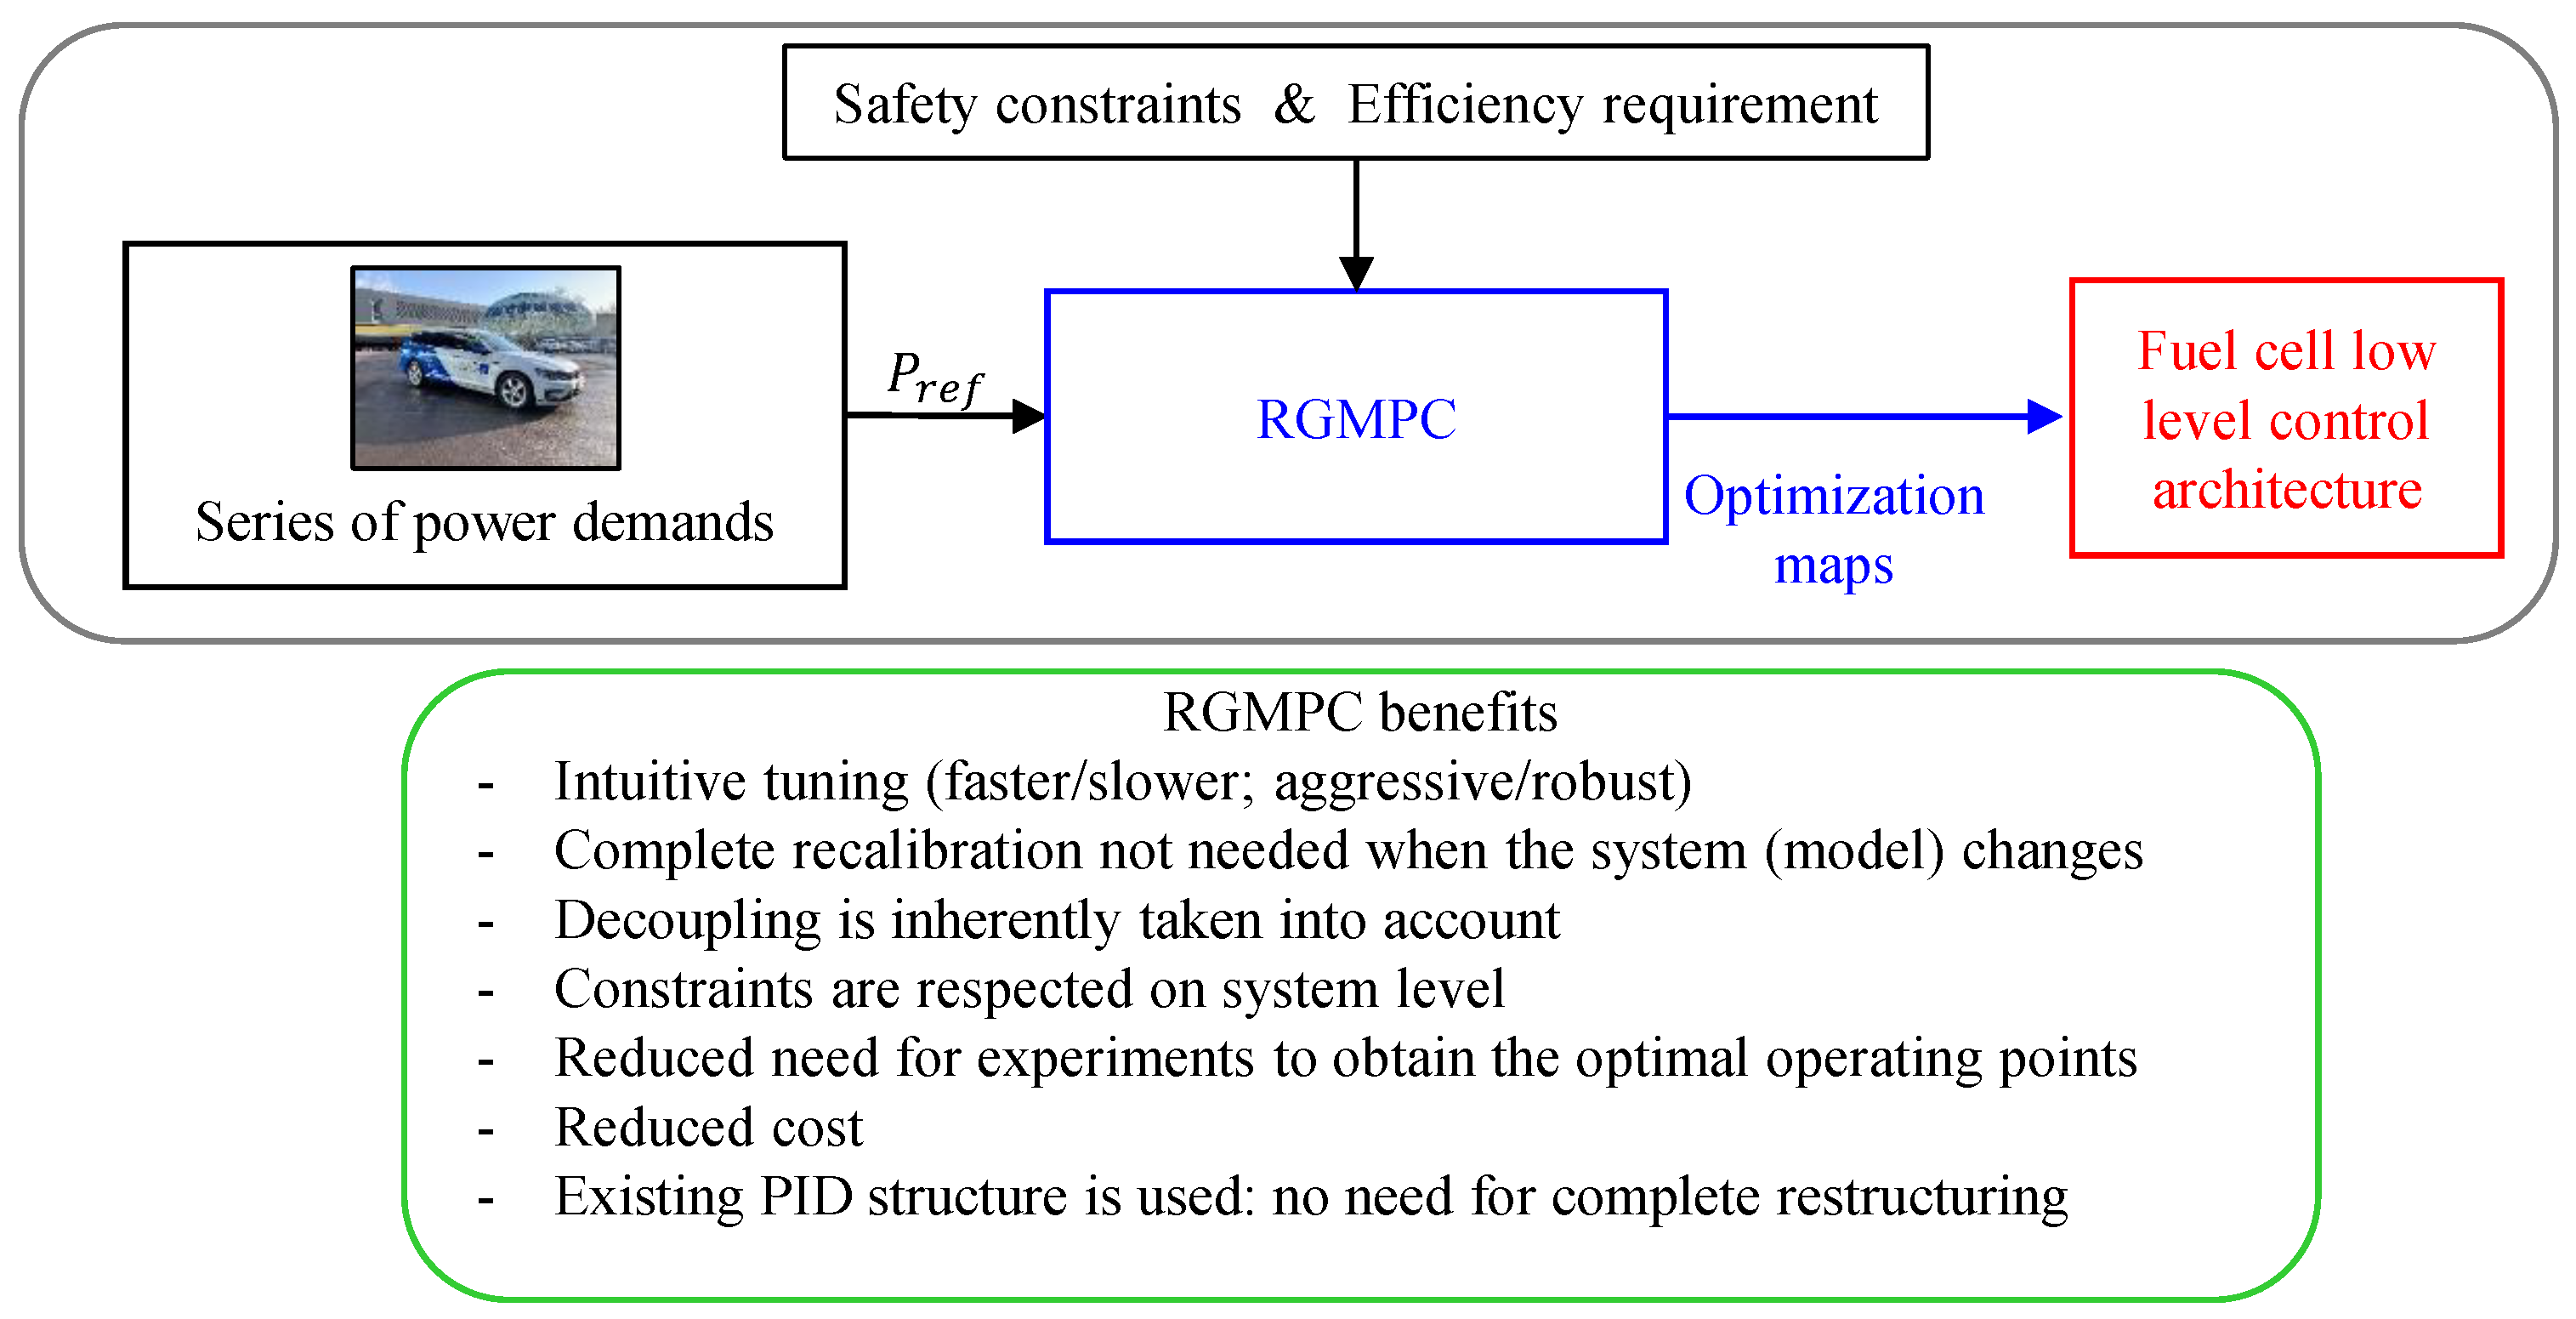
The second way the RG-MPC could be used is more plausible with the gap between the concept and actual implementation being much smaller than in the first case. In essence, the RG-MPC would be used as an offline optimization map generator. A series of different values of the power demand would be given to the RG-MPC to drive the system to and the controller would optimize all the other values (pressures, current, etc.) based on the criteria given in the cost function. The number of experiments that would have to be run to calibrate the system would be smaller, gaining a financial advantage. Next, the actuator constraints and the decoupling of all the variables would already be implicitly contained in the RG-MPC. In the case of a change in the system, instead of recalibrating the setpoint calculation algorithm, the model is simply updated. For example, in the case of a new compressor, its new efficiency and other characteristics are passed to the prediction model and the generation of the setpoints for a certain power demand is easily recalculated. The mentioned benefits are systematically shown in Figure 12.

5. Conclusions

In this paper, we proposed using the reference governor model predictive controller approach for controlling fuel cell systems, especially vehicles. Instead of acquiring the optimal operational setpoints and/or trajectories by numerous experimental runs, a more intuitive approach would be of benefit, such as the MPC concept. Every safety and efficiency requirement can easily be made part of the optimization criterion used by the controller. In case a system component is added, removed, or its properties changed, the model can simply be updated and the RG-MPC tuning redone in minimal time. In contrast, in the conventional way, numerous time- and money-consuming experiments have to be run. Since there are various complex effects present in fuel cells such as the fact that there is a gas mixture in the channels, electrochemical processes, or compressor dynamics, the model describing the system is unsurprisingly nonlinear. In this work, the authors resorted to the commonly known successive linearization technique to overcome this challenge. To illustrate the performance of the controller, a real vehicle power demand has been used as reference. In addition, safety constraints such as starvation prevention or pressure difference limits have been imposed to the controller, showing its capability of dealing with multiobjective problems. The reference values for the PI controllers produced by the RG-MPC were inherently optimized in such a way that no decoupling or antiwindup schemes were necessary. The main benefit of the RG-MPC concept lies in the fact that it is simply an upgrade and not a replacement to an existing PI controller setup, bringing the concept closer to actual industrial application. The way in which the RG-MPC would be implemented in real life is an open question. We propose two main ways. First, it can be used online to generate the optimal references for the underlying PI controllers during operation. The second way would be to use the RG-MPC to generate trajectories or setpoints for the system before operation and store those results in a form of optimization maps, which would then be called back during operation. The approach described in this paper is not system- or model-dependent and can be a way of optimizing the operation of any system, not just fuel cells. Hopefully, the research done here provides some direction in improving fuel cell control algorithms and reducing the cost barrier that hydrogen power vehicles have in reaching the end user.

Author Contributions

M.V., D.R., and S.J. developed the concept and methodology. M.V. and D.R. developed the software and conducted the analysis. M.V. performed the data curation and visualization. M.V. wrote the original draft. D.R. and S.J. edited and reviewed the original draft. S.J. supervised the work and did all the project administration. All authors have read and agreed to the published version of the manuscript.

Funding

This research was funded by the Austrian Research Promotion Agency (Österreichische Forschungsförderungsgesellschaft) grant number 865181. The APC was funded by TU Wien Bibliothek.

Institutional Review Board Statement

Not applicable.

Informed Consent Statement

Not applicable.

Acknowledgments

The authors would like to thank all the experts from AVL List GmbH for providing the data of the vehicle drive cycle and the insights which helped to solve many research problems. Many thanks to the reviewers for their constructive comments, which have improved this paper. The authors acknowledge TU Wien Bibliothek for financial support through its Open Access Funding Program.

Conflicts of Interest

The authors declare no conflict on interest.

Abbreviations

The following abbreviations are used in this manuscript:
FCFuel cell
PEMPolymer electrolyte membrane
MPCModel predictive controller
RG-MPCReference governor model predictive controller
PIProportional-integral
PIDProportional-integral-derivative

References

  1. Liang, M.; Liu, Y.; Xiao, B.; Yang, S.; Wang, Z.; Han, H. An analytical model for the transverse permeability of gas diffusion layer with electrical double layer effects in proton exchange membrane fuel cells. Int. J. Hydrogen Energy 2018, 43, 17880–17888. [Google Scholar] [CrossRef]
  2. Liang, M.; Fu, C.; Xiao, B.; Luo, L.; Wang, Z. A fractal study for the effective electrolyte diffusion through charged porous media. Int. J. Heat Mass Transf. 2019, 137, 365–371. [Google Scholar] [CrossRef]
  3. Daud, W.R.; Rosli, R.E.; Majlan, E.H.; Hamid, S.A.; Mohamed, R.; Husaini, T. PEM fuel cell system control: A review. Renew. Energy 2017, 113, 620–638. [Google Scholar] [CrossRef]
  4. Woo, C.H.; Benziger, J.B. PEM fuel cell current regulation by fuel feed control. Chem. Eng. Sci. 2007, 62, 957–968. [Google Scholar] [CrossRef]
  5. Iqbal, M.T. Modeling and control of a wind fuel cell hybrid energy system. Renew. Energy 2003, 28, 223–237. [Google Scholar] [CrossRef]
  6. Garcia-Gabin, W.; Dorado, F.; Bordons, C. Real-time implementation of a sliding mode controller for air supply on a PEM fuel cell. J. Process Control 2010, 20, 325–336. [Google Scholar] [CrossRef]
  7. Dalvi, A.; Guay, M. Control and real-time optimization of an automotive hybrid fuel cell power system. Control Eng. Pract. 2009, 17, 924–938. [Google Scholar] [CrossRef]
  8. Zhang, J.; Liu, G.; Yu, W.; Ouyang, M. Adaptive control of the airflow of a PEM fuel cell system. J. Power Sources 2008, 179, 649–659. [Google Scholar] [CrossRef]
  9. Almeida, P.E.; Simões, M.G. Neural optimal control of PEM fuel cells with parametric CMAC networks. IEEE Trans. Ind. Appl. 2005, 41, 237–245. [Google Scholar] [CrossRef]
  10. Hatti, M.; Tioursi, M. Dynamic neural network controller model of PEM fuel cell system. Int. J. Hydrogen Energy 2009, 34, 5015–5021. [Google Scholar] [CrossRef]
  11. Vahidi, A.; Stefanopoulou, A.; Peng, H. Current management in a hybrid fuel cell power system: A model-predictive control approach. IEEE Trans. Control Syst. Technol. 2006, 14, 1047–1057. [Google Scholar] [CrossRef] [Green Version]
  12. Vahidi, A.; Greenwell, W. A decentralized model predictive control approach to power management of a fuel cell-ultracapacitor hybrid. In Proceedings of the American Control Conference, New York, NY, USA, 9–13 July 2007; pp. 5431–5437. [Google Scholar] [CrossRef]
  13. Luna, J.; Jemei, S.; Yousfi-Steiner, N.; Husar, A.; Serra, M.; Hissel, D. Nonlinear predictive control for durability enhancement and efficiency improvement in a fuel cell power system. J. Power Sources 2016, 328, 250–261. [Google Scholar] [CrossRef] [Green Version]
  14. Danzer, M.A.; Wittmann, S.J.; Hofer, E.P. Prevention of fuel cell starvation by model predictive control of pressure, excess ratio, and current. J. Power Sources 2009, 190, 86–91. [Google Scholar] [CrossRef]
  15. Hähnel, C.; Aul, V.; Horn, J. Power Control for Efficient Operation of a PEM Fuel Cell System by Nonlinear Model Predictive Control. IFAC-PapersOnLine 2015, 48, 174–179. [Google Scholar] [CrossRef]
  16. Ebadighajari, A.; Homayouni, H.; Devaal, J.; Golnaraghi, F. Model Predictive Control of Polymer Electrolyte Membrane fuel cell with dead-end anode and periodic purging. In Proceedings of the 2016 IEEE Conference on Control Applications, CCA, Buenos Aires, Argentina, 19–22 September 2016; pp. 1500–1505. [Google Scholar] [CrossRef]
  17. Ziogou, C.; Pistikopoulos, E.N.; Georgiadis, M.C.; Voutetakis, S.; Papadopoulou, S. Empowering the performance of advanced NMPC by multiparametric programming—An application to a PEM fuel cell system. Ind. Eng. Chem. Res. 2013, 52, 4863–4873. [Google Scholar] [CrossRef]
  18. Ziogou, C.; Papadopoulou, S.; Georgiadis, M.C.; Voutetakis, S. On-line nonlinear model predictive control of a PEM fuel cell system. J. Process Control 2013, 23, 483–492. [Google Scholar] [CrossRef]
  19. Goshtasbi, A.; Ersal, T. Degradation-conscious control for enhanced lifetime of automotive polymer electrolyte membrane fuel cells. J. Power Sources 2020, 457, 227996. [Google Scholar] [CrossRef]
  20. Chen, H.; Chen, J.; Lu, H.; Yan, C.; Liu, Z. A Modified MPC-Based Optimal Strategy of Power Management for Fuel Cell Hybrid Vehicles. IEEE/ASME Trans. Mechatron. 2020, 25, 2009–2018. [Google Scholar] [CrossRef]
  21. Klaučo, M.; Kalúz, M.; Kvasnica, M. Real-time implementation of an explicit MPC-based reference governor for control of a magnetic levitation system. Control Eng. Pract. 2017, 60, 99–105. [Google Scholar] [CrossRef]
  22. Klaučo, M.; Kvasnica, M. Control of a boiler-turbine unit using MPC-based reference governors. Appl. Therm. Eng. 2017, 110, 1437–1447. [Google Scholar] [CrossRef]
  23. Garone, E.; Di Cairano, S.; Kolmanovsky, I. Reference and command governors for systems with constraints: A survey on theory and applications. Automatica 2017, 75, 306–328. [Google Scholar] [CrossRef] [Green Version]
  24. Klaučo, M.; Kvasnica, M. MPC-Based Reference Governors; Springer: Cham, Switzerland, 2019. [Google Scholar]
  25. Zhakatayev, A.; Rakhim, B.; Adiyatov, O.; Baimyshev, A.; Varol, H.A. Successive linearization based model predictive control of variable stiffness actuated robots. In Proceedings of the IEEE/ASME International Conference on Advanced Intelligent Mechatronics, AIM, Munich, Germany, 3–7 July 2017; pp. 1774–1779. [Google Scholar] [CrossRef]
  26. Ławryńczuk, M. Nonlinear predictive control of a boiler-turbine unit: A state-space approach with successive on-line model linearisation and quadratic optimisation. ISA Trans. 2017, 67, 476–495. [Google Scholar] [CrossRef] [PubMed]
  27. Goshtasbi, A.; Ersal, T. LQ-MPC design for degradation-conscious control of PEM fuel cells. In Proceedings of the American Control Conference, Philadelphia, PA, USA, 10–12 July 2019; pp. 1555–1560. [Google Scholar] [CrossRef]
  28. Bamimore, A.; Taiwo, O.; King, R. Comparison of two nonlinear model predictive control methods and implementation on a laboratory three tank system. In Proceedings of the IEEE Conference on Decision and Control, Orlando, FL, USA, 12–15 December 2011; pp. 5242–5247. [Google Scholar] [CrossRef]
  29. Ritzberger, D.; Hametner, C.; Jakubek, S. A real-time dynamic fuel cell system simulation for model-based diagnostics and control: Validation on real driving data. Energies 2020, 13, 3148. [Google Scholar] [CrossRef]
  30. Vrlic, M.; Ritzberger, D.; Jakubek, S. Fuel Cell Control Using Successive Linearization Vehicle Data. Energies 2020, 13, 5353. [Google Scholar] [CrossRef]
  31. Böhler, L.; Ritzberger, D.; Hametner, C.; Jakubek, S. Constrained Extended Kalman Filter Design and Application for On-Line State Estimation of High-Order Polymer Electrolyte Membrane Fuel Cell Systems. Int. J. Hydrogen Energy 2021. [Google Scholar] [CrossRef]
  32. KEYTECH4EV—Development and Demonstration of Key Technologies for Low-Cost Electric Vehicle Platforms. Available online: http://iesta.at/keytech4ev/ (accessed on 1 February 2021).
  33. Kravos, A.; Ritzberger, D.; Tavčar, G.; Hametner, C.; Jakubek, S.; Katrašnik, T. Thermodynamically consistent reduced dimensionality electrochemical model for proton exchange membrane fuel cell performance modelling and control. J. Power Sources 2020, 454, 227930. [Google Scholar] [CrossRef]
  34. Pukrushpan, T.; Peng, H. Dynamics of Low-Pressure and High-pressure Fuel Cell Air Supply Systems. In Proceedings of the 2003 American Control Conference, Denver, CO, USA, 4–6 June 2003; pp. 2049–2054. [Google Scholar]
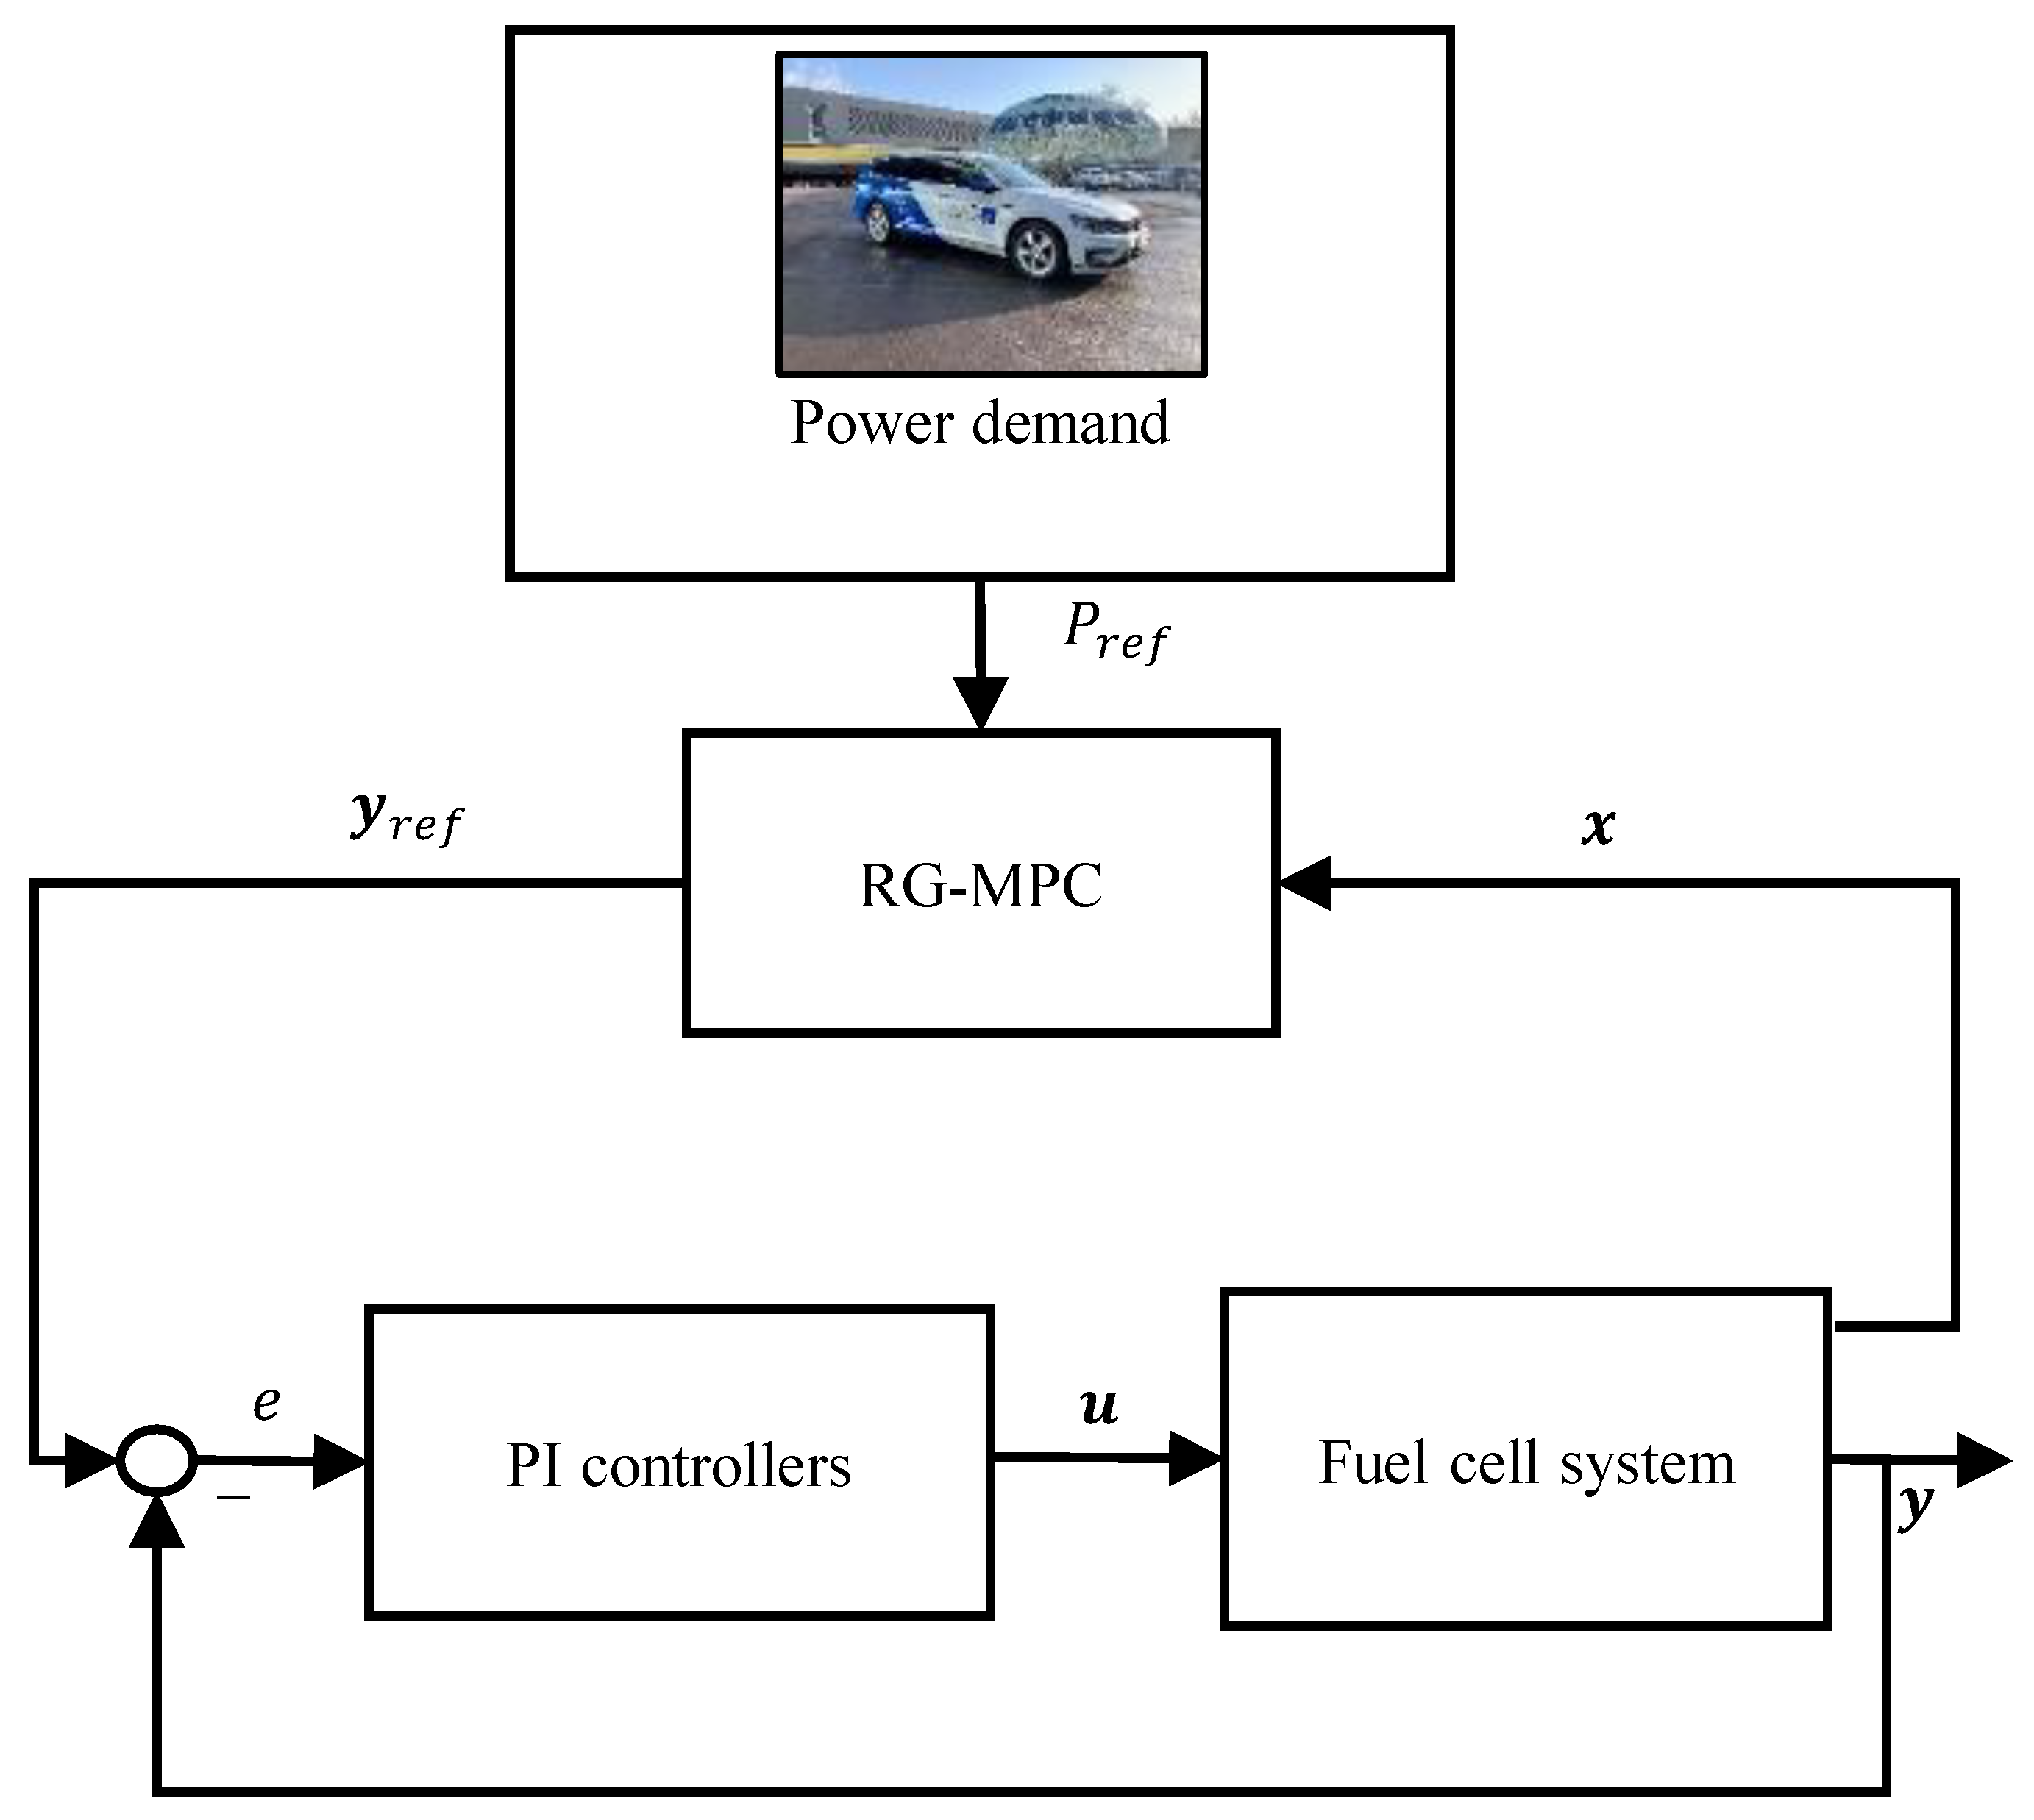
Figure 1. Reference governor model predictive control (MPC) schematics. RG—reference governor; PI—proportional-integral.
Energies 14 02206 g001
Figure 2. AVL List GmbH research demonstrator vehicle.
Energies 14 02206 g002
Figure 3. Control scheme of the fuel cell vehicle.
Energies 14 02206 g003
Figure 4. Fuel cell model structure used in the paper. Different colors denote different submodels.
Energies 14 02206 g004
Figure 5. Compressor map. The vicinity of the dashed line is chosen as the desired operation region.
Energies 14 02206 g005
Figure 6. Successive linearization concept. The system function f(x) is linearized around the state vector x(t) at every time step. The linearized system is used to develop the MPC at that time step.
Energies 14 02206 g006
Figure 7. Net system power. Comparison between the vehicle operation and RG-MPC.
Energies 14 02206 g007
Figure 8. (a) Compressor power, (b) system efficiency, (c) stack voltage, (d) current.
Energies 14 02206 g008
Figure 9. (a) Oxygen stoichiometry, (b) hydrogen stoichiometry.
Energies 14 02206 g009
Figure 10. (a) Pressure difference across the membrane, (b) hydrogen inlet mass-flow, (c) cathode backpressure valve.
Energies 14 02206 g010
Figure 11. (a) Cathode inlet pressure, (b) air inlet mass-flow, (c) compressor map.
Energies 14 02206 g011
Figure 12. Advantages of using the RG-MPC as a tool for generating optimization maps. PID—proportional-integral-derivative.
Energies 14 02206 g012
Publisher’s Note: MDPI stays neutral with regard to jurisdictional claims in published maps and institutional affiliations.