Article

Transition Prediction in Incompressible Boundary Layer with Finite-Amplitude Streaks

by
Juan Ángel Martín
1,* and
Pedro Paredes
2
1
E.T.S.I. Aeronáutica y del Espacio, Universidad Politécnica de Madrid, Plaza Cardenal Cisneros 3, 28040 Madrid, Spain
2
National Institute of Aerospace (NIA), Hampton, VA 23681, USA
*
Author to whom correspondence should be addressed.
Energies 2021, 14(8), 2147; https://doi.org/10.3390/en14082147
Submission received: 19 February 2021 / Revised: 15 March 2021 / Accepted: 8 April 2021 / Published: 12 April 2021
(This article belongs to the Special Issue Machine-Learning Methods for Complex Flows)

Abstract

:
Modulating the boundary layer velocity profile is a very promising strategy for achieving transition delay and reducing the friction of the plate. By perturbing the flow with counter-rotating vortices that undergo transient, non-modal growth, streamwise-aligned streaks are formed inside the boundary layer, which have been proved (theoretical and experimentally) to be very robust flow structures. In this paper, we employ efficient numerical methods to perform a parametric stability investigation of the three-dimensional incompressible flat-plate boundary layer with finite-amplitude streaks. For this purpose, the Boundary Region Equations (BREs) are applied to solve the nonlinear downstream evolution of finite amplitude streaks. Regarding the stability analysis, the linear three-dimensional plane-marching Parabolized Stability Equations (PSEs) concept constitutes the best candidate for this task. Therefore, a thorough parametric study is presented, analyzing the instability characteristics with respect to critical conditions of the modified incompressible zero-pressure-gradient flat-plate boundary layer, by means of finite-amplitude linearly optimal and suboptimal disturbances or streaks. The parameter space is extended from low- to high- amplitude streaks, accurately documenting the transition delay for low-amplitude streaks and the amplitude threshold for streak shear layer instability or bypass transition, which drastically displaces the transition front upstream.

1. Introduction

The ever-increasing demand for higher efficiency in modern aircrafts focuses a large fraction of the research efforts on understanding the transition process of a fluid flow from laminar to turbulent regime. The shear stresses present in a turbulent flow are considerably higher than in a laminar flow. Therefore, the initiation of turbulence is followed by an increase of drag force, penalizing the process efficiency and intensifying the energy losses and fuel rate consumption. Delaying the transition onset location, i.e., increasing the laminar phase of the flow, would certainly benefit the rapidly developing air transport field to improve the fuel efficiency, being more cost effective, sustainable, and environmentally friendly.
One of the most common flow control techniques employed to enhance the laminar regime consists of manipulating the flow. The modification of the flow is usually done by introducing counter-rotating vortices into it, perturbing the streamwise velocity and creating three-dimensional flow structures within the boundary layer. They take the form of streamwise elongated and spanwise thin regions of low- and high-speed flow alternating in the spanwise direction, which are known as streaks.
Once that the streaky flow is established, transition to turbulence can be originated after the intensity of the streaks reaches a high value [1,2,3] even if the theory had predicted a modal decay.
Streamwise streaks can appear when the level of free stream turbulence is not small (>1%). In this scenario, the classic modal transition process, in which the exponential growth of Tollmien–Schlichting (TS) waves would lead to turbulence, can be bypassed: if the streak energy is large enough, the turbulent regime is initiated by the posterior breakdown of the streaks instead of the exponential growth of TS waves.
On the other hand, a stabilization effect has been also detected. Theoretical analysis [4,5,6] and experimental studies [7,8,9] have demonstrated that the onset of turbulence can be delayed as effect of increasing the streak intensity. Stable and steady streaks can be excited through diverse experimental procedures, giving rise to streaks with different shapes and characteristics. A review of the literature reveals the use of small wings placed outside the boundary layer [10] producing streaks of an intensity close to 7% of the free stream velocity or small cylindrical roughness elements, spanwise distributed and allocated by the leading edge of the plate [7,8,9], reporting streaks of moderate amplitude (approximately 12% of the velocity of the free stream). Lately, a novel procedure of inducing streaks has been suggested in [11], consisting of mini vortex generators (MVGs), a spanwise array of pairs of small winglets. The streaks generated by MVGs can achieve peak intensities up to 32% of the free stream velocity, enhancing remarkably the potential effect of stabilization, as reported in the experimental work performed by the KTH group at Stockholm, Sweden [12,13,14,15]. They have been first investigated by Siconolfi et al [16] in terms of stability curves for the boundary layer controlled by MVGs, showing the performance of MVGs and their capability to enhance the stability characteristics of the boundary layer.
Not only are MVGs currently investigated as a way of originating streaks, in [17] the direct modulation of the mean flow is achieved by means of spanwise-periodic surface patterns. This study points towards the direction of approximating a wavy wall with long humps, as a new method of passive (no energy is introduced in the system) drag attenuation in a boundary layer over a flat plate. In terms of active (additional energy is provided) control, the recent work addressed in [18] employs plasma actuators to produce the mean-flow distortion and describes the subsequent stabilization effect. Likewise, in the investigation presented in [19], streaks are generated on a flat plate by finite suction through a spanwise-oriented array of discrete holes. In this case, robust and steady high-intensity streaks of high- and low-speed regions were induced to create a spanwise mean velocity gradients for laminar flow control.
Based on the above considerations, streaks can be taken as one of the most promising strategy for achieving transition delay by both, passive or active mechanism of flow control. Therefore, it is highly convenient to have a fast and cheap computational method available to predict the stability characteristics of the boundary layer in the presence of streaks.
For this purpose, we use efficient numerical techniques to investigate the stability characteristics of streaky boundary-layer flows across the large parameter space of spanwise wavelengths, initial amplitudes, and streak inflow disturbance shape. To achieve this goal, we will apply the Boundary Region Equations (BREs) to obtain the numerical streaky base flow. This formulation provides the asymptotic structure of the streaks for Reynolds numbers, based on the body length, R e 1 , exhibiting two short spatial scales (wall normal and spanwise coordinates) and one long spatial scale (streamwise coordinate). A system of equations is obtained, showing a fully parabolic character in the streamwise direction; see in [20,21] for a deeper insight. Concerning the stability analysis of the three-dimensional, boundary layer flow with streaks, the three-dimensional plane-marching Parabolized Stability Equations (PSEs) concept is applied to explore the evolution of the unstable modes of this flow. It expands the classic PSE analysis to flows that are strongly dependent on two spatial directions and weakly on the third [22,23,24]. These combined formulations succeeded in simulating the stability characteristics of boundary layers perturbed by streamwise vortices [25].
The reminder of the paper is as follows. Section 2 is devoted to the formulation employed, presenting the derivation of the BRE and plane-marching PSE. Further on, Section 3 presents the structure of the main base flow. Subsequently, the maximum streak amplitude is varied from small intensities, to explore the stabilization effect of the streaks on the TS waves, to high intensities, in order to analyze the growth of secondary instabilities (SI) modes for potential bypass transition. A spanwise parametric study is likewise offered, as well as the effect of suboptimal streaks. Summary and conclusions are extended in Section 4.

2. Theory

The following sections are dedicated to introduce the numerical techniques applied in the present research to the simulation of the boundary layer flow with streaks, and the subsequent stability analysis.

2.1. Streaky Base Flow Formulation

The asymptotic structure of the streaks when the Reynolds number (defined in the usual way, R e = U L / ν , where U is the free-stream velocity, L is the characteristic spatial length, and ν is the kinematic viscosity) is R e 1 exhibits one long spatial scale in the streamwise direction, and two short spatial scales, in the wall normal and spanwise directions:
x ¯ L , ( y ¯ , z ¯ ) L / R e , u ¯ U , ( v ¯ , w ¯ ) U / R e
The flow variables are then made nondimensional (dropping the bar) in the following way: the streamwise component of the velocity u with the free-stream velocity U , the velocity transverse components ( v , w ) with U / R e , the spatial scale x with the characteristic length L, and the spatial scales ( y , z ) with L / R e . Therefore, the asymptotic downstream evolution of streaks is described by the BREs, which can be written as
u x + v y + w z = 0 u u x + v u y + w u z = u y y + u z z u v x + v v y + w v z = p y + v y y + v z z u w x + v w y + w w z = p z + w y y + w z z .
The boundary conditions employed are no slip at the bottom wall, together with periodicity in z. The velocities must tend to
( u , w ) ( 1 , 0 ) as y .
at the upper edge of the boundary layer.
The starting point to derive the BREs is the complete incompressible Navier–Stokes equations, making use of a boundary layer-like approach, in the limit of large Reynolds number. The BRE formulation is widely known [26], and it has been earlier employed to compute the nonlinear development of Görtler vortices in boundary layers with curved walls [27] and to analyze the nonlinear interaction of a slow streamwise vortex and a fast TS wave (see in [28] and the references therein). This formulation has also been used for the description of high R e number microchannel and microtube flow, see, e.g., the works in [29,30,31]. The BREs can be applied to steady and unsteady conditions, as done in [32,33,34,35,36,37,38], where the streak excitation by vortical structures on the free stream was analyzed. They have also been utilized to simulate the base flow of boundary layers disturbed by streamwise vortices [25].
The system of Equation (1) is integrated employing a numerical scheme marching forward in the downstream coordinate, as result of being fully parabolic in the streamwise direction. A thorough outline of the derivation of the BRE formulation and of the implementation of the numerical integration technique is detailed in [21].

2.2. Stability Analysis

The fluid motion is described by the Navier–Stokes equations (NS). They take the form of an Initial Value Problem (IVP) for the vector of the primitive flow variables, represented as q = [ u , v , w , p ] T . Stability analysis theory considers the decomposition of all flow quantities into a base flow, q ¯ = [ u ¯ , v ¯ , w ¯ , p ¯ ] T , upon which small-amplitude perturbations, q ~ = [ u ~ , v ~ , w ~ , p ~ ] T , are superposed such that q = q ¯ + ε q ~ , where ε 1 . By introducing this decomposition into the equations of motion, the linearized Navier–Stokes equations (LNS) are recovered.

Plane-Marching PSE

When the basic flow can be assumed to experience a strong dependence on the transversal coordinates while exhibiting slow variations along the streamwise direction, the three-dimensional stability equations lead to the formulation known as plane-marching PSE, also known as PSE-3D [23,24].
Applying the same argument given by the classical (line-marching) PSE (see in [39]), the plane-marching PSE formulation is appropriate for convectively unstable flows. The disturbance quantities are expanded as a slowly varying amplitude function q ^ ( x , y , z ) , with a fast varying wavy function, as
q ~ ( x , y , z ) = q ^ ( x , y , z ) exp i x α ( x ) d x ω t .
where q ^ = [ u ^ , v ^ , w ^ , p ^ ] T is the vector of amplitude functions and ω is the temporal wavenumber.
The linear form of the plane-marching PSE can be written in a compact form as
L q ^ + M q ^ x = 0 .
The entries of L and M and a deeper insight concerning the numerical properties, the derivation, and the solving techniques for the plane-marching PSE methodology can be found in [23]. The inflow conditions are obtained from a spatial planar eigenvalue analysis, which assumes locally parallel flow, and the perturbations are written as
q ~ ( x , y , z , t ) = q ^ ( y , z ) e x p [ i ( α x ω t ) ] .
Substituting the ansatz of Equation (5) into the incompressible LNS equations results in a two-dimensional Generalized Eigenvalue Problem (GEVP) nonlinear on eigenvalue α . It is transformed into a linear eigenvalue problem, employing a method known as companion matrix (see in [40,41] and the references therein). The resulting GEVP can be written, after defining the auxiliary vector q ^ e x t = [ u ^ , v ^ , w ^ , p ^ , α u ^ , α v ^ , α w ^ ] T , as
A q ^ e x t = α B q ^ e x t .
where the entries of the matrices A and B can be found in [23,42]. The solution of this problem is used to launch the parabolic integration of the plane-marching PSE of Equation (4).

3. Results and Discussion

For a validation of the formulation employed in this paper, the reader is referred to the work in [25], where a three-dimensional vortex flow is simulated and compared with results provided by Direct Numerical Simulation. The main results here obtained are therefore presented in next section. They can be summarized as, on the one hand, the attenuation of the Tollmien–Schlichting (TS) waves through the effect of streaks and, on the other hand, the emergence of secondary instability (SI) modes above a specific streak intensity. These enhanced disturbances come from the three-dimensional shear layer originated by the streaks.

3.1. Optimal Streaks

The configuration contemplated here is a spanwise periodic array of steady streaks developed inside the boundary layer of a flat plate at zero angle of incidence, see Figure 1. The streaks are considered as inflow conditions. Therefore, the basic flow is simulated from the perturbation profile u p , v p , w p , that represents the optimal streak analyzed in [43] and is expressed as
u 0 , v 0 , w 0 , = U b , 0 , 0 , + A s 0 u p cos β 0 z , v p cos β 0 z , w p sin β 0 z .
In the previous term, U b stands for the Blasius boundary layer profile and β 0 = 0.45 is the spanwise wavenumber. The initial location is taken to be x = 0.4 and, for the estimation of the streak amplitude, the following expression is employed:
A s x = 1 2 max y , z u U b min y , z u U b .
It essentially evaluates the spanwise deviation of u from the Blasius streamwise velocity profile [44]. The starting streak intensity ( A s 0 ) is chosen to attain a peak value of A s between the range of values 0 (Blasius profile) and 0.4 .
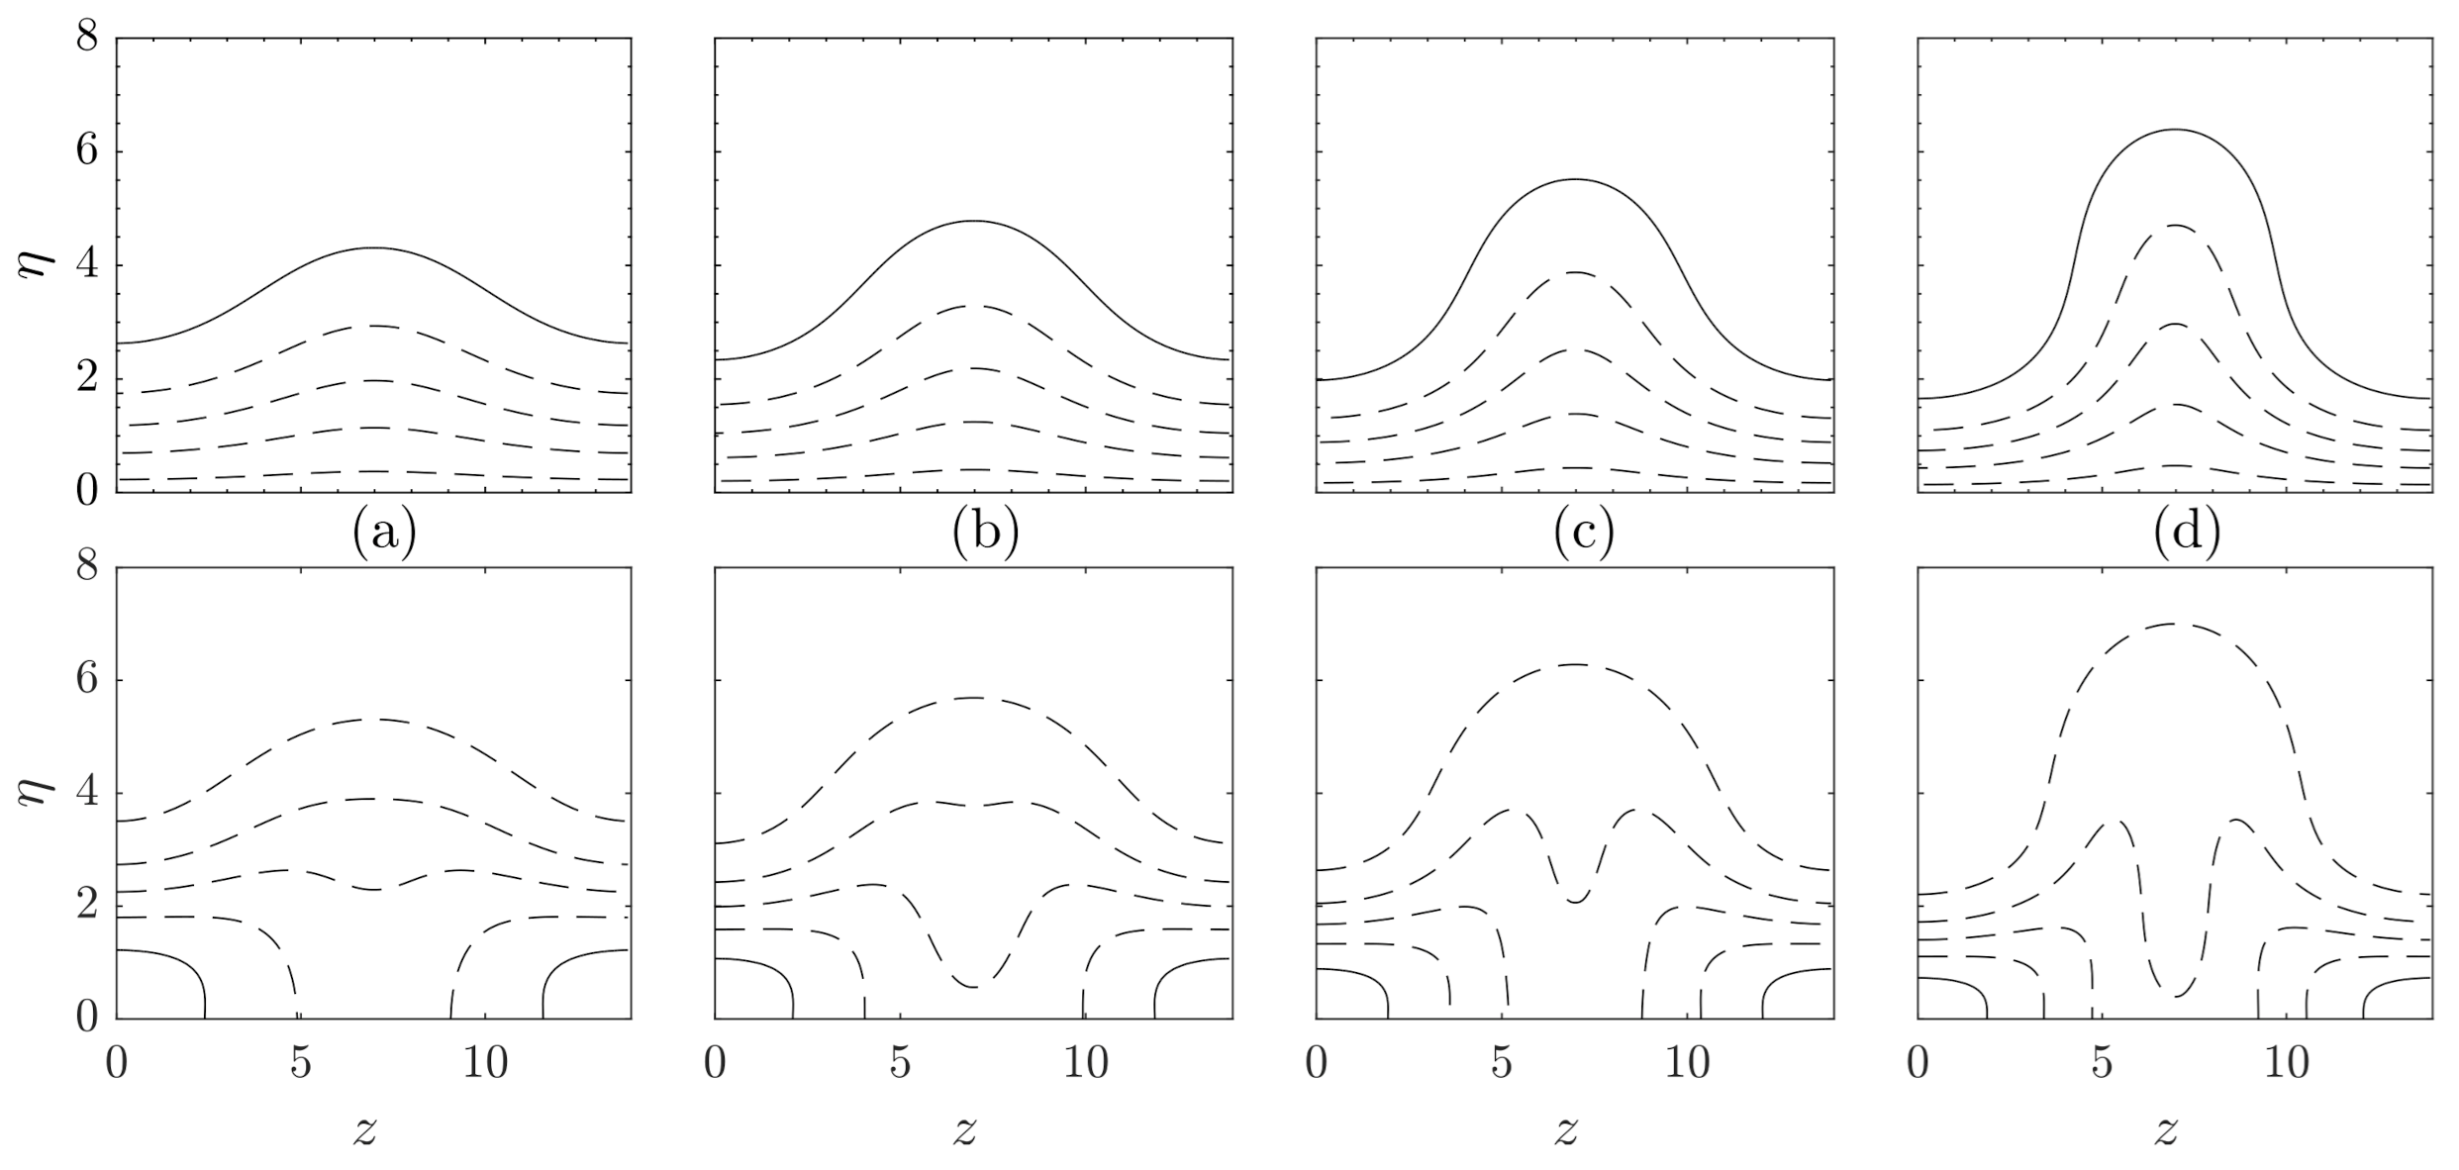
The flow obtained is represented by the streamwise velocity field u and streamwise shear rate u s (calculated as u s = u y 2 + u z 2 and normalized to have 1 as maximum value) and depicted in Figure 2, where four representative streaks with increasing amplitude are displayed. In the top row, a clear distortion of the streamwise velocity profile can be observed, increased with the streak intensity. The bottom row illustrates the streamwise shear rate being intensified around the lower corners, where the high-speed area is located. Maximum values (before normalization) of shear rate grow with streak amplitude, reaching values of u s = 0.30 in (a), u s = 0.34 in (b), u s = 0.42 in (c), and u s = 0.57 in (d).

3.2. Suboptimal Streaks

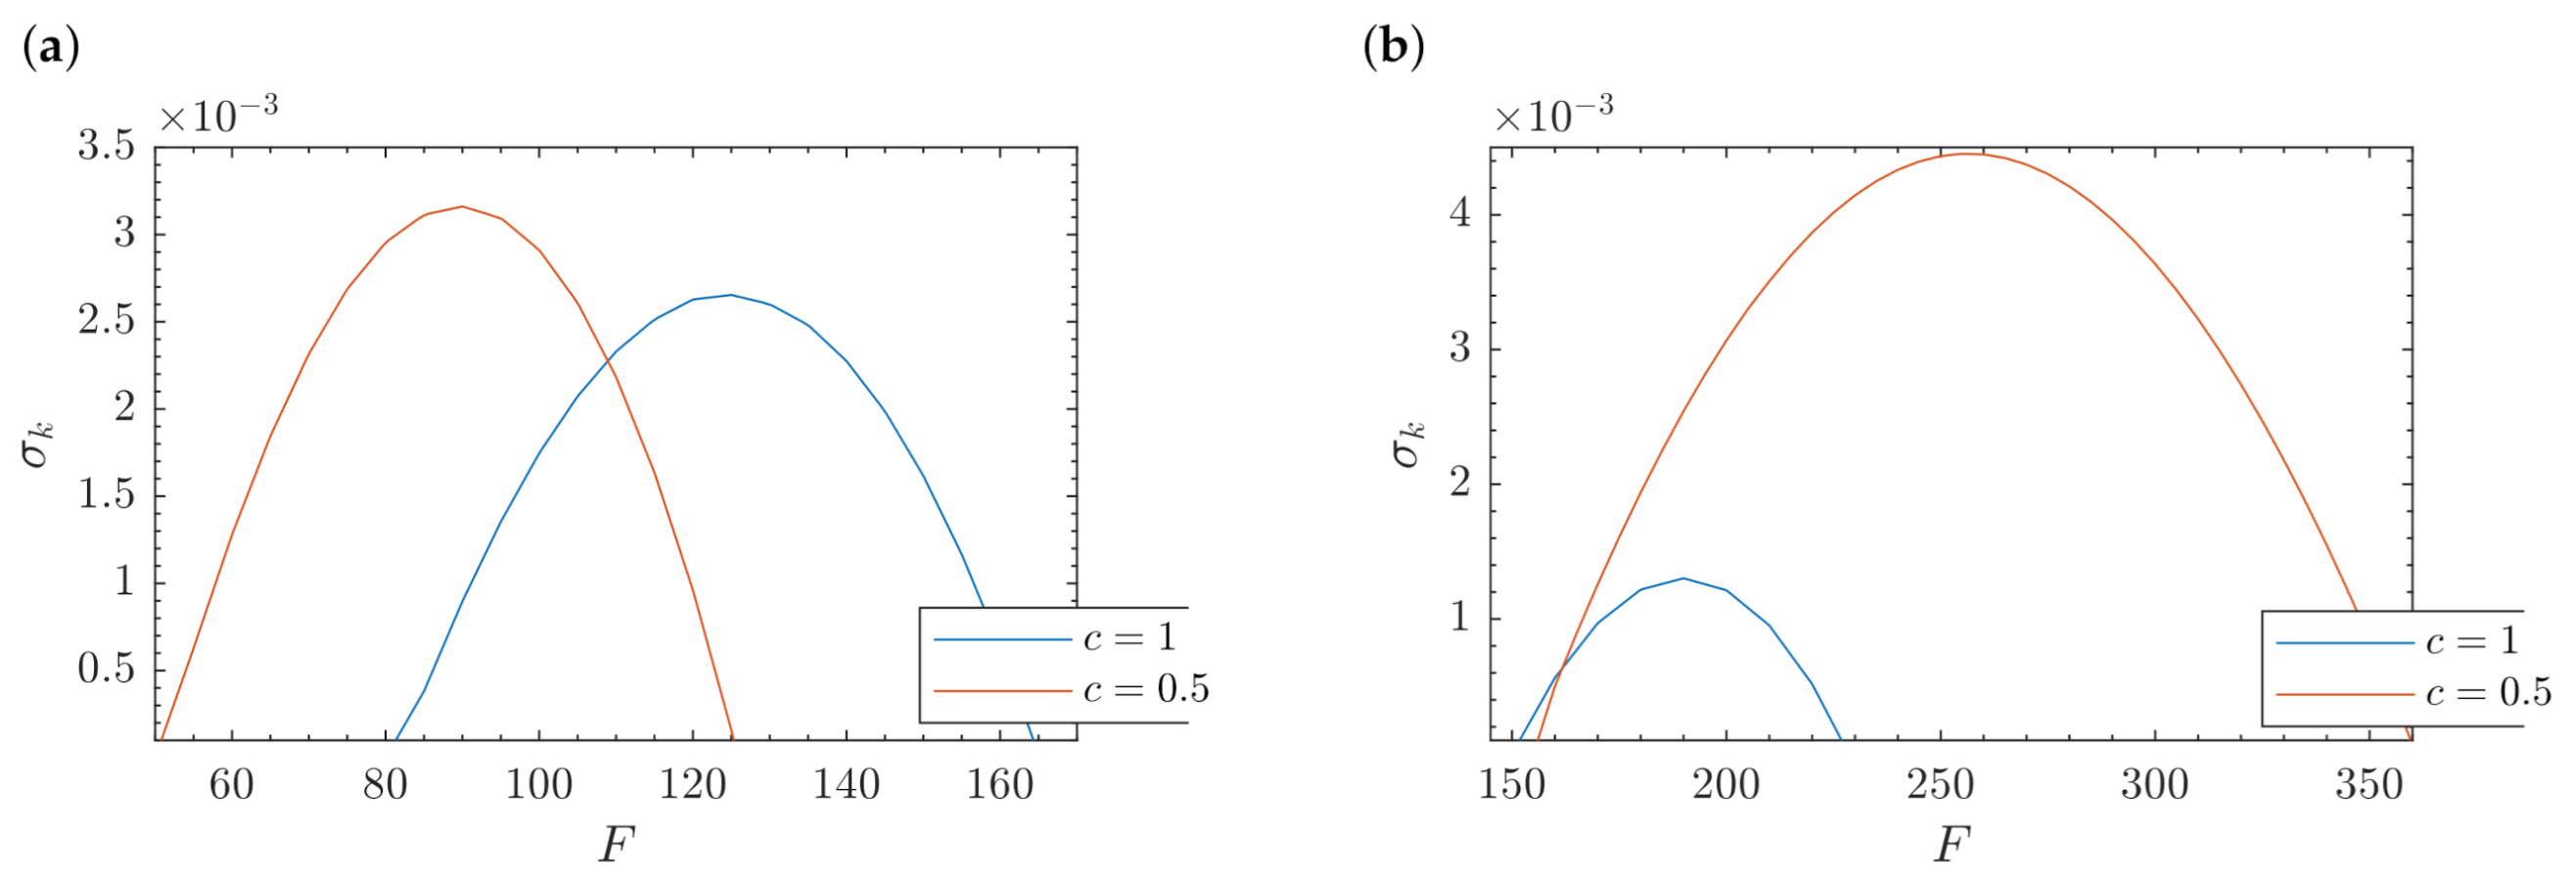
Optimal streaks allow us to perform an efficient parametric analysis in order to investigate the stability characteristics of the streaky flow. Nevertheless, as pointed out in [45], it is shown that the maximum perturbation achieved in [46,47] is obtained for perturbations resembling suboptimal streaks (streaks that are closer to the wall than the optimal ones). In Figure 3, the growth rate ( σ K ) variation with the frequency (based on the temporal wavenumber, F = ω / R e × 10 6 ) is displayed ( σ K is based on the kinetic energy K ^ of the slow varying amplitude function: σ K = α i + 1 / 2 d / d x ( log K ^ ( x ) ) , where α i = ( α ) ) for two different cases. The maximum growth rate extracted from the streamwise evolution of two streaks is represented, matching a peak streak intensity of A s = 0.10 on the left figure and A s = 0.20 on the right figure. In both cases, c is a scaling parameter that displaces the perturbation in the wall normal coordinate, making y c y . The value c = 1 corresponds to the optimal streak, while a lower value (as c = 0.5 ) indicates that the streak is suboptimal and closer to the wall. It can be observed that in both cases, the optimal streak has a growth rate below the one for the suboptimal streak, in line with the results presented in [45]. Initial perturbations are also larger in the case of the suboptimal streaks. When achieving A s m a x = 0.10 , it is required an initial amplitude of A s 0 = 0.001 for the optimal case and an initial amplitude of A s 0 = 0.005 for the suboptimal case; while reaching A s m a x = 0.20 needs an initial amplitude of A s 0 = 0.002 for the optimal case and an initial amplitude of A s 0 = 0.011 for the suboptimal case.
The growth rate variation from the optimal to suboptimal case is substantially different depending on the streak amplitude (it is increased by a 120 % factor for the case with A s m a x = 0.10 , while the case with A s m a x = 0.20 is more than three times greater). Comparing one fixed suboptimal case for different values of the streak amplitude has to be treated carefully, as it highly influences the growth rate. Consequently, we employ optimal streaks to uniformly investigate the effect of the streak amplitude and locate the critical conditions in terms of stability analysis.

3.3. Stability of Optimal Streaks

A large computational effort is usually required when simulating and investigating a three-dimensional base flow. The formulation outlined in Section 2 enables the possibility of employing limited computational resources in order to perform full parametric analyses. The following results are obtained in a desktop workstation with 32 GB of RAM.
When the peak intensity of the streak changes, the most distinctive results can be observed in Figure 4. Neutral stability curves reveal the regions where the growth rate is σ K = 0 , and they are illustrated on a R e F chart in Figure 4a. Different curves correspond to the values of peak streak intensities simulated: A s m a x = 0.0 (A), 0.14 (B), 0.20 (C), 0.25 (D), 0.28 (E), 0.30 (F), 0.32 (G), 0.34 (H), 0.36 (I), 0.38 (J), and 0.40 (K). Two groups of curves can be considered. Low amplitude streaks A, B, C, and D (below the critical intensity of 0.26 , so they do not experience SI, as stated in [44]) are represented by packed lines. Their damping action over TS waves results in a reduction of the unstable region, an outcome that is increased with the amplitude of the streaks. Linear optimal streaks where analyzed in [5], yielding the same result than here presented. Within these packed lines, the outermost neutral curve displayed in Figure 4a is the neutral curve of the unperturbed Blasius boundary layer (streak A), while the corresponding curves for the streaks B, C, and D are evenly plotted from the outer to the inner. Streaks from E to K are depicted by isolated curves, representing streaks with a peak intensity value beyond the critical amplitude of 0.26 . Secondary instability (SI) is therefore expected to arise [44], exhibiting a growing shear layer mode. For these streaks, the unstable area is evidently broaden for the large amplitude streaks, in contrast to low intensity ones. Likewise, the location where the perturbations begin to grow is shifted upstream with streak amplitude. It is relevant to indicate that the neutral curves are represented on a local level for a value of R e δ 0 = 400 .
Figure 4b reveals the variation of the logarithmic amplification N -factor with the frequency for the secondary unstable streaks (from E to K), at the streamwise location where the maximum value of the N -factor is achieved. It is based on the kinetic energy and determined as
N K = x i x σ K d x ,
where x i indicates the lower branch of the neutral stability curve. A widely criteria adopted, especially by the industrial side, is that transition from laminar to turbulent regime is accepted to happen when the N -factor reaches a value of 9 [48], flagged in Figure 4b with a horizontal dash line. In the case here studied, it can be observed that the three most intense streaks (I, J, and K) would experience transition, while for the remaining streaks, although their maximum streak intensity is above the critical value (therefore developing a growing shear layer mode), transition would not be manifested. It is also appreciated that the most dangerous frequencies (frequency for which the maximum N -factor is reached) are increased with the streak amplitude.
To complete the analysis performed, the Table 1 is presented. It provides the maximum N -factor achieved for each streak (A–K) simulated (with β = 0.45 ), extracted from Figure 4a. The streamwise location where it is reached, and the corresponding frequency, are also included. Two groups of streaks can be appreciated, according their maximum amplitude. The group below 0.26 shows that the maximum perturbation growth tends to decrease as the amplitude rises, likewise the streamwise location where this maximum is achieved is brought to an upstream position. On the other hand, the group above 0.26 presents the opposite variation: as the streak maximum amplitude grows, so does the maximum perturbation growth, together the streamwise position and frequency for which that maximum is attained.

3.4. Analysis of the Spanwise Wavenumber of Streaks

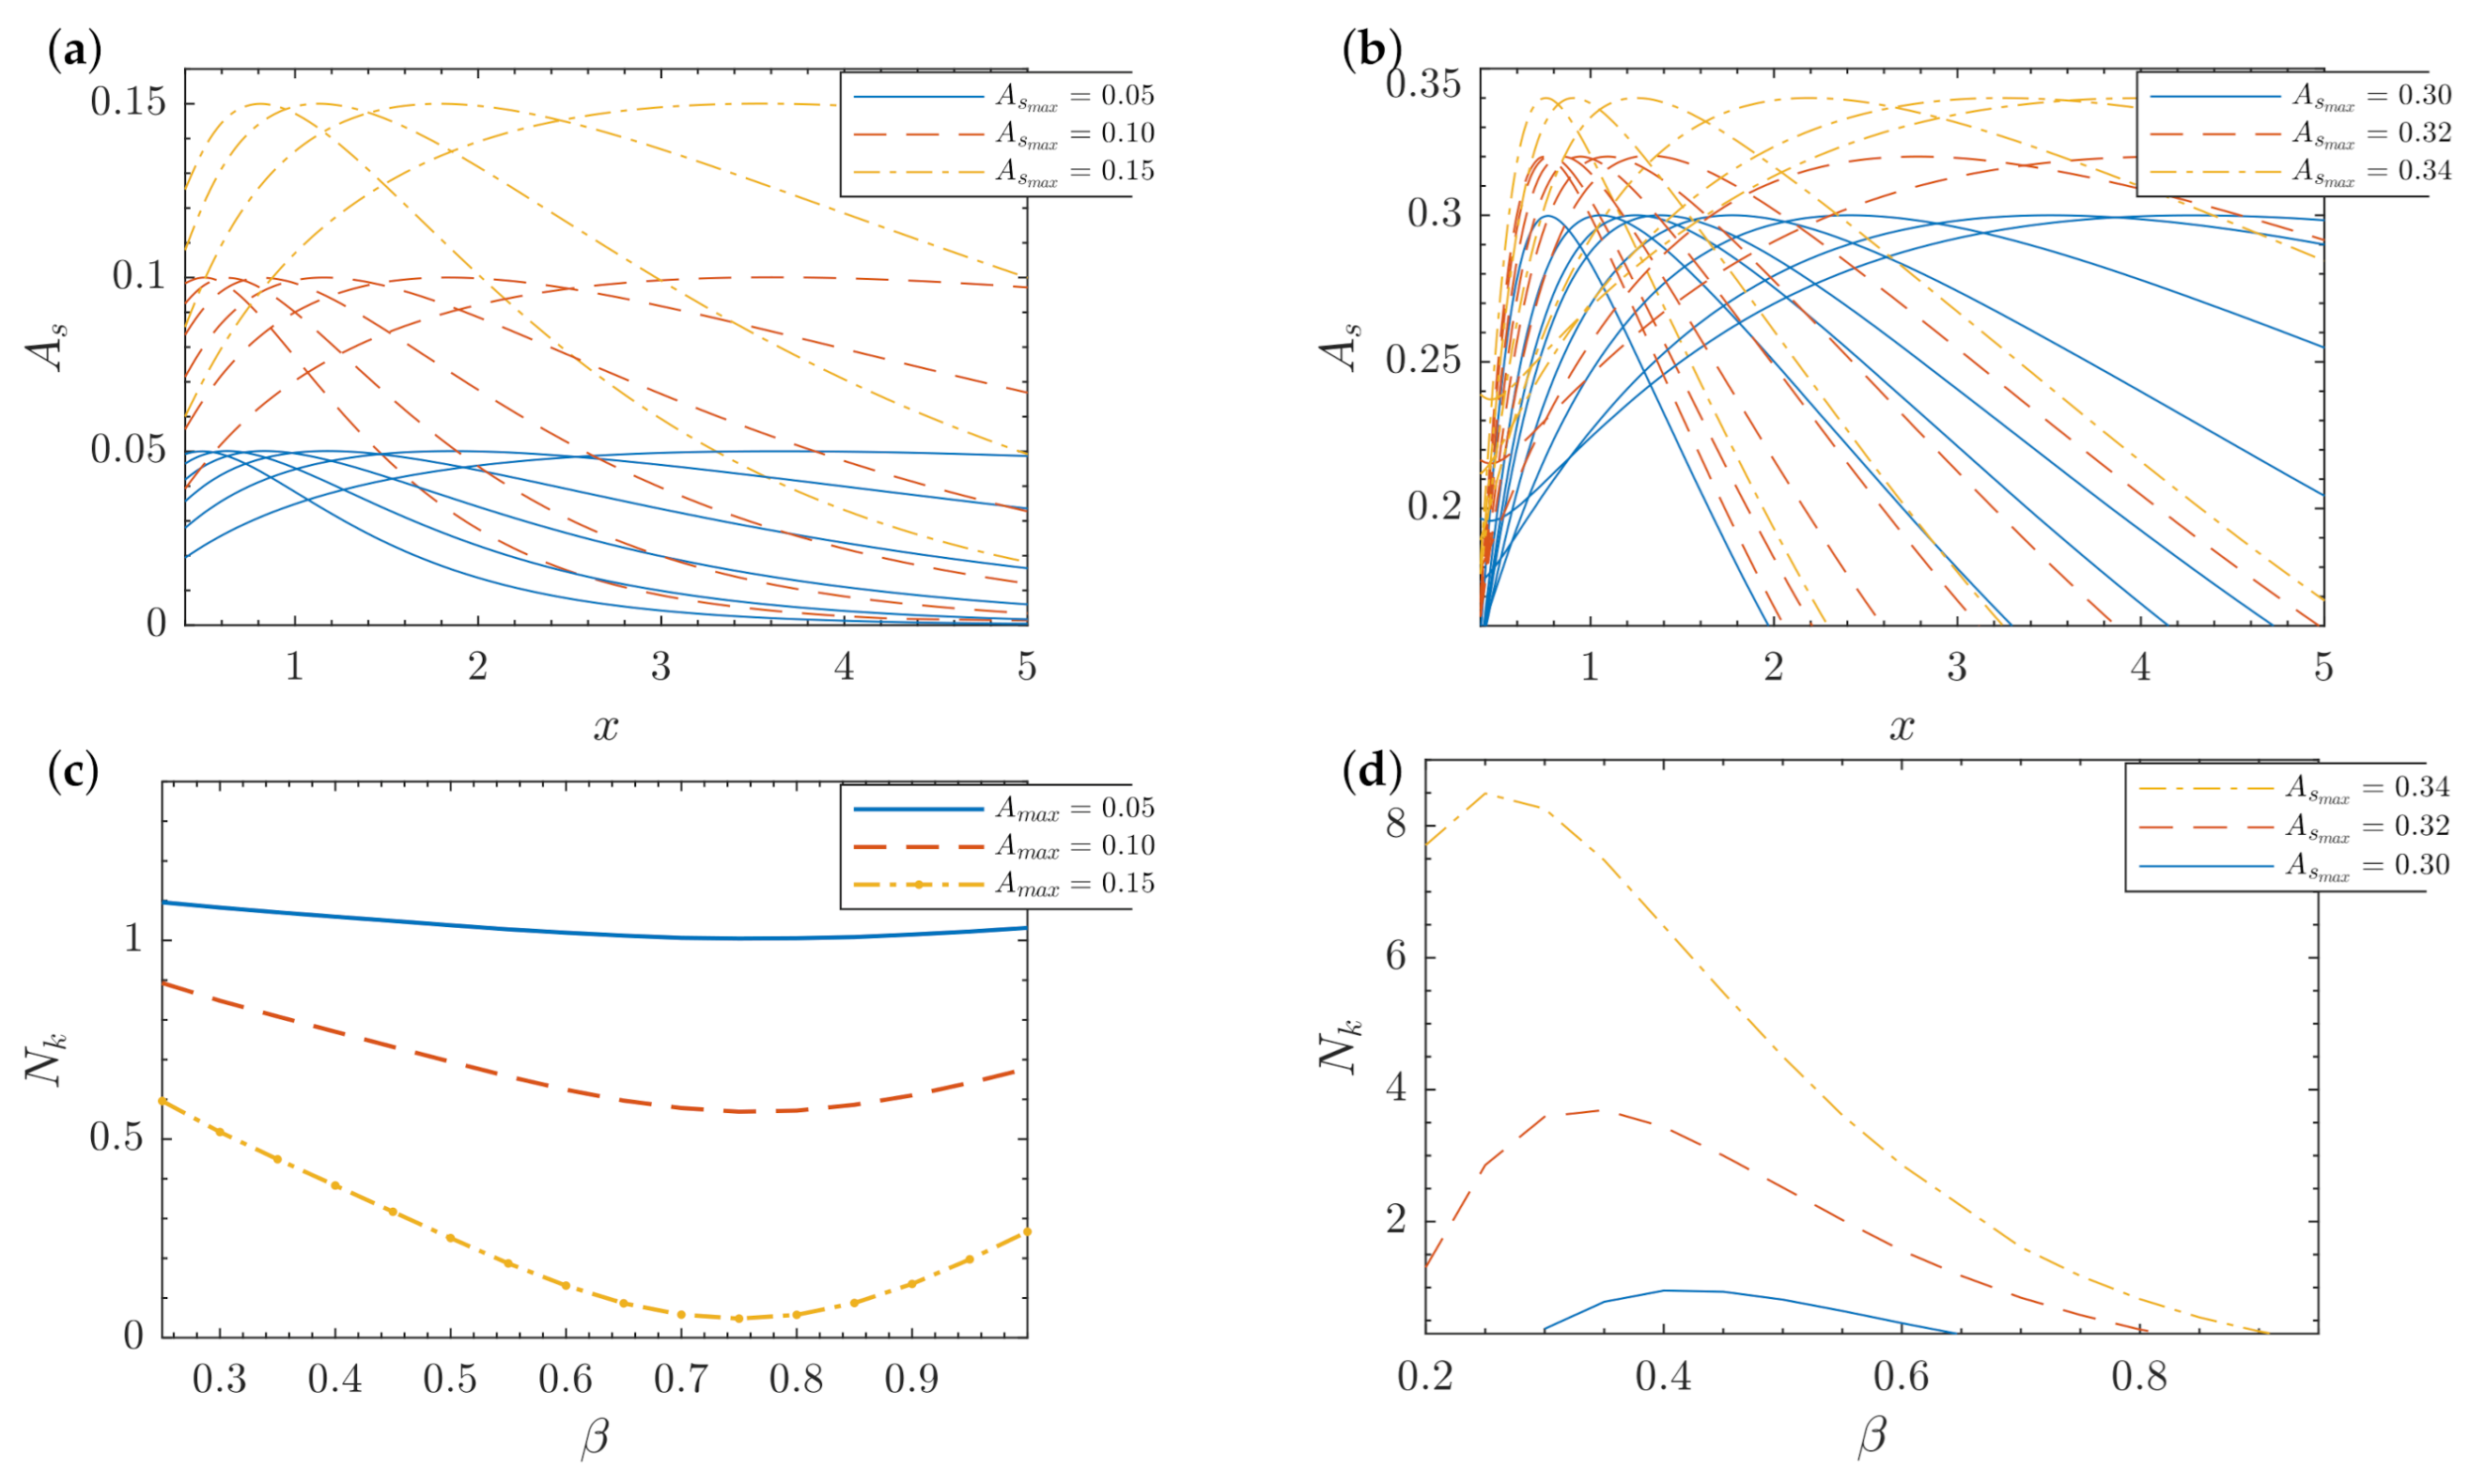
Now, we consider varying the spanwise wavenumber β introduced in expression Section 3.1. So far, the analyzed streaks correspond to a value of β 0 = 0.45 ; therefore, we intend to vary that value in order to examine the effect of β on the stability characteristics of the streaks. To this end, we simulate streaks in a range of the spanwise wavenumber β = 0.20 , 0.25 , 0.30 , , 0.95 , 1.00 . The initial streaky flow is selected for each β value, optimizing the velocity profile with the criteria of reaching the maximum energy at the streamwise location x = 1.0 . It provides the velocity field for the initial condition, which is finally scaled to obtain a family of streaks with the same maximum intensity. This process is repeated until 6 values of streak maximum amplitude are attained. Therefore, 6 families of streaks are generated; 3 of them ( A s m a x = 0.05 , A s m a x = 0.10 , and A s m a x = 0.15 ) stand below the critical amplitude of 0.26 (therefore TS waves are expected to be observed), and the 3 remaining are modulated to reach values above the critical amplitude ( A s m a x = 0.30 , A s m a x = 0.32 , and A s m a x = 0.34 , consequently SI are predicted to appear).
Figure 5 shows the analysis performed. On the top row of Figure 5, the streamwise development of the streak amplitude is represented. Figure 5a displays the evolution of the families of low intensity streaks, while Figure 5b stands for the families with high-intensity streaks; for each family, 17 streaks are simulated. The effect of the spanwise wavenumber is illustrated on the bottom row of Figure 5, where the variation of the N -factor with the wavenumber β is depicted. For the case of low-amplitude streaks, represented in subplot (c), the simulations have been performed at a frequency F = 130 , obtaining that the perturbation growth is decreased with the streak intensity and finding the existence of a β value that minimizes the N -factor. This value is maintained constant with the streak amplitude. This result is inline with the analysis reported by Bagheri and Hanifi in [6], where conventional (line-marching) nonlinear PSE were employed to perform this parametric study. However, the nonlinear PSE equations do not allow for the study of the effect of high-amplitude streaks (calculations diverge when A s m a x 0.29 ) in the amplification of TS waves or the study of the secondary instability of the streaks, as presented herein. The effect of high-amplitude streaks is displayed in Figure 5d. The frequency simulated in this case is F = 180 and, opposite to the low-amplitude streaks case, the arising of SI is enhanced with increasing streak amplitudes. In this case, there also exists a β value that maximizes the perturbation growth, although it is not kept constant and tends to low β values as the streak amplitude is increased. Therefore, a parametric study is essential to identify the streaks that affect the most to the perturbation growth.
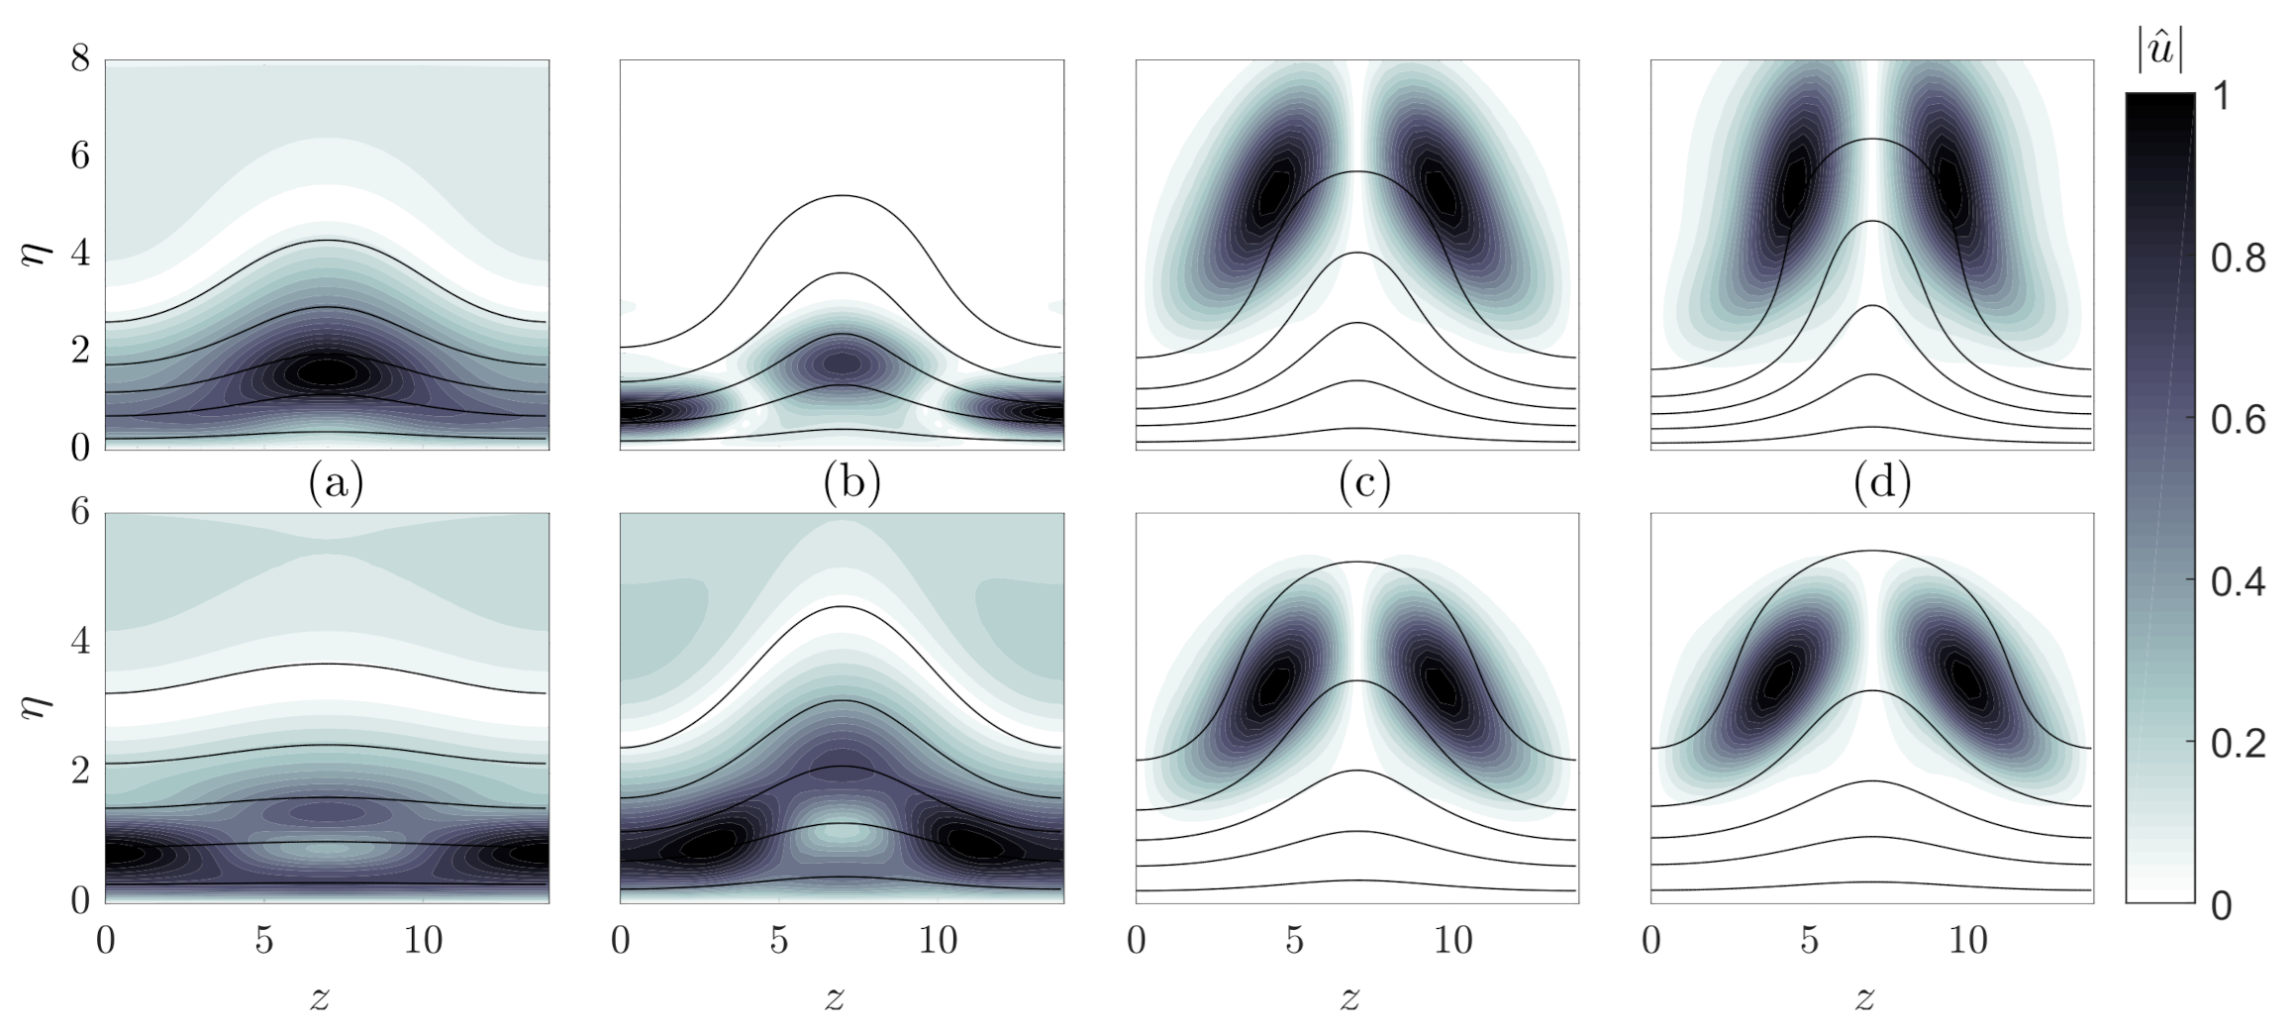
Figure 6 illustrates the magnitude of the streamwise velocity of the unstable modes, corresponding to four different streaks, with a maximum amplitude of A s m a x = 0.14 (a), 0.25 (b), 0.30 (c) and 0.36 (d), all of them extracted from the frequency with maximum growth rate in each case. The top row displays the shape mode at the streamwise locations where the maximum streak amplitude is reached, while the bottom row presents the mode the streamwise position where the maximum growth rate is achieved.

3.5. Efficiency of Streaks to Delay Transition

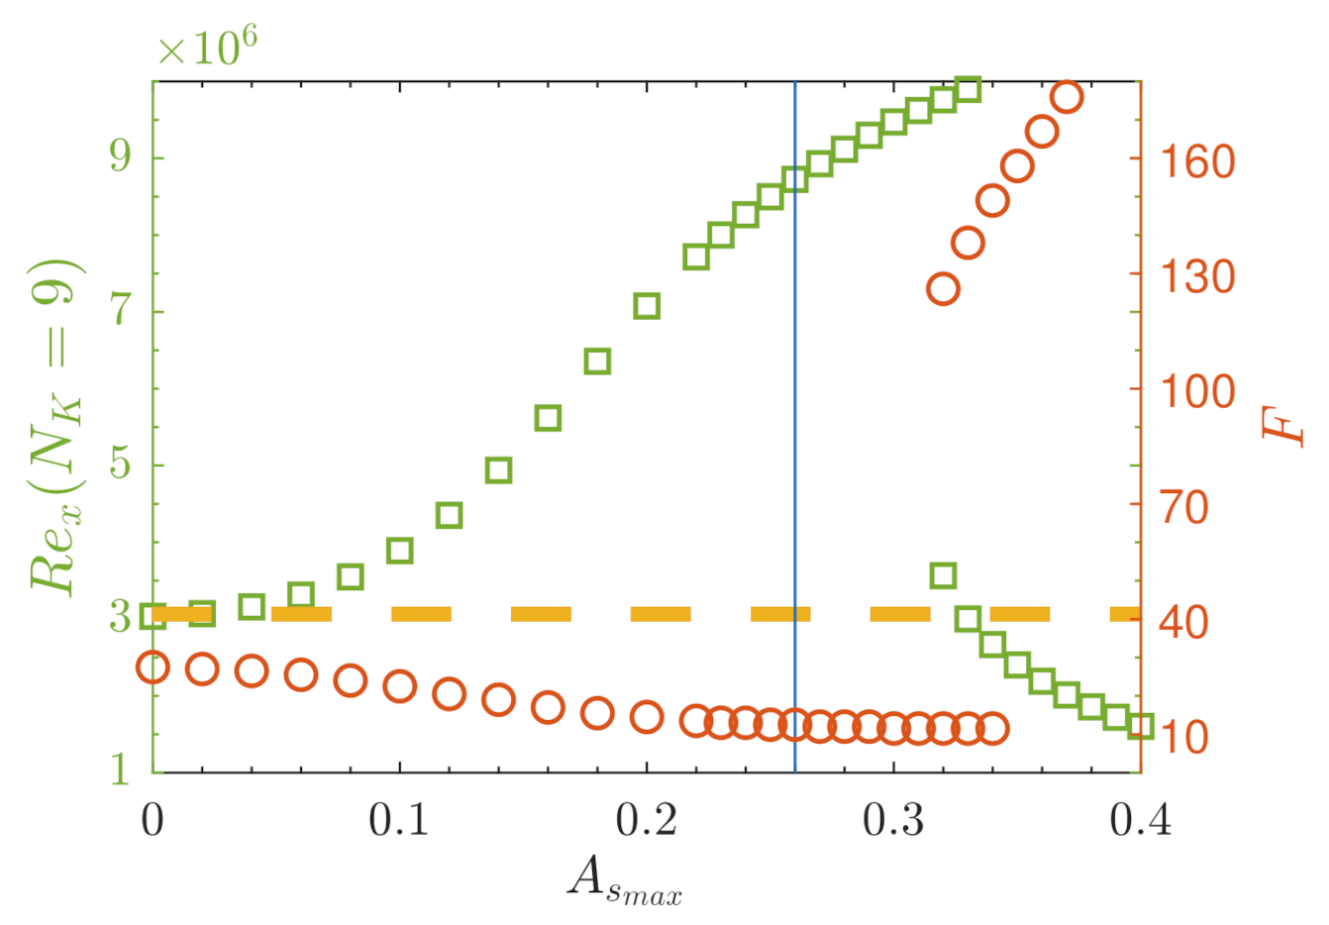
For the next analysis, we set the aim of performing a parametric study over the critical Reynolds number. To this end, we sweep over the maximum streak amplitude, simulating 36 streaks taking values from A s m a x = 0.0 to A s m a x = 0.4 , and we switch the Reynolds local level to a value of R e δ 0 = 1000 , in order to increase the value of the N -factor obtained. The critical Reynolds number is defined as the earliest location in the streamwise coordinate where transition from laminar to turbulent regime arises. It is assumed to occur when the logarithmic amplification N -factor attains a value of 9 [48]. Changes in the critical Reynolds number, as well as its respective critical frequency, are displayed in Figure 7 for the streaky flow. The value for the critical Reynolds number corresponding to the unperturbed Blasius boundary layer is marked with a horizontal dashed line. It can be clearly appreciated that the critical Reynolds number (green squares) is split into two branches: the upper one represents the streak effect of damping TS waves, the critical Reynolds number is displaced downstream (moved over the dash line), as the streak intensity increases, and the lower branch displays the rise of SI instabilities and how the critical Reynolds number is brought to an upstream location (below the dash line). The maximum value of the streak intensity for delaying transition can be then estimated when the SI branch meets the value of R e ( N K = 9 ) for the unperturbed boundary layer flow, taking a value of A s m a x = 0.33 . Concerning the critical frequency (red circles, now the lower branch corresponds to TS waves while the upper one to SI perturbations), it displays decreasing low values when TS waves are damped, while shifting to increasing large values as SI emerges.
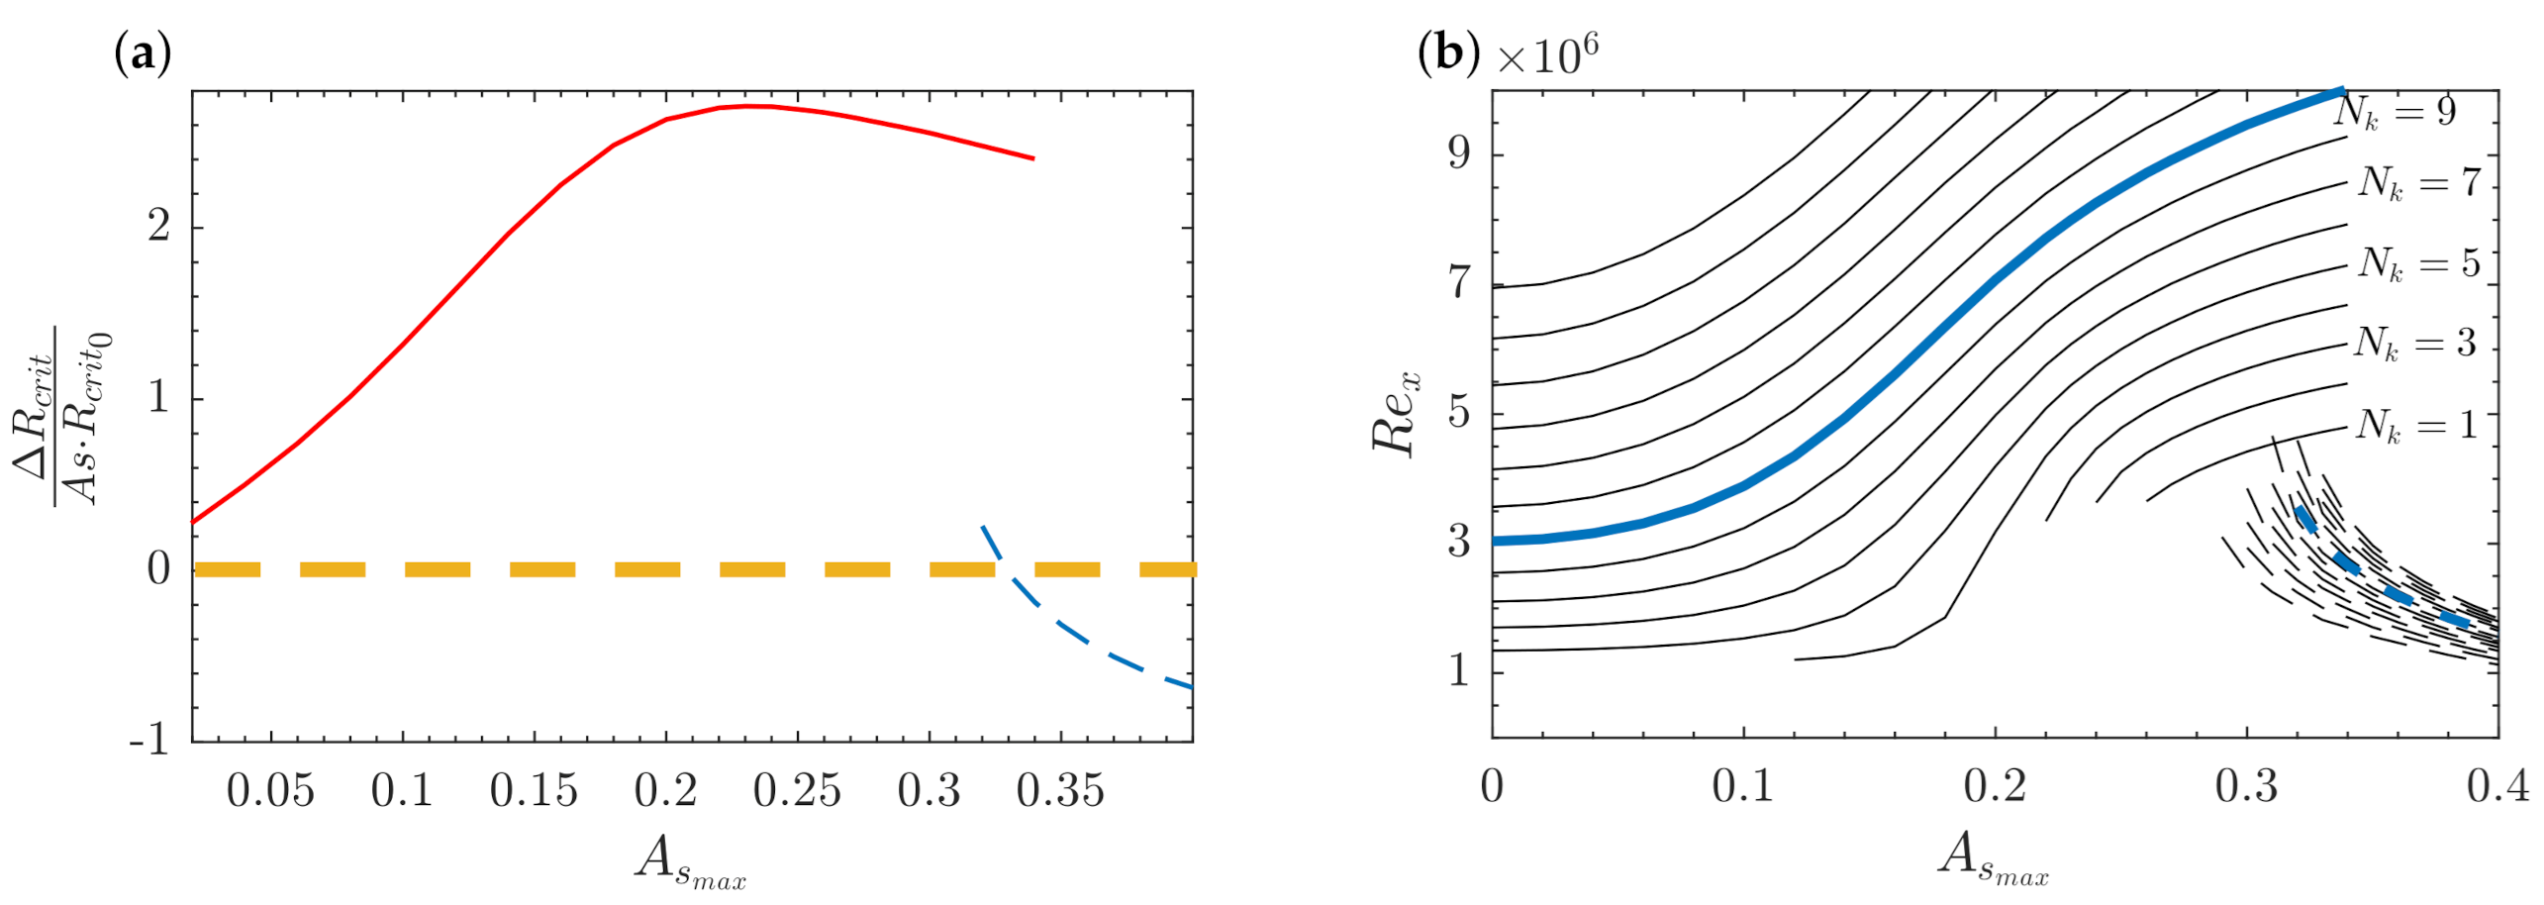
A comparison between the critical Reynolds number, R e c r i t (as established above), and the corresponding to the unperturbed Blasius flow, R e c r i t 0 , is presented in Figure 8a. Streak efficiency can be measured as
η = Δ R e c r i t A s m a x R e c r i t 0 ,
introducing the peak streak amplitude in order to measure the amount of distorted flow. This can be very helpful for active flow control methods, where the energy introduced into the system is depending on the flow modulation achieved (as reported, for example, in [49], where the flow distortion generated by the plasma actuator is proportional to the voltage applied). The red solid line corresponds to the streak efficiency change for streaks with small amplitude, showing the damping of TS waves, whereas the dash blue line represents large amplitude streaks, emerging the amplification of SI disturbances. The efficiency grows with the streak intensity, until a maximum is observed around a streak amplitude of A s m a x = 0.23 . Beyond this limit, a clear reduction is followed once SI section is entered, encountering negative values which represent that the transition location is moved upstream.
Figure 8b displays the isolines of the N -factor reached over the full set of simulations performed, connecting the disturbance level with the maximum value of the streak and the Reynolds number. Solid thin black lines represent the damping effect of streaks on TS waves, while the rise of SI perturbations is depicted with dash black lines. A thick blue line stands for the value N k = 9 . This figure illustrates the level of disturbance growth for both situations here investigated. Given a particular value of maximum streak intensity (for instance, A s m a x = 0.2 ), this map allows to find the Reynolds number (or streamwise location) in which a specific disturbance level would be reached (meaning that the streak with A s m a x = 0.2 would meet N -factor levels 5 , 7 , 9 at Reynolds numbers R e x = 3.6 × 10 6 , R e x = 5.5 × 10 6 , and R e x = 7 × 10 6 , respectively).

4. Conclusions

This work proposes a parametric investigation of the flat plate Blasius boundary layer disturbed through streamwise streaks, encountered as perturbations induced through passive (roughness elements, miniature vortex generators) or active flow control techniques (plasma actuators, boundary layer suction). The boundary region equations (BREs) are utilized to achieve the solution of the disturbed boundary layer flows. Neutral stability curves and growth rates (expressed in terms of N-factor) of a wide range of incompressible, streaky boundary layer flows are presented, applying the plane-marching PSE method.
The analysis developed shows the influence of the streak intensity (measured as the departure from the nonperturbed Blasius flow) on the stability features of the boundary layer flow. The damping of Tollmien–Schlichting (TS) waves and the amplification of secondary instabilities (SI) are reported. For the TS waves, moderate amplitude streaks reveal the stabilizing action, which is increased with the streak intensity. These perturbations are capable of total stabilization above a maximum streak amplitude of 0.25 when the local Reynolds number is R e δ = 400 . Considering the SI of streaks with larger intensities, the unstable area enclosing sinuous shear layer instabilities is enlarged and shifted upstream in the ( F R e δ ) chart, for increasing values of the maximum streak amplitude. In addition, a parametric study is performed in order to analyze the impact of the spanwise wavenumber β on the stability characteristics. This parametric analysis evidences the presence of an optimal β value for low-amplitude streaks, which minimizes the growth rate of the perturbations, and is maintained for all the streaks simulated. In the case of high-amplitude streaks, there is a β value for which the growth rate is maximized, not being kept constant but tending to small values as the streak intensity is increased.
Finally, establishing a value of the growth rate for transition prediction, the effectiveness of the streaks as flow control method is presented. The delay of the transition point is shown for the case of low-amplitude streaks, opposite of the case of high-amplitude streaks, where the critical Reynolds number is brought upstream as the streak intensity is increased. Last, an efficiency of the streaky flow (based on the intensity of the streak) is introduced, detecting the existence of an optimal streak amplitude for transition delay.
The formulation here employed is highly appropriate to analyze flows which are strongly dependent on two and weakly on the third spatial direction. The starting point is the perturbed flow, once that the initial condition is set, the computational cost is minimum. Therefore, parametric studies as presented in this paper, can be achieved in order of days employing a desktop computer. Moreover, the parametric analysis of the instability characteristics of the streaky boundary layer flow here conducted provides a useful guidance for the design of control devices for transition delay.

Author Contributions

Conceptualization, J.Á.M. and P.P.; methodology, J.Á.M. and P.P.; software, J.Á.M. and P.P.; validation, J.Á.M. and P.P.; investigation, J.Á.M. and P.P.; writing—original draft preparation, J.Á.M. and P.P.; writing—review and editing, J.Á.M. and P.P.; funding acquisition, J.Á.M. All authors have read and agreed to the published version of the manuscript.

Funding

The work of Juan Ángel Martín was funded by the Spanish Ministerio de Ciencia, Innovación y Universidades under grant DPI2017-84700-R.

Institutional Review Board Statement

Not applicable.

Informed Consent Statement

Not applicable.

Data Availability Statement

The raw data that support the findings of this study are available from the corresponding author upon reasonable request.

Conflicts of Interest

The authors declare no conflict of interest.

References

  1. Matsubara, M.; Alfredsson, P. Disturbance growth in boundary layers subjected to free-stream turbulence. J. Fluid Mech. 2001, 430, 149–168. [Google Scholar] [CrossRef]
  2. Brandt, L.; Henningson, D. Transition of streamwise streaks in zero-pressure-gradient boundary layers. J. Fluid Mech. 2002, 472, 229–261. [Google Scholar] [CrossRef]
  3. Brandt, L. Numerical studies of the instability and breakdown of a boundary-layer low-speed streak. Eur. J. Mech. B Fluids 2007, 26, 64–82. [Google Scholar] [CrossRef]
  4. Cossu, C.; Brandt, L. Stabilization of Tollmien-Schlichting waves by finite amplitude optimal streaks in the Blasius boundary layer. Phys. Fluids 2002, 14, L57–L60. [Google Scholar] [CrossRef] [Green Version]
  5. Cossu, C.; Brandt, L. On Tollmien-Schlichting-like waves in streaky boundary layers. Eur. J. Mech. B Fluids 2004, 23, 815–833. [Google Scholar] [CrossRef]
  6. Bagheri, S.; Hanifi, A. The stabilizing effect of streaks on Tollmien-Schlichting and oblique waves: A parametric study. Phys. Fluids 2007, 19, 078103. [Google Scholar] [CrossRef]
  7. Fransson, J.H.M.; Brandt, L.; Talamelli, A.; Cossu, C. Experimental and theoretical investigation of the nonmodal growth of steady streaks in a flat plate boundary layer. Phys. Fluids 2004, 16, 3627–3638. [Google Scholar] [CrossRef] [Green Version]
  8. Fransson, J.H.M.; Brandt, L.; Talamelli, A.; Cossu, C. Experimental study of the stabilization of Tollmien-Schlichting waves by finite amplitude streaks. Phys. Fluids 2005, 17, 054110. [Google Scholar] [CrossRef] [Green Version]
  9. Fransson, J.H.M.; Talamelli, A.; Brandt, L.; Cossu, C. Delaying transition to turbulence by a passive mechanism. Phys. Rev. Lett. 2006, 96, 064501. [Google Scholar] [CrossRef] [Green Version]
  10. Tani, I.; Komoda, H. Boundary-Layer transition in the presence of streamwise vortices. J. Aerosp. Sci. 1962, 29, 440–444. [Google Scholar] [CrossRef]
  11. Fransson, J.H.M.; Talamelli, A. On the generation of steady streamwise streaks in flat-plate boundary layers. J. Fluid Mech. 2012, 698, 211–234. [Google Scholar] [CrossRef]
  12. Shahinfar, S.; Sattarzadeh, S.S.; Fransson, J.H.M.; Talamelli, A. Revival of Classical Vortex Generators Now for Transition Delay. Phys. Rev. Lett. 2012, 109, 074501. [Google Scholar] [CrossRef]
  13. Shahinfar, S.; Fransson, J.H.M.; Sattarzadeh, S.S.; Talamelli, A. Scaling of streamwise boundary layer streaks and their ability to reduce skin-friction drag. J. Fluid Mech. 2013, 733, 1–32. [Google Scholar] [CrossRef] [Green Version]
  14. Sattarzadeh, S.S.; Fransson, J.H.M.; Talamelli, A.; Fallenius, B.E.G. Consecutive turbulence transition delay with reinforced passive control. Phys. Rev. E 2014, 89, 061001. [Google Scholar] [CrossRef]
  15. Shahinfar, S.; Sattarzadeh, S.S.; Fransson, J.H.M. Passive boundary layer control of oblique disturbances by finite-amplitude streaks. J. Fluid Mech. 2014, 749, 1–36. [Google Scholar] [CrossRef]
  16. Siconolfi, L.; Camarri, S.; Fransson, J.H.M. Stability analysis of boundary layers controlled by miniature vortex generators. J. Fluid Mech. 2015, 784, 596–618. [Google Scholar] [CrossRef]
  17. Downs, R.S.; Fransson, J.H.M. Tollmien-Schlichting wave growth over spanwise-periodic surface patterns. J. Fluid Mech. 2014, 754, 39–74. [Google Scholar] [CrossRef]
  18. Doerr, P.C.; Kloker, M.J. Numerical Investigations on Tollmien-Schlichting Wave Attenuation Using Plasma-Actuator Vortex Generators. AIAA J. 2018, 56, 1305–1309. [Google Scholar] [CrossRef]
  19. Sattarzadeh, S.S.; Fransson, J.H.M. Spanwise boundary layer modulations using finite discrete suction for transition delay. Exp. Fluids 2017, 58, 14. [Google Scholar] [CrossRef] [Green Version]
  20. Kemp, N. The Laminar Three-Dimensional Boundary Layer and a Study of the Flow Past a Side Edge. Ph.D. Thesis, Cornell University, Ithaca, NY, USA, 1951. [Google Scholar]
  21. Martin, J.A.; Martel, C. Nonlinear streak computation using boundary region equations. Fluid Dyn. Res. 2012, 44, 045503. [Google Scholar] [CrossRef]
  22. Paredes, P.; Rodriguez, D.; Theofilis, V. Three-Dimensional Solutions of Trailing-Vortex Flows Using Parabolized Equations. AIAA J. 2013, 51, 2763–2770. [Google Scholar] [CrossRef]
  23. Paredes, P. Advances in Global Instability Computations: From Incompressible to Hypersonic Flow. Ph.D. Thesis, Technical University of Madrid, Madrid, Spain, 2014. [Google Scholar]
  24. Paredes, P.; Hanifi, A.; Theofilis, V.; Henningson, D. The nonlinear PSE-3D concept for transition prediction in flows with a single slowly-varying spatial direction. Procedia IUTAM 2015, 14C, 35–44. [Google Scholar] [CrossRef] [Green Version]
  25. Martín, J.A.; Paredes, P. Three-dimensional instability analysis of boundary layers perturbed by streamwise vortices. Theor. Comp. Fluid Dyn. 2017, 31, 505–517. [Google Scholar] [CrossRef]
  26. Rubin, S.G.; Tannehill, J.C. Parabolized Reduced Navier-Stokes Computational Techniques. Annu. Rev. Fluid Mech. 1992, 24, 117–144. [Google Scholar] [CrossRef]
  27. Hall, P. The Nonlinear Development of Görtler Vortices in Growing Boundary-Layers. J. Fluid Mech. 1988, 193, 243–266. [Google Scholar] [CrossRef]
  28. Hall, P.; Smith, F.T. On Strongly Nonlinear Vortex Wave Interactions in Boundary-Layer-Transition. J. Fluid Mech. 1991, 227, 641–666. [Google Scholar] [CrossRef] [Green Version]
  29. Fletcher, C.A.J. Computational Techniques for Fluid Dynamics; Springer: Berlin, Germany, 1988; Volume II, p. 411. [Google Scholar]
  30. Chen, C.S. Numerical method for predicting three-dimensional steady compressible flow in long microchannels. J. Micromech. Microeng. 2004, 14, 1091–1100. [Google Scholar] [CrossRef]
  31. Chen, C.S. Reduced Navier-Stokes simulation of incompressible microchannel flows. Numer. Heat Transf. Part A 2008, 53, 71–87. [Google Scholar] [CrossRef]
  32. Goldstein, M.; Wundrow, D. On the environmental realizability of algebraically growing disturbances and their relation to Klebanoff modes. Theoret. Comput. Fluid Dyn. 1998, 10, 171–186. [Google Scholar] [CrossRef] [Green Version]
  33. Wundrow, D.; Goldstein, M. Effect on a laminar boundary layer of small-amplitude streamwise vorticity in the upstream flow. J. Fluid Mech. 2001, 426, 229–262. [Google Scholar] [CrossRef]
  34. Leib, S.; Wundrow, D.; Goldstein, M. Effect of free-stream turbulence and other vortical disturbances on a laminar boundary layer. J. Fluid Mech. 1999, 380, 169–203. [Google Scholar] [CrossRef] [Green Version]
  35. Goldstein, M.; Sescu, A. Boundary-layer transition at high free-stream disturbance levels – beyond Klebanoff modes. J. Fluid Mech. 2008, 613, 95–124. [Google Scholar] [CrossRef]
  36. Ricco, P. The pre-transitional Klebanoff modes and other boundary-layer disturbances induced by small-wavelength free stream vorticity. J. Fluid Mech. 2009, 638, 267–303. [Google Scholar] [CrossRef]
  37. Ricco, P.; Luo, J.; Wu, X. Evolution and instability of unsteady nonlinear streaks generated by free-stream vortical disturbances. J. Fluid Mech. 2011, 677, 1–38. [Google Scholar] [CrossRef]
  38. Wu, X.; Zhao, D.; Luo, J. Excitation of steady and unsteady Görtler vortices by free-stream vortical disturbances. J. Fluid Mech. 2011, 682, 66–100. [Google Scholar] [CrossRef]
  39. Herbert, T. Parabolized stability equations. Annu. Rev. Fluid Mech. 1997, 29, 245–283. [Google Scholar] [CrossRef]
  40. Bridges, T.; Morris, P. Differential eigenvalue problems in which the parameter appears nonlinearly. J. Comp. Phys. 1984, 55, 437–460. [Google Scholar] [CrossRef]
  41. Theofilis, V. Spatial stability of incompressible attachment line flow. Theor. Comput. Fluid Dyn. 1995, 7, 159–171. [Google Scholar] [CrossRef] [Green Version]
  42. Paredes, P.; Hermanns, M.; Le Clainche, S.; Theofilis, V. Order 104 speedup in global linear instability analysis using matrix formation. CMAME 2013, 253, 287–304. [Google Scholar] [CrossRef] [Green Version]
  43. Andersson, P.; Berggren, M.; Henningson, D.S. Optimal disturbances and bypass transition in boundary layers. Phys. Fluids 1999, 11, 134–150. [Google Scholar] [CrossRef]
  44. Andersson, P.; Brandt, L.; Bottaro, A.; Henningson, D. On the breakdown of boundary layer streaks. J. Fluid Mech. 2001, 428, 29–60. [Google Scholar] [CrossRef]
  45. Denissen, N.A.; White, E.B. Secondary instability of roughness-induced transient growth. Phys. Fluids 2013, 25, 114108. [Google Scholar] [CrossRef]
  46. White, E.B. Transient growth of stationary disturbances in a flat plate boundary layer. Phys. Fluids 2002, 14, 4429–4439. [Google Scholar] [CrossRef]
  47. White, E.B.; Rice, J.M.; Ergin, F.K. Receptivity of stationary transient disturbances to surface roughness. Phys. Fluids 2005, 17, 064109. [Google Scholar] [CrossRef]
  48. Ingen, J.L.V. The eN method for transition prediction. Historical review of work at TU Delft. In Proceedings of the AIAA 38th Fluid Dynamics Conference and Exhibit, Seattle, WA, USA, 23–26 June 2008; p. 3830. [Google Scholar]
  49. Moralev, I.A.; Firsov, A.A.; Preobrazhensky, D.; Selivonin, I. Damping of the low velocity streak by adaptive plasma actuator. In Proceedings of the 7th European Conference for Aeronautics and Space Sciences (EUCASS), Milan, Italy, 3–6 July 2017; p. 270. [Google Scholar]
Figure 1. Sketch of a flat plate boundary layer with a spanwise periodic array of steady streaks developed. The asymptotic scaling for R e 1 is shown. LS (HS) stands for low (high) velocity in the streamwise component.
Energies 14 02147 g001
Figure 2. Streaks with a maximum amplitude of A s m a x = 0.14 (a), 0.20 (b), 0.28 (c), and 0.36 (d), attained at streamwise locations of (a) R e δ = 580 , (b) R e δ = 570 , (c) R e δ = 544 , and (d) R e δ = 486 . The top row corresponds to the streamwise velocity field u, while the bottom row stands for the shear rate u s . The dash line indicates contour levels 0.1 , 0.3 , 0.5 , 0.7 , with level 0.9 marked with a solid line.
Energies 14 02147 g002
Figure 3. Effect of scaling the perturbation as y c y at the maximum transient growth location, for a streak intensity of (a) A s m a x = 0.10 and (b) A s m a x = 0.20 .
Energies 14 02147 g003
Figure 4. (a) Neutral stability curves for each streak, representing a peak intensity of A s m a x = 0.00 (A), 0.14 (B), 0.20 (C), 0.25 (D), 0.28 (E), 0.30 (F), 0.32 (G), 0.34 (H), 0.36 (I), 0.38 (J), and 0.40 (G). (b) N -factor variation with frequency for the secondary unstable streaks, at each streamwise location where maximum N -factor is reached.
Energies 14 02147 g004
Figure 5. (a,b) Evolution of β -family of streaks for several values of maximum streak intensity. Effect of wavenumber β on N-factor over (c) TS waves and (d) SI.
Energies 14 02147 g005
Figure 6. Shape mode of the perturbation for streaks with a peak intensity of A s m a x = 0.14 (a), 0.25 (b), 0.30 (c), and 0.36 (d). Top row corresponds to, for each streak, the streamwise location ((a) R e δ = 580 , (b) R e δ = 555 , (c) R e δ = 533 and (d) R e δ = 486 ) where maximum streak amplitude is reached. Bottom row stands for the streamwise position ((a) R e δ = 1236 , (b) R e δ = 332 , (c) R e δ = 843 , and (d) R e δ = 976 ) where maximum N -factor is attained. Contour levels denote the 0.1 , 0.3 , 0.5 , 0.7 , 0.9 of the streamwise velocity component for each streak.
Energies 14 02147 g006
Figure 7. Effect of maximum streak intensity on critical Reynolds number (indicated by green squares) and critical frequency (denoted by red circles). Vertical thin line represents the streak amplitude from which the SI perturbations arise.
Energies 14 02147 g007
Figure 8. (a) Effect of the maximum streak amplitude on the stabilization efficiency, red solid line represents TS waves, blue dash line stands for SI perturbations. (b) N -factor isolines over Reynolds number and maximum streak amplitude chart, spaced as N k = 1 , 2 , , 15 . Solid (dash) thin black line displays damping of TS waves (rise of SI perturbations), with N k = 9 highlighted with a thick solid (dash) blue line.
Energies 14 02147 g008
Table 1. Maximum N -factor for each streak simulated, providing streamwise location R δ and frequency F of the perturbation.
A s max   N k max   Re δ where N k max   F for N k max
  0.00   5.3   1251    48  
  0.14   3.5   1236    48  
  0.20   2.1   1225    48  
  0.25  0.01    332   220  
  0.28   0.1    759   190  
  0.30   1.1    843   240  
  0.32   4.0    901   295  
  0.34   8.1    943   340  
  0.36  13.0    976   380  
  0.38  18.2   1004   415  
  0.40  23.2   1025   445  
Publisher’s Note: MDPI stays neutral with regard to jurisdictional claims in published maps and institutional affiliations.