Article

A MCDM Methodology to Determine the Most Critical Variables in the Pressure Drop and Heat Transfer in Minichannels

by
Eloy Hontoria
1,
Alejandro López-Belchí
2,*,
Nolberto Munier
3 and
Francisco Vera-García
4
1
Department of Business Economics, Technical University of Cartagena, 30202 Cartagena-Murcia, Spain
2
University Centre of Defence at the Spanish Air Force Academy, 30720 Santiago de la Ribera-Murcia, Spain
3
Technical University of Valencia, Ingenio, 46022 Valencia, Spain
4
Department of Thermal Engineering and Fluids, Technical University of Cartagena, 30202 Cartagena-Murcia, Spain
*
Author to whom correspondence should be addressed.
Energies 2021, 14(8), 2069; https://doi.org/10.3390/en14082069
Submission received: 2 March 2021 / Revised: 30 March 2021 / Accepted: 31 March 2021 / Published: 8 April 2021
(This article belongs to the Special Issue Modelling of Thermal and Energy Systems)

Abstract

:
This paper proposes a methodology aiming at determining the most influent working variables and geometrical parameters over the pressure drop and heat transfer during the condensation process of several refrigerant gases using heat exchangers with pipes mini channels technology. A multi-criteria decision making (MCDM) methodology was used; this MCDM includes a mathematical method called SIMUS (Sequential Interactive Modelling for Urban Systems) that was applied to the results of 2543 tests obtained by using a designed refrigeration rig in which five different refrigerants (R32, R134a, R290, R410A and R1234yf) and two different tube geometries were tested. This methodology allows us to reduce the computational cost compared to the use of neural networks or other model development systems. This research shows six variables out of 39 that better define simultaneously the minimum pressure drop, as well as the maximum heat transfer, saturation pressure fluid entering the condenser being the most important one. Another aim of this research was to highlight a new methodology based on operation research for their application to improve the heat transfer energy efficiency and reduce the CO2 footprint derived of the use of heat exchangers with minichannels.

1. Introduction

In order to increase the efficiency in modern refrigeration mini channels condensers, there is a need to determine two conflicting output variables: the minimum pressure drop and the maximum heat transfer. This improvement has a direct impact in energy savings, as well as in the price of equipment, also contributing to sustainability.
The energy consumption in buildings is about 40% of the total energy consumption in the European Union and also in the rest of the world [1,2]. From that, out of that 40%, the energy requirement in buildings for Heating–Ventilation-Air conditioning (HVAC) systems varies from 16% up to 50% [3] and it is responsible of the 33% of global greenhouse emissions [4]. There are several ways to reduce gas emissions and energy consumption: (i) encouraging the use of renewable sources, (ii) upgrading the building envelope to reduce its energy demand and (iii) increasing the performance of the technical subsytems in the building.
Heat exchangers, condensers and evaporators with minichannels tubes are very attractive technologies to achieve the third item of the previous list, since they present extremely high heat transfer coefficient and also higher area to surface ratios than conventional tubes or plain tubes. Minichannels tubes also provide higher inner surface areas than outer surface areas, which makes these heat exchangers very compact. Due to its reduced volume, compared with conventional tubes technology, minichannels heat exchangers are the ideal devices to work with flammable or toxic refrigerants or to reduce the gas emissions associated with a leakage [5].
However, there are some drawbacks in minichannel geometries, such as a very high number of correlations between the heat transfer coefficient and pressure drops, in fact, do not predict both variables correctly in minichannels. In most of the cases, none of these correlations can predict the value of the heat transfer coefficient due to the change of the physical problem. The forces acting in minichannels are the same than in conventional tubes, but the order of magnitude strongly changes. This affects the flow patterns associated with the inner phase change flow and, thus, the heat transfer coefficient and pressure drop [6]. Several international research groups are studying minichannels technology to achieve a deeper understanding of flow patterns and behavior in these geometries [7,8,9,10,11,12].
Minichannels present a higher pressure drop and heat transfer coefficient than conventional tubes. In addition, the former also reduces the fluid load and the global warming potential (GWP) associated with the equipment. A correct design must take advantage of the higher heat transfer coefficients that can be achieved in these types of heat exchangers by controlling the pressure drop, because the performance may degrade rapidly.
Typically, minichannels develop intermittent or annular flow patterns, which exhibit higher heat transfer coefficients. With these flow patterns, the thin liquid film is restricted to the walls, decreasing the thermal resistance, thus increasing the heat transfer coefficient between the gas core ant the tube wall. The reduction of the tube diameter also affects pressure drop by increasing it, due to the intensification of the interfacial stress [13]. Thus, the increase in pressure drop within minichannels is the main drawback of this technology because of the risk of degradation of the overall performance. This can be solved easily by using a larger number of parallel tubes in the heat exchangers; however, it affects the compactness of the system. Therefore, to optimize the design using this technology, the designer needs accurate prediction tools and the modelling of both the frictional pressure drop and heat transfer coefficient within minichannels [14].
Each refrigerant presents its own characteristics that makes it the best option for certain applications. R134a is a hydro fluoro carbon (HFC) with null ozone depletion power (ODP), a global warming potential (GWP) of 1430 [15] and a critical temperature of 101.1 °C. Its high critical temperature makes it a good option for working at high temperatures without degrading substantially its performance. Therefore, this fluid is widely used in developed countries to retrofit equipment with R12 and R22 [16]. In addition, the amendment of the Montreal Protocol on 1 January 2019 sets the HFCs (i.e., R123a) as controlled substances and also scheduled for phasing-down.
A new alternative to R134a is R1234yf (HFO—Hydro Fluoro Olefin). This alternative has a GWP of 4 and an ODP of 0, with a little lower critical temperature than R134a (95 °C) and a critical pressure of 34 bars. As a consequence, this fluid can operate in a similar way than R134a. Unfortunately, this new generation fluids presents a classification of A2L by ASHRAE, which means that it is classified as slightly flammable. There is no possibility of directly retrofitting previous R134a systems with R1234yf; therefore, R1234yf is only valid in new refrigeration systems.
R32 is a low temperature refrigerant fluid with null ODP, a GWP of 675 and it is classified as A2 by ASHRAE (it is flammable). R32 is the alternative to R410A, but it is not a retrofit fluid. It is suitable for new equipment designed for R32 systems that commonly use R410A. R32 has a critical temperature of 78 °C and a critical pressure of 58 bars.
R410A is a HFC blend 50% in weight of R32 and R125. The blend presents a low glide, making it suitable for centrifugal compressors and low temperature operation. R410A presents 0 ODP and a GWP of 2088. Due to the addition of R125 to the blend, it is not flammable and classified as A1 by ASHRAE. This fluid has a critical temperature of 71 °C and a critical pressure of 49 bars.
Finally, another fluid, R290 (propane), which is a natural fluid, has 0 ODP and a GWP of 6. The use of this fluid in refrigerant applications is increasing, due to its low environmental impact and good thermodynamic performance. Since it is a highly flammable refrigerant (A3 ASHRAE Classification), it cannot be used for retrofitting in existing fluorocarbon refrigeration systems. It has a critical temperature of 97 °C and a critical pressure of 43 bars. Propane is quite adequate for the high compactness of minichannels heat exchangers, since the fluid charge in these systems is quite reduced. According to UNE-EN IEC 60335-2-76:2019, the limitation of propane charge in household and similar electrical appliances must be lower than 500 g. The main characteristics of the five refrigerants analyzed in this study are presented in Table 1.
The application of SIMUS (Sequential Interactive Modelling for Urban Systems, version v. 3.13, Valencia, Spain) [17] on large data sets allows us to obtain the most representative characteristics with a computational cost much lower than that required with other techniques applied by the authors in previous occasions. The analysis carried out in the latter case [18] would require a total of 35 h of calculation, while the SIMUS method barely takes 5 min. Other experimental methods were used to obtain the more influencing working parameters for minichannels multiport tubes [19] or for fin and tubes heat exchangers [20].
After the introduction, the reminder of this research is organized as follows: In Section 2, “Materials and Methods”, we describe this work, beginning with the description of the methodology to get results (Section 2.1). Section 2.2 details the design of the lab experiment, Section 2.3 details the variables involved and Section 2.4 details the large dataset obtained. To find out the most important variables, a multi-criteria decision making (MCDM) method named SIMUS (sequential interactive modelling for urban systems) [17] is explained and utilized in Section 2.5. The results obtained in the experiment will be discussed in Section 3. Then, Section 4 finishes with some conclusions and directions for future research.

2. Materials and Methods

2.1. Methodology

To define the most critical variables, a methodology is necessary that is able to deal with many processes belonging to different fields. The final goal of this methodology is to highlight an easy sequence of steps to be followed for the identification of the most critical variables when dealing with a large data set. This methodology includes an MCDM method with a very low computational time.
The developed methodology (Figure 1) is composed of 4 phases and their corresponding steps. The first phase is the conceptual design of the research to obtain the most critical variables and starts with the definition of the problem and ends with a large dataset of tests, which will be refined in the second phase, pointing at a more tractable data.
The SIMUS method is used in Phase 3, aiming to determine the most significant input variables affecting output variables. In the former phase, tests in which the maximum heat transfer and the minimum pressure drop will be detected. Once the set of variables defining the goals of the research is obtained, a sensitivity analysis is performed in Step 4.1 to check the robustness of the solution. In step 4.2, relationships regarding the set of solutions and thermodynamic implications are analyzed.

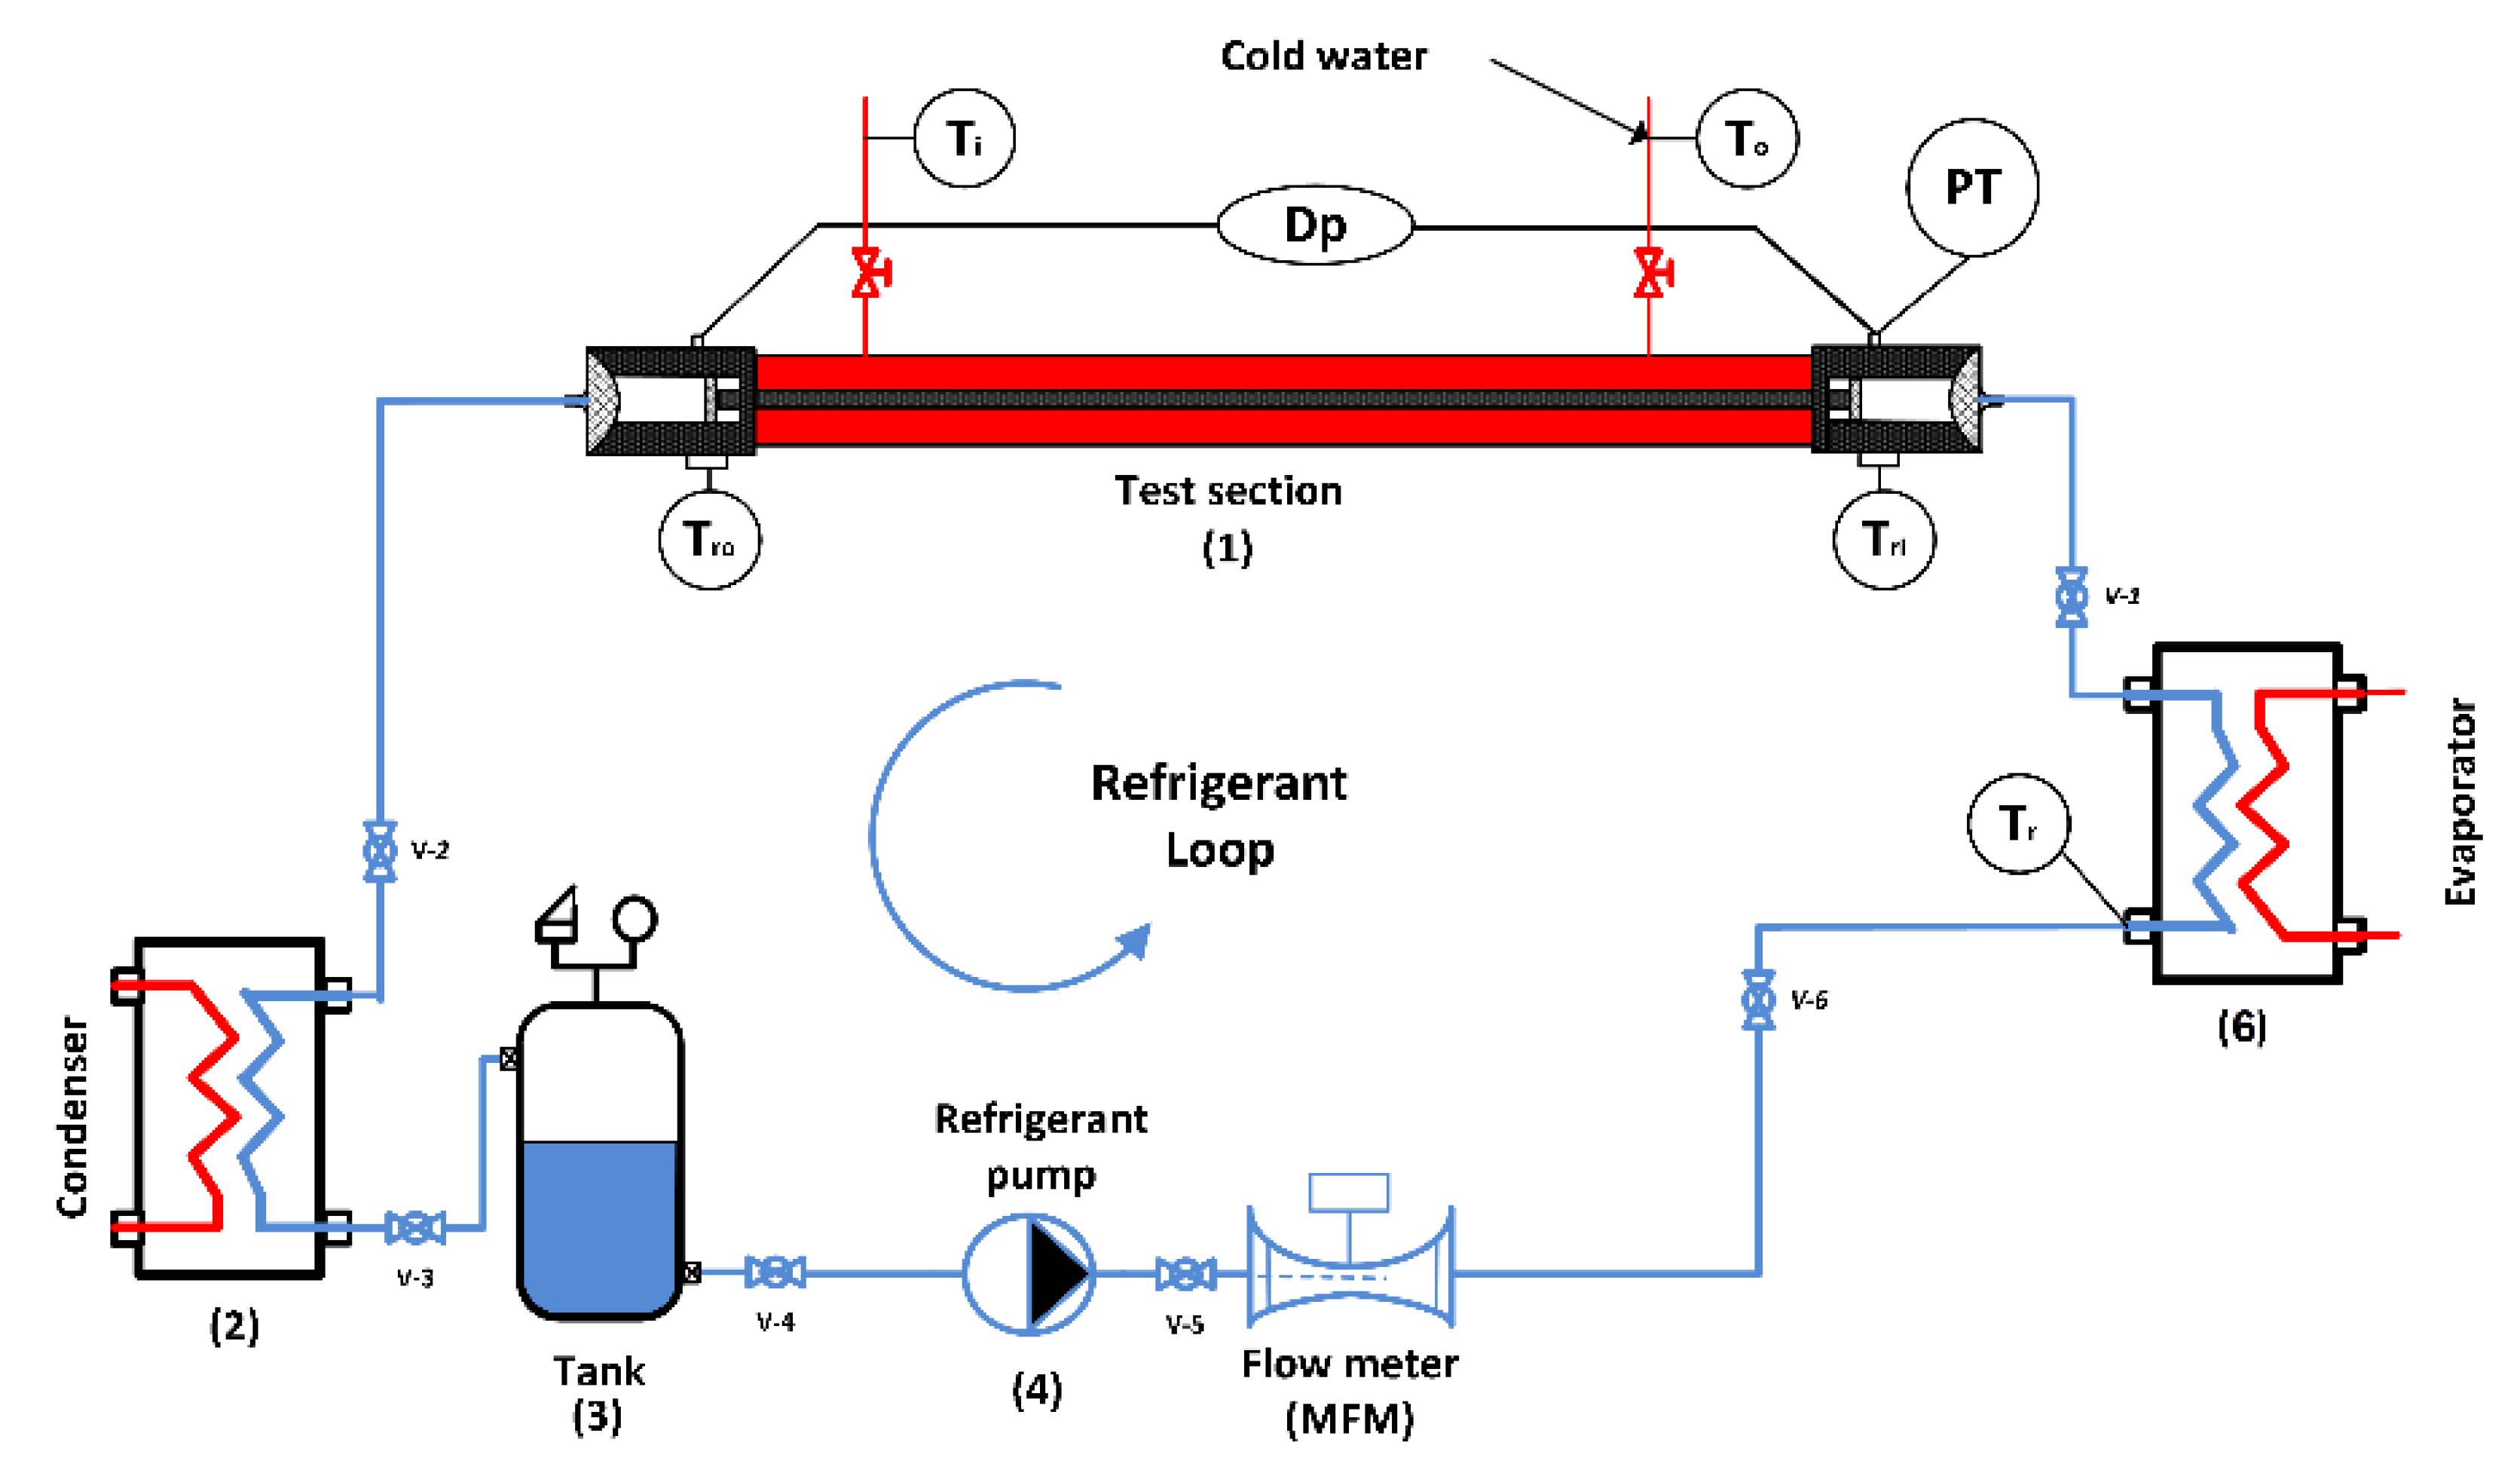
2.2. Description of the Lab Experiment

Figure 2 shows the purpose-built circuit (rig) in the Experimental Installation of the Technical University of Cartagena, Spain. This facility allows to record diabatic and adiabatic frictional pressure drop of single and phase change flows within minichannels. The rig allows us to control the most influencing variables in the range that is typically used in refrigeration systems such as saturation pressure, mass velocity, vapour quality at the entrance of the test section and the geometry of the test section.
The experimental installation has four different control loops to regulate the thermofluid dynamic conditions of the refrigerant under study at the entrance of the test section. The refrigerant flows through the main loop (refrigerant loop) using a gear pump. The pump impulses the refrigerant to a plate heat exchanger that acts as a boiler after measuring its mass flow rate in a Coriolis effect mass flow meter. In the boiler, the fluid evaporates up to the desired value of vapour quality fixed in the test tanks to a stream of hot water which is not depicted in the sketch. Once the fluid presents the desired vapour quality, it is introduced into the test section. The test section is a counter current condenser, whose cold side is fed with cold water in order to totally or partially condensate the refrigerant. After the test section, the biphasic mixture is introduced into a second plate heat exchanger to decrease its energy a bit more, before returning it into the main vessel in which the refrigerant is contained. By controlling the power exchanged in the second plate heat exchanger that acts as a condenser, the pressure of the system is regulated. The mass velocity is controlled by the rotating speed of the gear pump.
In the test section, several parameters are recorded to be able to compute the frictional pressure drop and the heat transfer coefficient. The accuracy of the different measuring devices installed is provided in Table 2.
The test section is a mini channel with a length of 306 mm. It has two adiabatic sectors of 24 mm at the entrance and at the discharge that are used for hydraulic connections with the test rig. Two different mini channels port shapes were tested. The detailed information about their characteristics is presented in Table 3.
“Dp” represents the pressure drop in the minichannels tube between in and out that must be minimized. The heat transfer coefficient must be maximized. Since there is no sensor to directly record the heat transfer coefficient, it must be computed from the thermal power managed in the test section, which is computed from water side by means of the water temperature increase, (To–Ti); the water volumetric flow and the local wall temperature profiles are recorded with thermocouples. Further details about the experimental setup, computation proceedings and uncertainty calculation can be found in [21,22,23]. Since the main variables, pressure drop and heat transfer coefficient show opposite behaviours, there must be a compromise between them.
To make the issue more complex, it needs to be considered that both variables are why, even when the values from tests for each variable are computed separately, they must be investigated jointly because their relationship, that is, there exists a certain mutual dependency between pressure drop and heat transfer.

2.3. Input Variables

Since the experimental test rig is designed to study condensation processes, all the data presented in this article refer to the condenser.
Some of the variables in Table 4 were directly measured, such as saturation pressure, pressure drop, flow mass, flow area and tube diameter or tube roughness. Others, such as flow speed of the thermofluidic properties in the test section, were derived from the previous measurements. To calculate the fluid properties, the authors used the Refprop 10® database [24]. The variables considered for the optimization of pressure drop, coupled with heat transfer coefficient, are presented in Table 4 and Table 5.

2.4. Data Collection

A large dataset was obtained (step 1.4 in the flowsheet) by the performance of 2543 tests in the lab, from which 1234 tests corresponded to pressure drop and 1309 to heat transfer.

Refining Data Collection

It would have been desirable to undertake this study using the complete set of tests; however, their elevated number is the reason why, in step 2.1, this dataset is a random selection.

2.5. SIMUS: A MCDM Method

As it was explained, pressure drop and heat transfer are opposite output variables and, consequently, to contemplate these opposite conditions, an equilibrium condition or a compromise solution needs to be found. For this complex scenario, it was needed to resort to a sophisticated procedure, such as multi-criteria decision making (MCDM), which has many different methods to tackle the problem. Among these and, due to the complexity of this case study, the SIMUS method [25] was selected due to its robustness and low computational cost. Another reason for selecting this method lies in the fact that it works with objective and reliable data, without weights or assumptions, as it was in this case, avoiding any personal intervention which could imply subjectivities affecting the results.
SIMUS has been applied in many projects dealing with real problems in more than 20 countries. The method is thoroughly explained in [17,25]. SIMUS has also been written in Java and Python and is one of the methods selected by the Institute of Intelligent Cybernetic Systems (IICS), Obninsk, Moscow University.
Other real examples of its use may be found in:
-
Bulgarian Railways: complex railway scenario including a rail network involving 10 Eastern European [26];
-
Assessment of the best source of energy for irrigation in Central Spain [27];
-
Ministry of the Environment, Canada: determination of environment indicators [28];

Application of SIMUS to the Dataset

Based on the tests performed in the lab, a large matrix, which needed 99,177 values (2543 × 39), as obtained and this is the reason why we had to work with a random sample to highlight which, out of the 39 variables, best represents the pressure drop and heat transference results (see Table 6).
The same procedure was followed for the heat exchange matrix.
In the next step, both matrices are considered side by side and analyzed using the SIMUS method. This joint consideration of both variables is mandatory, since all 39 variables are somehow related, and this is another reason by which this method is considered. Consequently, the result will reflect the relationship between the two variables, pressure drop and heat exchange.
The 1234 tests for pressure drop and the 1309 tests for heat transfer are performed in the rig separately and the pressure drop and the heat transfer values for each configuration saved (step #5 in the flowsheet). This provides us a data bank for both objectives, using objective values.
Using the two sample matrices combined, the SIMUS method was applied to determine which, out of the 39 variables, were the most important and also to what extent was each one important.
Naturally, this matrix has a collection of different units, such as pressure measured in Pa, flow in kg/s, hydraulic diameter in m, average densities in kg/m3, dynamic viscosity in Pa-s, etc.; consequently, the data must be normalized before processing. For this aim, the Euclidean normalization formula was applied, but any other can be utilized.

3. Results

As a result of the application of the methodology and with the values normalized, the following seven key variables were selected, as depicted in Table 7.
The parameter “Hydraulic diameter” is repeated but with a different label (29 and 5). This is because this parameter directly influences both processes, pressure drop and heat transfer. Therefore, it is important to consider “Hydraulic diameter” as an independent variable for each process and also to consider the double influence.
This ranking was extracted from the SIMUS final report, as shown on Figure 3.
The result shows that the most significative input variable is number 1 (saturation pressure of vapor entering the condenser), with a high score of 5.91, which is far greater than the second best, which is number 29 (flow speed), with a score of 0.23.
Consequently, it appears that using this very reduced sample, it yields results that are compatible with the real system, which is indeed very encouraging and, thus, makes it perhaps unnecessary to work with huge matrices.

Sensitivity Analysis

According to the proposed methodology, a sensitivity analysis (Step 4.1) is performed to find out the robustness of the solution. Out of the 15 tests, we determined the 10 which produce the least pressure drop.
They form two matrices that are combined and will be used to evaluate the most important variable, out of the seven determined in step 3. Thus, this matrix combines the tests that produced the least pressure drop, with the tests that produce the maximum heat transfer.
The results are shown in Figure 4, the best solution being the “saturation Pressure of the fluid entering the condenser”.
Consequently, variable “saturation pressure of superheated vapour entering the condenser” is the variable with the highest influence out of the 37 variables and the only one that simultaneously affects both the pressure drop and the heat transfer. It simultaneously satisfies nine tests where both conditions are considered jointly, while the last test is not satisfied.
This result appears coincident with physical observations, when considering that the selected variable has values hundreds or even thousands of times higher that the rest of variables.
Even with normalization, this difference is not altered and it suggests that small variations in the values of this variable will have effects on both the pressure drop and the heat exchange, while changes, even large, in the other variables will probably have no effect.
The marginal values of the tests, given also by SIMUS, indicate that the best test is the duple 556/337. Consequently, the values assigned to the 37 variables in the test are the best.

4. Discussion

According to the SIMUS method, the most influential variable is the saturation pressure, with a score of 5.91; far behind, the second most influencing variable is hydraulic diameter, with a score of 0.26. This is followed by the frictional pressure drop, which appears with a score 0.25, the vapour quality variation with 0.23, mass flow with 0.08 and, finally, the average vapour phase density with a score of 0.05.
In addition, it is known that the saturation pressure is the most influencing variable since all thermofluidic properties such as density, viscosity or thermal conductivity, among others, are quite affected by it. It also impacts the shape of the saturation diagram of each substance.
Small variations in saturation pressure lead to different fluid properties and, consequently, to different Reynolds and Prandtl numbers, resulting in different friction factors and heat transfer coefficients. This agrees with literature predicting models, since all of them require the saturation pressure as an input variable to compute fluid properties.
Regarding the second most influencing variable, the hydraulic diameter, it is always considered in physical and empirical models for predictions. The Friedel [29] model calculates the wall-friction force by means of a liquid only friction factor which is computed as if the whole flow were liquid phase. Either the hydraulic diameter or the Reynolds number appear in predicting methods because they consider the relative importance of shear stress when it decreases. The significance of this stress is crucial in minichannels since they affect the flow pattern and, therefore, the heat transfer coefficient and also the pressure drop.
Pressure drop appears in the third position. Since the fluid properties are strongly affected by saturation pressure, if the pressure along the test section changes drastically between the entrance and exit sections, the fluid properties also vary drastically. The only way to consider the alteration of fluid properties according to saturation conditions is considering the variation of pressure in the test section. As previously said, if the saturation pressure is different between the entrance and the exit sections, the fluid properties will also be different between these sections affecting the heat transfer coefficient.
Mass flow is also an important value in frictional pressure drop and heat transfer coefficient since it has a direct influence in both cases. Frictional pressure drop increase is related with increments in mass flow rates and something similar happens with the heat transfer coefficient which rises with increasing values of mass flow rates. Therefore, it is logical that this variable appears in the SIMUS results because it affects equally both variables. In addition, the mass flow is always considered in predicting models for pressure drop or heat transfer coefficient calculation.
Finally, the average vapour phase density appears in the results. Since the optimization problem deals with a phase change situation even at very low vapour qualities, the void fraction implies that most of the tube volume is occupied by vapour phase; thus, it is reasonable the appearance of this variable. The main flow patterns in minichannels are both annular and intermittent. Both of these flow patterns show the highest heat transfer coefficients since the small liquid quantity is confined to the walls. The liquid in the walls is in the form of a thin liquid film, while the gas core occupies most of the volume in the case of annular flow. In the intermittent flow, the behaviour is quite similar, where the liquid film collapses, generating a liquid bridge between large gas core bubbles.

5. Conclusions

  • The authors present a case in which MCDM methods are applied to a phase change thermofluid dynamic problem, obtaining similar results to the experimental tests and align with the physical theory of the problem.
  • SIMUS can allow the user to obtain interesting conclusions, decreasing the effort needed to make experimental tests and even to optimize the experimental measuring campaign. This is possible because it allows users to identify the most influencing variables in the problem analyzed. In this case, the method offers interesting information regarding the optimal operating point in heat exchangers working with different refrigerant fluids. This optimal point involves the minimization of energy consumption and, therefore, the minimization of greenhouse gas emissions.
  • Additionally, the SIMUS results match with other experimental studies about phase change, heat transfer and pressure drop problems. SIMUS points out the same influencing variables as in experimental studies dealing with frictional pressure drop and heat transfer coefficient estimation. This fact is very important since this technique allows us to reduce the number of thermofluid-dynamic variables that must be considered in predicting correlations and it can even improve existing predicting models discarding low influencing variables.
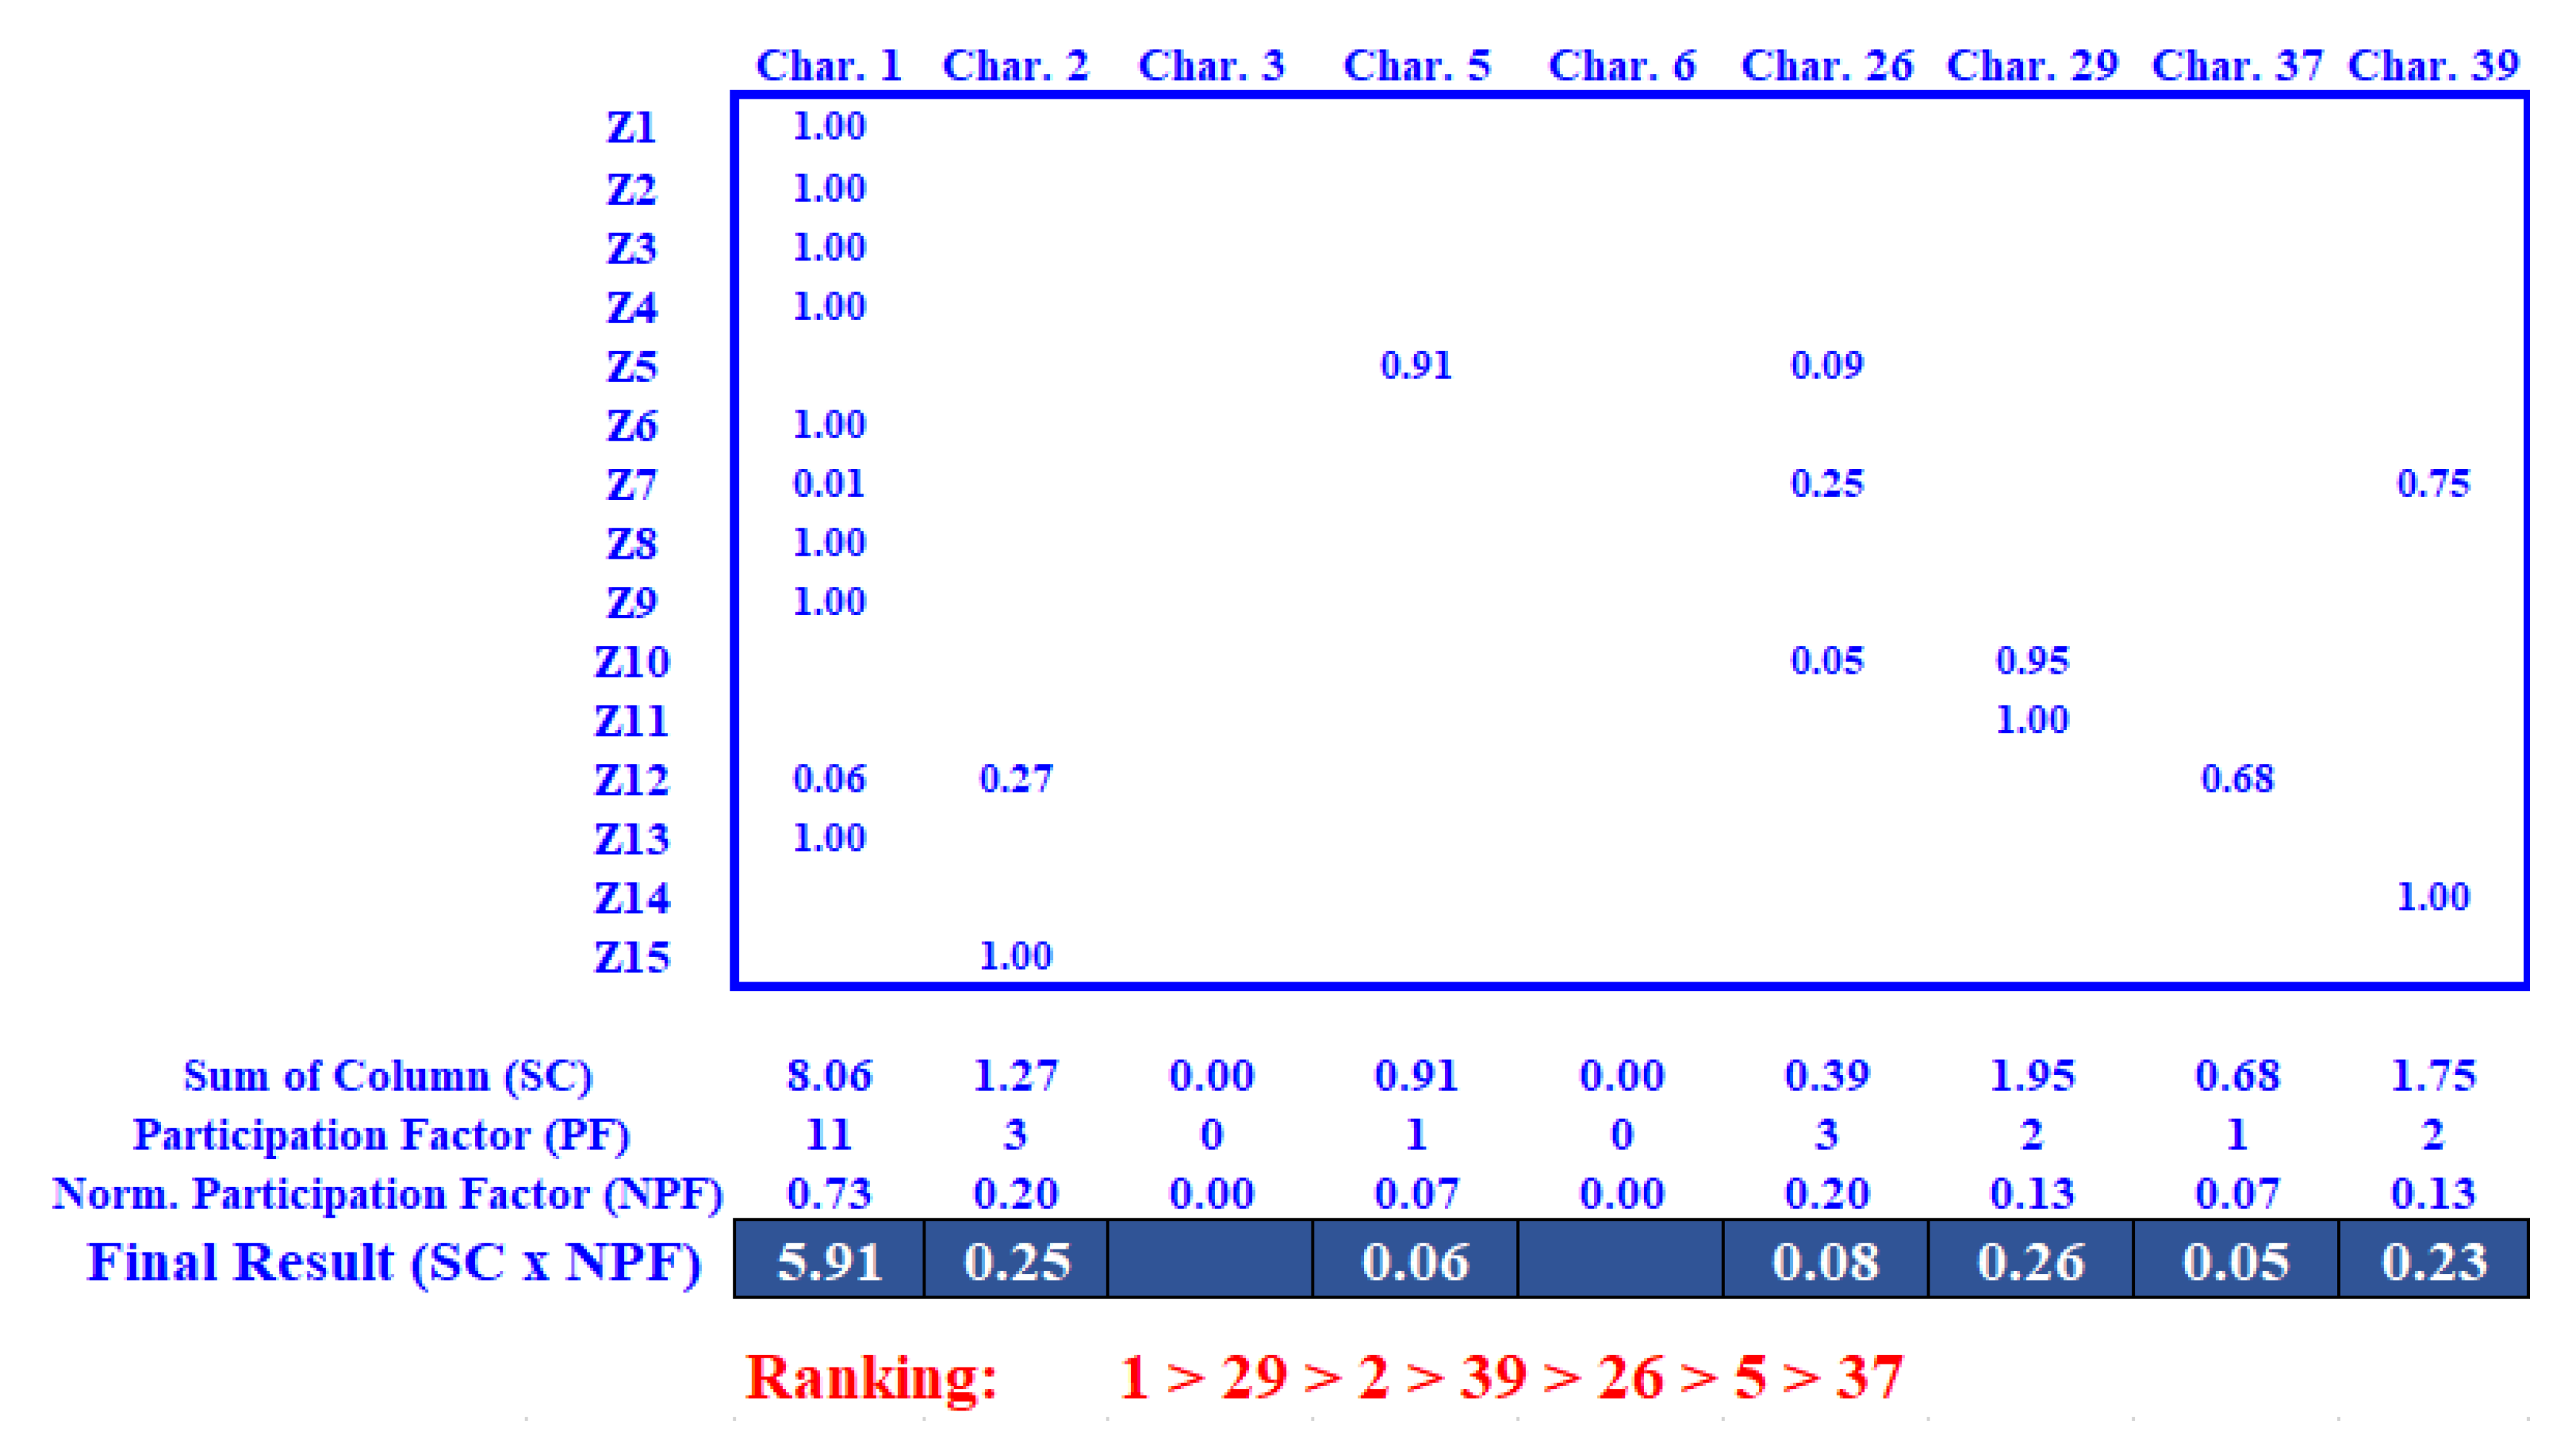
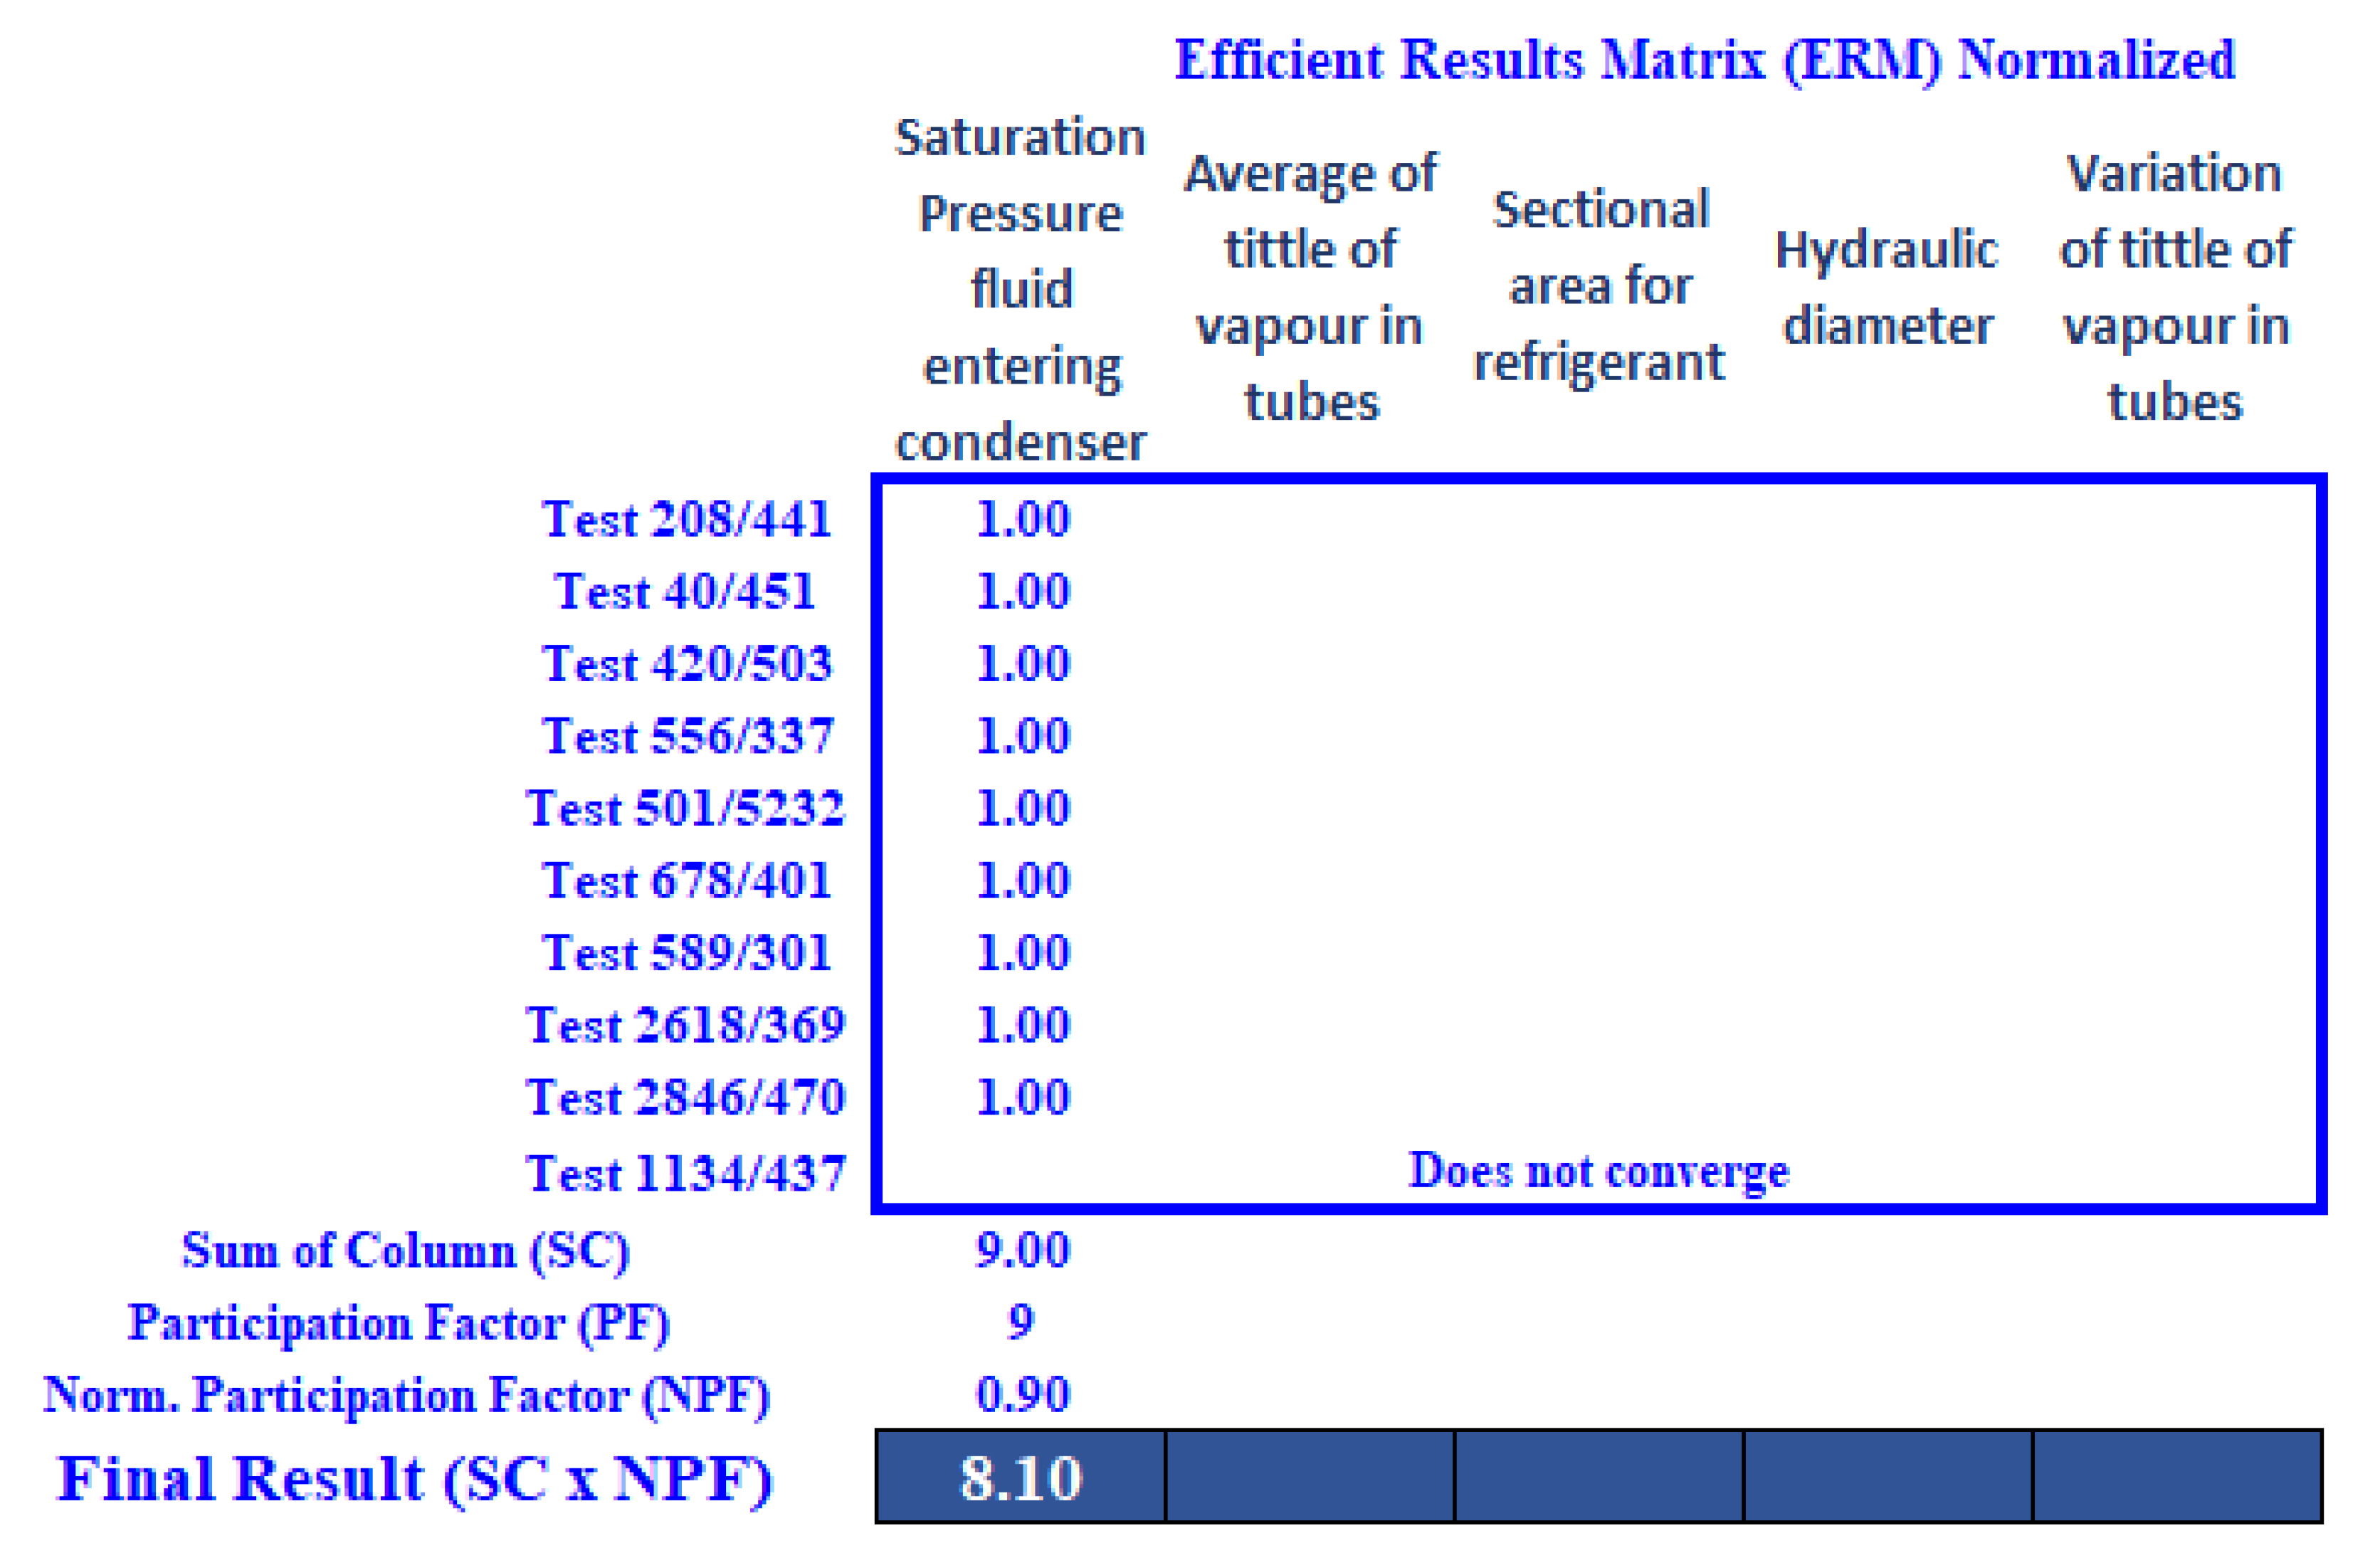
  • The variable “saturation pressure of superheated vapour entering the condenser” is the variable with the highest influence out of the 37 variables analysed. This result is consistent with what is expected from a thermodynamic point of view because saturation pressure is the only one that simultaneously affects both pressure drop and heat transfer coefficient. Consequently, a good adjustment of the saturation pressure in phase change heat exchangers leads to a reduction in the pressure drop and to optimized heat transfer in both processes, evaporation and condensation.
    An important conclusion to be drawn from this numerical study is the low influence of the type of refrigerant used. Surely, this fact is due to the refrigerants used for these tests campaign and for the comparison between them, all of them are refrigerant proposed for the replacement of the currently used HFCs by other HFOs or Natural HC as propane. Therefore, it follows that these new refrigerants are valid for replacement, from a thermodynamic point of view.
  • With the new refrigerants as R1234yf, R290, R32 and R410a, it is possible to optimize and even characterize their working in refrigeration equipment in the same way as it has been done up to now with current refrigerants as R134a. Furthermore, considering that these new refrigerants have much lower GWP and ODP values, their use will have benefits on this matter.

Author Contributions

Conceptualization, F.V.-G. and E.H.; methodology, N.M. and A.L.-B.; software, N.M.; validation, A.L.-B., E.H. and N.M.; formal analysis, F.V.-G.; investigation, A.L.-B., F.V.-G. and E.H.; resources, N.M. and A.L.-B.; data curation, A.L.-B. and E.H.; writing—original draft preparation, A.L.-B., E.H. and N.M.; writing—review and editing, F.V.-G.; visualization, F.V.-G.; supervision, F.V.-G.; project administration, F.V.-G.; funding acquisition, E.H. and F.V.-G. All authors have read and agreed to the published version of the manuscript.

Funding

No external founding have been used for this research.

Institutional Review Board Statement

Not applicable.

Informed Consent Statement

Informed consent was obtained from all subjects involved in the study.

Data Availability Statement

Not applicable.

Acknowledgments

Eloy Hontoria is grateful to Project RTI2018-099139-B-C21 financed by FEDER/Ministerio de Ciencia e Innovación-Agencia Estatal de Investigación.

Conflicts of Interest

The authors declare no conflict of interest.

References

  1. Directive 2010/31/EU of the European Parliament and of the Council of 19 May 2010 on the Energy Performance of Buildings. Off. J. Eur. Union 2010. Available online: https://eur-lex.europa.eu/LexUriServ/LexUriServ.do?uri=OJ:L:2010:153:0013:0035:en:PDF (accessed on 7 April 2021).
  2. Laustsen, M.J. Energy Efficiency Requirements in Building Codes, Energy Efficiency Policies for New Buildings. IEA Information Paper; International Energy Agency: Paris, France, 2008. [Google Scholar]
  3. Hepbasli, A. LOW Exergy (LowEx) Heating and Cooling Systems for Sustainable Buildings and Societies. Renew. Sustain. Energy Rev. 2012, 16, 73–104. [Google Scholar] [CrossRef]
  4. Kharseh, M.; Altorkmany, L.; Al-Khawaj, M.; Hassani, F. Warming Impact on Energy Use of HVAC System in Buildings of Different Thermal Qualities and in Different Climates. Energy Convers. Manag. 2014, 81, 106–111. [Google Scholar] [CrossRef]
  5. Poggi, F.; Macchi-Tejeda, H.; Leducq, D.; Bontemps, A. Refrigerant Charge in Refrigerating Systems and Strategies of Charge Reduction. Int. J. Refrig. 2008, 31, 353–370. [Google Scholar] [CrossRef]
  6. Asadi, M.; Xie, G.; Sunden, B. A Review of Heat Transfer and Pressure Drop Characteristics of Single and Two-phase Microchannels. Int. J. Heat Mass Transf. 2014, 79, 34–53. [Google Scholar] [CrossRef]
  7. Dalkılıç, A.S.; Çebi, A.; Celen, A.; Awad, M.M.; Wongwises, S. Evaluation of the Performance of the Empirical Correlations Used to Predict R134a’s Boiling Frictional Pressure Drop Inside Smooth and Corrugated Tubes. Int. Commun. Heat Mass Transf. 2017, 81, 8–18. [Google Scholar] [CrossRef]
  8. Kaew-On, J.; Wongwises, S. New Proposed Two-phase Multiplier and Evaporation Heat Transfer Coefficient Correlations for R134a Flowing at Low Mass Flux in a Multiport Minichannel. Int. Commun. Heat Mass Transf. 2012, 39, 853–860. [Google Scholar] [CrossRef]
  9. Wang, G.; Cheng, P. An Experimental Study of Flow Boiling Instability in a Single Microchannel. Int. Commun. Heat Mass Transf. 2008, 35, 1229–1234. [Google Scholar] [CrossRef]
  10. Li, S.; Zhao, Z.; Zhang, Y.; Xu, H.; Zeng, W. Experimental and Numerical Analysis of Condensation Heat Transfer and Pressure Drop of Refrigerant R22 in Minichannels of a Printed Circuit Heat Exchanger. Energies 2020, 13, 6589. [Google Scholar] [CrossRef]
  11. Piasecka, M.; Maciejewska, B.; Łabędzki, P. Heat Transfer Coefficient Determination during FC-72 Flow in a Minichannel Heat Sink Using the Trefftz Functions and ADINA Software. Energies 2020, 13, 6647. [Google Scholar] [CrossRef]
  12. Grabowski, M.; Hożejowska, S.; Maciejewska, B.; Płaczkowski, K.; Poniewski, M.E. Application of the 2-D Trefftz Method for Identification of Flow Boiling Heat Transfer Coefficient in a Rectangular MiniChannel. Energies 2020, 13, 3973. [Google Scholar] [CrossRef]
  13. Kandlikar, S.G.; Grande, W.J. Evolution of Microchannel Flow Passages-thermohydraulic Performance and Fabrication Technology. Heat Transf. Eng. 2003, 24, 3–17. [Google Scholar] [CrossRef]
  14. Fernando, P.; Palm, B.; Lundqvist, P.; Granryd, E. Propane Heat Pump with Low Refrigerant Charge: Design and Laboratory tests. Int. J. Refrig. 2004, 27, 761–773. [Google Scholar] [CrossRef]
  15. The Science of Climate Change: Summary for Policymakers. In Climate Change 1995, Technical Summary of the Working Group I Report; Cambridge University Press: Cambridge, UK, 1995; p. 22.
  16. Hu, J.; Wan, D.; Li, C.; Zhang, J.; Yi, X. Forecast of Consumption and Emission of HFC-134a Used in the Mobile Air-conditioner Sector in China. Adv. Clim. Chang. Res. 2010, 1, 20–26. [Google Scholar] [CrossRef]
  17. Munier, N. A Strategy for Using Multicriteria Analysis in Decision Making: A Guide for Simple and Complex Environmental Projects; Springer: Amsterdam, The Netherlands, 2011. [Google Scholar] [CrossRef]
  18. López-Belchí, A.; Illán-Gómez, F.; Cano-Izquierdo, J.M.; García-Cascales, J.R. GMDH ANN to Optimise Model Development: Prediction of the Pressure Drop and the Heat Transfer Coefficient during Condensation within Mini-channels. Appl. Therm. Eng. 2018, 144, 321–330. [Google Scholar] [CrossRef]
  19. García-Cascales, J.R.; Vera-García, F.; Corberán-Salvador, J.M.; Gonzálvez-Maciá, J.; Fuentes-Díaz, D. Assessment of Boiling Heat Transfer Correlations in the Modelling of Fin and Tube Heat Exchangers. Int. J. Refrig. 2007, 30, 1004–1017. [Google Scholar] [CrossRef]
  20. López-Belchí, A.; Illán-Gómez, F.; García-Cascales, J.R.; Vera-García, F. Heat Transfer Coefficient during Condensation Inside a Minichannel Multiport Tube with R32 and R410A as Working Fluids. Sci. Technol. Built Environ. 2015, 21, 535–544. [Google Scholar] [CrossRef]
  21. López-Belchí, A.; Illán-Gómez, F.; Vera-García, F.; García-Cascales, J.R. Experimental Condensing Two-phase Frictional Pressure Drop Inside Mini-channels. Comparisons and New Model Development. Int. J. Heat Mass Transf. 2014, 75, 581–591. [Google Scholar] [CrossRef]
  22. Ramírez-Rivera, F.; López-Belchí, A.; Vera-García, F.; García-Cascales, J.R.; Illán-Gómez, F. Two Phase Flow Pressure Drop in Multiport Mini-channel Tubes Using R134a and R32 as Working Fluids. Int. J. Therm. Sci. 2015, 92, 17–33. [Google Scholar] [CrossRef]
  23. López-Belchí, A.; Illán-Gómez, F.; García-Cascales, J.R.; Vera-García, F. R32 and R410A Condensation Heat Transfer Coefficient and Pressure Drop within Minichannel Multiport Tube. Experimental Technique and Measurements. Ap. Therm. Eng. 2016, 105, 118–131. [Google Scholar] [CrossRef]
  24. Lemmon, E.W.; Bell, I.H.; Huber, M.L.; McLinden, M.O. NIST Standard Reference Database 23: Reference Fluid Thermodynamic and Transport Properties-REFPROP, Version 10.0; National Institute of Standards and Technology: Gaithersburg, MD, USA, 2018. [Google Scholar]
  25. Munier, N.; Hontoria, E.; Jiménez-Sáez, F. Strategic Approach in Multi-Criteria Decision Making: A Practical Guide for Complex Scenarios; Springer International Publishing: Chem, Switzerland, 2019. [Google Scholar] [CrossRef]
  26. Stoilova, S.; Munier, N.; Kendra, M.; Skrúcaný, T. Multi-criteria Evaluation of Railway Network Performance in Countries of the TEN-T Orient-east Med Corridor. Sustainability 2020, 12, 1482. [Google Scholar] [CrossRef] [Green Version]
  27. Garcia-Cascales, M.S.; Molina-Garcia, A.; Sanchez-Lozano, J.M.; Rubio-Aliaga, A.; Munier, N. Assessment of Groundwater Pumping Alternatives for Irrigation Purposes based on the SIMUS Method. In Proceedings of the 2020 IEEE International Conference on Environment and Electrical Engineering and 2020 IEEE Industrial and Commercial Power Systems Europe, EEEIC / I and CPS Europe, Madrid, Spain, 9–12 June 2020. [Google Scholar]
  28. Munier, N. Methodology to Select a Set of Urban Sustainability Indicators to Measure the State of the City, and Performance Assessment. Ecol. Indic. 2011, 11, 1020–1026. [Google Scholar] [CrossRef]
  29. Friedel, L. Improved Friction Pressure Drop Correlation for Horizontal and Vertical Two- phase Pipe Flow. Proc. Eur. Two-Phase Flow Group Meet. 1979, E2. [Google Scholar]
Figure 1. Methodology to determine the most critical input variables.
Energies 14 02069 g001
Figure 2. Experimental rig (Reproduced with kind permission of López-Belchí et al., 2014 [21]).
Energies 14 02069 g002
Figure 3. Screenshot from SIMUS with results.
Energies 14 02069 g003
Figure 4. Screenshot from SIMUS.
Energies 14 02069 g004
Table 1. Characteristics of tested refrigerants.
CharacteristicsR134aR1234yfR290R32R410A
TypeHFCHFONaturalHFCHFC
CompositionPurePurePurePureR32/R125
ODP00000
GWP1430436752088
ASHRAE Safety ClassA1A2A3A2A1
Critical Temperature (°C)10195977871
Critical Pressure (bar)4134435849
Table 2. Accuracy of measuring instruments.
DeviceTypeMeasuring RangeAccuracy
Absolute pressure transmitterPiezoelectric1–4000 kPa0.04%
Differential pressure transmitterPiezoelectric1–100 kPa0.065%
Resistive temperature detector1/10 DIN−50 to 350 °C0.03 ± 5 × 10⁻⁴ T (°C)
ThermocoupleT Class 1−30 to 125 °C±0.5 (°C)
Mass flow meterCoriolis0–0.03 kg/s0.05%
Table 3. Geometrical characteristics of tubes tested.
Tube GeometryFlow Area (mm2)Outer Perimeter (mm)Inner Perimeter (mm)PortsDh (mm)Ra (μm)Relative Roughness (-)
Triangular10.1640.1757.04170.710.2627.35 × 10−4
Square12.5440.1743.22101.160.2263.89 × 10−4
Table 4. The 24 variables for pressure drop.
Characteristic IDNameUnit
1Saturation pressure entering the tubePa
2Pressure drop due to friction with the tubePa/m
3Flow masskg/s
4Section area for refrigerantm2
5Flow speedkg/m2s
6Hydraulic diameterm
7Tube roughness
8Tube geometry
9Refrigerant type
10Title of vapor measured in tube
11Dynamic viscosity liquid phasePa-s
12Dynamic viscosity vapor phasePa-s
13Average density liquid phasekg/m3
14Average density vapor phasekg/m3
15Title of vapor at entrance
16Title of vapor at exit
17Dynamic viscosity of liquid phase at entrancePa-s
18Dynamic viscosity of liquid phase at exitPa-s
19Dynamic viscosity of vapor phase at entrancePa-s
20Dynamic viscosity of liquid phase at exitPa-s
21Density of liquid phase at entrancekg/m3
22Density of liquid phase at existkg/m3
23Density of vapor phase at entrancekg/m3
24Density of liquid phase at exitkg/m3
Table 5. The 15 variables for heat transfer.
Characteristic IDNameUnit
25Average saturation pressure in tunePa
26Mass flowkg/s
27Section area for refrigerantm2
28Flow speedkg/s
29Hydraulic diameter.M
30Average title of vapor in tube
31Tube roughness
32Tube geometry
33Refrigerant type
34Average viscosity of liquid phasePa-s
35Average saturation pressure in tubePa
36Average density of liquid phasekg/m3
37Average density of vapor phasekg/m3
38Heat transfer coefficientW/m2
39Title variation of vapor in tube
Table 6. A sample of pressure drop results from tests.
Variable Name
Test
Number
Saturation PressurePressure DropMass
Flow
Tube
Section
Flow
Velocity
Hydraulic
Diameter
Tube
Roughness
6471.02E + 064.68E + 045.93E − 031.25E − 054.73E + 021.16E − 033.89E − 04
11671.15E + 062.61E + 043.60E − 031.02E − 053.54E + 027.15E − 047.33E − 04
402.14E + 063.06E + 041.04E − 021.25E − 058.27E + 021.16E − 033.89E − 04
Table 7. The 7 key variables for heat transfer and pressure drop.
VariableName
1Saturation pressure entering the tube
29Hydraulic diameter
2Pressure drop due to friction in the tube
39Title variation of vapor in tube
26Mass flow
5Hydraulic diameter
37Average density of vapor phase
Publisher’s Note: MDPI stays neutral with regard to jurisdictional claims in published maps and institutional affiliations.

