
Towards Understanding Interactions between Sustainable Development Goals: The Role of Climate-Well-Being Linkages. Experiences of EU Countries


Abstract
1. Introduction
1.1. Climate and Wellbeing
1.2. The Energy-Climate-Wellbeing
1.3. Conceptual Framework
2. Materials and Methods
2.1. Materials
- Life expectancy at birth by sex (years).
- Share of people with good or very good perceived health by sex (% of population aged 16 or over).
- Smoking prevalence by sex (% of population aged 15 or over).
- Standardized death rate due to tuberculosis, HIV and hepatitis by type of disease number (per 100,000 persons).
- Standardized preventable and treatable mortality number (per 100,000 persons aged less than 75 years).
- Self-reported unmet need for medical examination and care by sex (% of population aged 16 and over).
- Obesity rate by body mass index (BMI) (% of population aged 18 or over).
- People killed in accidents at work, by sex (number per 100,000 employees).
- Population living in households considering that they suffer from noise, by poverty status (% of population).
- People killed in road accidents (per 100,000 persons).
- Exposure to air pollution by particulate matter (µg/m3).
- Greenhouse gas emissions (tons per capita).
- Greenhouse gas emissions intensity of energy consumption (index 2000 = 100).
- Mean near-surface temperature deviation (degree Celsius).
- Climate related economic losses by type of event—EU aggregate (million EUR and EUR per capita in current prices).
- Contribution to the international 100bn USD commitment on climate related expending (million EUR in current prices).
- Population covered by the Covenant of Mayors for Climate & Energy signatories (% of population).
- Share of renewable energy in gross final energy consumption by sector (%).
- Average CO2 emissions per km from new passenger cars (g CO2 per km).
- Global mean ocean Surface acidity.
2.2. Methods
- Selecting of simple features—important from the point of view of the studied phenomenon, measuring them for the tested objects and preparing a final list of features by removing features with low variability and features overly correlated with others;
- Determining the direction of preferences of simple features in relations to the general criterion under consideration and normalizing the values of variables for objects;
- Choosing the appropriate aggregation method and determining the value of a synthetic development measure for each object;
- Construction of the object ranking;
- Recognition of developmental types, substantive assessment and interpretation of obtained results.
3. Results
4. Discussion
5. Conclusions
Author Contributions
Funding
Conflicts of Interest
References
- United Nations Sustainable Development Goals. 2016. Available online: https://sustainabledevelopment.un.org/ (accessed on 26 January 2020).
- Nerini, F.F.; Tomei, J.; To, L.S.; Bisaga, I.; Parikh, P.; Black, M.; Borrion, A.; Spataru, C.; Broto, V.C.; Anandarajah, G.; et al. Mapping synergies and trade-offs between energy and the Sustainable Development Goals. Nat. Energy 2018, 3, 10–15. [Google Scholar] [CrossRef]
- Kroll, C.; Warchold, A.; Pradhan, P. Sustainable Development Goals (SDGs): Are we successful in turning trade-offs into synergies? Palgrave Commun. 2019, 5, 1–11. [Google Scholar] [CrossRef]
- Alcamo, J.; Grundy, C.; Scharlemann, J. Interactions among the Sustainable Development Goals, and Why They Are Important. SSRP (Sussex Sustainability Research Programme); University of Sussex and Institute of Development Studies: Brighton, UK, 2020. [Google Scholar]
- Gong, X.; Liu, Y.; Sun, T. Evaluating Climate Change Governance Using the Polity–Policy–Politics, Framework: A Comparative Study of China and the United States. Sustainability 2020, 12, 6403. [Google Scholar] [CrossRef]
- Albright, K.; Shah, P.; Santodomingo, M.; Scandlyn, J. Dissemination of Information About Climate Change by State and Local Public Health Departments: United States, 2019–2020. Am. J. Public Health 2020, 110, 1184–1190. [Google Scholar] [CrossRef]
- World Health Organization. Climate Change and Human Health-Risks and Responses. Available online: https://www.who.int/globalchange/summary/en/index2.html (accessed on 26 January 2020).
- European Commission. The Macroeconomic and Other Benefits of Energy Efficiency; European Union: Brussels, Belgium, 2016; Available online: https://ec.europa.eu/energy/sites/ener/files/documents/final_report_v4_final.pdf (accessed on 26 January 2020).
- Dawes, J.H. Are the Sustainable Development Goals self-consistent and mutually achievable? Sustain. Dev. 2020, 28, 101–117. [Google Scholar] [CrossRef]
- Campbell, B.M.; Hansen, J.; Rioux, J.; Stirling, C.M.; Twomlow, S.; Wollenberg, E. (Lini) Urgent action to combat climate change and its impacts (SDG 13): Transforming agriculture and food systems. Curr. Opin. Environ. Sustain. 2018, 34, 13–20. [Google Scholar] [CrossRef]
- Markkanen, S.; Anger-Kraavi, A. Social impacts of climate change mitigation policies and their implications for inequality. Clim. Policy 2019, 19, 827–844. [Google Scholar] [CrossRef]
- Boyer, C.J.; Bowen, K.; Murray, V.; Hadley, J.; Hilly, J.J.; Hess, J.J.; Ebi, K.L. Using Implementation Science For Health Adaptation: Opportunities For Pacific Island Countries. Health Aff. 2020, 39, 2160–2167. [Google Scholar] [CrossRef]
- Salas, R.N. Climate action: The best gift for global health. BMJ 2020, 371, m4723. [Google Scholar] [CrossRef] [PubMed]
- Arroyo, F.R.; Miguel, L.J. The Role of Renewable Energies for the Sustainable Energy Governance and Environmental Policies for the Mitigation of Climate Change in Ecuador. Energies 2020, 13, 3883. [Google Scholar] [CrossRef]
- Vermeulen, S.J.; Campbell, B.M.; Ingram, J.S. Climate Change and Food Systems. Annu. Rev. Environ. Resour. 2012, 37, 195–222. [Google Scholar] [CrossRef]
- Galway, L.P.; Beery, T.; Jones-Casey, K.; Tasala, K. Mapping the Solastalgia Literature: A Scoping Review Study. Int. J. Environ. Res. Public Health 2019, 16, 2662. [Google Scholar] [CrossRef]
- Patz, J.A.; Campbell-Lendrum, D.; Holloway, T.; Foley, J.A. Impact of Regional Climate Change on Human Health. Nature 2005, 438, 310–317. [Google Scholar] [CrossRef]
- Hrabok, M.; Delorme, A.; Agyapong, V.I. Threats to Mental Health and Well-Being Associated with Climate Change. J. Anxiety Disord. 2020, 76, 102295. [Google Scholar] [CrossRef] [PubMed]
- Linares, C.; Díaz, J.; Negev, M.; Martínez, G.S.; Debono, R.; Paz, S. Impacts of climate change on the public health of the Mediterranean Basin population—Current situation, projections, preparedness and adaptation. Environ. Res. 2020, 182, 109107. [Google Scholar] [CrossRef] [PubMed]
- Krasna, H.; Czabanowska, K.; Jiang, S.; Khadka, S.; Morita, H.; Kornfeld, J.; Shaman, J. The Future of Careers at the Intersection of Climate Change and Public Health: What Can Job Postings and an Employer Survey Tell Us? Int. J. Environ. Res. Public Health 2020, 17, 1310. [Google Scholar] [CrossRef] [PubMed]
- Fox, M.; Zuidema, C.; Bauman, B.; Burke, T.; Sheehan, M. Integrating Public Health into Climate Change Policy and Planning: State of Practice Update. Int. J. Environ. Res. Public Health 2019, 16, 3232. [Google Scholar] [CrossRef] [PubMed]
- Bai, L.; Yang, J.; Zhang, Y.; Zhao, D.; Su, H. Durational effect of particulate matter air pollution wave on hospital admissions for schizophrenia. Environ. Res. 2020, 187, 109571. [Google Scholar] [CrossRef] [PubMed]
- Onozuka, D.; Gasparrini, A.; Sera, F.; Hashizume, M.; Honda, Y. Future projections of temperature-related excess out-of-hospital cardiac arrest under climate change scenarios in Japan. Sci. Total. Environ. 2019, 682, 333–339. [Google Scholar] [CrossRef]
- Alahmad, B.; Ahmed, F.; Haitham Khraishah, S.; Alseaidan, M.; Gasana, J.; Al-Hemoud, A.; Koutrakis, P.; Fox, M.A. Ex-treme temperatures and mortality in Kuwait: Who is vulnerable? Sci. Total Environ. 2020, 732, e139289. [Google Scholar] [CrossRef] [PubMed]
- Tang, C.; Liu, X.; He, Y.; Gao, J.; Xu, Z.; Duan, J.; Yi, W.; Wei, Q.; Pan, R.; Song, S.; et al. Association between extreme precipitation and ischemic stroke in Hefei, China: Hospitalization risk and disease burden. Sci. Total. Environ. 2020, 732, 139272. [Google Scholar] [CrossRef] [PubMed]
- Yang, L.; Liu, C.; Bi, P.; Vardoulakis, S.; Huang, C. Local actions to health risks of heatwaves and dengue fever under climate change: Strategies and barriers among primary healthcare professionals in southern China. Environ. Res. 2020, 187, 109688. [Google Scholar] [CrossRef] [PubMed]
- World Health Organization. WHO Calls for Urgent Action to Protect Health from Climate Change-Sign the Call. 2015. Available online: http://www.who.int/globalchange/global-campaign/cop21/en/ (accessed on 27 November 2020).
- Garcia, D.M.; Sheehan, M.C. Extreme Weather-driven Disasters and Children’s Health. Int. J. Health Serv. 2015, 46, 79–105. [Google Scholar] [CrossRef] [PubMed]
- Araos, M.; Austin, S.E.; Berrang-Ford, L.; Ford, J.D. Public Health Adaptation to Climate Change in Large Cities. Int. J. Health Serv. 2015, 46, 53–78. [Google Scholar] [CrossRef]
- Watts, N.; Amann, M.; Ayeb-Karlsson, S.; Belesova, K.; Bouley, T.; Boykoff, M.; Byass, P.; Cai, W.; Campbell-Lendrum, D.; Chambers, J.; et al. The Lancet Countdown on Health and Climate Change: From 25 Years of Inaction to a Global Trans-formation for Public Health. Lancet 2018, 391, 581–630. [Google Scholar] [CrossRef]
- Costello, A.; Abbas, M.; Allen, A.; Ball, S.; Bell, S.; Bellamy, R.; Friel, S.; Groce, N.; Johnson, A.; Kett, M.; et al. Managing the health effects of climate change: Lancet and University College London Institute for Global Health Commission. Lancet 2009, 373, 1693–1733. [Google Scholar] [CrossRef]
- McMichael, A.J.; Woodruff, E.R.; Hales, S. Climate change and human health: Present and future risks. Lancet 2006, 367, 859–869. [Google Scholar] [CrossRef]
- McMichael, A. Climate Change and the Health of Nations: Famines, Fevers, and the Fate of Populations; Oxford University Press: Oxford, UK, 2017. [Google Scholar]
- Hayes, K.; Blashki, G.; Wiseman, J.; Burke, S.; Reifels, L. Climate change and mental health: Risks, impacts and priority actions. Int. J. Ment. Health Syst. 2018, 12, 1–12. [Google Scholar] [CrossRef]
- Hayes, K.; Berry, P.; Ebi, K.L. Factors Influencing the Mental Health Consequences of Climate Change in Canada. Int. J. Environ. Res. Public Health 2019, 16, 1583. [Google Scholar] [CrossRef]
- Sheehan, M.C.; Fox, M.A. Early Warnings: The Lessons of COVID-19 for Public Health Climate Preparedness. Int. J. Health Serv. 2020, 50, 264–270. [Google Scholar] [CrossRef]
- Renda, A.; Castro, R.J. Towards Stronger EU Governance of Health Threats after the COVID-19 Pandemic. Eur. J. Risk Regul. 2020, 11, 273–282. [Google Scholar] [CrossRef]
- Climat Risk Disclosure Barometer. 2020. Study Belgium, How are Your Climate Change Disclosures Revealing the True Risks and Opportunities of Your Business? Available online: https://www.ey.com/en_be/climate-related-reporting (accessed on 7 November 2020).
- Ebi, K.L.; Berry, P.; Campbell-Lendrum, D.; Cissé, G.; Hess, J.; Ogden, N.; Schnitter, R. Health System Adaptation to Climate Variability and Change; Global Commission on Adaptation: Rotterdam, The Netherlands, 2019. [Google Scholar]
- Beccari, B. A Comparative Analysis of Disaster Risk, Vulnerability and Resilience Composite Indicators. PLoS Curr. 2016, 8. [Google Scholar] [CrossRef] [PubMed]
- Davis, E.C.; Rossati, A.; Bargiacchi, O.; Garavelli, P.L.; McMichael, A.J.; Juliusson, G. Globalization, Climate Change, and Human Health. N. Engl. J. Med. 2013, 369, 94–96. [Google Scholar] [CrossRef] [PubMed]
- Coccia, M. Factors determining the diffusion of COVID-19 and suggested strategy to prevent future accelerated viral infectivity similar to COVID. Sci. Total. Environ. 2020, 729, 138474. [Google Scholar] [CrossRef] [PubMed]
- Méndez-Arriaga, F. The temperature and regional climate effects on communitarian COVID-19 contagion in Mexico throughout phase 1. Sci. Total. Environ. 2020, 735, 139560. [Google Scholar] [CrossRef] [PubMed]
- Yao, Y.; Pan, J.; Wang, W.; Liu, Z.; Kan, H.; Qiu, Y.; Meng, X.; Wang, W. Association of particulate matter pollution and case fatality rate of COVID-19 in 49 Chinese cities. Sci. Total. Environ. 2020, 741, 140396. [Google Scholar] [CrossRef]
- Zhu, Y.; Xie, J.; Huang, F.; Cao, L. Association between short-term exposure to air pollution and COVID-19 infection: Evidence from China. Sci. Total Environ. 2020, 727, 138704. [Google Scholar] [CrossRef]
- Zoran, M.A.; Savastru, R.S.; Savastru, D.M.; Tautan, M.N. Assessing the relationship between surface levels of PM2.5 and PM10 particulate matter impact on COVID-19 in Milan, Italy. Sci. Total. Environ. 2020, 738, 139825. [Google Scholar] [CrossRef]
- Pramanik, M.; Udmale, P.; Bisht, P.; Chowdhury, K.; Szabo, S.; Pal, I. Climatic factors influence the spread of COVID-19 in Russia. Int. J. Environ. Health Res. 2020, 16, 1–15. [Google Scholar] [CrossRef]
- Coro, G. A global-scale ecological niche model to predict SARS-CoV-2 coronavirus infection rate. Ecol. Model. 2020, 431, e109187. [Google Scholar] [CrossRef]
- Rosario, D.K.A.; Mutz, Y.S.; Bernardes, P.C.; Conte-Junior, C.A. Relationship between COVID-19 and weather: Case study in a tropical country. Int. J. Hyg. Environ. Health 2020, 229, 113587. [Google Scholar] [CrossRef]
- Sobral, M.F.F.; Duarte, G.B.; da Penha Sobral, A.I.G.; Marinho, M.L.M.; de Souza Melo, A. Association between climate variables and global transmission of SARS-CoV-2. Sci. Total Environ. 2020, 729, e138997. [Google Scholar] [CrossRef]
- Ahmadi, M.; Sharifi, A.; Dorosti, S.; Ghoushchi, S.J.; Ghanbari, N. Investigation of effective climatology parameters on COVID-19 outbreak in Iran. Sci. Total. Environ. 2020, 729, 138705. [Google Scholar] [CrossRef]
- Watts, N.; Adger, W.N.; Agnolucci, P.; Blackstock, J.; Byass, P.; Cai, W.; Chaytor, S.; Colbourn, T.; Collins, M.; Cooper, A.; et al. Health and climate change: Policy responses to protect public health. Lancet 2015, 386, 1861–1914. [Google Scholar] [CrossRef]
- Mccollum, D.L.; Krey, V.; Riahi, K. An integrated approach to energy sustainability. Nat. Clim. Chang. 2011, 1, 428–429. [Google Scholar] [CrossRef]
- Knodt, M.; Piefer, N. Conceptualizing Emerging Powers and EU Energy Governance: Towards a Research Agenda. Chall. Eur. Extern. Energy Gov. Emerg. Powers 2016, 49–64. [Google Scholar] [CrossRef]
- Szlávik, J.; Csete, M. Climate and Energy Policy in Hungary. Energies 2012, 5, 494–517. [Google Scholar] [CrossRef]
- Sano, F.; Akimoto, K.; Wada, K. Impacts of different diffusion scenarios for mitigation technology options and of model representations regarding renewables intermittency on evaluations of CO2 emissions reductions. Clim. Chang. 2014, 123, 665–676. [Google Scholar] [CrossRef]
- Bhardwaj, A.; Joshi, M.; Khosla, R.; Dubash, N.K. More priorities, more problems? Decision-making with multiple energy, development and climate objectives. Energy Res. Soc. Sci. 2019, 49, 143–157. [Google Scholar] [CrossRef]
- Kettner, C.; Kletzan-Slamanig, D.; Köppl, A.; Littig, B.; Zielinska, I. A Cross-Country Comparison of Sustainable Energy Development in Selected EU Members. J. Sustain. Res. 2019, 1. [Google Scholar] [CrossRef]
- Santika, W.G.; Anisuzzaman, M.; Bahri, P.A.; Shafiullah, G.; Rupf, G.V.; Urmee, T. From goals to joules: A quantitative approach of interlinkages between energy and the Sustainable Development Goals. Energy Res. Soc. Sci. 2019, 50, 201–214. [Google Scholar] [CrossRef]
- Bertheau, P. Assessing the impact of renewable energy on local development and the Sustainable Development Goals: Insights from a small Philippine island. Technol. Forecast. Soc. Chang. 2020, 153, 119919. [Google Scholar] [CrossRef]
- Wang, C.-N.; Ho, H.-X.T.; Hsueh, M.-H. An Integrated Approach for Estimating the Energy Efficiency of Seventeen Countries. Energies 2017, 10, 1597. [Google Scholar] [CrossRef]
- Urban, F.; Nordensvärd, J. Low Carbon Energy Transitions in the Nordic Countries: Evidence from the Environmental Kuznets Curve. Energies 2018, 11, 2209. [Google Scholar] [CrossRef]
- Hajdukiewicz, A.; Pera, B. International Trade Disputes over Renewable Energy—the Case of the Solar Photovoltaic Sector. Energies 2020, 13, 500. [Google Scholar] [CrossRef]
- Zamasz, K.; Kapłan, R.; Kaszyński, P.; Saługa, P.W. An Analysis of Support Mechanisms for New CHPs: The Case of Poland. Energies 2020, 13, 5635. [Google Scholar] [CrossRef]
- Moriarty, P.; Honnery, D. Feasibility of a 100% Global Renewable Energy System. Energies 2020, 13, 5543. [Google Scholar] [CrossRef]
- Watts, N.; Amann, M.; Ayeb-Karlsson, S.; Belesova, K.; Bouley, T.; Boykoff, M.; Byass, P.; Cai, W. The 2017 Report of the Lancet Countdown: From 25 Years of Inaction to a Global Transformation for Public Health. 2017. Available online: https://www.researchgate.net/publication/320727776_The_2017_report_of_the_Lancet_Countdown_from_25_years_of_inaction_to_a_global_transformation_for_public_health_A_Review_by_The_Lancet (accessed on 4 April 2021).
- Tcvetkov, P. Climate Policy Imbalance in the Energy Sector: Time to Focus on the Value of CO2 Utilization. Energies 2021, 14, 411. [Google Scholar] [CrossRef]
- Gao, M.Z.A.; Fan, C.-T.; Liao, C.-N. Application of German energy transition in Taiwan: A critical review of unique elec-tricity liberalisation as a core strategy to achieve renewable energy growth. Energy Policy 2018, 120, 644–654. [Google Scholar] [CrossRef]
- Wang, C.-N.; Tibo, H.; Duong, D.H. Renewable Energy Utilization Analysis of Highly and Newly Industrialized Countries Using an Undesirable Output Model. Energies 2020, 13, 2629. [Google Scholar] [CrossRef]
- Manowska, A.; Nowrot, A. The Importance of Heat Emission Caused by Global Energy Production in Terms of Climate Impact. Energies 2019, 12, 3069. [Google Scholar] [CrossRef]
- Ziolo, M.; Jednak, S.; Savić, G.; Kragulj, D. Link between Energy Efficiency and Sustainable Economic and Financial Development in OECD Countries. Energies 2020, 13, 5898. [Google Scholar] [CrossRef]
- Kaur, A. Impact of climate change on human health. Int. J. Yogic Hum. Mov. Sports Sci. 2018, 3, 81–83. [Google Scholar]
- Pascaris, A.S.; Pearce, J.M. U.S. Greenhouse Gas Emission Bottlenecks: Prioritization of Targets for Climate Liability. Energies 2020, 13, 3932. [Google Scholar] [CrossRef]
- Intergovernmental Panel on Climate Change. Climate Change 2014: Mitigation of Climate Change. Contribution of Working Group III to the Fifth Assessment Report of the Intergovernmental Panel on Climate Change; Cambridge University Press: Cambridge, UK, 2014. [Google Scholar]
- Hanlon, P.; Carlisle, S. Do we face a third revolution in human history? If so, how will public health respond? J. Public Health 2008, 30, 355–361. [Google Scholar] [CrossRef]
- Keles, R. The Quality of Life and the Environment. Procedia Soc. Behav. Sci. 2012, 35, 23–32. [Google Scholar] [CrossRef][Green Version]
- Salas, R.N.; Jha, A.K. Climate change threatens the achievement of effective universal healthcare. BMJ 2019, 366, 5302. [Google Scholar] [CrossRef] [PubMed]
- Moriarty, P.; Honnery, D. Energy Efficiency or Conservation for Mitigating Climate Change? Energies 2019, 12, 3543. [Google Scholar] [CrossRef]
- Lelieveld, J.; Evans, J.S.; Fnais, M.; Giannadaki, D.; Pozzer, A. The contribution of outdoor air pollution sources to prem-ature mortality on a global scale. Nature 2015, 525, 367–371. [Google Scholar] [CrossRef] [PubMed]
- Scharlemann, J.P.W.; Brock, R.C.; Balfour, N.; Brown, C.; Burgess, N.D.; Guth, M.K.; Ingram, D.J.; Lane, R.; Martin, J.G.C.; Wicander, S.; et al. Towards understanding interactions between Sustainable Development Goals: The role of environment–human linkages. Sustain. Sci. 2020, 15, 1573–1584. [Google Scholar] [CrossRef]
- Pradhan, P.; Costa, L.; Rybski, D.; Lucht, W.; Kropp, J.P. A Systematic Study of Sustainable Development Goal (SDG) Interactions. Earth’s Future 2017, 5, 1169–1179. [Google Scholar] [CrossRef]
- Orchard, S.; Glover, D.; Karki, S.T.; Ayele, S.; Sen, D.; Rathod, R.; Rowhani, P. Exploring synergies and trade-offs among the sustainable development goals: Collective action and adaptive capacity in marginal mountainous areas of India. Sustain. Sci. 2019, 15, 1–17. [Google Scholar] [CrossRef]
- Nilsson, M.; Chisholm, E.; Griggs, D.; Howden-Chapman, P.; Mccollum, D.; Messerli, P.; Neumann, B.; Stevance, A.-S.; Visbeck, M.; Stafford-Smith, M. Mapping interactions between the sustainable development goals: Lessons learned and ways forward. Sustain. Sci. 2018, 13, 1489–1503. [Google Scholar] [CrossRef]
- Kettner, C.; Kletzan-Slamanig, D.; Köppl, A.; Littig, B.; Zielinska, I. Monitoring Sustainable Development: Climate and Energy Policy Indicators. J. Sustain. Res. 2020, 2, e200027. [Google Scholar] [CrossRef]
- Forestier, O.; Kim, R.E. Cherry-picking the Sustainable Development Goals: Goal prioritization by national governments and implications for global governance. Sustain. Dev. 2020, 28, 1269–1278. [Google Scholar] [CrossRef]
- Cernev, T.; Fenner, R. The importance of achieving foundational Sustainable Development Goals in reducing global risk. Futures 2020, 115, 102492. [Google Scholar] [CrossRef]
- Körfgen, A.; Förster, K.; Glatz, I.; Maier, S.; Becsi, B.; Meyer, A.; Kromp-Kolb, H.; Stötter, J. It’s a Hit! Mapping Austrian Research Contributions to the Sustainable Development Goals. Sustainability 2018, 10, 3295. [Google Scholar] [CrossRef]
- Van Soest, H.L.; van Vuuren, D.P.; Hilaire, J.; Minx, J.C.; Harmsen, M.J.; Krey, V.; Popp, A.; Riahi, K.; Luderer, G. Analysing interactions among Sustainable Development Goals with Integrated Assessment Models. Glob. Transit. 2019, 1, 210–225. [Google Scholar] [CrossRef]
- Ramos, C.D.M.; Laurenti, R. Towards the Agenda 2030: A Quantitative Analysis of Synergies and Trade-Offs between the SDGs of Spain during 2000–2019. Sustainability 2020, 12, 506. [Google Scholar] [CrossRef]
- Collste, D.; Pedercini, M.; Cornell, S.E. Policy coherence to achieve the SDGs: Using integrated simulation models to assess effective policies. Sustain. Sci. 2017, 12, 921–931. [Google Scholar] [CrossRef]
- Weitz, N.; Nilsson, M.; Davis, M. A Nexus Approach to the Post-2015 Agenda: Formulating Integrated Water, Energy, and Food SDGs. SAIS Rev. Int. Aff. 2014, 34, 37–50. [Google Scholar] [CrossRef]
- Fu, B.; Wang, S.; Zhang, J.; Hou, Z.; Li, J. Unravelling the complexity in achieving the 17 sustainable-development goals. Natl. Sci. Rev. 2019, 6, 386–388. [Google Scholar] [CrossRef]
- Lacey, F.G.; Henze, D.K.; Lee, C.J.; van Donkelaar, A.; Martin, R.V. Transient climate and ambient health impacts due to national solidfuel cookstove emissions. Proc. Natl. Acad. Sci. USA 2017, 114, 1269–1274. [Google Scholar] [CrossRef]
- Zhao, Z.; Cai, M.; Wang, F.; Winkler, J.A.; Connor, T.; Chung, M.G.; Zhang, J.; Yang, H.; Xu, Z.; Tang, Y.; et al. Synergies and tradeoffs among Sustainable Development Goals across boundaries in a metacoupled world. Sci. Total. Environ. 2021, 751, 141749. [Google Scholar] [CrossRef]
- Hutton, C.W.; Nicholls, R.J.; Lázár, A.N.; Chapman, A.; Schaafsma, M.; Salehin, M. Potential Trade-Offs between the Sustainable Development Goals in Coastal Bangladesh. Sustainability 2018, 10, 1108. [Google Scholar] [CrossRef]
- Bennich, T.; Weitz, N.; Carlsen, H. Deciphering the scientific literature on SDG interactions: A review and reading guide. Sci. Total. Environ. 2020, 728, 138405. [Google Scholar] [CrossRef] [PubMed]
- Weitz, N.; Carlsen, H.; Nilsson, M.; Skånberg, K. Towards systemic and contextual priority setting for implementing the 2030 Agenda. Sustain. Sci. 2018, 13, 531–548. [Google Scholar] [CrossRef] [PubMed]
- Scherer, L.; Behrens, P.; de Koning, A.; Heijungs, R.; Sprecher, B.; Tukker, A. Trade-offs between social and environmental Sustainable Development Goals. Environ. Sci. Policy 2018, 90, 65–72. [Google Scholar] [CrossRef]
- Le Blanc, D. Towards Integration at Last? The Sustainable Development Goals as a Network of Targets; DESA Working Paper No 141. ST/ESA/2015/DWP/141; UN Department of Economic and Social Affairs: New York, NY, USA, 2015; Available online: http://www.un.org/esa/desa/papers/2015/wp141_2015.pdf (accessed on 19 February 2021).
- Huan, Y.; Liang, T.; Li, H.; Zhang, C. A systematic method for assessing progress of achieving sustainable development goals: A case study of 15 countries. Sci. Total. Environ. 2021, 752, 141875. [Google Scholar] [CrossRef]
- Liu, J.; Hull, V.; Godfray, H.C.J.; Tilman, D.; Gleick, P.; Hoff, H.; Pahl-Wostl, C.; Xu, Z.; Chung, M.G.; Sun, J.; et al. Nexus approaches to global sustainable development. Nat. Sustain. 2018, 1, 466–476. [Google Scholar] [CrossRef]
- Breuer, A.; Janetschek, H.; Malerba, D. Translating Sustainable Development Goal (SDG) Interdependencies into Policy Advice. Sustainability 2019, 11, 2092. [Google Scholar] [CrossRef]
- Allen, C.; Metternicht, G.; Wiedmann, T. Prioritising SDG targets: Assessing baselines, gaps and interlinkages. Sustain. Sci. 2019, 14, 421–438. [Google Scholar] [CrossRef]
- Alcamo, J.; Thompson, J.; Alexander, A.; Antoniades, A.; Delabre, I.; Dolley, J.; Marshall, F.; Menton, M.; Middleton, J.; Scharlemann, J.P.W. Analysing interactions among the sustainable development goals: Findings and emerging issues from local and global studies. Sustain. Sci. 2020, 15, 1561–1572. [Google Scholar] [CrossRef] [PubMed]
- Gomez-Echeverri, L. Climate and development: Enhancing impact through stronger linkages in the implementation of the Paris Agreement and the Sustainable Development Goals (SDGs). Philos. Trans. R. Soc. A. 2018, 376, 2119. [Google Scholar] [CrossRef] [PubMed]
- Berger-Schmitt, R.; Noll, H.-H. Conceptual Framework and Structure of a European System of Social Indicators; Working Paper 9; EuReporting: Mannheim, Germany, 2000. [Google Scholar]
- Eurostat—Database. Available online: https://ec.europa.eu/eurostat/data/database (accessed on 26 January 2020).
- Wysocki, F. The Methods of Taxonomy for Recognition of Economic Types in Agriculture and Rural Areas; University Publisher Poznan University of Life Sciences: Poznań, Poland, 2010. [Google Scholar]
- Sompolska-Rzechuła, A. Selection of the Optimal Way of Linear Ordering of Objects: Case of Sustainable Development in EU Countries. Stat. Stat.Econ. J. 2021, 101, 365–377. [Google Scholar]
- Kukuła, K. Zero Unitarization Method; Scientific Publisher PWN: Warsaw, Poland, 2000. [Google Scholar]
- Hwamg, C.L.; Yoon, K. Multiple Attribute Decision Making. Methods and Applications; Springer: Berlin, Germany, 1981. [Google Scholar]
- Łuczak, A.; Kalinowski, S. Assessing the level of the material deprivation of European Union countries. PLoS ONE 2020, 15, e0238376. [Google Scholar] [CrossRef] [PubMed]
- Yılmaz, G.; İnel, N.M. Assessment of Sustainability Performances of Banks by TOPSIS method and Balanced Scorecard Approach. Int. J. Bus. Appl. Soc. Sci. 2018, 4, 62–75. Available online: https://nbnresolving.org/urn:nbn:de:0168-ssoar-55665-7 (accessed on 4 February 2021).
- Song, J.; Zheng, J. The Application of Grey-TOPSIS Method on Teaching Quality Evaluation of the Higher Education. Int. J. Emerg. Technol. Learn. 2015, 10, 391–397. Available online: https://online-journals.org/index.php/i-jet/article/view/5219 (accessed on 4 February 2021). [CrossRef]
- Tiwari, A.; Mishra, N. Sustainable and smart city project: An overview of the application of multiple criteria decision making techniques and approaches for Indian context. Int. J. Manag. Appl. Sci. 2017, 3, 1–6. [Google Scholar]
- Kılıç, M.; Taşan, S. Performance evaluation in sustainability conscious manufacturing companies by using TOPSIS method. In Proceedings of the 19th Advances in Production Management Systems (APMS), Rhodes, Greece, 24–26 September 2012. [Google Scholar]
- Behzadian, M.; Otaghsara, S.K.; Yazdani, M.; Ignatius, J. A state-of the-art survey of TOPSIS applications. Expert Syst. Appl. 2012, 39, 13051–13069. [Google Scholar] [CrossRef]
- Sompolska-Rzechuła, A. The Measurement and Assessment of the Quality of Life in the Region; University Publishing House of the West Pomeranian University of Technology in Szczecin: Szczecin, Poland, 2018. [Google Scholar]
- Kendall, M.G. Rank Correlation Methods; Charles Griffin & Company Limited: London, UK, 1948. [Google Scholar]
- Pradhan, P. Antagonists to meeting the 2030 Agenda. Nat. Sustain. 2019, 2, 171–172. [Google Scholar] [CrossRef]
- Nilsson, M.; Griggs, D.; Visbeck, M. Policy: Map the interactions between Sustainable Development Goals. Nat. Cell Biol. 2016, 534, 320–322. [Google Scholar] [CrossRef] [PubMed]
- Sweden’s Work on Global Health—Implementing the 2030 Agenda, Government Offices of Sweden. Available online: https://www.government.se/4a783f/contentassets/dd593d842fa445d29bf000bf8d97ed3e/swedens-work-on-global-health--implementing-the-2030-agenda.pdf (accessed on 22 March 2021).


| SDG3 | |
| X2 | Share of people with good or very good perceived health by sex (% of population aged 16 or over). |
| X3 | Smoking prevalence by sex (% of population aged 15 or over) |
| X6 | Self-reported unmet need for medical examination and care by sex (% of population aged 16 and over). |
| X8 | People killed in accidents at work, by sex (number per 100,000 employees). |
| X9 | Population living in households considering that they suffer from noise, by poverty status (% of population). |
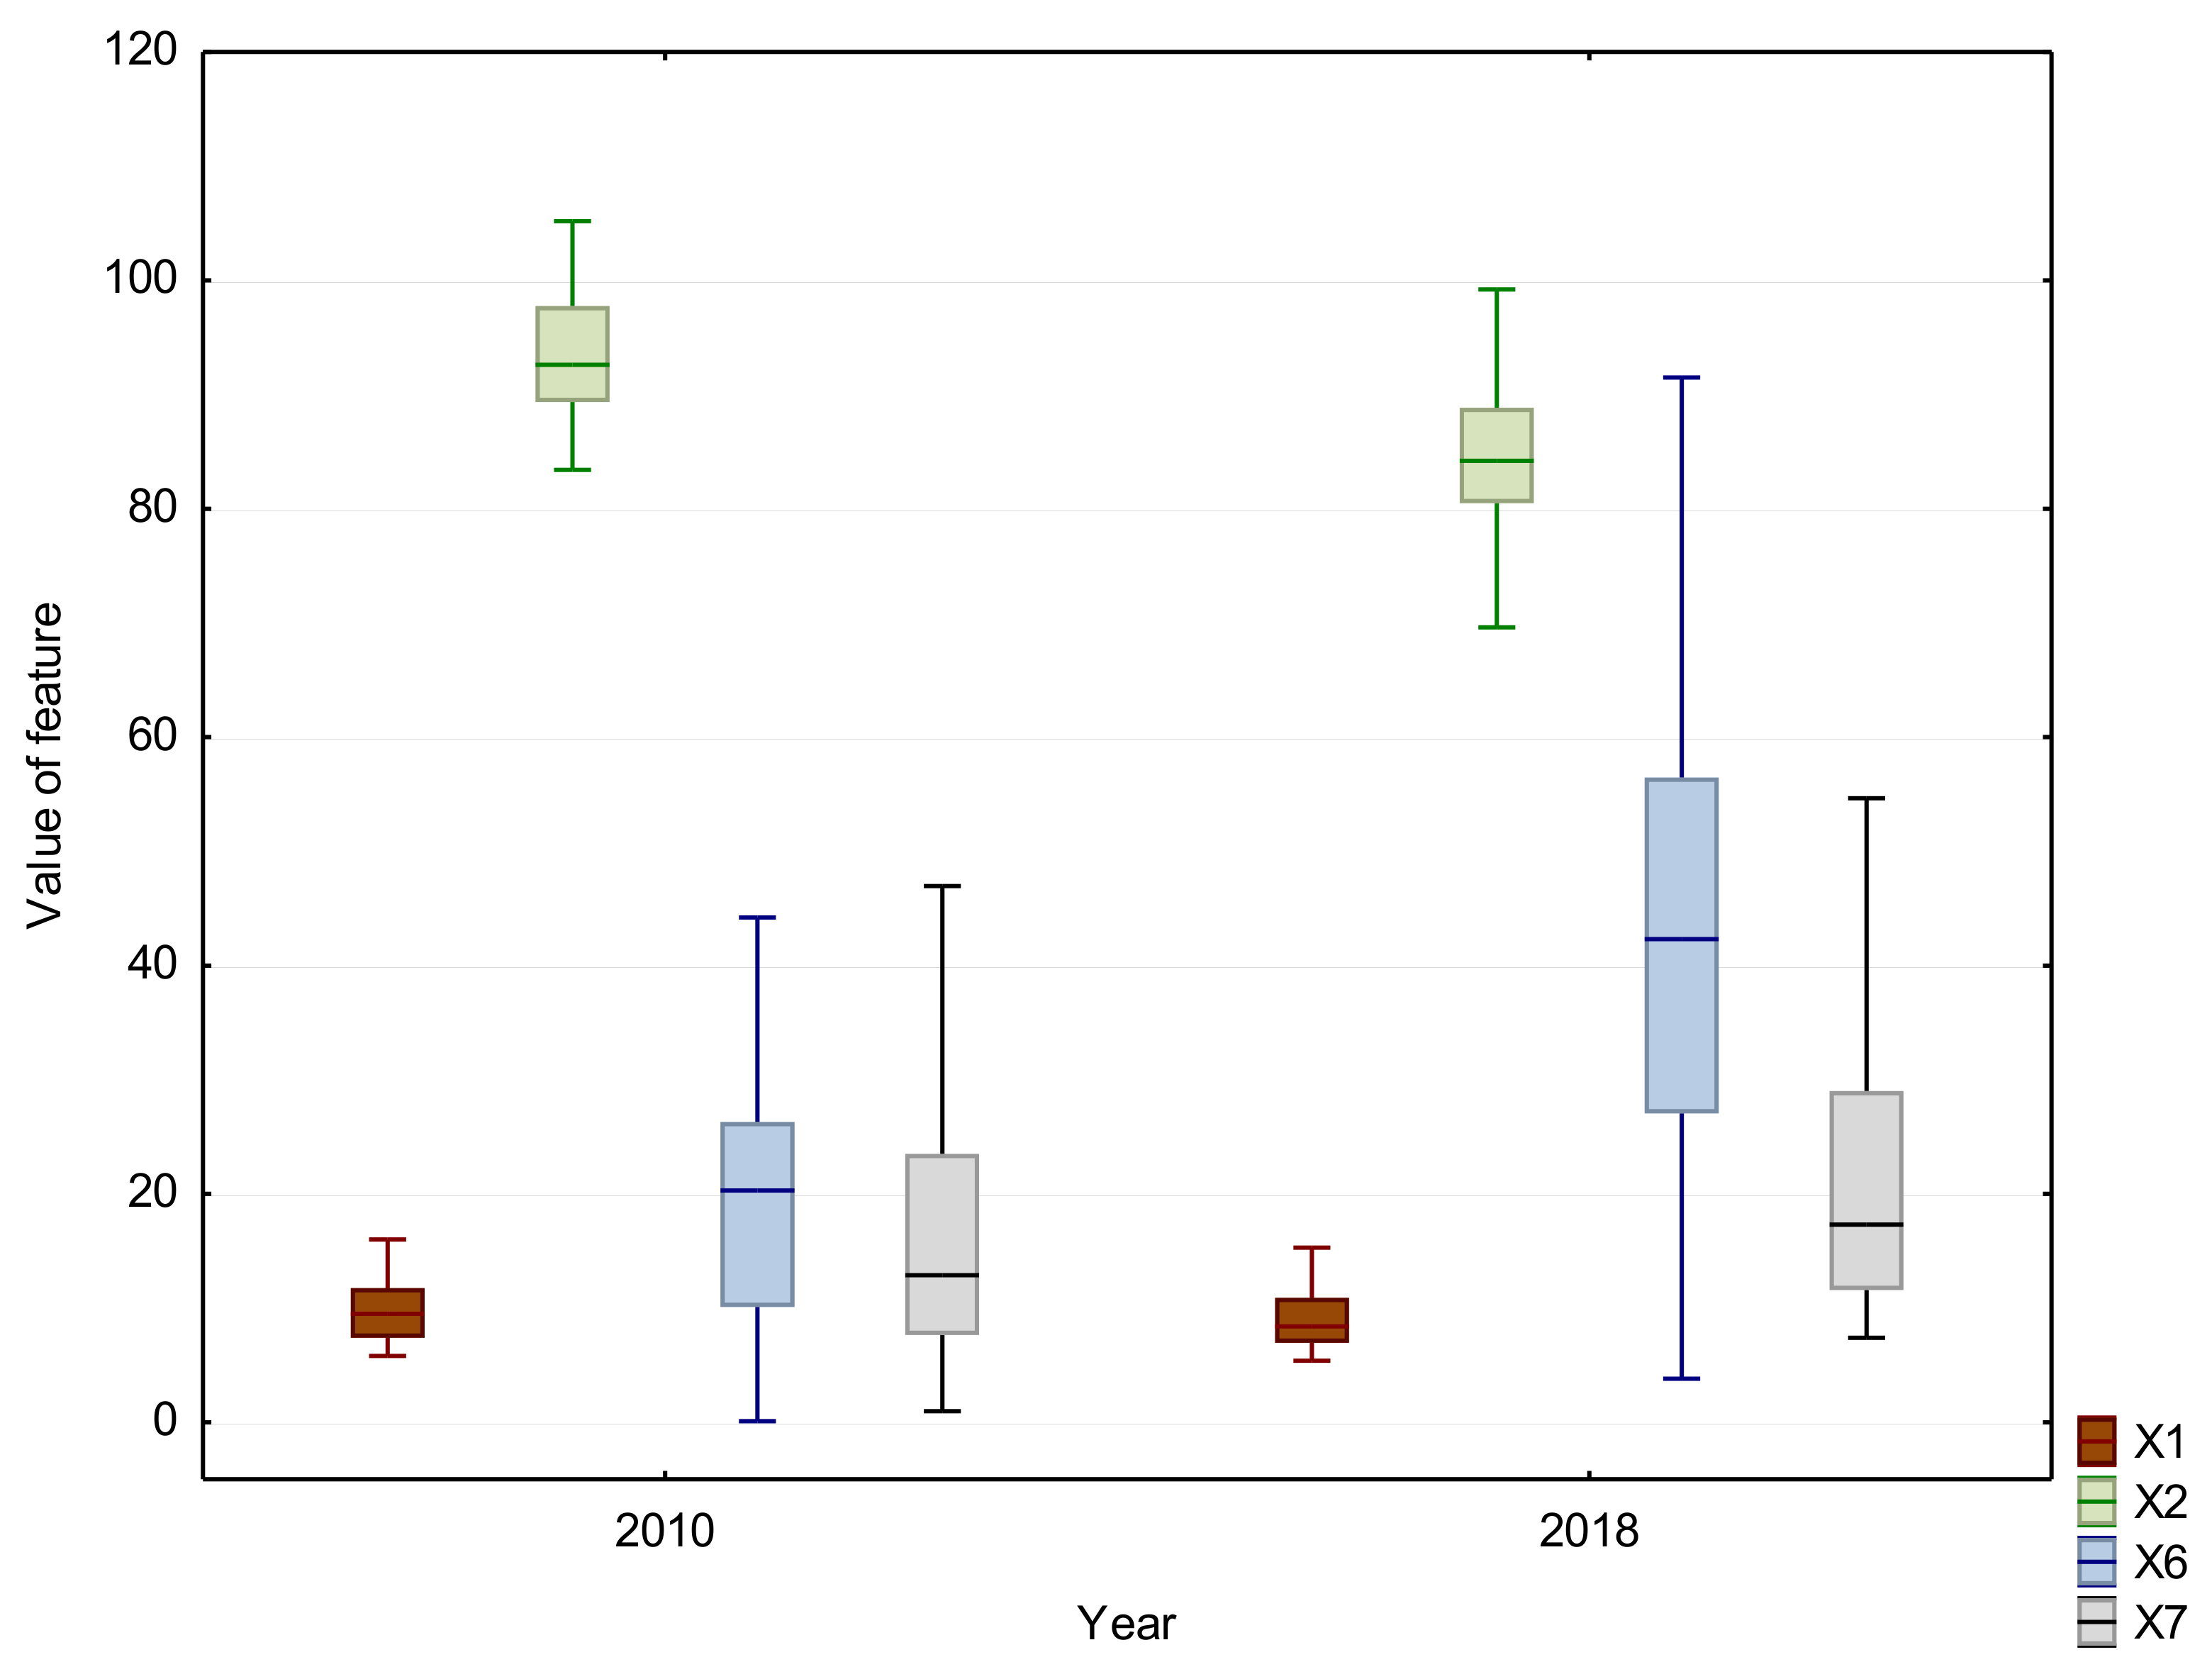
| SDG13 | |
| X1 | Greenhouse gas emissions (tons per capita). |
| X2 | Greenhouse gas emissions intensity of energy consumption (index 2000 = 100). |
| X6 | Population covered by the Covenant of Mayors for Climate & Energy signatories (% of population). |
| X7 | Share of renewable energy in gross final energy consumption by sector (%). |
| Specification | Variables | |||||||||
|---|---|---|---|---|---|---|---|---|---|---|
| X2 | X3 | X6 | X8 | X9 | ||||||
| 2010 | 2018 | 2010 | 2018 | 2010 | 2018 | 2010 | 2018 | 2010 | 2018 | |
| Mean | 66.03 | 67.08 | 29.57 | 25.71 | 3.49 | 2.75 | 2.62 | 1.87 | 18.57 | 16.44 |
| Median | 67.50 | 68.90 | 30.00 | 26.50 | 1.90 | 1.85 | 2.47 | 1.93 | 18.35 | 17.00 |
| Max | 83.30 | 84.10 | 42.00 | 37.00 | 15.10 | 16.40 | 4.93 | 4.49 | 31.60 | 28.20 |
| Min | 47.70 | 44.00 | 21.00 | 7.00 | 0.10 | 0.10 | 0.62 | 0.45 | 9.50 | 8.00 |
| St. Dev. | 10.15 | 9.83 | 5.79 | 6.67 | 3.75 | 3.39 | 1.23 | 0.96 | 5.65 | 5.68 |
| Variation coefficient | 15.37 | 14.65 | 19.60 | 25.94 | 107.70 | 123.12 | 46.74 | 51.31 | 30.45 | 34.56 |
| Skewness | −0.40 | −0.86 | 0.02 | −0.52 | 1.69 | 2.75 | 0.23 | 0.60 | 0.51 | 0.45 |
| Specification | Variables | |||||||
|---|---|---|---|---|---|---|---|---|
| X1 | X2 | X6 | X7 | |||||
| 2010 | 2018 | 2010 | 2018 | 2010 | 2018 | 2010 | 2018 | |
| Mean | 10.19 | 9.23 | 94.99 | 83.91 | 18.99 | 42.12 | 15.92 | 21.07 |
| Median | 9.50 | 8.40 | 92.60 | 84.20 | 20.30 | 42.30 | 12.88 | 17.32 |
| Max | 25.50 | 20.30 | 124.90 | 102.80 | 44.20 | 91.50 | 46.96 | 54.65 |
| Min | 5.80 | 5.40 | 83.40 | 57.60 | 0.02 | 3.80 | 0.98 | 7.39 |
| St. Dev. | 3.98 | 3.31 | 9.47 | 9.37 | 11.57 | 19.97 | 10.92 | 11.80 |
| Variation coefficient | 39.05 | 35.83 | 9.97 | 11.17 | 60.97 | 47.41 | 68.63 | 56.01 |
| Skewness | 2.20 | 1.59 | 1.67 | −0.71 | −0.02 | 0.30 | 0.93 | 1.13 |
| SDG3 | |
| X3 | Smoking prevalence by sex (% of population aged 15 or over) |
| X6 | Self-reported unmet need for medical examination and care by sex (% of population aged 16 and over). |
| X8 | People killed in accidents at work, by sex (number per 100,000 employees). |
| X9 | Population living in households considering that they suffer from noise, by poverty status (% of population). |
| SDG13 | |
| X1 | Greenhouse gas emissions (tons per capita). |
| X2 | Greenhouse gas emissions intensity of energy consumption (index 2000 = 100). |
| Countries | Rank of Countries in Terms of Achieving | |||||
|---|---|---|---|---|---|---|
| SDG3 | SDG13 | |||||
| 2010 | 2018 | Change | 2010 | 2018 | Change | |
| Austria | 24 | 5 | ↑ | 13 | 16 | ↓ |
| Belgium | 10 | 17 | ↓ | 18 | 13 | ↑ |
| Bulgaria | 18 | 14 | ↑ | 27 | 20 | ↑ |
| Croatia | 23 | 8 | ↑ | 4 | 6 | ↓ |
| Cyprus | 21 | 6 | ↑ | 25 | 21 | ↑ |
| Czech Republic | 13 | 21 | ↓ | 20 | 24 | ↓ |
| Denmark | 11 | 15 | ↓ | 8 | 3 | ↑ |
| Estonia | 16 | 11 | ↑ | 15 | 19 | ↓ |
| Finland | 5 | 12 | ↓ | 11 | 7 | ↑ |
| France | 22 | 24 | ↓ | 9 | 15 | ↓ |
| Germany | 9 | 16 | ↓ | 16 | 25 | ↓ |
| Greece | 8 | 19 | ↓ | 23 | 11 | ↑ |
| Hungary | 19 | 7 | ↑ | 7 | 12 | ↓ |
| Ireland | 4 | 4 | - | 21 | 23 | ↓ |
| Italy | 17 | 10 | ↑ | 12 | 8 | ↑ |
| Latvia | 28 | 26 | ↑ | 1 | 2 | ↓ |
| Lithuania | 25 | 27 | ↓ | 17 | 14 | ↑ |
| Luxembourg | 7 | 20 | ↓ | 28 | 28 | - |
| Malta | 15 | 2 | ↑ | 10 | 4 | ↑ |
| Netherlands | 1 | 3 | ↓ | 22 | 26 | ↓ |
| Poland | 27 | 25 | ↑ | 24 | 27 | ↓ |
| Portugal | 20 | 28 | ↓ | 3 | 5 | ↓ |
| Romania | 26 | 23 | ↑ | 6 | 9 | ↓ |
| Slovakia | 14 | 18 | ↓ | 19 | 22 | ↓ |
| Slovenia | 6 | 22 | ↓ | 14 | 17 | ↓ |
| Spain | 12 | 9 | ↑ | 5 | 10 | ↓ |
| Sweden | 3 | 1 | ↑ | 2 | 1 | ↑ |
| United Kingdom | 2 | 13 | ↓ | 26 | 18 | ↑ |
Publisher’s Note: MDPI stays neutral with regard to jurisdictional claims in published maps and institutional affiliations. |
© 2021 by the authors. Licensee MDPI, Basel, Switzerland. This article is an open access article distributed under the terms and conditions of the Creative Commons Attribution (CC BY) license (https://creativecommons.org/licenses/by/4.0/).
Share and Cite
Sompolska-Rzechuła, A.; Kurdyś-Kujawska, A. Towards Understanding Interactions between Sustainable Development Goals: The Role of Climate-Well-Being Linkages. Experiences of EU Countries. Energies 2021, 14, 2025. https://doi.org/10.3390/en14072025
Sompolska-Rzechuła A, Kurdyś-Kujawska A. Towards Understanding Interactions between Sustainable Development Goals: The Role of Climate-Well-Being Linkages. Experiences of EU Countries. Energies. 2021; 14(7):2025. https://doi.org/10.3390/en14072025
Chicago/Turabian StyleSompolska-Rzechuła, Agnieszka, and Agnieszka Kurdyś-Kujawska. 2021. "Towards Understanding Interactions between Sustainable Development Goals: The Role of Climate-Well-Being Linkages. Experiences of EU Countries" Energies 14, no. 7: 2025. https://doi.org/10.3390/en14072025
APA StyleSompolska-Rzechuła, A., & Kurdyś-Kujawska, A. (2021). Towards Understanding Interactions between Sustainable Development Goals: The Role of Climate-Well-Being Linkages. Experiences of EU Countries. Energies, 14(7), 2025. https://doi.org/10.3390/en14072025