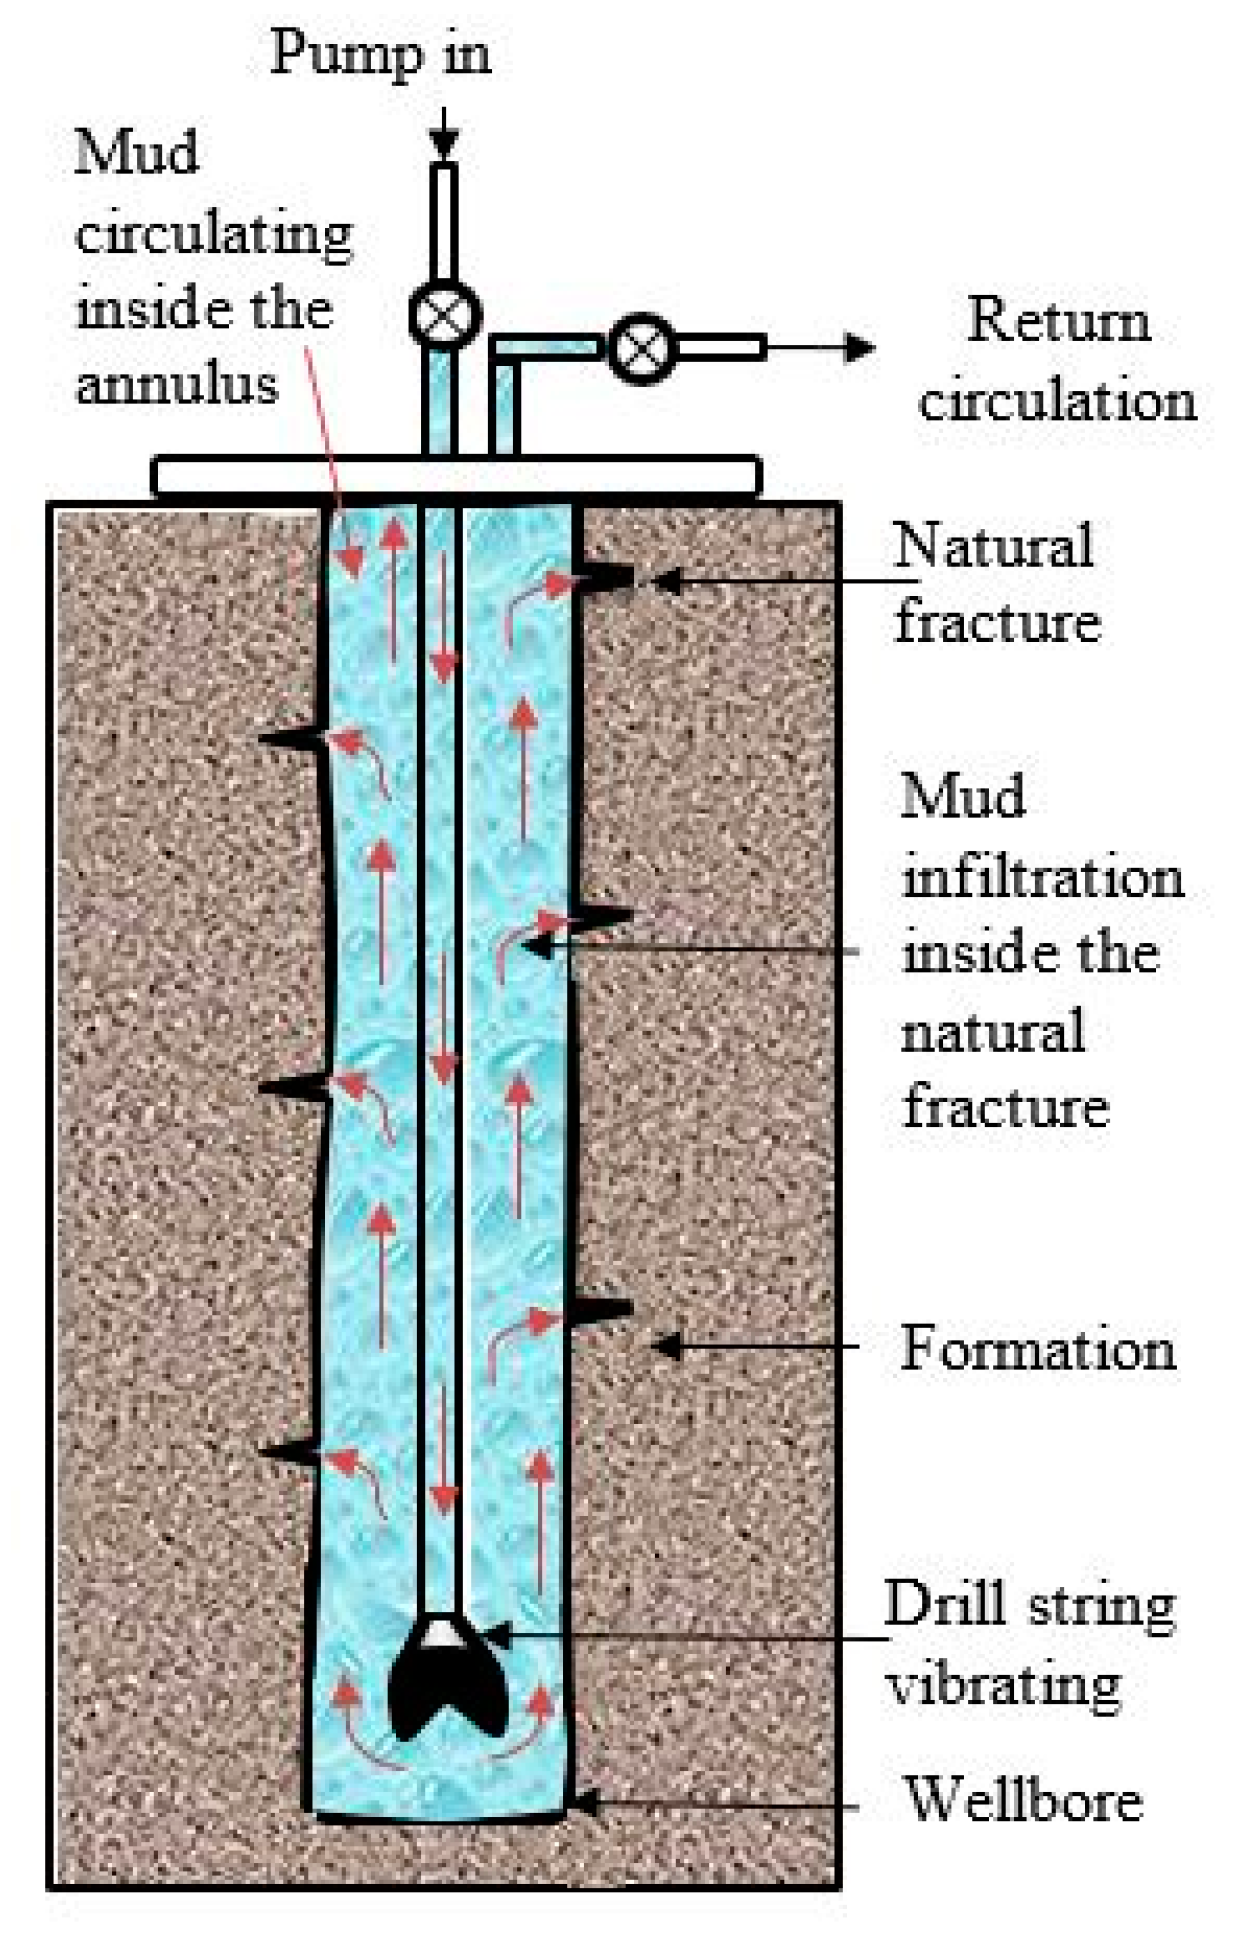
1. Introduction
The conventional methods used to assess the wellbore stability analysis generally assume that the loads acting on the wellbore are in steady-state [
1,
2,
3]. Nonetheless, recent researches have revealed that the magnitudes of the loads affecting the wellbore stability are more likely to change over time; therefore, the wellbore pressure is prone to fluctuations [
4,
5]. The drill string vibration cyclic load is one of the most common sources of wellbore pressure fluctuations and numerous researches have demonstrated its impact on wellbore stability: ref. [
6] were among the first researchers to investigate the rock failure under dynamic conditions. They found the critical rotary speed at which the fluctuating axial loads applied on the drill string will induce excessive wellbore enlargement. Ref. [
7] concluded in their research that when drilling in hard rocks such as basalt, the drill string acceleration generates lateral load that will impact the wellbore wall and later results into wellbore instability. Ref. [
8] after conducting fatigue tests experiments concluded that: (i) if the stress exerted by the cyclic loads on the rock formation was above 87% of the rock formation collapse strength, the rock collapsed within 100 cyclic loads, (ii) when the stress generated by the cyclic loads acting on the rock formation ranged between 75% to 87% of the rock formation collapse strength, the rock formation was weakened but the rock itself remained uncollapsed, and (iii) if the stress applied by the cyclic loads on the rock formation was below 75% of the rock formation collapse strength, the rock formation neither weakened nor collapsed. Ref. [
9] reported that thermal induced stresses caused by daily fluctuations in temperature can lead to crack propagation in the rock mass.
More so, ref. [
10] studied the impact of drill string vibration on wellbore stability. They made a correlation between the drill string critical speed and the rock fragmentation volume. They also established a rock fragmentation law related to the drill string impact on the wellbore. Ref. [
11] investigated the effect of formations compressive strength on drill string vibrations and demonstrated that uniaxial compressive strength of harder formation increases with the magnitude of vibrations and reversely. Ref. [
12] investigated the effects of the drill string vibration cyclic loads on the wellbore stability and they obtained slightly similar results with those of [
8]. They found that wellbore failure occurred due to drill string vibration cyclic loads when: (i) the drill string vibration applied stresses on the formation exceeded the strength of the rock formation, (ii) the drill string vibration applied continuous cyclic loads on the wellbore resulted in the rock fatigue, (iii) the drill string generates cyclic loads which did not result in the rock fatigue, however, the strength of the rock reduced. Ref. [
13] investigated the effect of vibrations in drilling systems and concluded that revolutions per minute (RPM) and weight on bit (WOB) are the major parameters that affect drill string vibrations. Ref. [
14] studied the mechanical behavior of shale rock under uniaxial cyclic loading and unloading condition and found that the residual strains was related to the number of cyclic loads to failure by an exponential function. In the same year, ref. [
15] presented a general review of cyclic and fatigue behavior of rock materials from literature published over the preceding 50 years. They reported that cyclic loads generated a decohesion of rock grains and matrix loosening of the rock. A wider fracture zone was also observed on the samples after cyclic loadings.
Although some studies in the past have already investigated the effect of the drill string vibration on the wellbore stability, some of those studies [
6,
7,
10] only demonstrated that drill string vibration indeed had affected the wellbore stability. Other researchers [
8,
12] focused on the effect of the cyclic loads on the wellbore collapse pressure. Few studies investigated how the continuous cyclic loads can change the parameters of a naturally fractured formation such as its length and its width. Meanwhile, it is well known that one of the primary functions of the drilling mud is to maintain the stability of the wellbore by outward hydrostatic pressure and mud filter cake [
16]. In a naturally fractured formation, plugging and sealing materials are generally added to the drilling mud in order to seal the fractures and to ensure the wellbore stability [
17,
18,
19]. To successfully seal the fractures and prevent loss circulation, it is vital to accurately predict the growth of the natural fractures especially when the wellbore pressure is subjected to fluctuations caused by some factors such as the drill string vibrations cyclic loads.
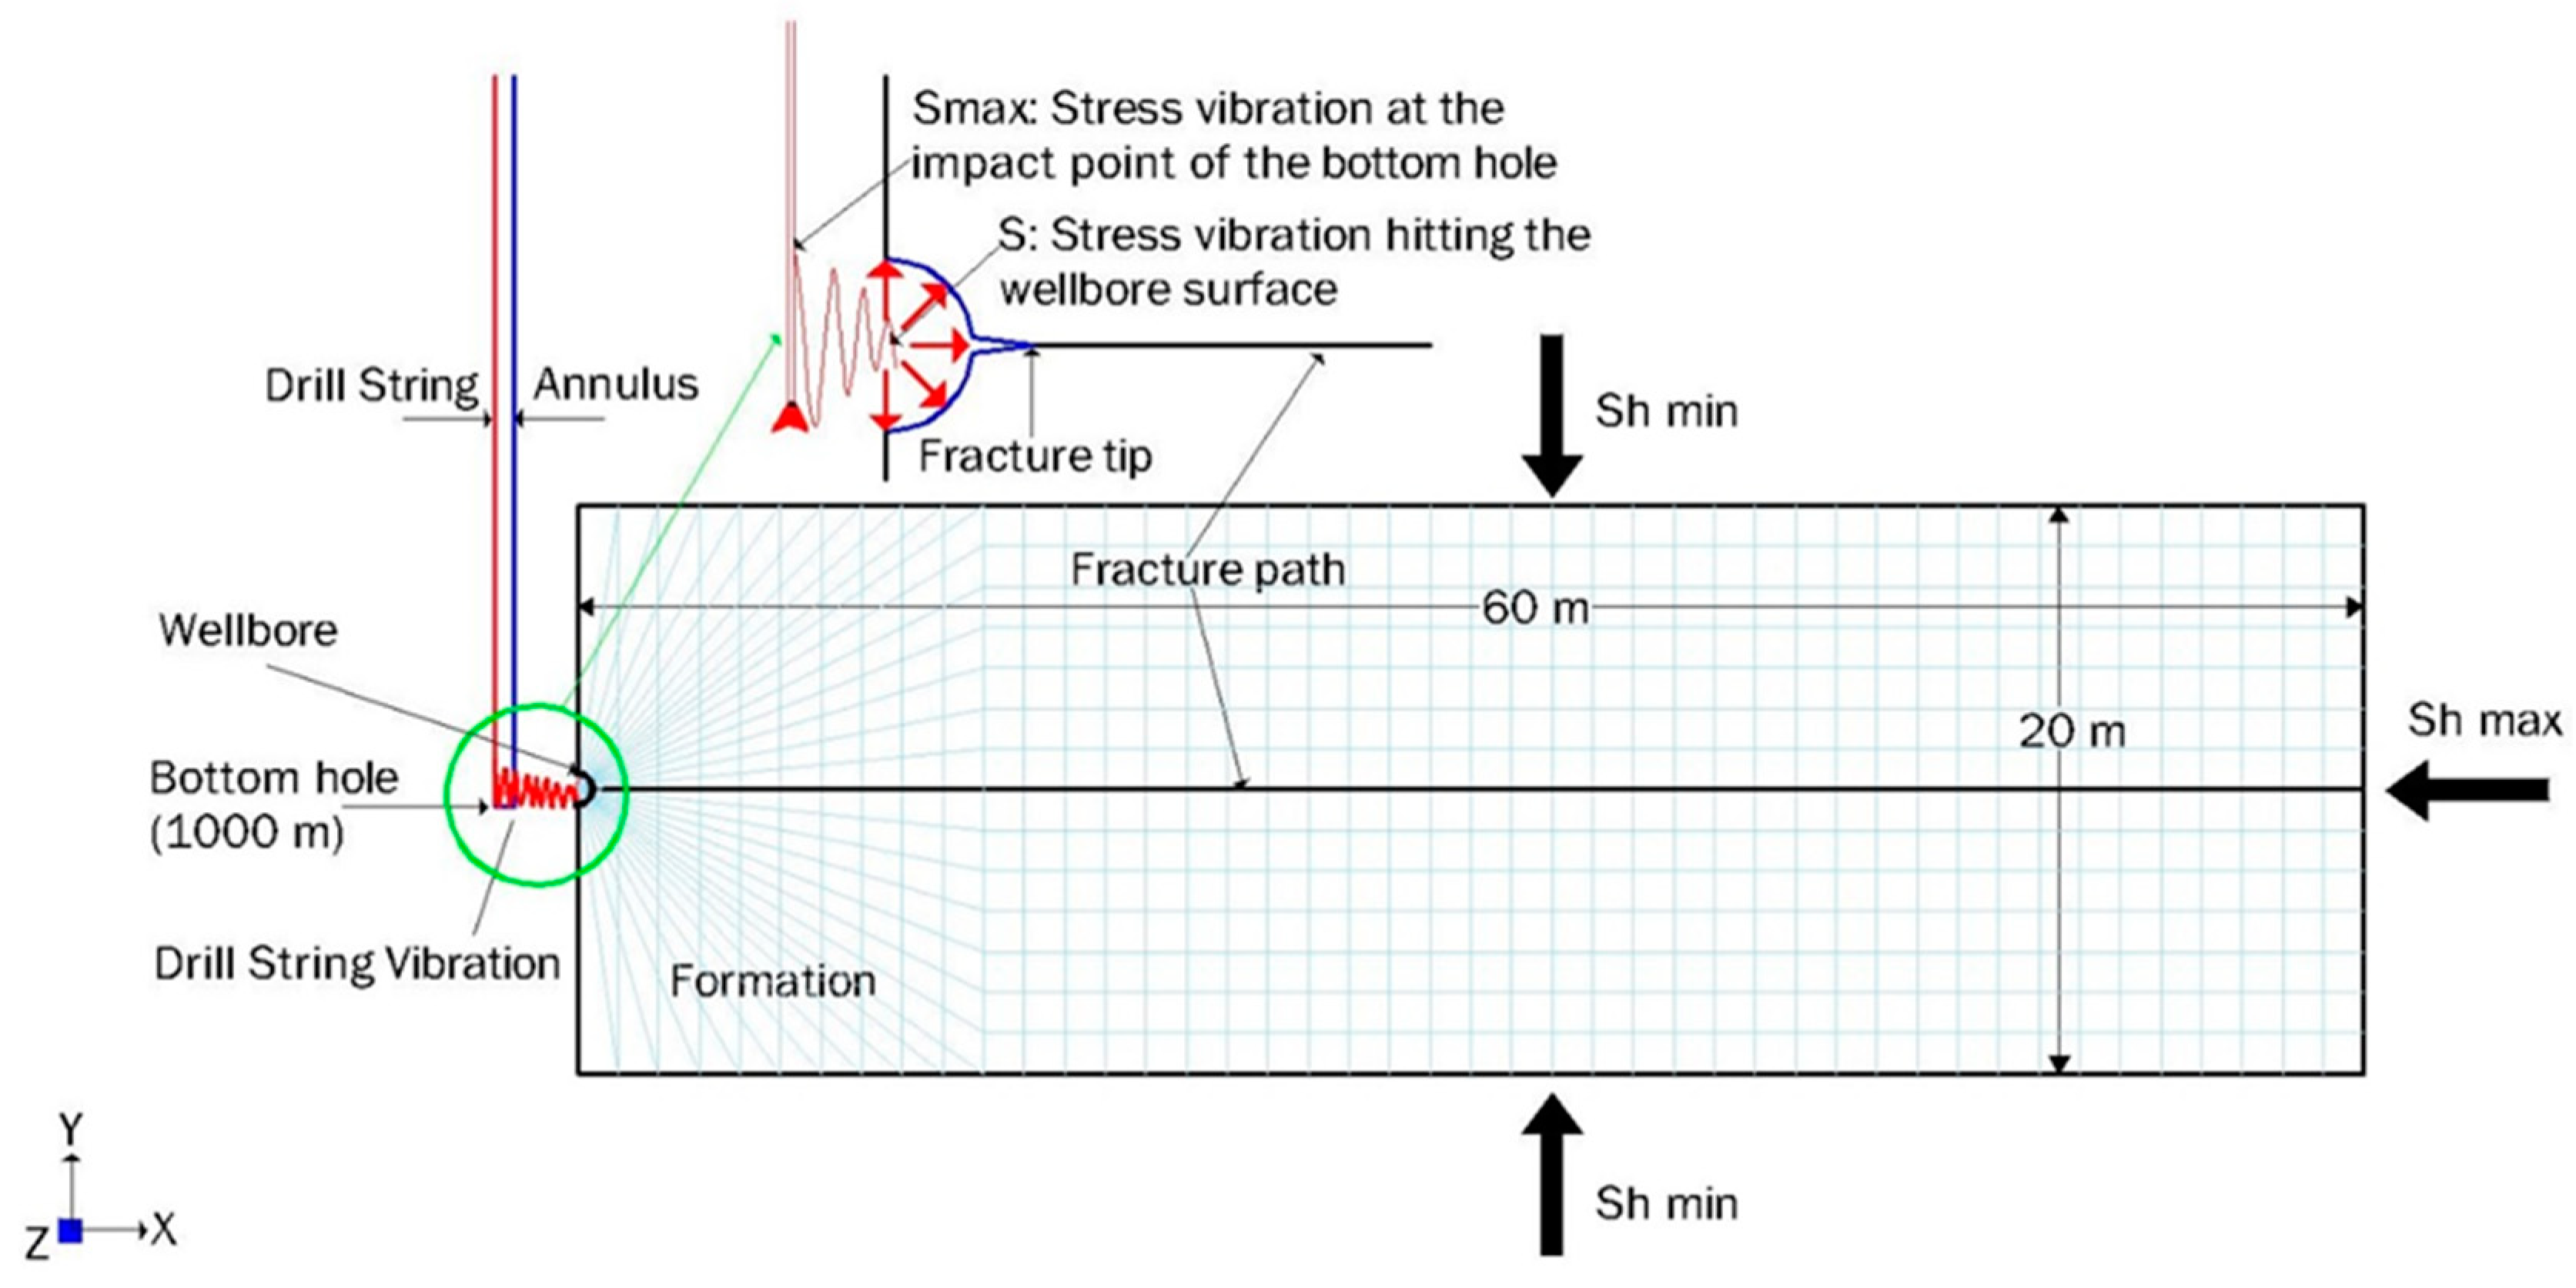
Due to the aforementioned reasons, a plane strain poro-elasto-plastic finite element analysis is carried out in this paper to investigate the influence of the drill string vibrations cyclic loads on the development of the wellbore natural fracture rock. The ABAQUS software is utilized as the numerical simulator and the results obtained were compared with small asymptotic analytical solutions to validate the numerical model.
4. Model Verification
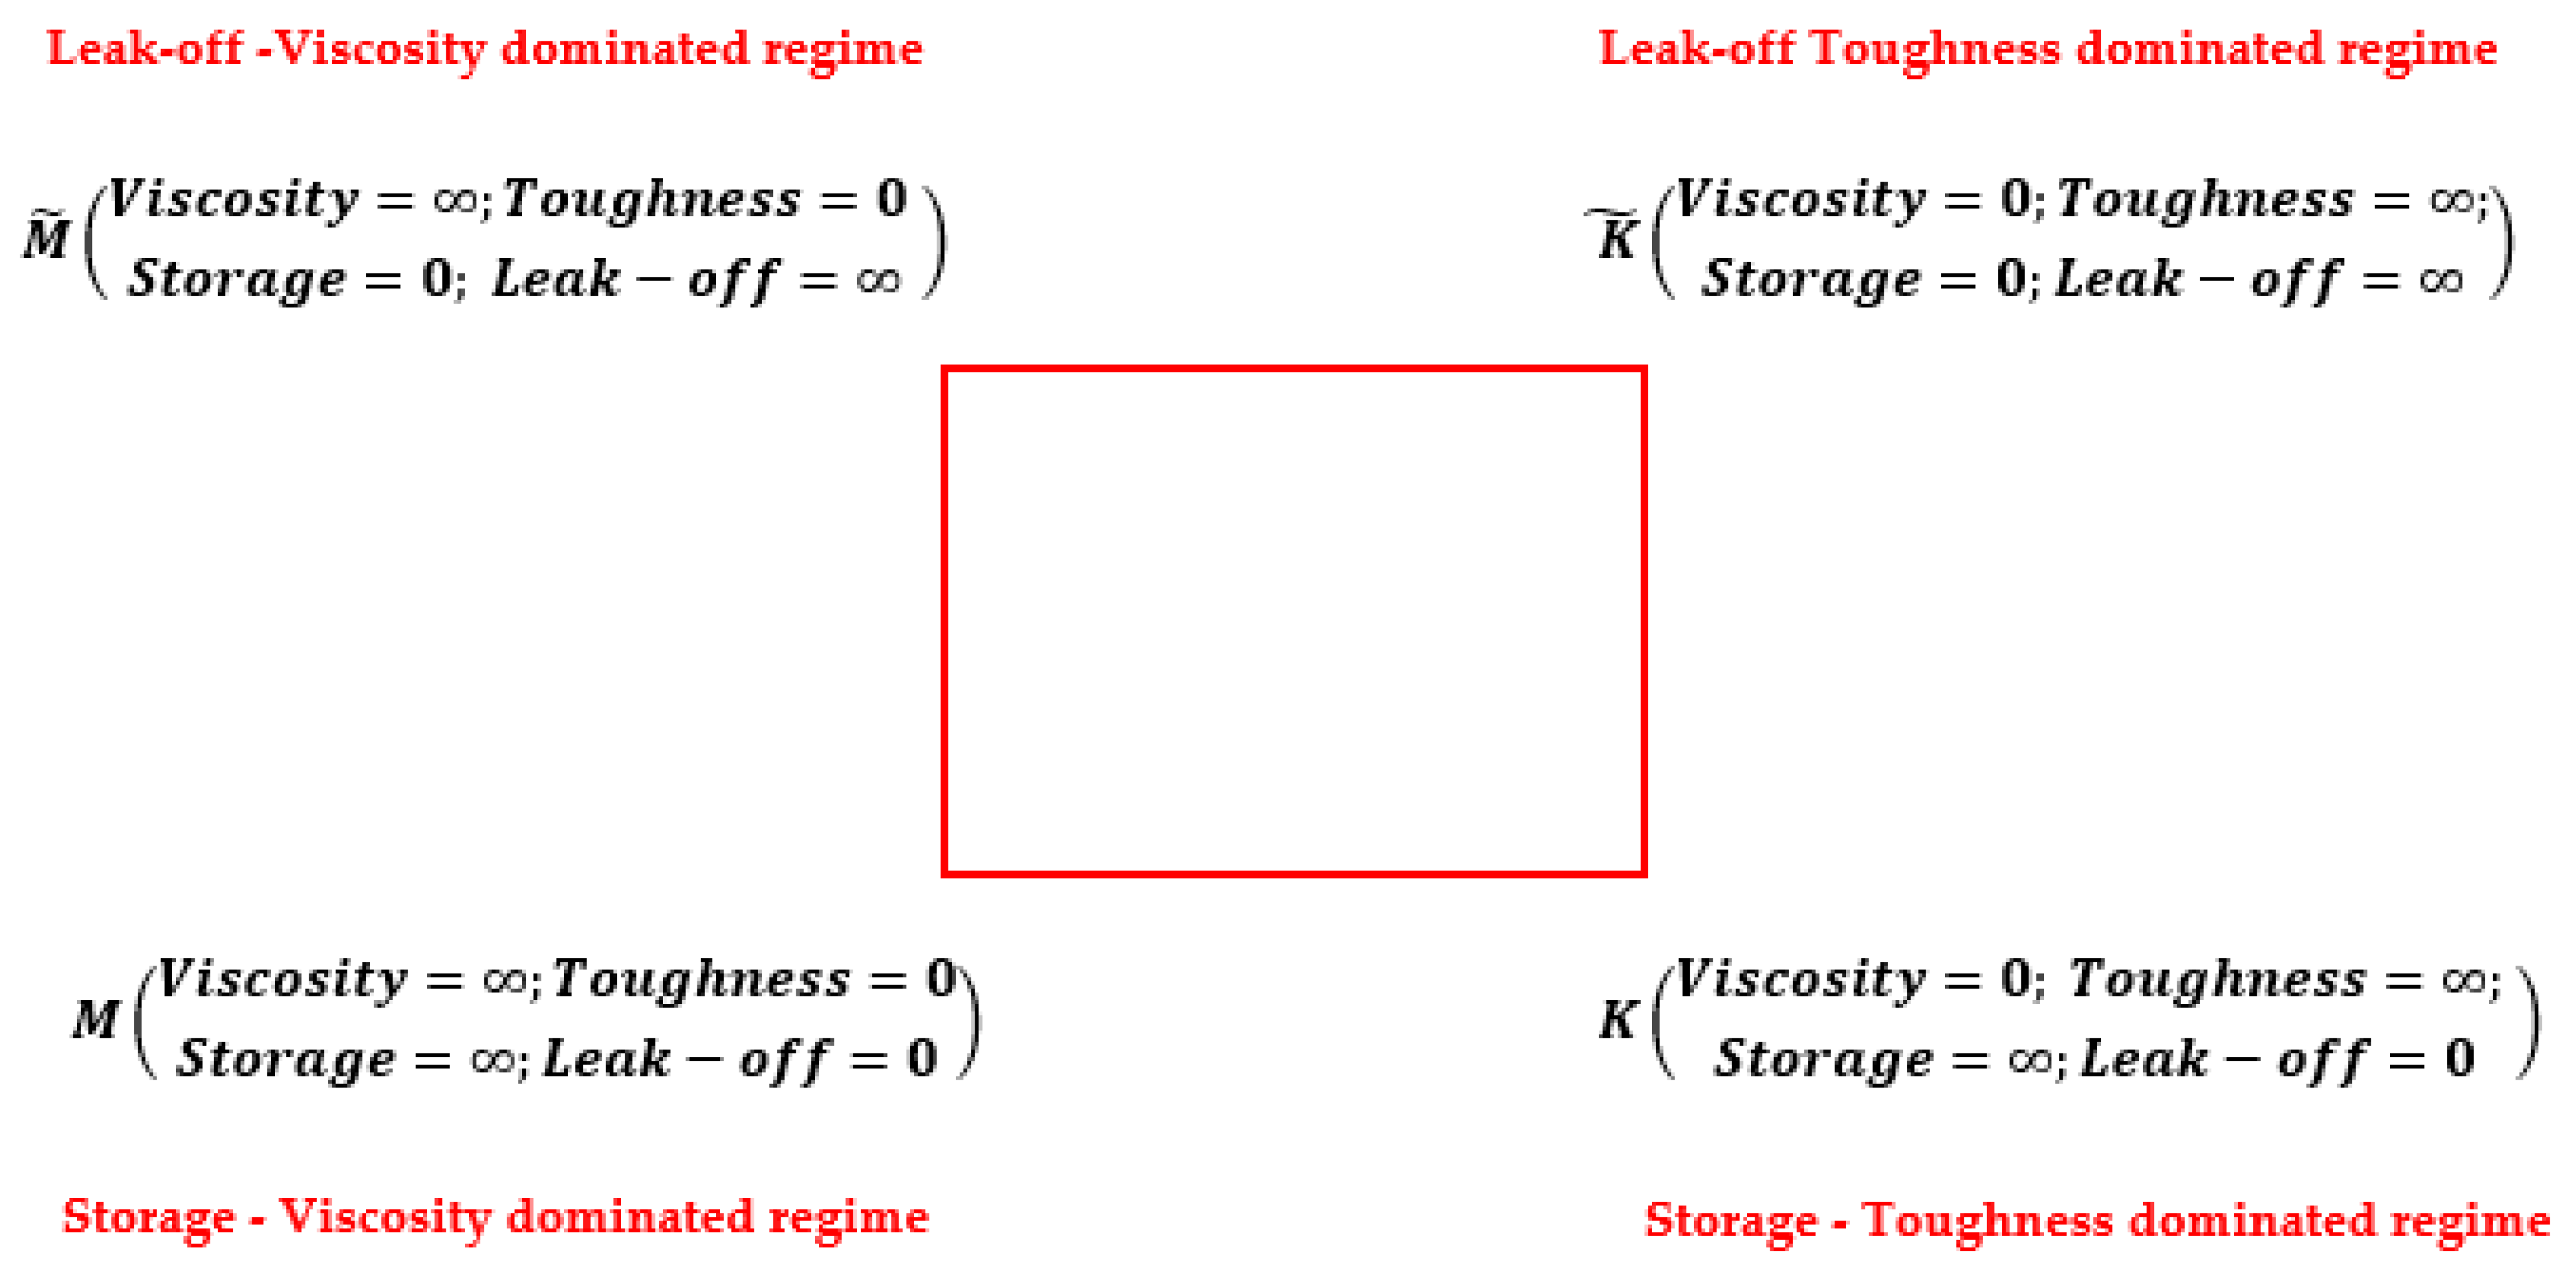
In the previous section, theories and definitions for the numerical modeling of hydraulically driven fracture problem has been presented. Fluid driven fracture problems are governed by two competing energy dissipation mechanisms associated respectively with viscous fluid flow and fracture propagation; and two competing fluid balance mechanisms associated with fluid storage within the fracture and fluid leakage from the fracture into the surrounding material. Consequently, four limiting propagation regimes as illustrated in
Figure 2 (each regime is characterized by the dominance of one dissipation mechanism and one fluid balance mechanism) define the problem of hydraulically driven fracture:
Storage-viscosity dominated regime;
Leak off-viscosity dominated regime;
Storage-toughness dominated regime;
Leak off-toughness dominated regime.
The dimensionless parameter which is the ratio of energy dissipated during the viscous fluid flow to energy expanded in fracturing the rock is introduced to classify the two energy dissipation mechanisms. For example, in the leak- off toughness dominated regime, the fluid storage inside the fracture is negligible compared to the fluid leak off and the parameter .
Despite the fact strong simplifying assumptions were made during the numerical modeling, there are no available closed-form analytical solutions for the problem of fluid driven fracture coupling drill string vibration cyclic loads, fluid flow in porous medium and fracturing fluid leaking into the surrounding rock materials. However, several researchers [
24,
25,
26,
27,
28,
29] have developed small- and large-time asymptotic solutions to predict the fracture development and the net fluid pressure for a hydraulic fracture propagating in an elastic rock driven by a Newtonian fluid. They demonstrated that the asymptotic solutions of the hydraulic driven fracture problem are function of the four limiting propagating regimes.
This research investigates the problem in the storage-toughness dominated regime (near-K). The boundary conditions, material parameters and loads utilized during the numerical modeling are always used to determine the near-K asymptotic solutions. Then, comparisons between Abaqus numerical solutions and analytical asymptotic solutions are conducted to validate the numerical model. The input parameters in
Table 1 were specifically selected in order to render the Abaqus numerical results comparable with the asymptotic solutions. For example, fracture geometries are much smaller than the domain dimensions, then, cohesive properties are selected to maintain fracture size larger than cohesive zone, finally, the permeability is defined to reduce the impact of poroelastic ahead of the fracture tip. In the following sections, the different equations and theories governing the small-and large-time asymptotic analytical models are presented.
4.1. Problem Formulation
An incompressible Newtonian fluid with viscosity is injected at the center of the fracture at constant flow rate in a brittle elastic fractured formation characterized by Young’s modulus E, Poisson’s ratio and fracture toughness . is the fluid leak-off coefficient. The crack is loaded by the fluid pressure and the formation is subjected to far field stress perpendicular to the fracture plane. The assumptions utilized during the numerical modeling of the problem are reconducted for the establishment of the analytical model:
The rock formation is homogeneous (uniform values of Young’s modulus E, Poison’s ratio and fracture toughness );
The fracture is designed with radially symmetric geometries;
The lag between the fracture front and the fracturing fluid is negligible;
Laminar and unidirectional regime govern the flow of incompressible fluid inside the fracture.
Under the above assumptions, the problem is solved by determining the net fluid pressure
(difference between fluid pressure inside the crack
and far field stress
), the fracture aperture
and the fracture half length
; where
is the spatial coordinate and
is the time. The following parameters are first defined to simplify the upcoming governing equations [
28]:
where,
is the plane strain modulus, Pa;
are respectively the alternate viscosity, Pa.s; fracture toughness,
and leak-off coefficient, m/s/Pa.
4.2. Governing Equations
The solutions , and of the problem are obtained by solving a set of governing equations summarized as follows:
4.2.1. Global Fluid Conservation
The global fluid conservation assumes that the volume of fluid injected inside the fracture remains equal to the sum of the fracturing fluid volume inside the crack and the fracturing fluid volume leaking into the surrounding rock [
25]:
where,
,
and
are respectively the volume injected inside the fracture, the fracturing fluid volume inside the crack and the fluid leak-off volume,
;
is the fluid flow rate
;
is the fracture aperture at the time
t and the position
x, m;
is the fracture length at the time
t, m. The function
denotes the rate of fluid leak-off into the surrounding rock expressed using the Carter’s theory equation:
where,
is the filter cake leak-off coefficient,
;
is the injection time, s;
is the time it takes for the fluid front to reach the point
.
4.2.2. Elasticity Equation
The relationship between the fracture width
and the net pressure
is described with the elasticity equation expressed by [
25]:
4.2.3. Lubrication Equation
The flow of incompressible Newtonian fluid inside the fracture is governed by the lubrication equation given as [
27]:
where,
are respectively the fracture aperture, m; the rate of fluid leak-off, m/s and the net fluid pressure, Pa.
4.2.4. Linear Elastic Fracture Mechanics
The fracture propagation is expressed in the framework of linear elastic fracture mechanics theory with the following equation [
27]:
where,
G is the elastic kernel [
30,
31] for radial crack geometry. The following boundary conditions which include the assumption that the fracture is always propagating (
), are used to complete the previous equations:
4.3. General Scaling
The fracture length
, the fracture aperture
, and the net fluid pressure
are obtained using the following scaling formulas [
26]:
The small parameter
, the timescale
, the length scale
and the dimensionless parameter
for radial crack geometry are expressed as [
27]:
Under the above governing equations and general scaling, the problem of hydraulically driven fracture is resumed to the following nonlinear equations:
when
, and assuming the fracture is always propagating (
), the opening
and the pressure
in Equation (22) can be related to the fracture length
using fracture elastic mechanics:
Finally, the global fluid balance equation governing the scaled fracture length as a function of the dimensionless scaled time is given as:
4.4. Asymptotic Analytical Solutions and Comparisons with Abaqus Numerical Solutions
The solution of the global fluid balance equation is supposed to exhibit an asymptotic behavior for small values of expressed as follows [
27]:
For radial fracture geometry, the initial boundary conditions are given as:
The other coefficients (for) and the scaled fracture length at small time are determined using the regular perturbation theory:
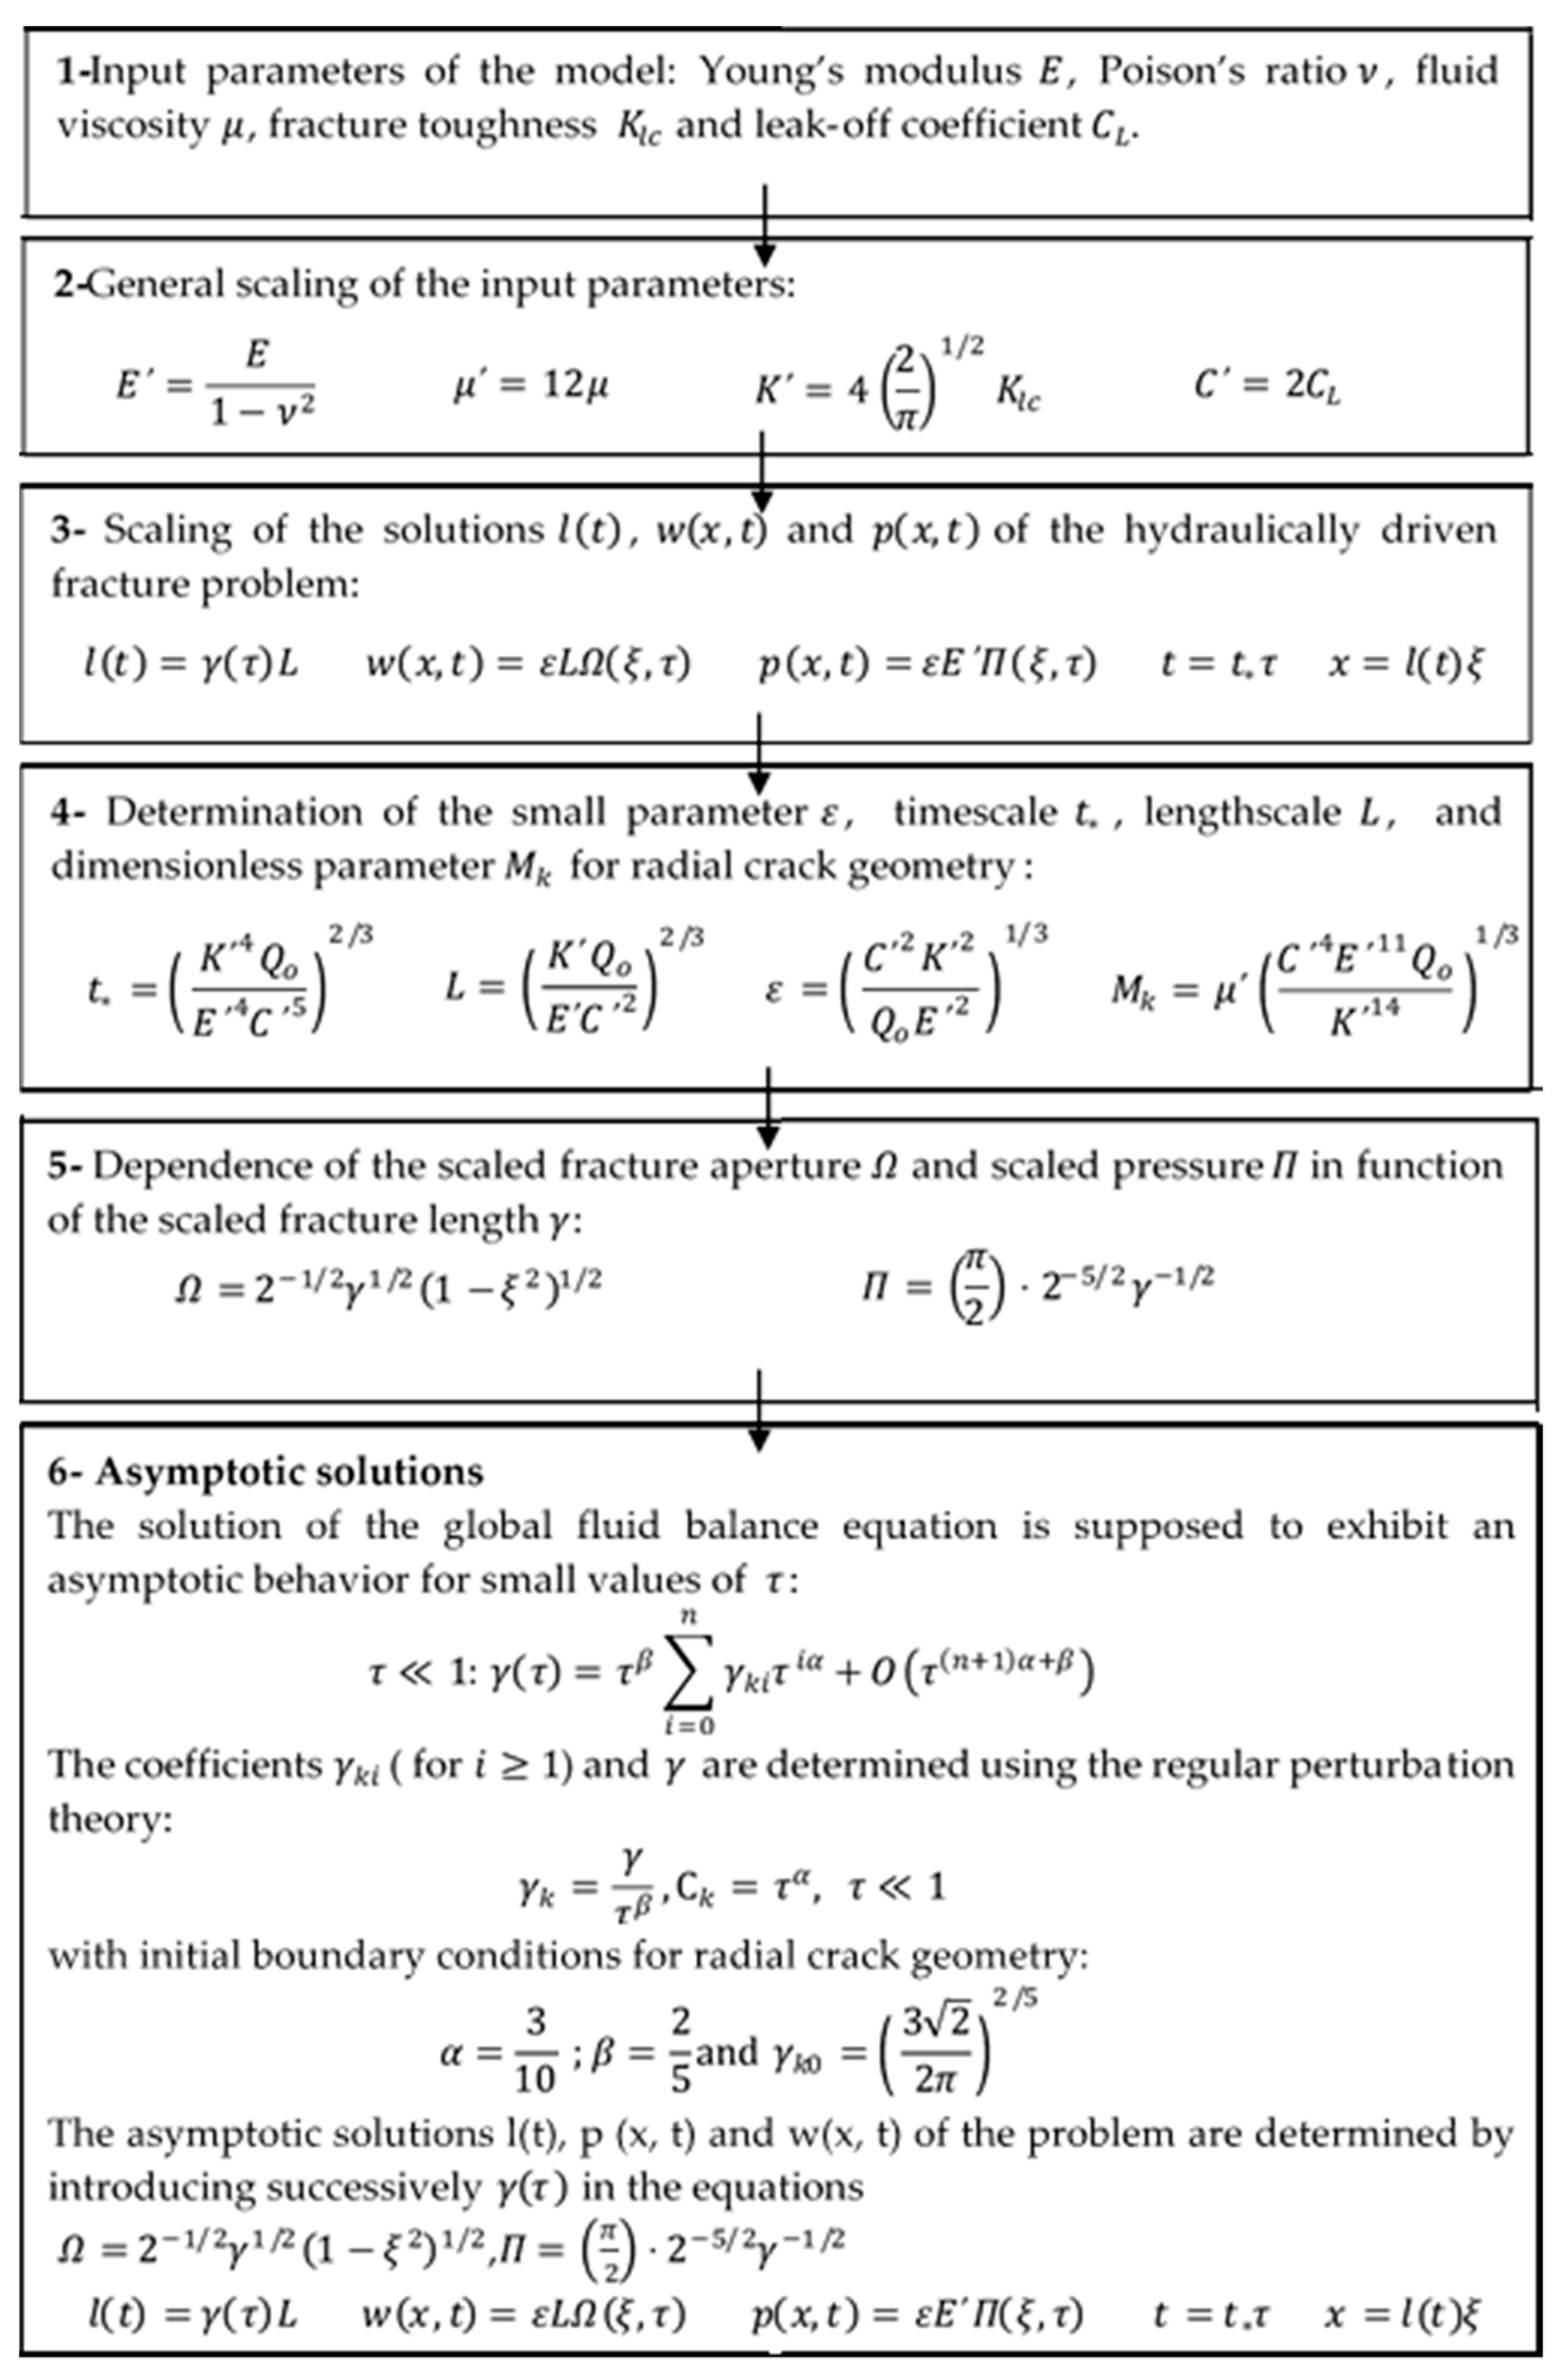
By combining Equations (14)–(17), (27)–(35), (40)–(41) and (43)–(45); the small-time asymptotic solutions
,
and
are determined and can be compared to the Abaqus numerical solutions. The flowchart of algorithm for the determination of the asymptotic solutions of the hydraulic driven fracture problem is presented in
Figure 3.
6. Presentation of Data and Results
In this section, numerical results are presented to demonstrate the importance of the drill string vibration cyclic loads on the development of the wellbore natural fracture. The input parameters used during this simulation are the same parameters used by Feng and Gray (2018) in their research. However, the cyclic load magnitude (
S) and the number of cyclic loads to failure (
N) have been added to model the drill string vibration cyclic loads. The cohesion and the friction angle have also been considered to define the plastic behavior of the rock formation. The input parameters corresponding to a sandstone type rock are presented in
Table 1.
6.1. Establishment of the S-N Curves
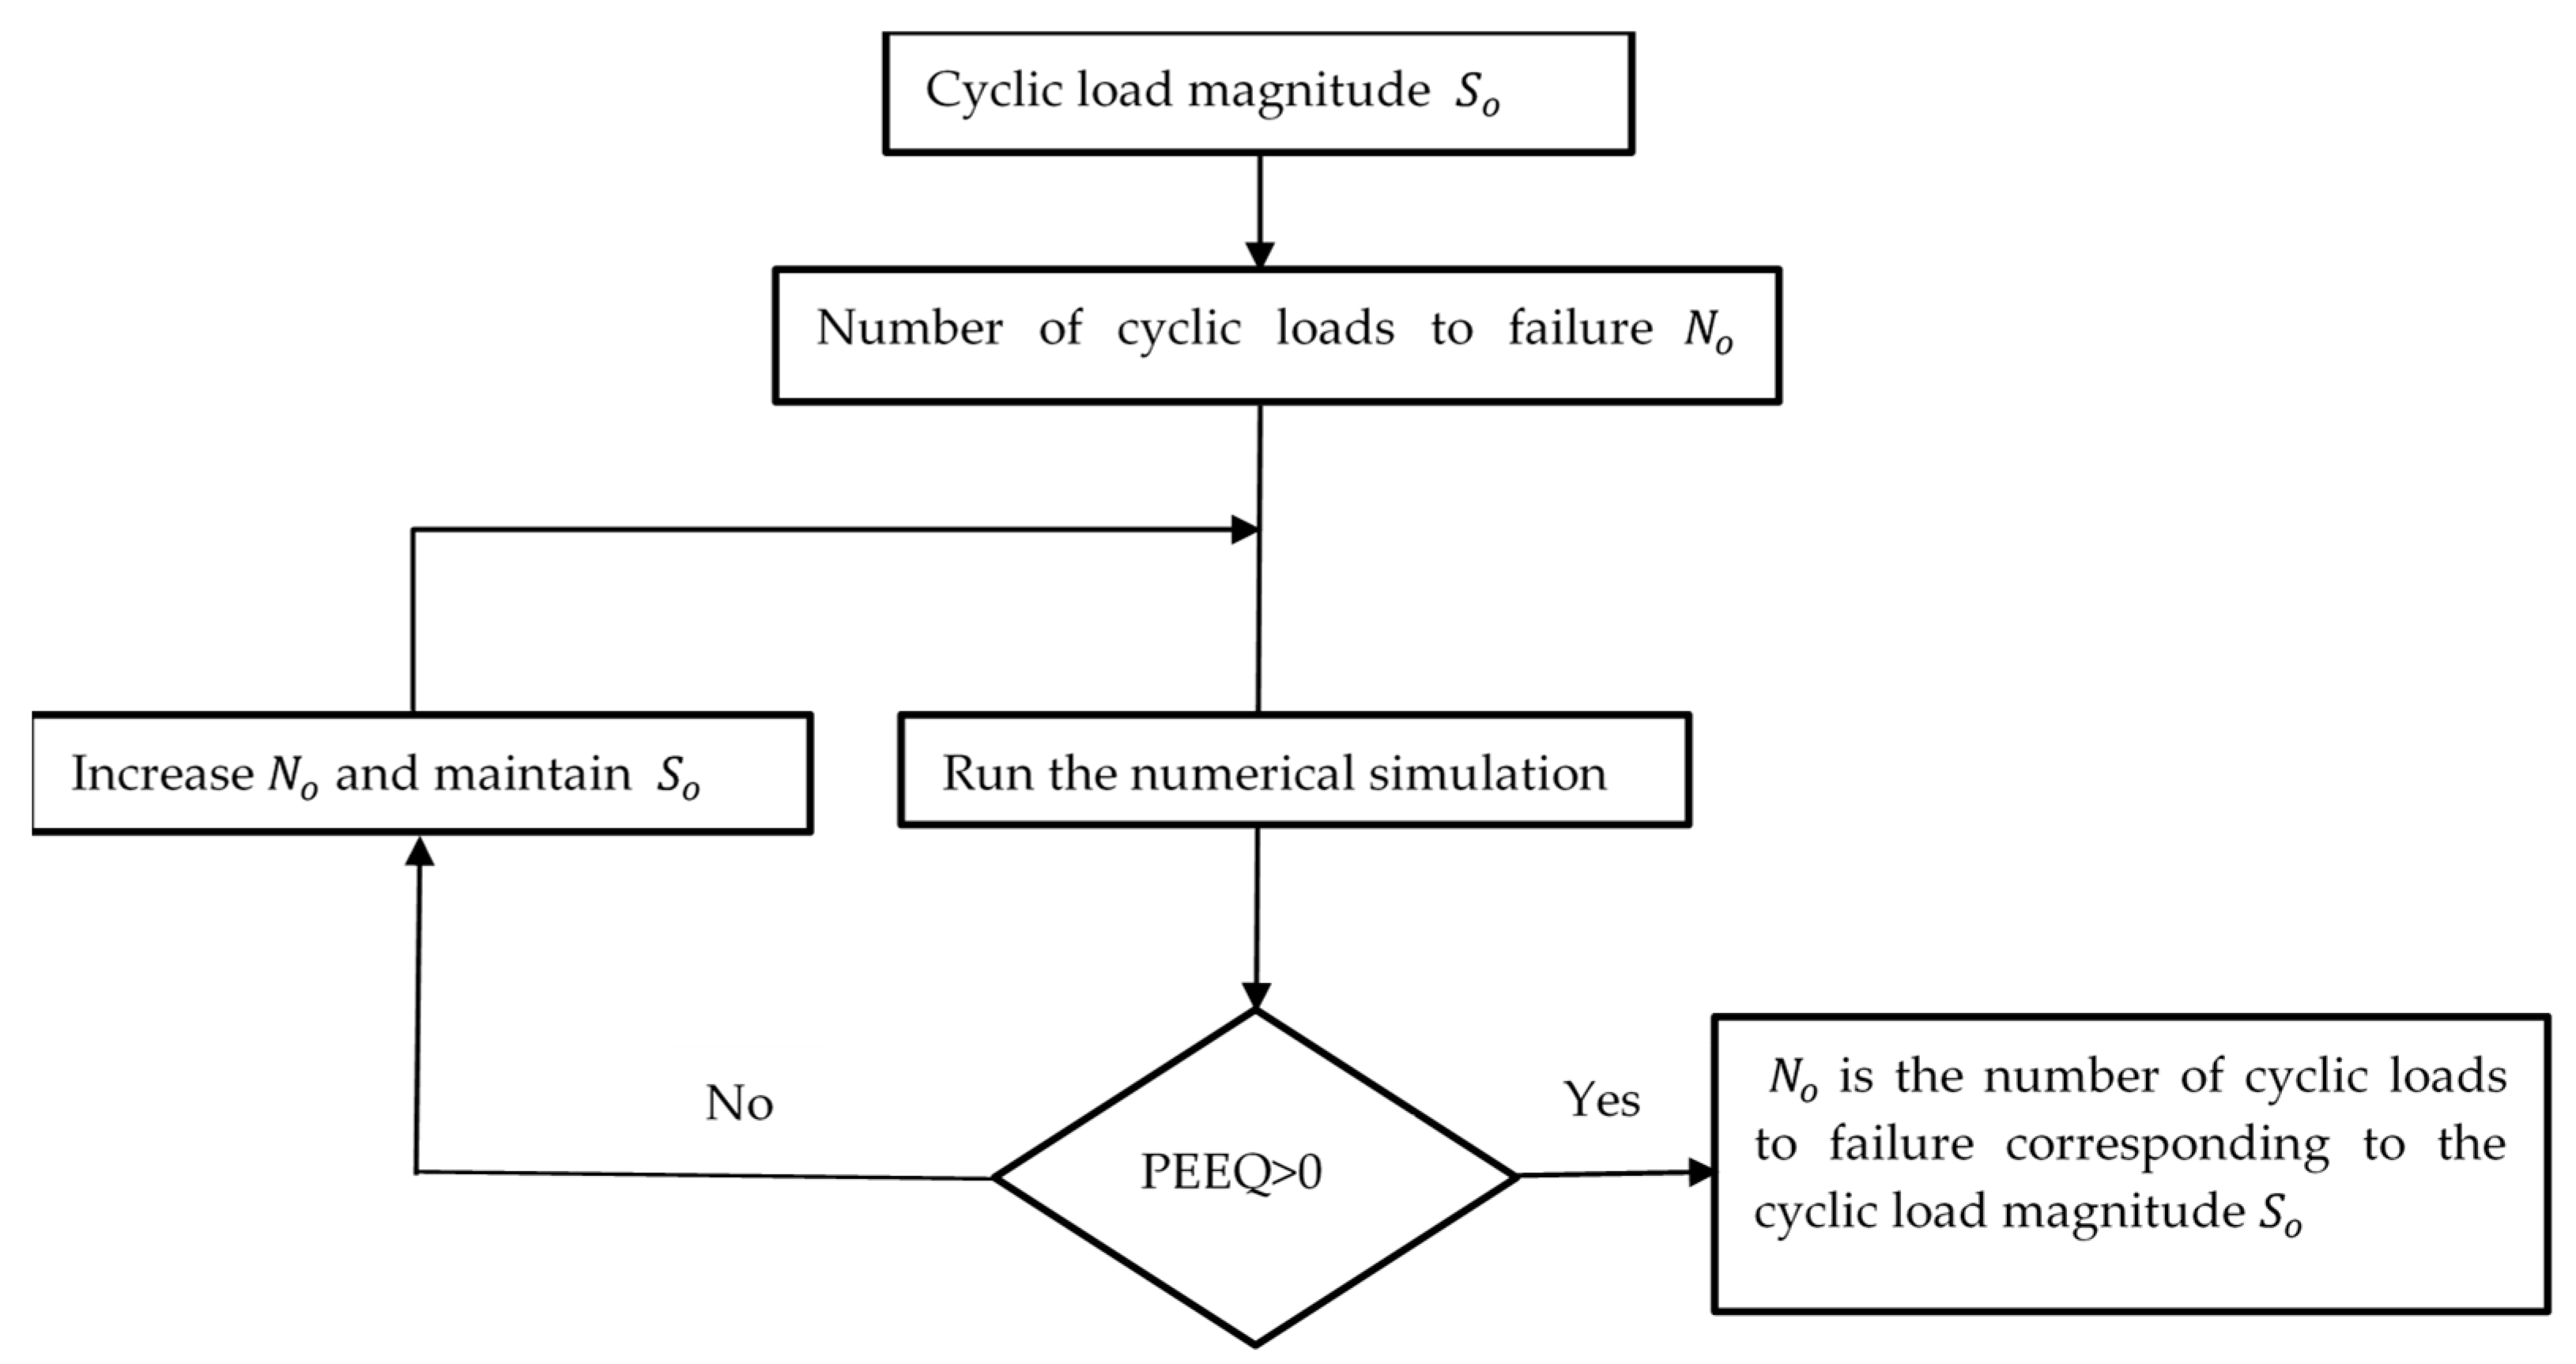
The Mohr Coulomb plasticity model is used to investigate the post elastic behavior of the rock. The shear failure of the rock is assumed to occur when the Plastic Element Equivalent strain (PEEQ) is greater than zero. The detailed algorithm of the establishment of the S-N curve is given in
Figure 5.
By applying the different steps of the flow chart given in
Figure 5, using the parameters provided in
Table 1, different number of cyclic loads to failure
are obtained for successive decreasing values of cyclic load magnitudes
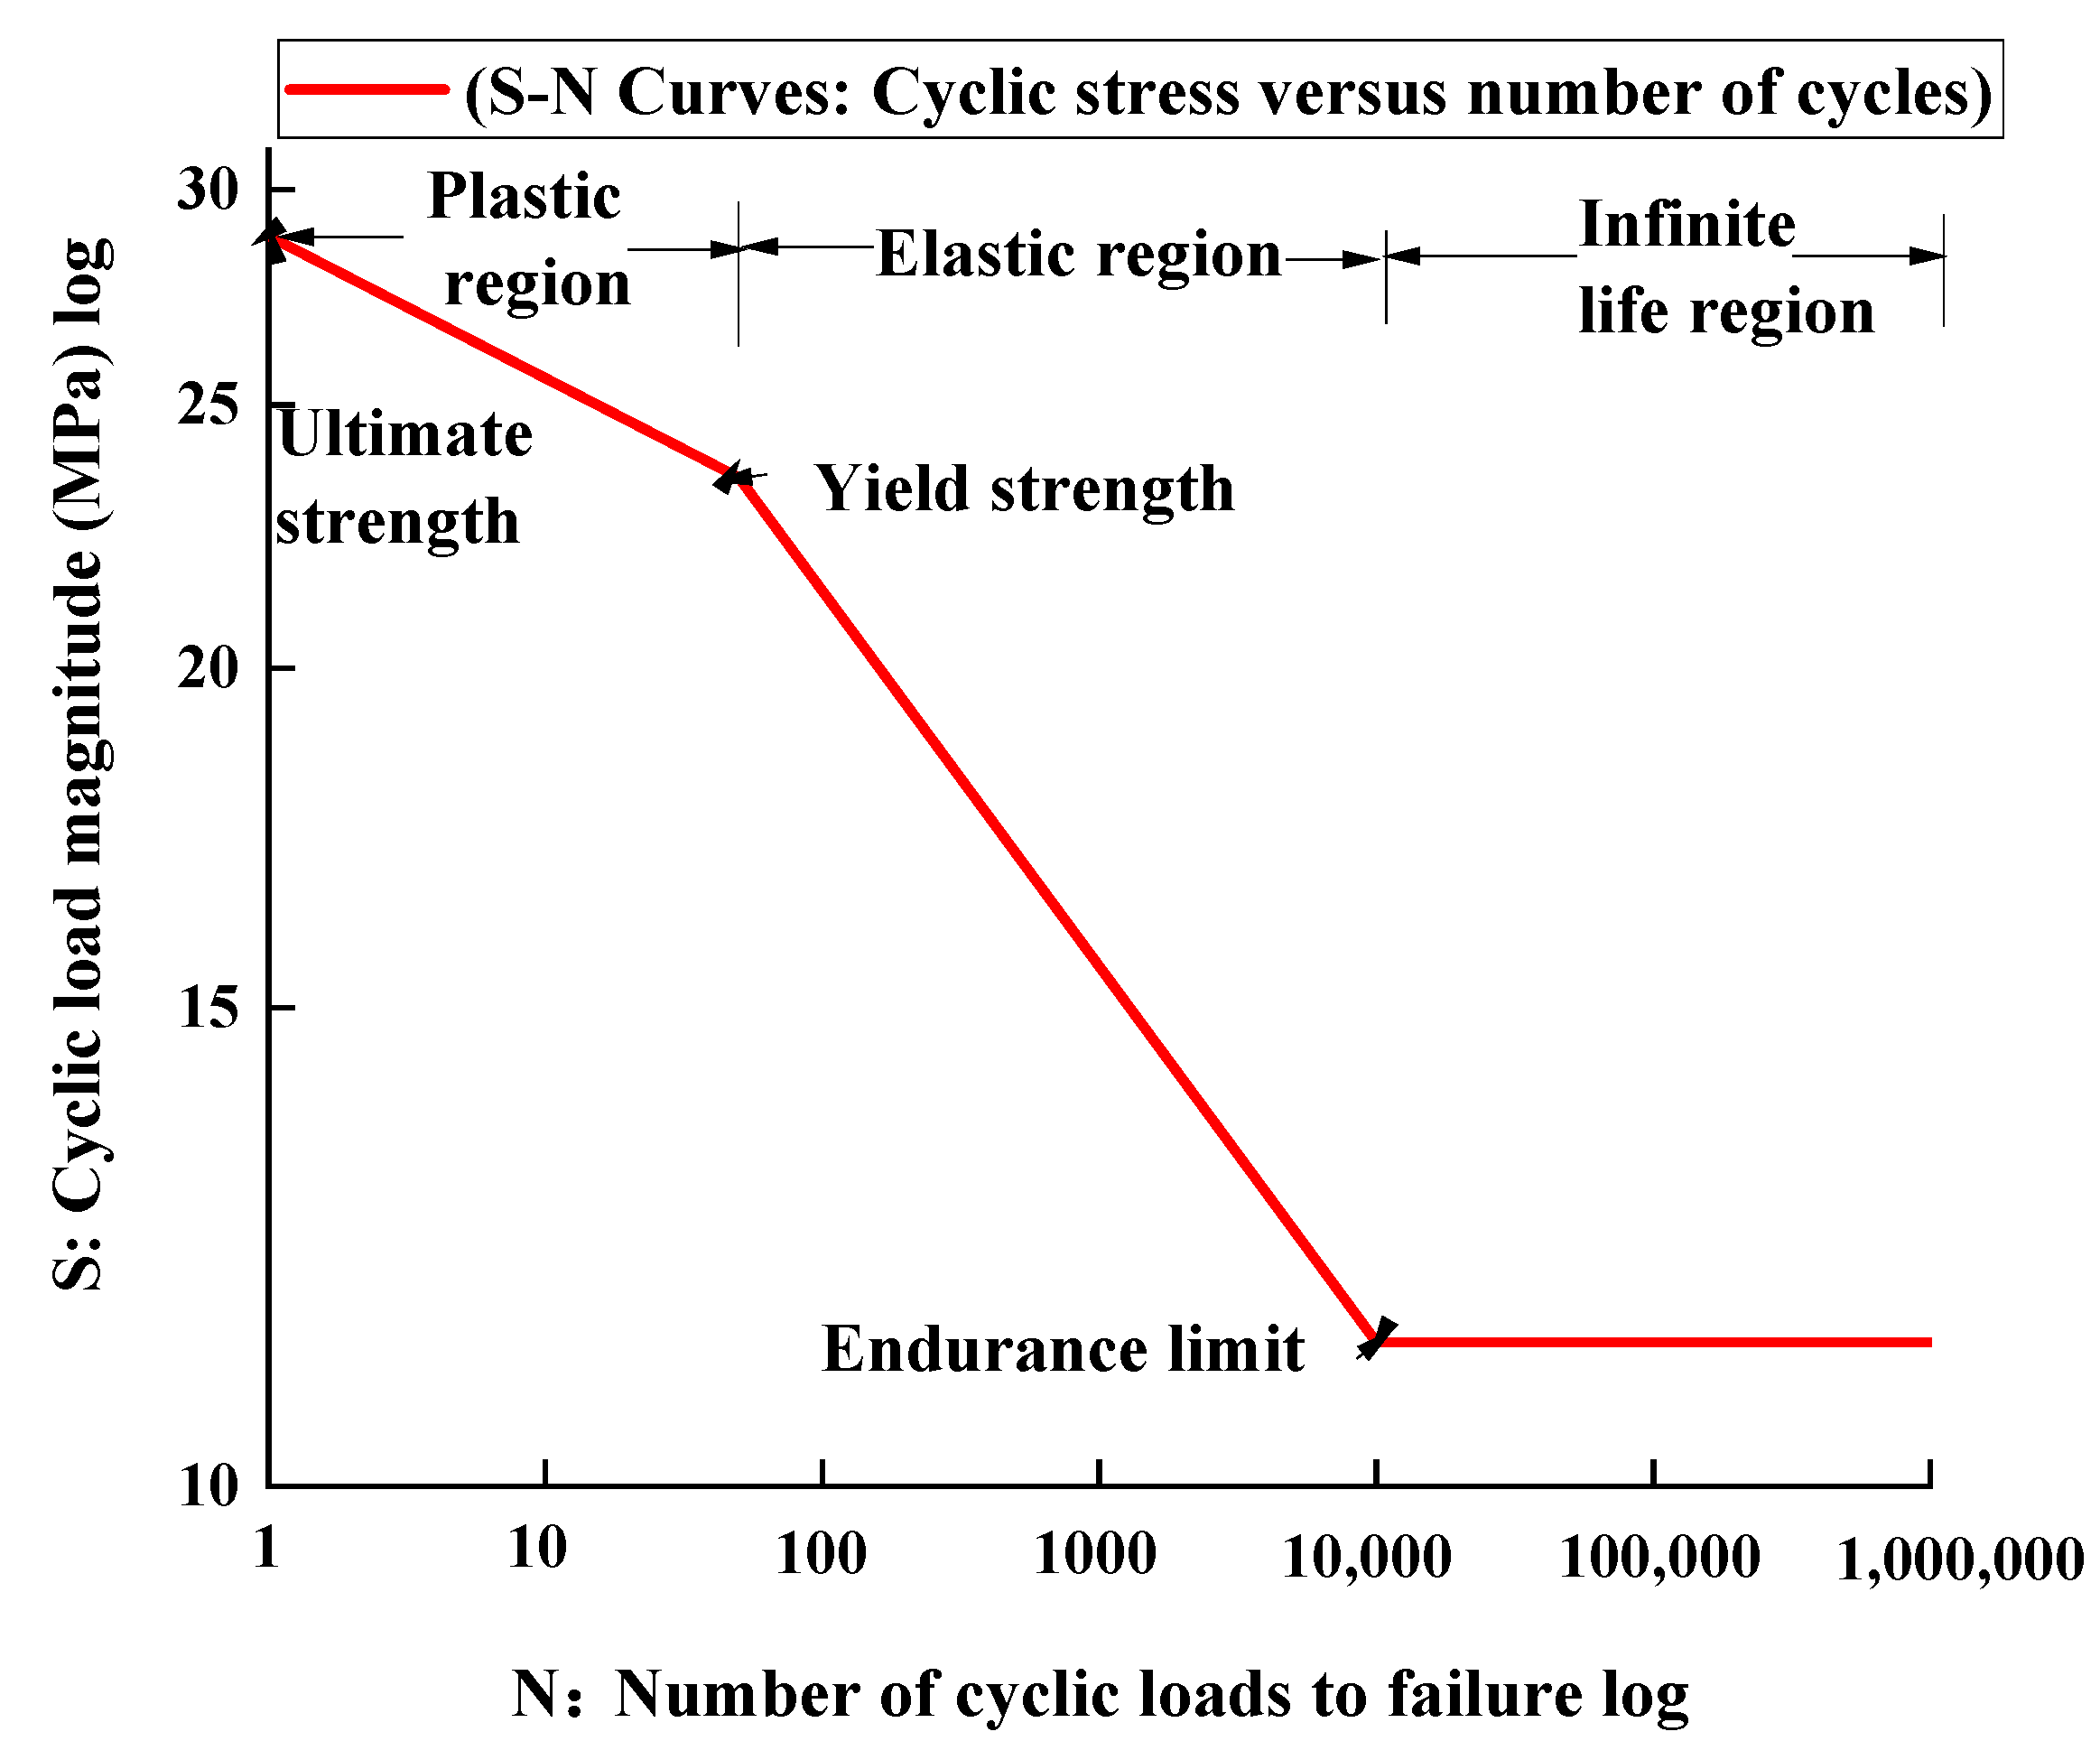
. The results obtained are plotted in the S-N curve presented in
Figure 6. It is observed that the cyclic load magnitude (S) decreased with the number of cyclic loads to failure (N). Each cyclic load generates a decohesion of the matrix formation. Therefore, the greater the magnitude of the cyclic load, the smaller the number of cyclic loads required to fail the rock. These results are in agreement with the results of other researchers [
8,
33,
34].
It is equally noticed that the S-N curve encompasses three regions: the plastic region, the elastic region and the infinite life region. In the infinite life region, the natural rock formation did not fail even if the rock formation is subjected to an infinite number of cyclic loads. The elastic region is the region where the material recovers its initial position after the cyclic load is released. In the plastic region, the rock material undergoes permanent deformation. In this region, few cyclic loads with high stress amplitude are sufficient to fail the rock formation. The different regions of the S-N curve are separated with three threshold values. The ultimate strength of the rock (28.85 MPa) is the magnitude of the cyclic load for which the rock fails after one cyclic load. The yield strength (23.5 MPa) is at the limit between the plastic region and the elastic region. Below a specific magnitude of the cyclic load called the endurance limit of the rock (11.3 MPa), the rock did not fail even if the number of cyclic loads is increased.
Numerous authors in the literature have assumed that the endurance limit of the rock is reached for a normalized ratio of the magnitude of the cyclic load
to the monotonic strength
equals to 0.7 [
15]. In this paper, it can be observed that the endurance limit of the rock formation is reached for a normalized ratio equals to 0.33 (the monotonic strength of the rock equals 34.62 MPa). In the literature, most of the
S-
N curves were established using laboratory experiments. During the laboratory experiments, the rock specimen is only subjected to the confining pressure and the axial deformation pressure. In the numerical simulation conducted in this paper, apart from the confining pressure and the axial deformation pressure, loss circulation which occurs at the fracture wall is also taken into consideration using the pipe elements theory. This loss circulation globally weakens the rock formation and diminishes the strength of the rock formation. After reduction of the strength, the magnitude of the cyclic load necessary to fail the rock is also reduced and finally the normalized ratio is therefore smaller than the ratio present in the literature.
6.2. Development of the Wellbore Natural Fracture for Different Cyclic Load Magnitude and Constant Number of Cylic Loads
In this section, the fracture width and fracture length evolution in function of the time for different cyclic load magnitude (
S) and constant number of cyclic loads (
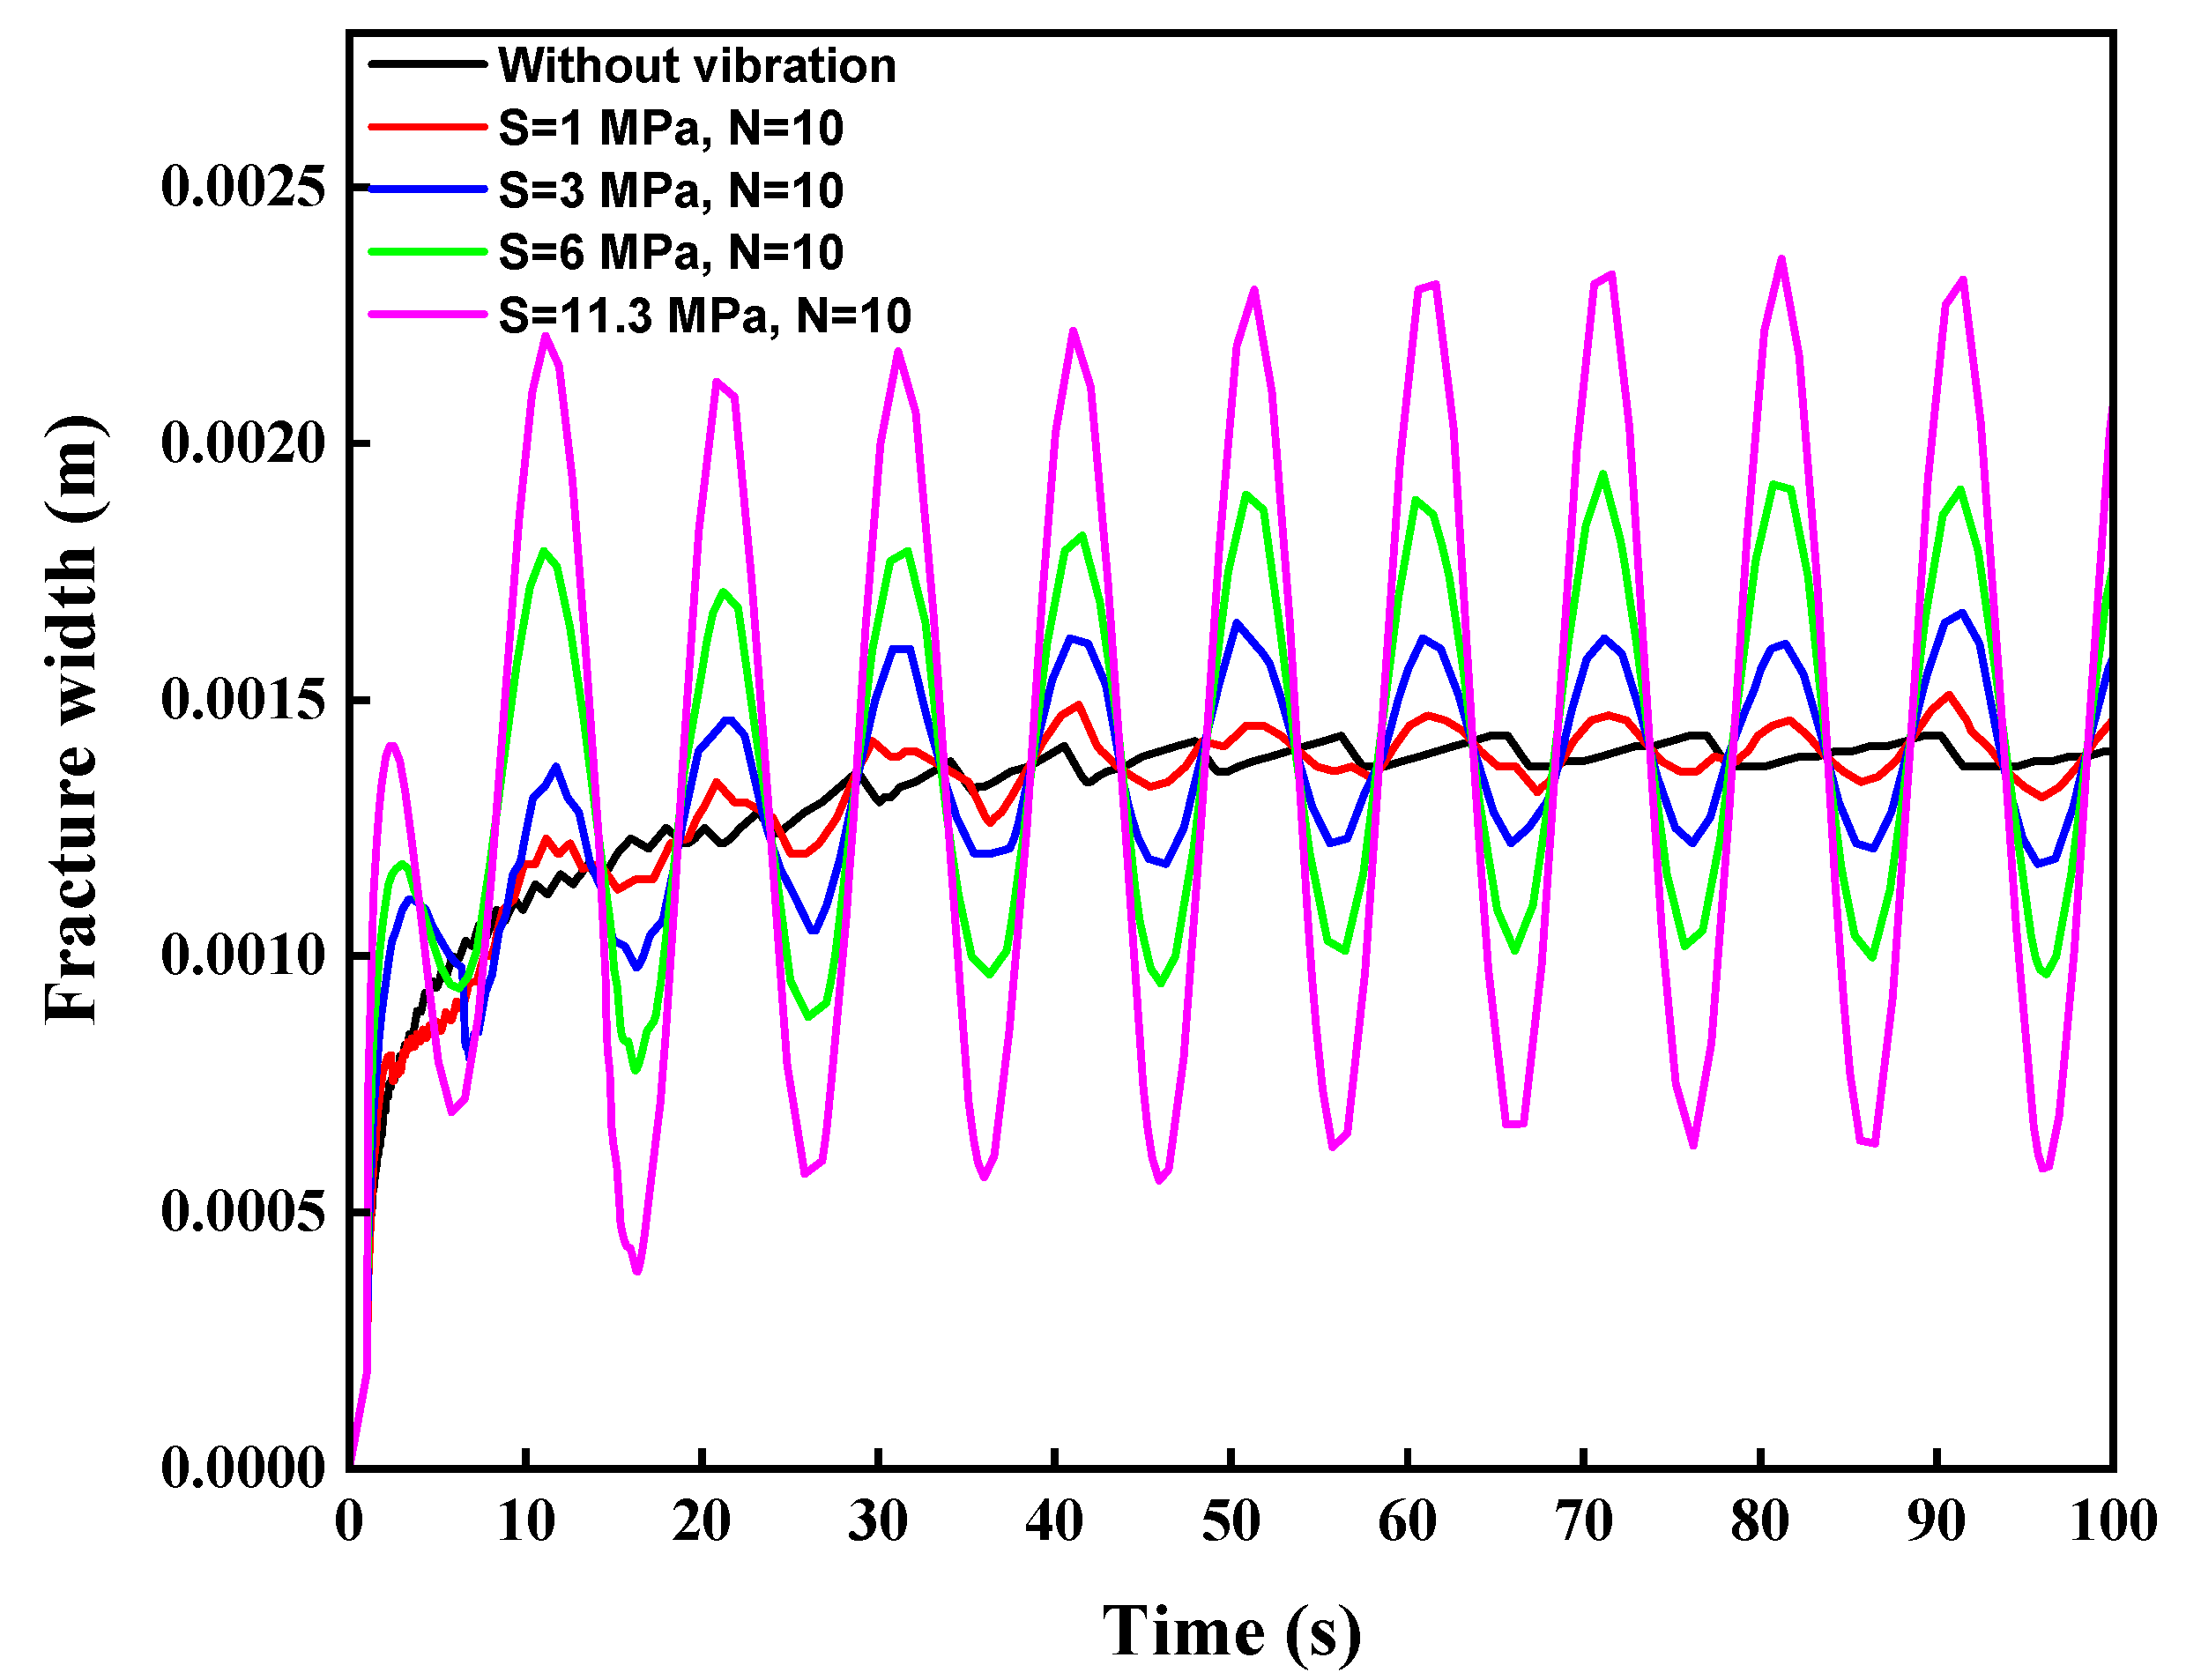
N) is investigated. It is observed in
Figure 7, that the fracture width on each profile increases with the cyclic load magnitude. The maximal value of the fracture width without vibration cyclic loads increased by 64.77% after application of cyclic loads with parameters
S = 11.3 MPa and
N = 10. Equally, the profile of the fracture width without vibration is almost smooth, then, for different increasing cyclic load magnitude, the fracture width as a function of time profiles follows a sinusoidal behavior similar to the drill string vibration cyclic loads profile. The drill string vibration cyclic loads which are hitting the wellbore surface generate a decohesion in the preexisting wellbore natural fracture, then, the trend of the opening and closure of the wellbore natural fracture in function of the time also follows the trend of the drill string vibration oscillating profiles. Other studies in the literature have also highlighted the decohesion of the rock structure caused by the drill string vibration cyclic load [
8,
12,
15].
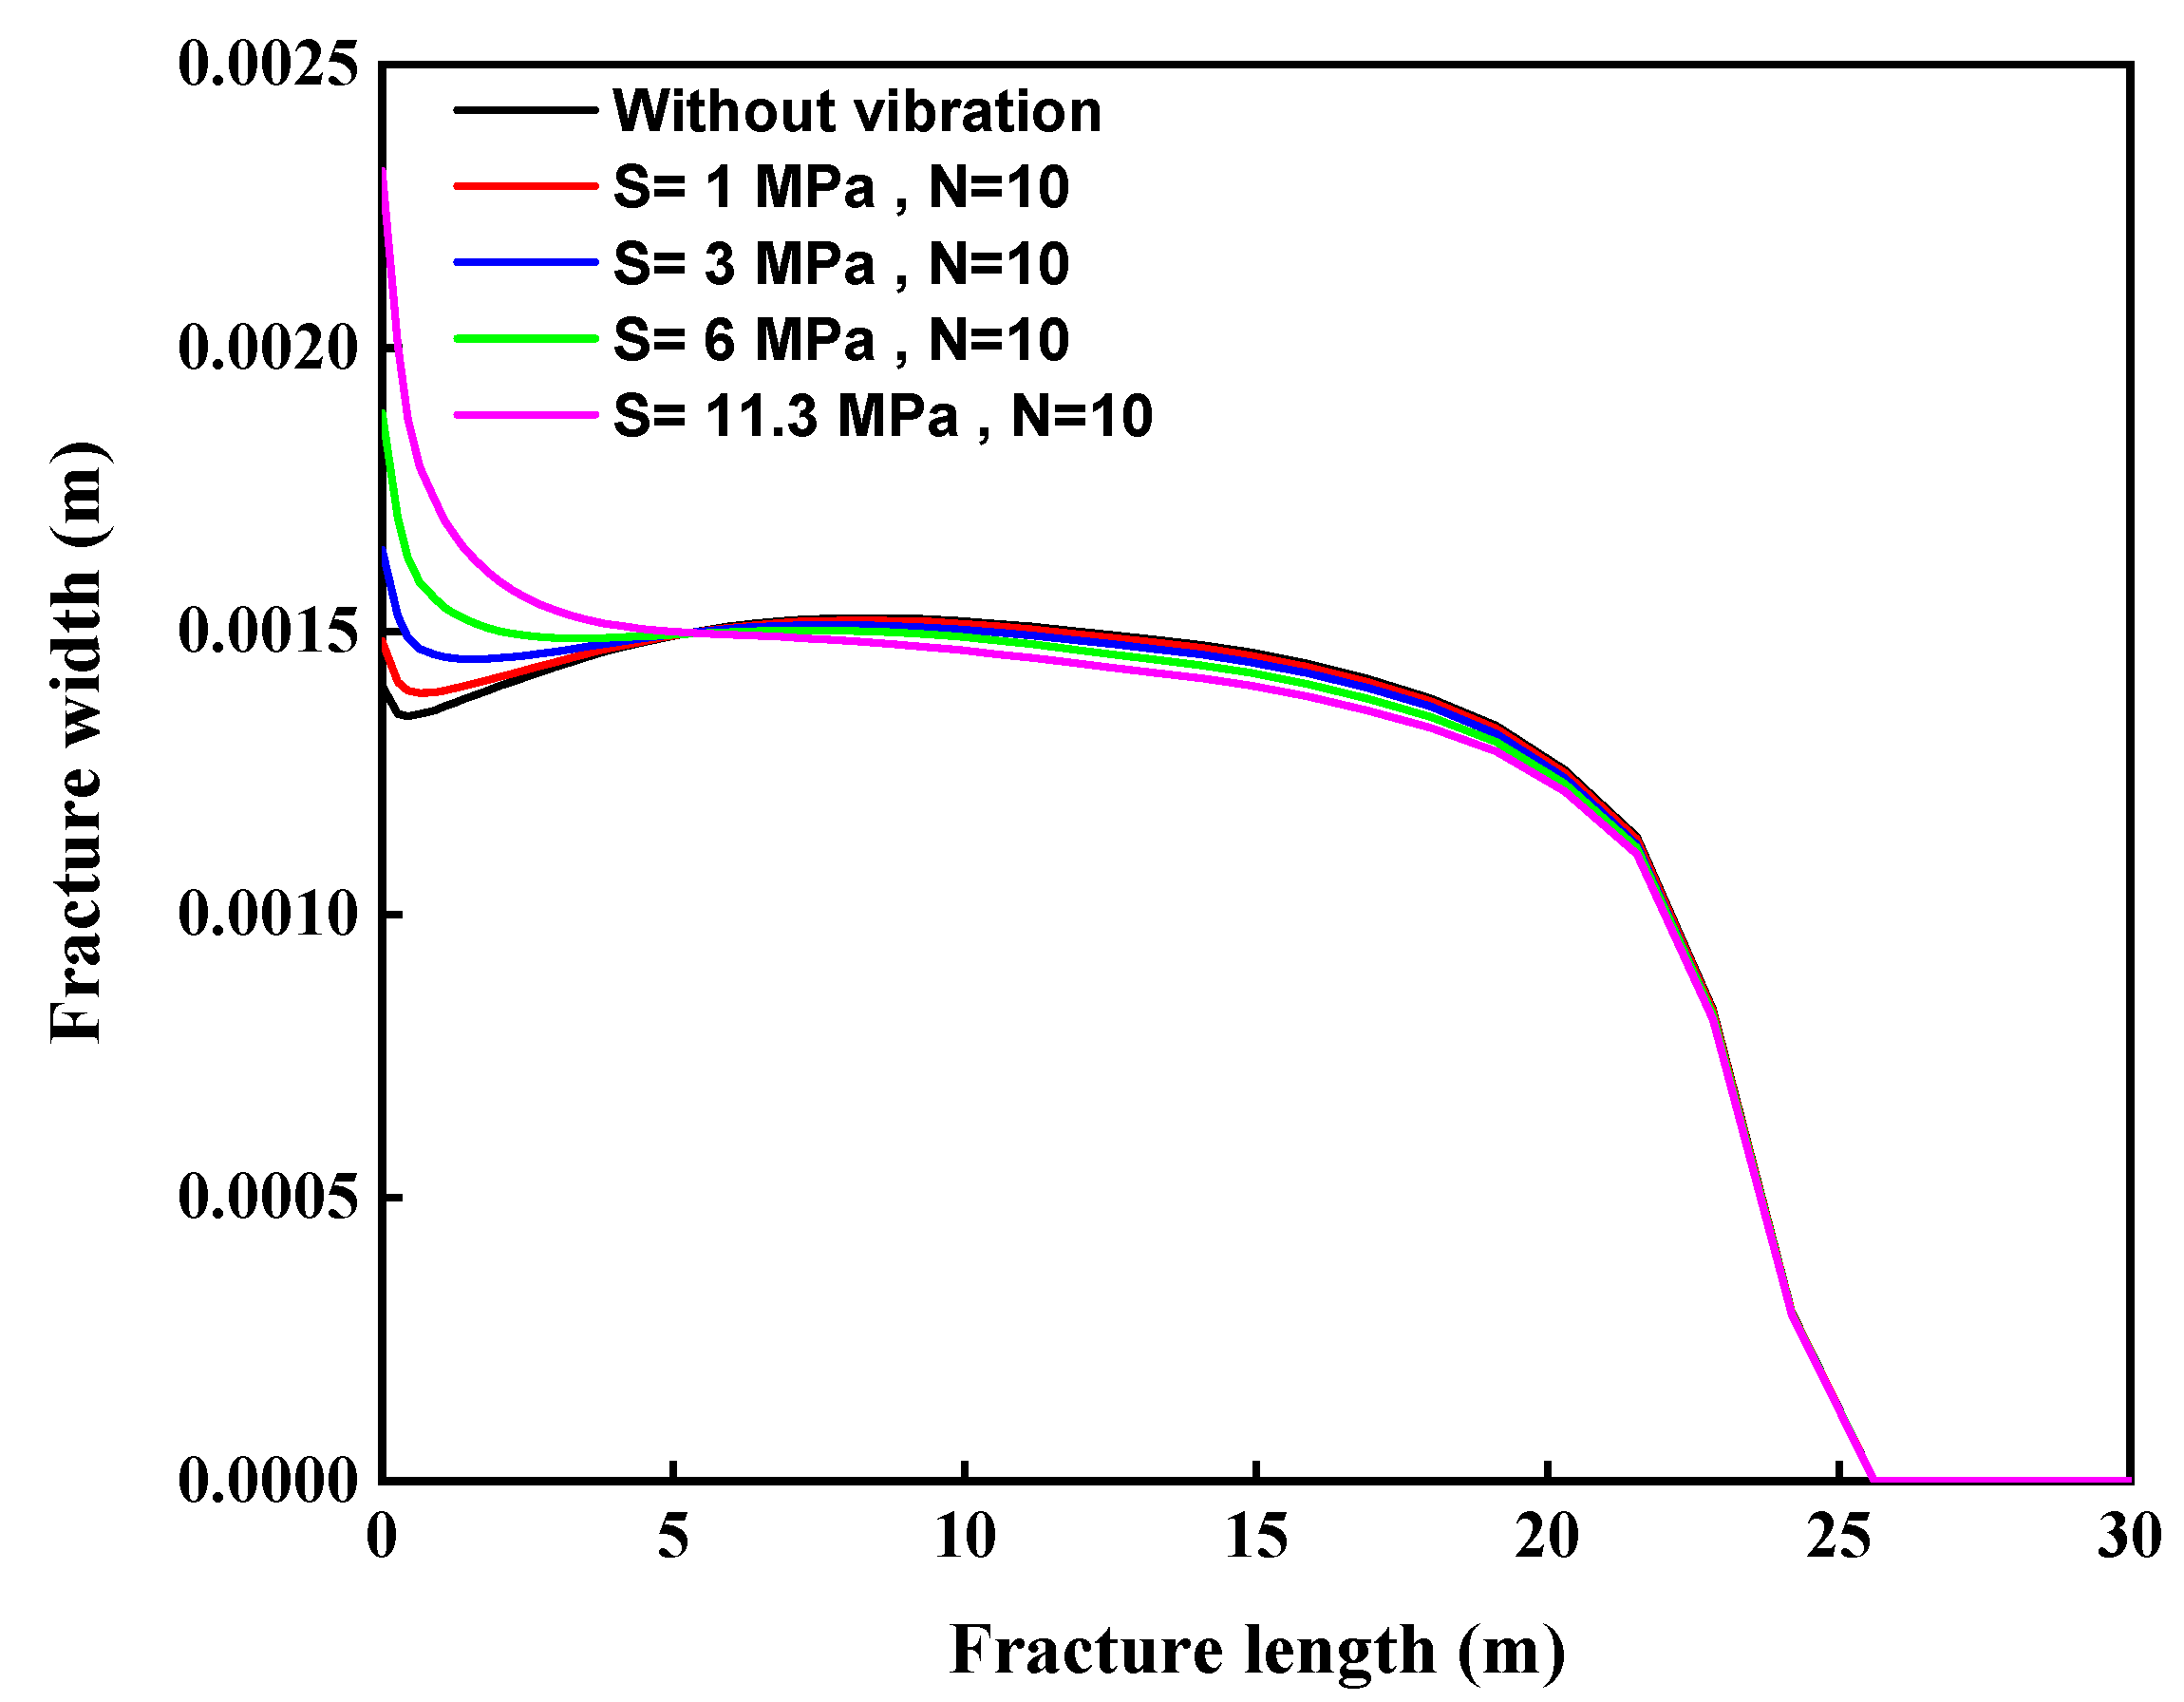
The fracture width evolution as a function of the fracture length for different cyclic load magnitude and constant number of cyclic loads is presented in
Figure 8. The results show that the values of the fracture width decreased with the increase of the fracture length due to the leakage of the fracturing fluid from the fracture into the surrounding rock. Equally, for different increasing cyclic load magnitude and constant number of cyclic loads: (i) The fracture width increased with fracture length in the near wellbore region (fracture length less than 5.16 m; (ii) For fracture length between 5.16 m and 22.83 m, the fracture width decreased with the fracture length and (iii) for fracture length greater than 22.83 m, the profiles of the fracture width in function of the fracture length remain the same.
The fluid pressure inside the fracture is highest near the wellbore, therefore, a larger fracture width in that region is also expected. Nevertheless, stress concentration around the wellbore is generally observed during drilling operations due to the excavation of the rock from the formation. Although, the drilling mud is utilized to redistribute stresses around the wellbore and ensure wellbore stability, this redistribution is not instantaneous. Since the time simulation of this modeling is relatively small (t = 100 s), therefore stress concentration is always observed around the wellbore at the final simulation stage. The stress concentration in the near wellbore region acts against the opening of the fracture resulting in smaller fracture width. The effect of stress concentration on the fracture width is alleviated after integration of different increasing cyclic loads because the cyclic loads buffeting the wellbore surface generate a decohesion of the near wellbore fracture leading to a significant increase of the fracture width with the cyclic loads.
6.3. Development of the Wellbore Natural Fracture for Constant Cyclic Load Magnitude and Different Number of Cyclic Loads
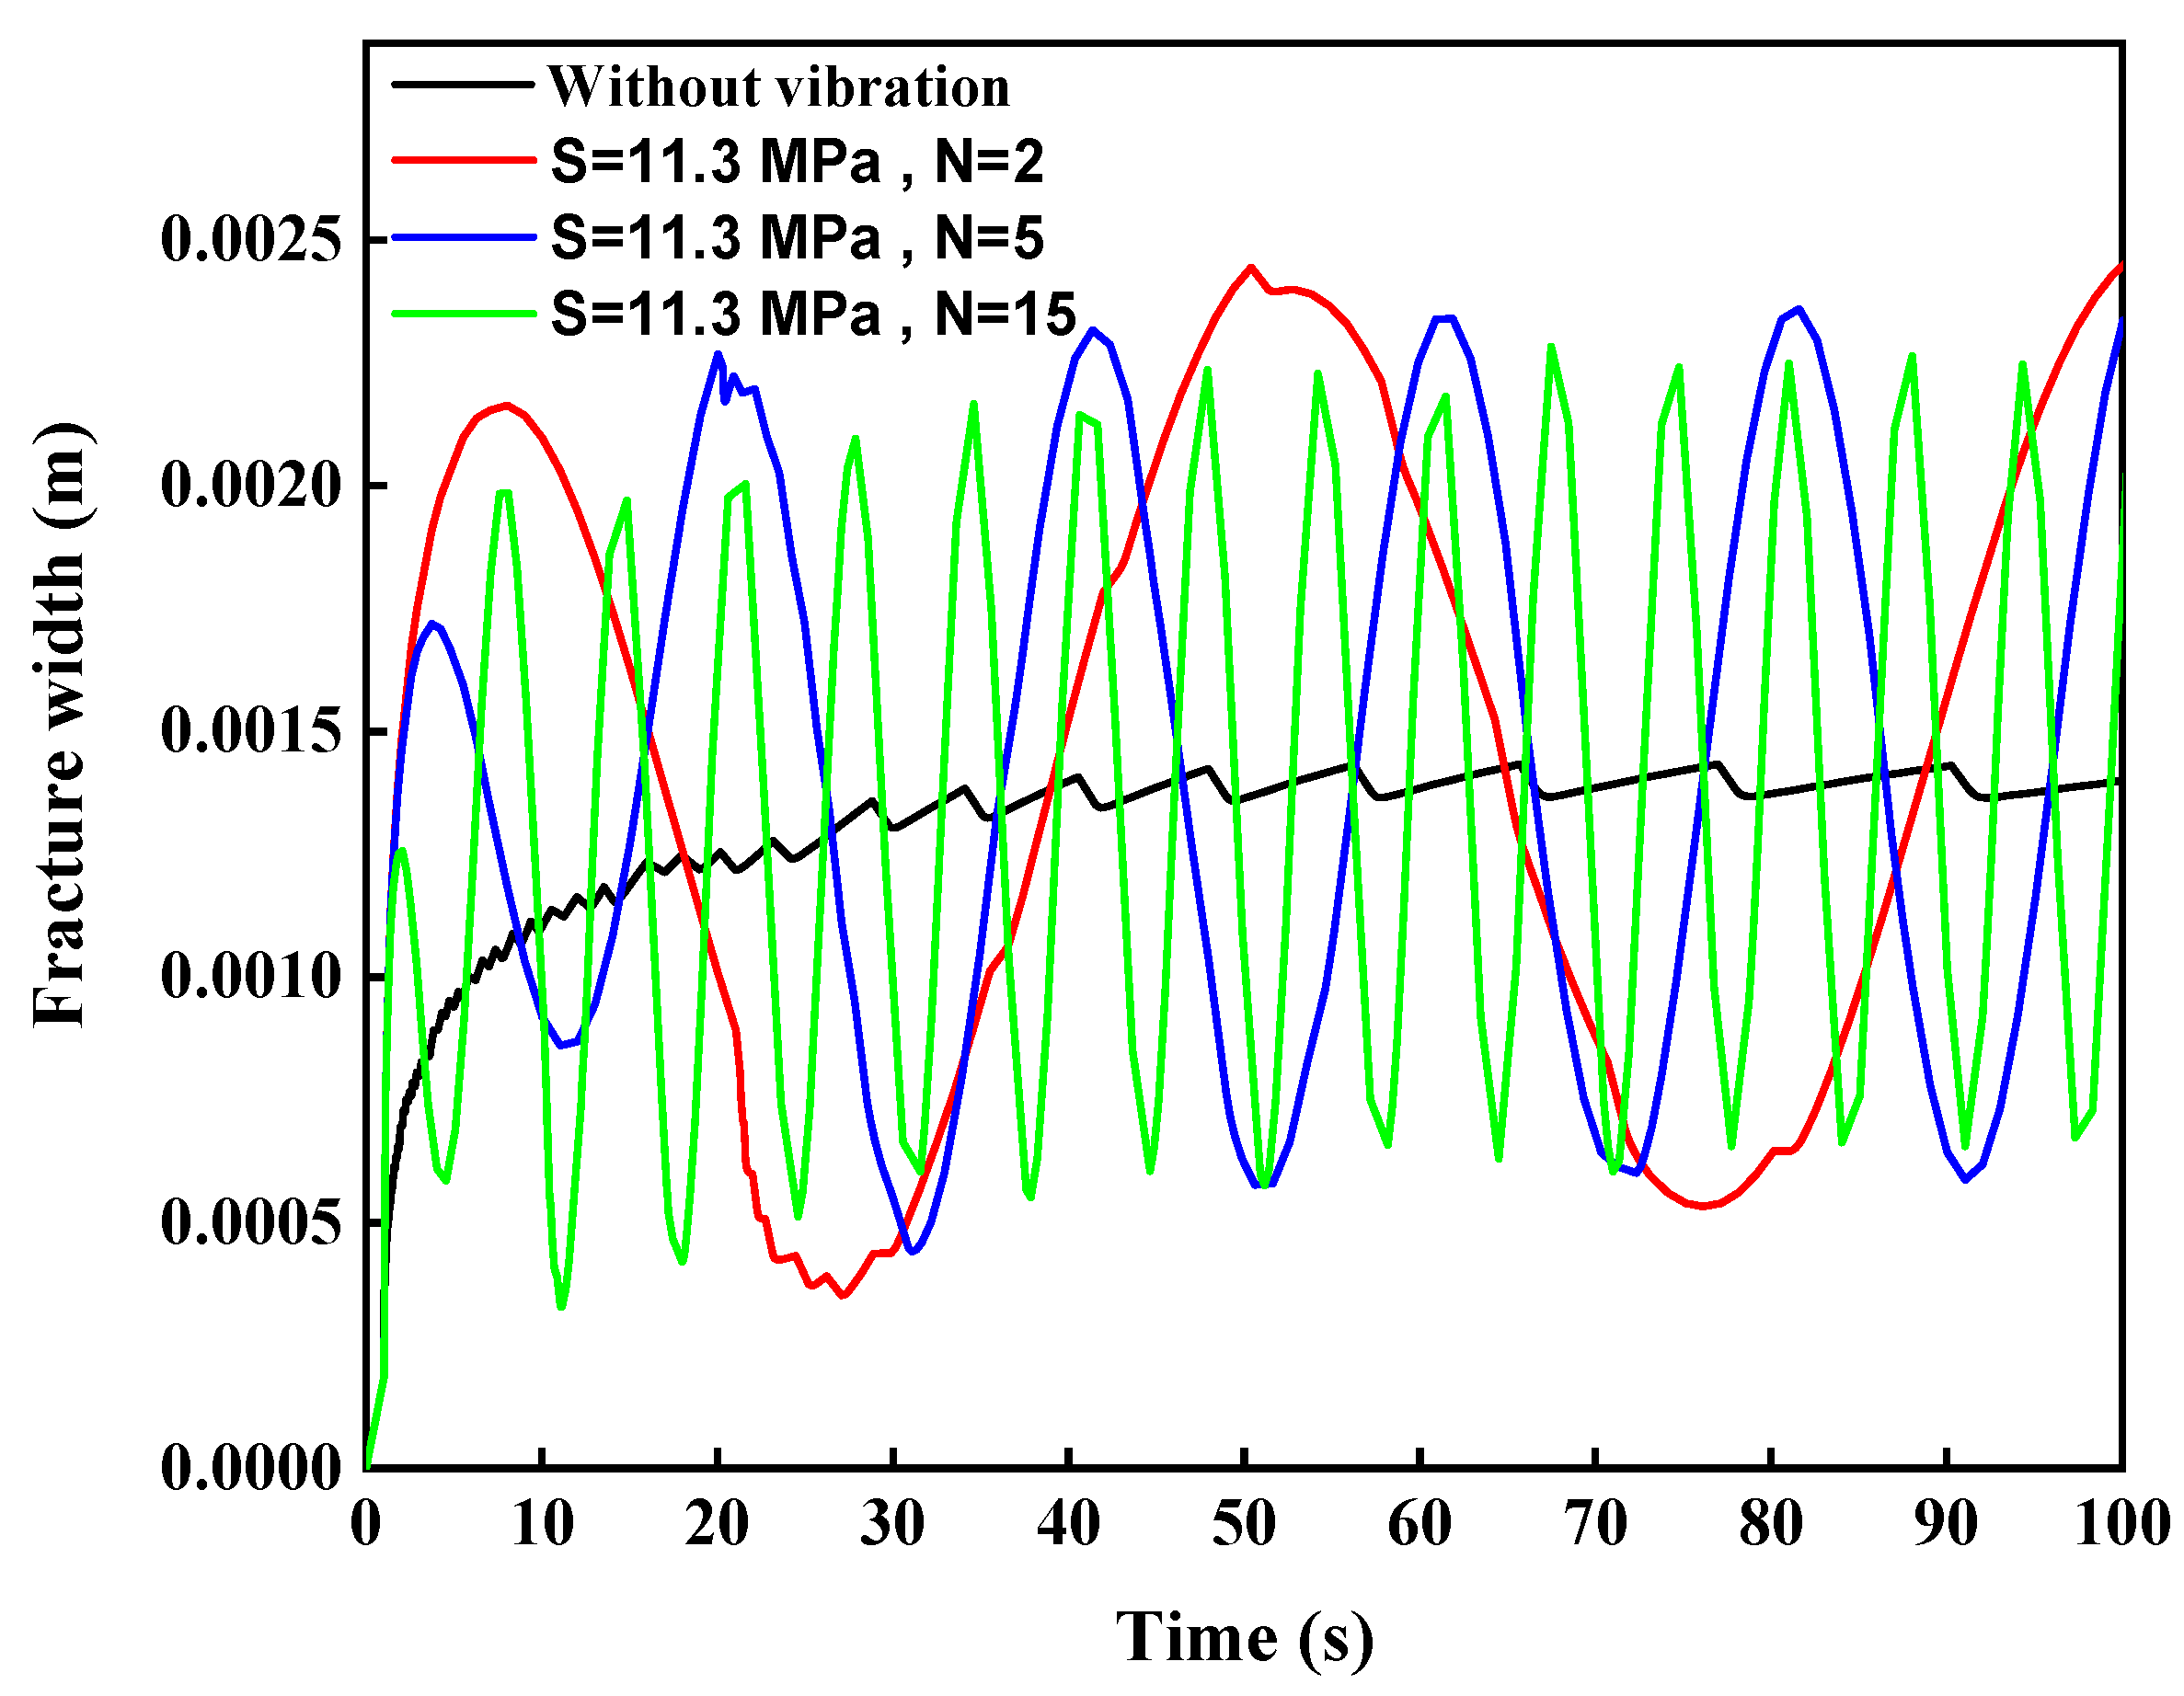
The development of the wellbore natural fracture for constant cyclic load magnitude and different number of cyclic loads is presented in this section. The results of the fracture width evolution in function of the time are shown in
Figure 9. It can be observed that the fracture width as a function of time profile without vibration is almost smooth, then for different increasing values of cyclic loads number, the fracture width as a function of time profiles follows a sinusoidal behavior similar to the drill string vibration cyclic loads profile. The fracture width without vibration cyclic loads also increased after application of the drill string vibration cyclic loads (an increase of 63.12% of the fracture width without vibration was observed after application of cyclic loads with parameters
S = 11.3 MPa and
N = 15). However, contrary to the case of the evolution of the fracture width in function of the time for different cyclic load magnitude and constant number of cyclic loads where the maximal values of the fracture width on each profile were increasing with the cyclic load magnitude, it is observed in this case that the maximal values of the fracture width on each profile are almost the same when the cyclic load magnitude is constant but it is the oscillating period of the fracture width which increases due to the increase of the number of cyclic loads.
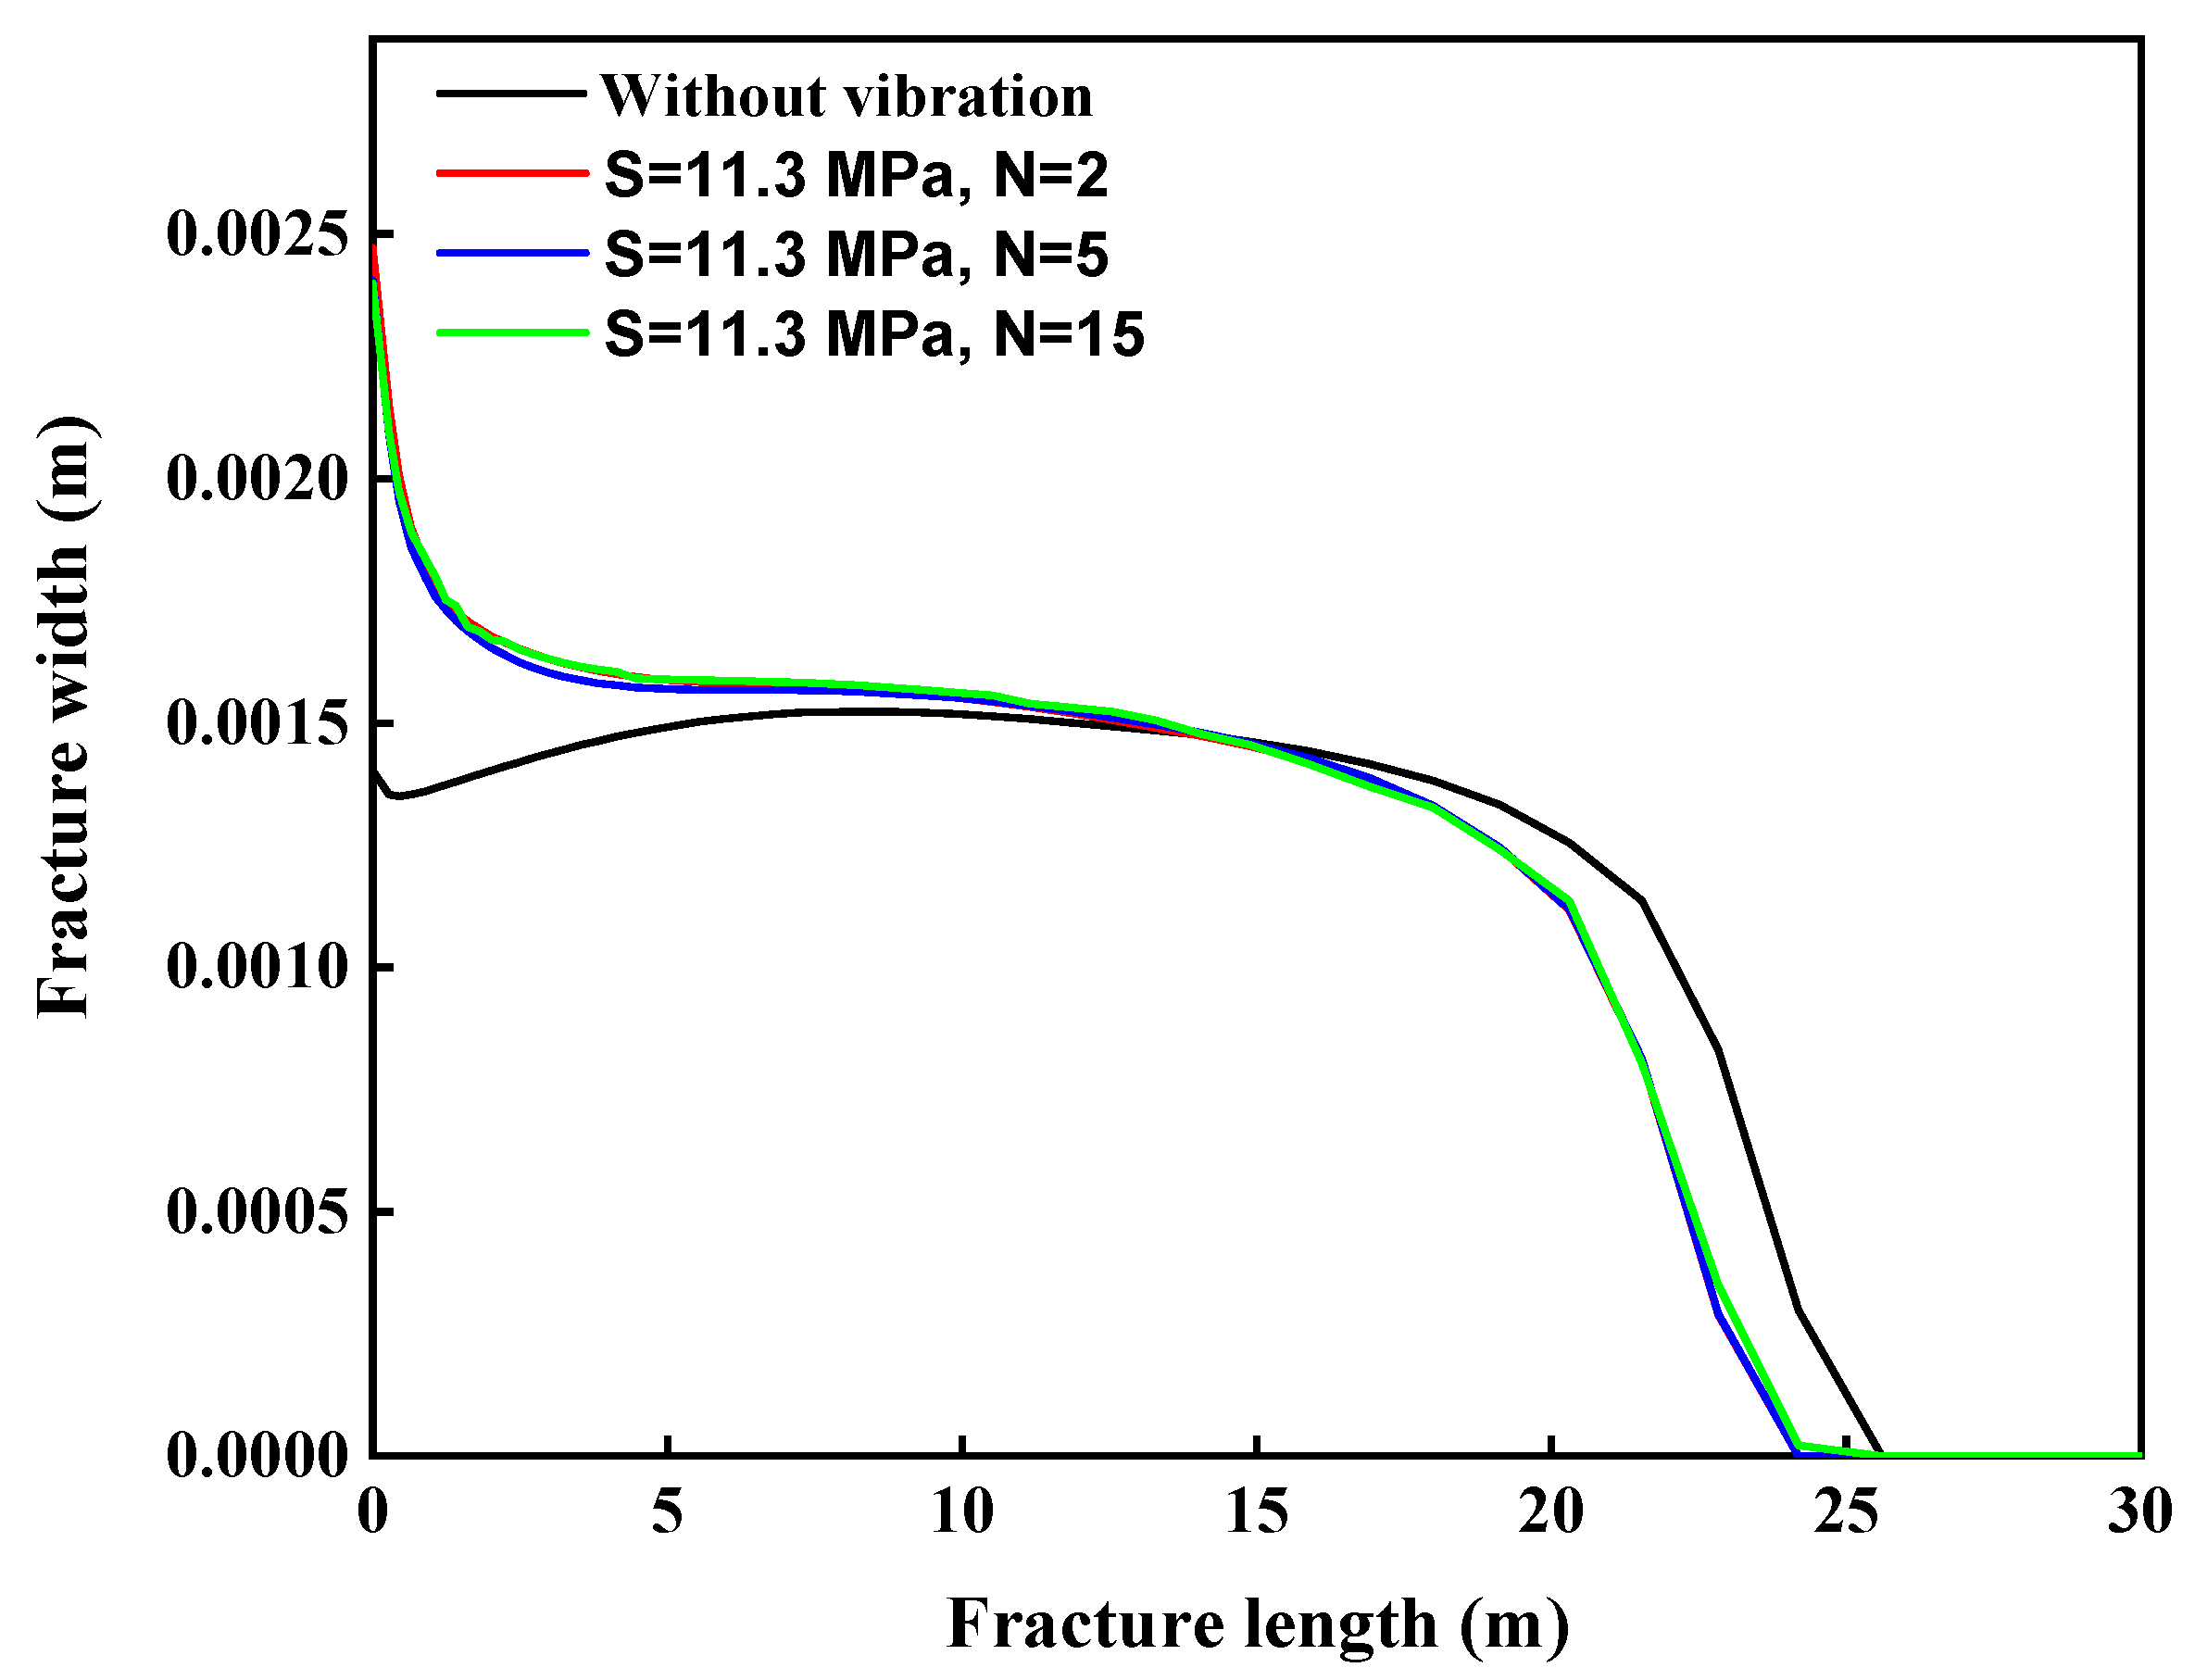
The fracture width evolution as a function of the fracture length for different number of cyclic loads and constant cyclic load magnitude is presented in
Figure 10. The results show that the fracture width profiles are almost the same for different increasing number of cyclic loads and constant cyclic load magnitude. The fracture width decreased with the increase of the fracture length due to the seepage of the fracturing fluid from the fracture into the rock. Equally, the fracture width increased after implementation of drill string vibration with constant cyclic load magnitude and different number of cyclic loads.
At the wellbore surface, the fracture width without vibration cyclic loads increased by 70.96% after application of cyclic loads with parameters S = 11.3 MPa and N = 15.
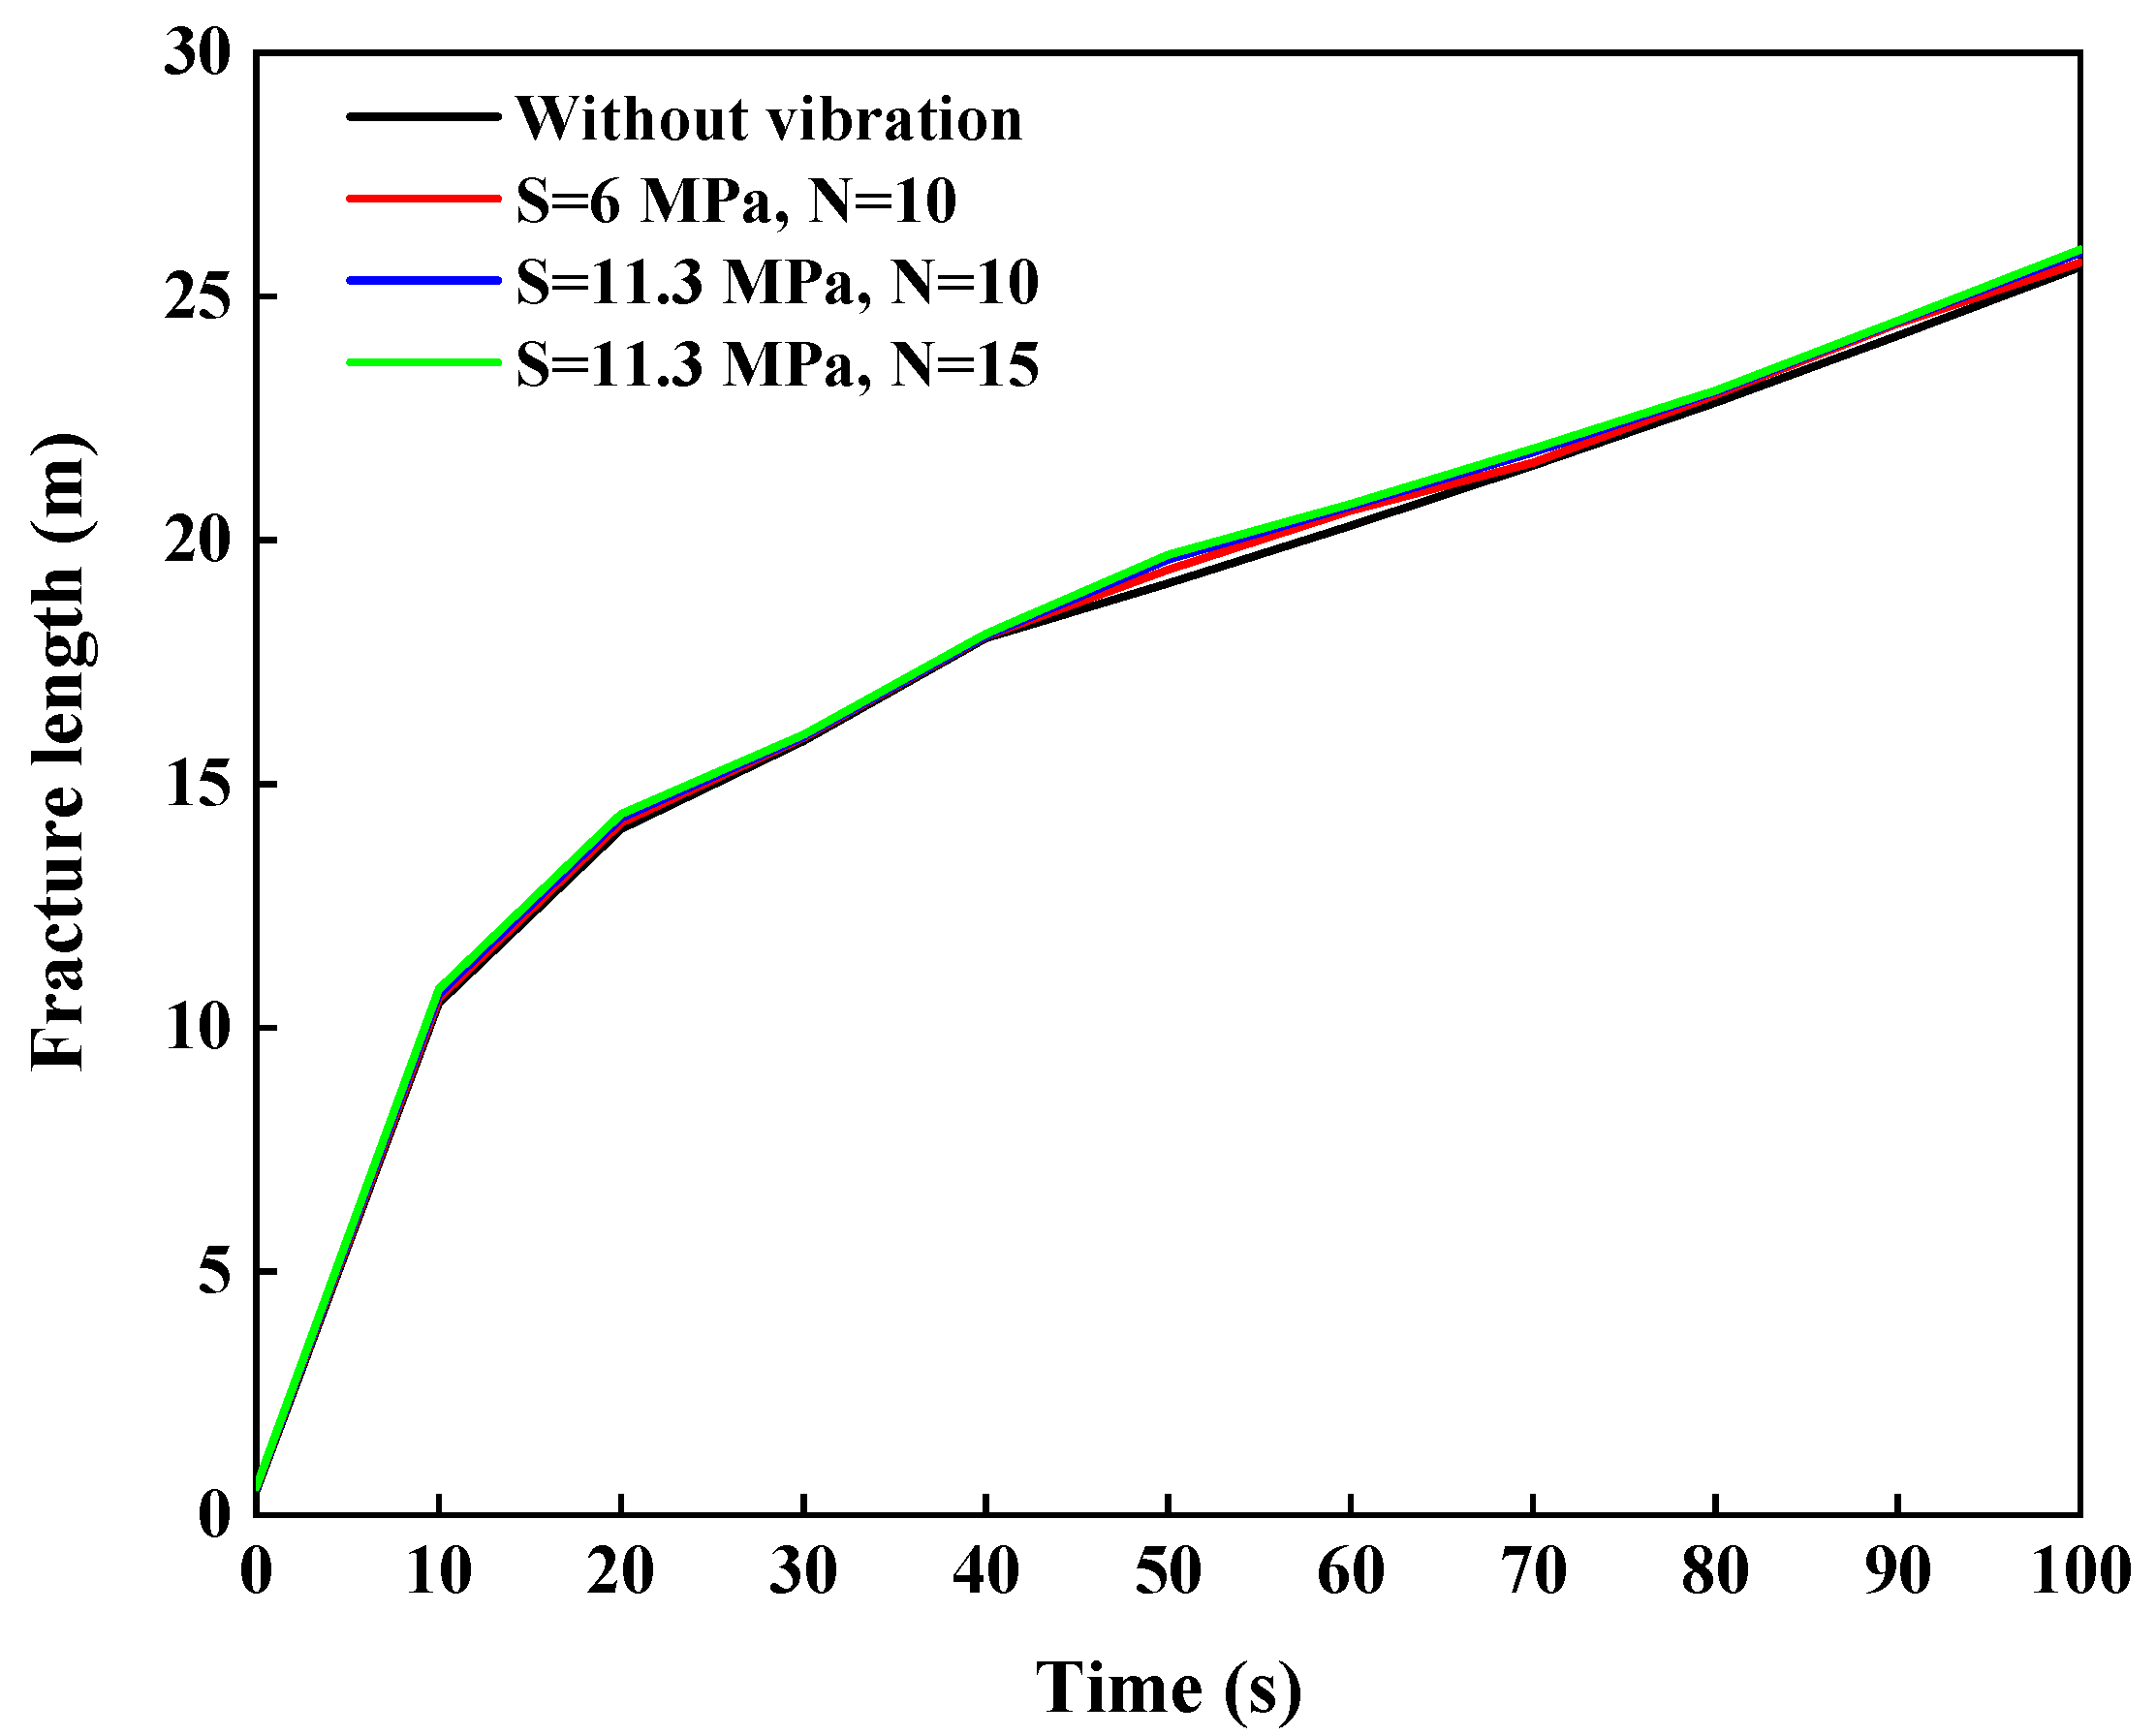
The fracture length development as a function of time is a major aspect which has been investigated in the research. Vibration cyclic loads were integrated in the system, then, fracture length was determined at different simulation time. The fracture length evolution with the time obtained after implementation of cyclic load in the model is presented in
Figure 11. The results show that the fracture length with and without vibration cyclic loads are slightly the same because the effect of cyclic load is localized only on the wellbore surface. This result demonstrates that the cyclic loads which are hitting the wellbore surface weakly affect the fracture length development. However, it should be noted that these results are obtained with a relatively small simulation time (
t = 100 s). Further studies need to be conducted to extrapolate these results with larger simulation time.
7. Discussion and Parametric Studies
In this section, parametric studies are presented to investigate the effect of other drilling operational parameters on the development of the wellbore natural fracture in considering the effect of the drill string vibration cyclic loads. The fracture width, the bottom hole pressure and the loss circulation are all measured at the fracture mouth. All the results are presented at the final stage of simulation at
t = 100 s. Discussion and parametric studies are conducted by comparing the results obtained in this paper (poro elasto plastic model coupled with drill string vibration cyclic load) with the results of the poroelastic model without drill string vibration cyclic loads [
17].
7.1. Effect of Mud Density on Fracture Development Integrating Drill String Vibration
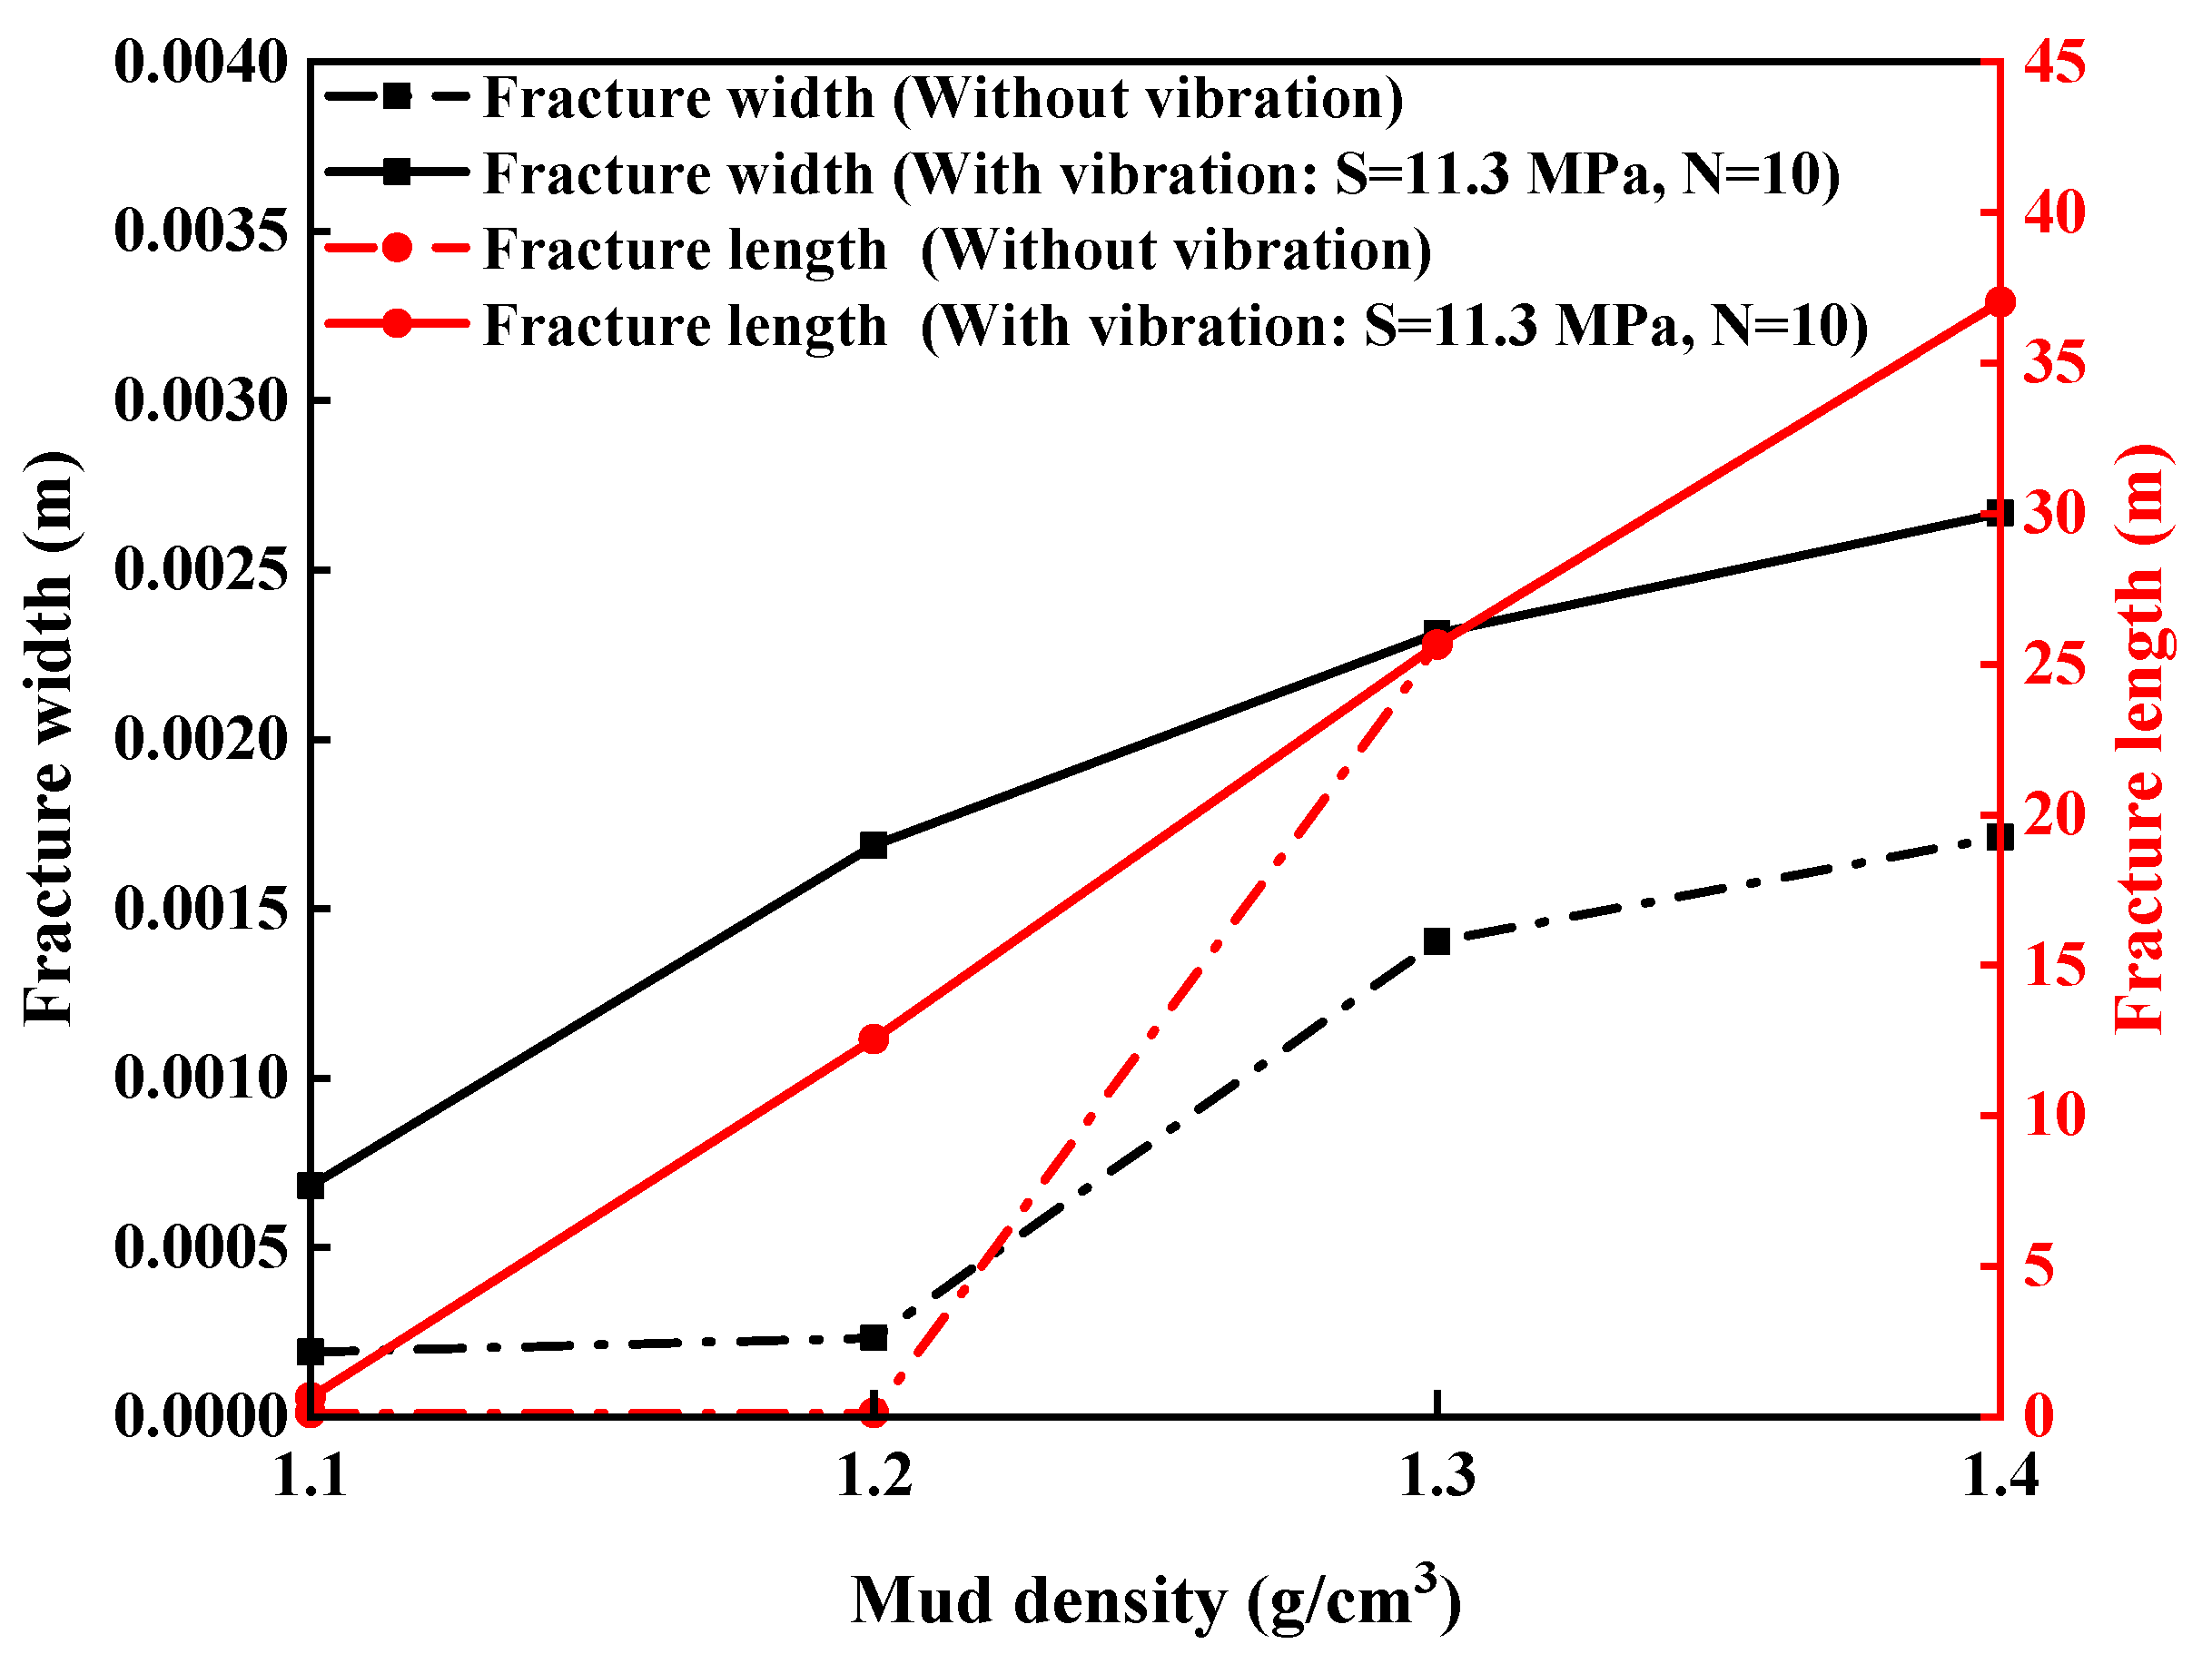
The mud density is an important drilling operational parameter which affects the wellbore stability. The results of the effect of mud density on fracture length and fracture width with and without vibration are shown in
Figure 12. The results show that for different increasing drilling mud densities, the fracture width obtained with drill string vibration are greater than those obtained without vibration due to the enlargement of the fracture width caused by the drill string vibration cyclic loads. The fracture width for example increased by 64.77% after integration of cyclic loads with parameters
S = 11.3 MPa,
N = 10 and mud density equal to 1.3
. Apart from mud density being 1.2
, the fracture length with and without vibration cyclic loads are slightly the same because the effect of the cyclic loads is more localized at the wellbore surface. Therefore, it is the width of the fracture mouth which is greatly affected by the cyclic loads, the fracture length itself does not increase too much after integrating the drill string vibration in the system.
For mud densities between 1.1 and 1.2 , the fracture length and fracture width without vibration remain equals to zero which implies that for this range of mud density, the bottom hole pressure (BHP) is not sufficient to initiate the fracture propagation. However, for this same range of mud density, the model with drill string vibration already predicts the fracture propagation because of the cyclic loads which are hitting the wellbore surface. The fracture length for example increases from zero to 12.54 m after integration of cyclic loads with parameters S = 11.3 MPa and N = 10 and mud density equal to 1.2 . These results point out the importance of the newly built model that can accurately predict the fracture growth development. In fact, the model without vibration tends to underestimate the fracture width and fracture length development. This underestimation can lead to several problems such as the inaccurate selection of the particle size dimension (PSD) necessary to plug the natural fracture and maintain the wellbore stability during drilling operations.
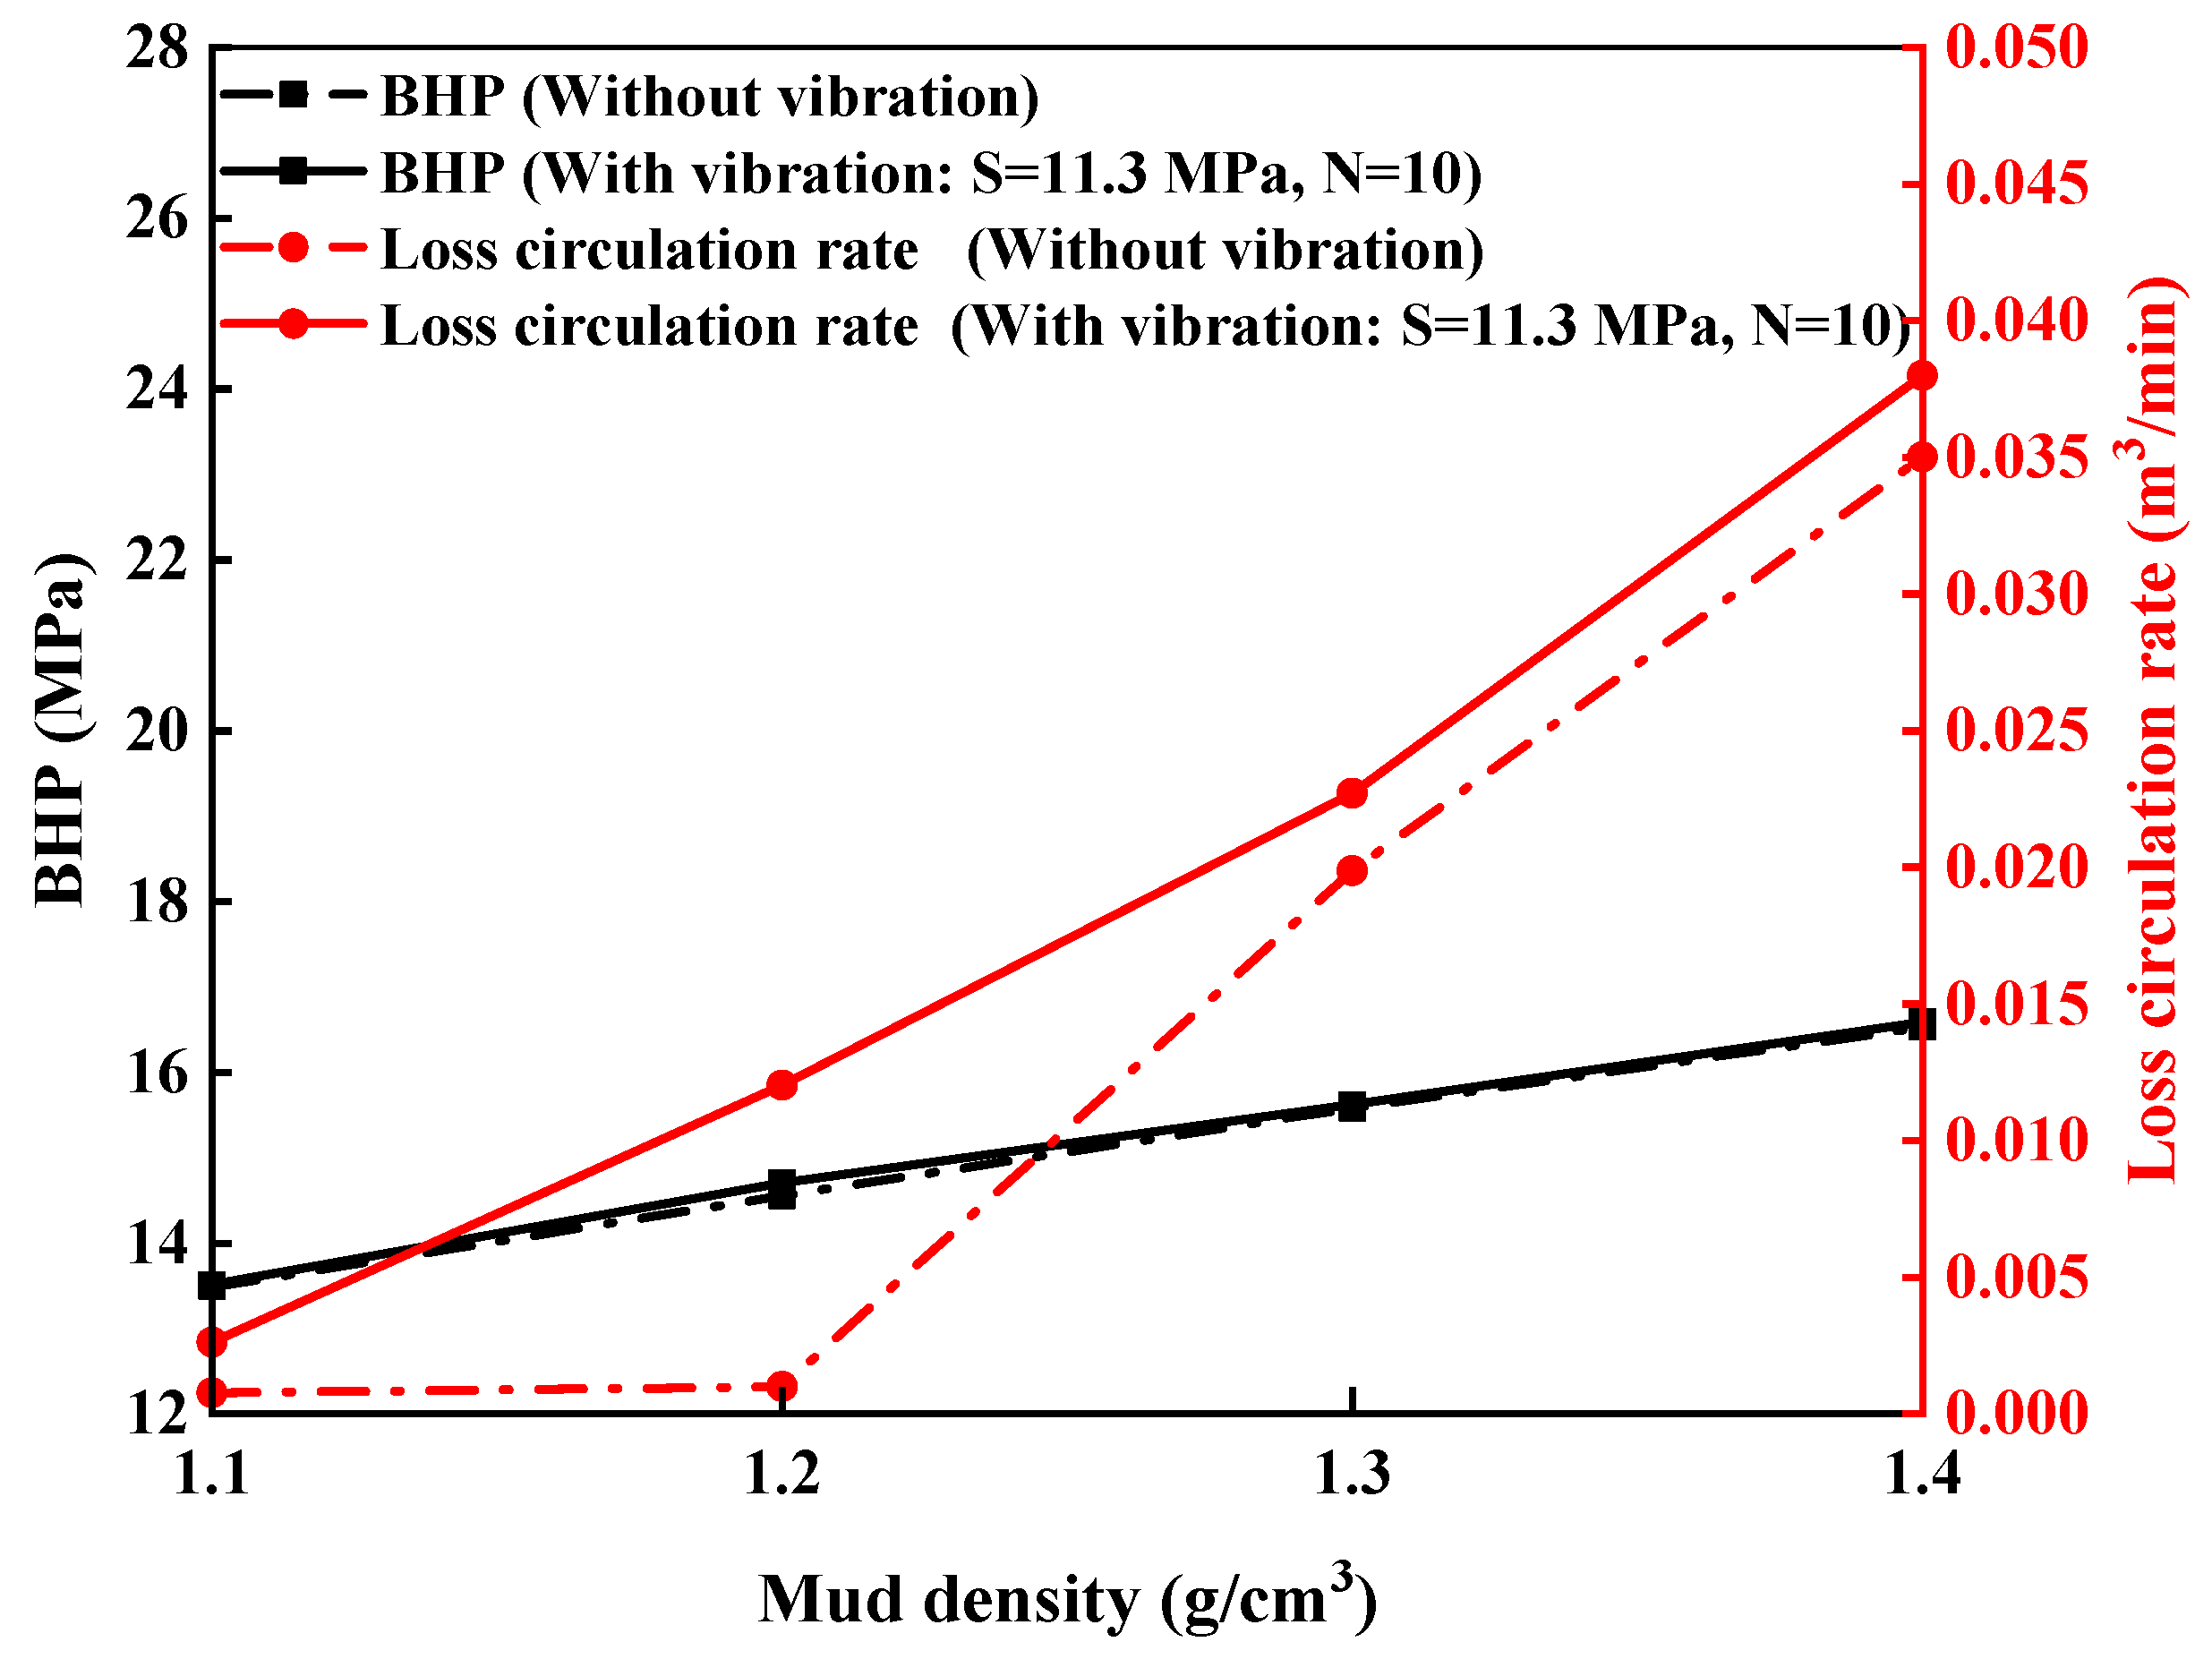
The effect of mud density on the loss circulation rate and the BHP with drill string vibration cyclic loads is also investigated and the results are presented in
Figure 13. It is straightforward that an increase of mud density will lead to an increase of the hydrostatic mud pressure and consequently an increase of the BHP. For different increasing drilling mud density, the BHP remains slightly the same with or without vibration cyclic loads. In fact, the BHP is mainly affected by the hydrostatic mud pressure and the viscous pressure losses. Therefore, the cyclic loads which are applied on the wellbore natural fracture do not greatly influence the value of the BHP. For mud density between 1.1
and 1.2
, the loss circulation rate without vibration cyclic loads is tiny because the model without vibration could not predict fracture initiation and propagation for this range of density.
For mud densities between 1.2 and 1.4 , the fracture initiation pressure has already been reached and the loss circulation rate without vibration starts increasing with the mud density due to the augmentation of the BHP in the system. The model integrating vibration cyclic loads predicted fracture initiation and propagation for the whole range of mud densities between 1.1 and 1.4 , therefore the loss circulation rates increase with mud density for this range of density due to the increase of the BHP in the system. The loss circulation rate obtained with drill string vibration are greater than the results obtained without vibration cyclic loads. An increase of 14.3% of the loss circulation rate was observed after integration of cyclic loads with parameters S = 11.3 MPa and N = 10 and mud density equal to 1.3 . This result was expected because each cyclic load applied on the natural fracture progressively enlarges the fracture width. The natural fracture becoming larger and larger will lead to an increased loss circulation in the system.
7.2. Effect of Mud Viscosity on the Fracture Development Integrating Drill String Vibration
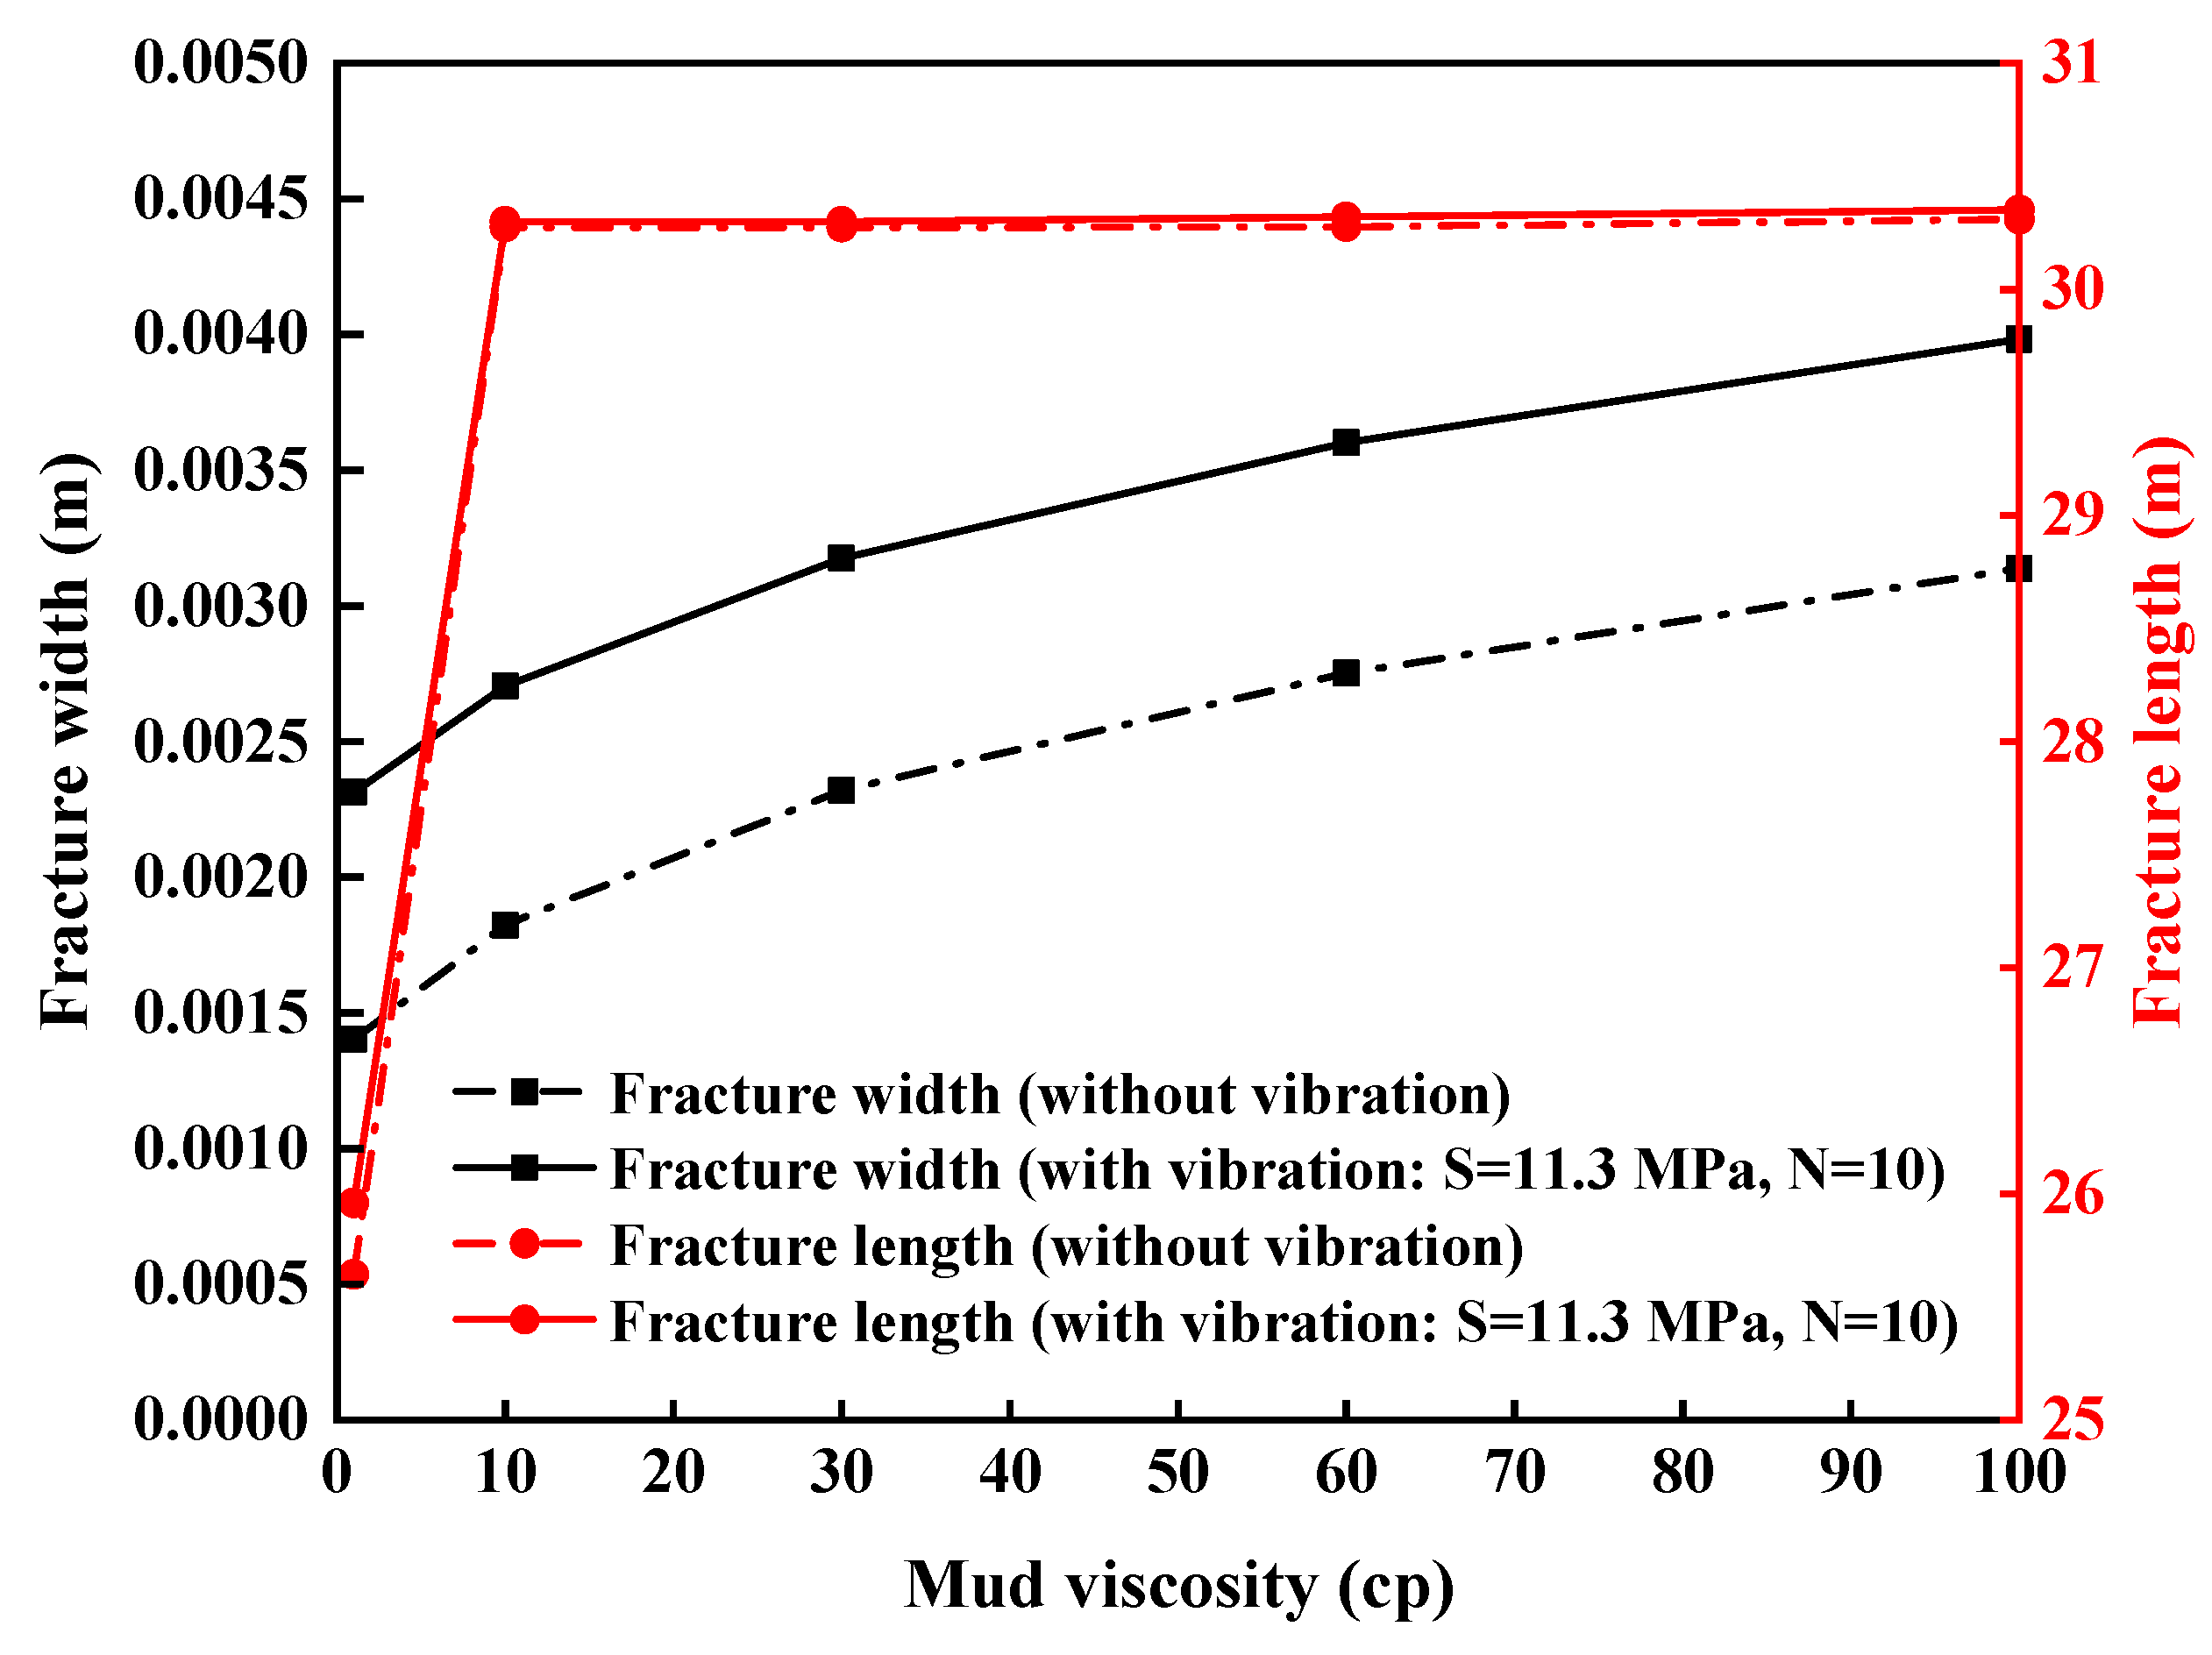
The mud viscosity is another major operational drilling parameter which affects the wellbore stability. The impact of the mud viscosity on fracture length and fracture width with and without vibration cyclic loads is investigated and presented in
Figure 14. The results show that the fracture width with and without vibration cyclic loads increase with the mud viscosity because the higher the fluid viscosity, the larger the resistance of the fluid flow into the fracture and finally the larger the fracture width. However, the fracture length is not greatly affected by the mud viscosity increase. For mud viscosity less than 10 cp, the fracture length linearly increases with the mud viscosity up to reach 30.3 m, and finally stabilizes around this value for mud viscosity between 10 cp and 100 cp. Those results are consistent with hydraulic practices theories which stipulate that higher fluids viscosity lead to wider and shorter fracture [
17,
35].
Concerning the influence of the drill string vibration cyclic loads on the natural fracture development, it is observed that the fracture width is more affected by the drill string vibration cyclic loads because the cyclic loads hitting the wellbore surface cause the decohesion of the formation matrix in the neighborhood of the fracture mouth. For mud viscosity equal to 1 cp for example, the fracture width without vibration increased by 64.78% after integration of drill string vibration cyclic loads with parameters S = 11.3 MPa and N = 10. However, like the investigations of the effect of mud density on the fracture length development with and without vibration, the integration of the drill string vibration cyclic loads in the system does not significantly affect the fracture length development because its impact is more localized at the wellbore surface.
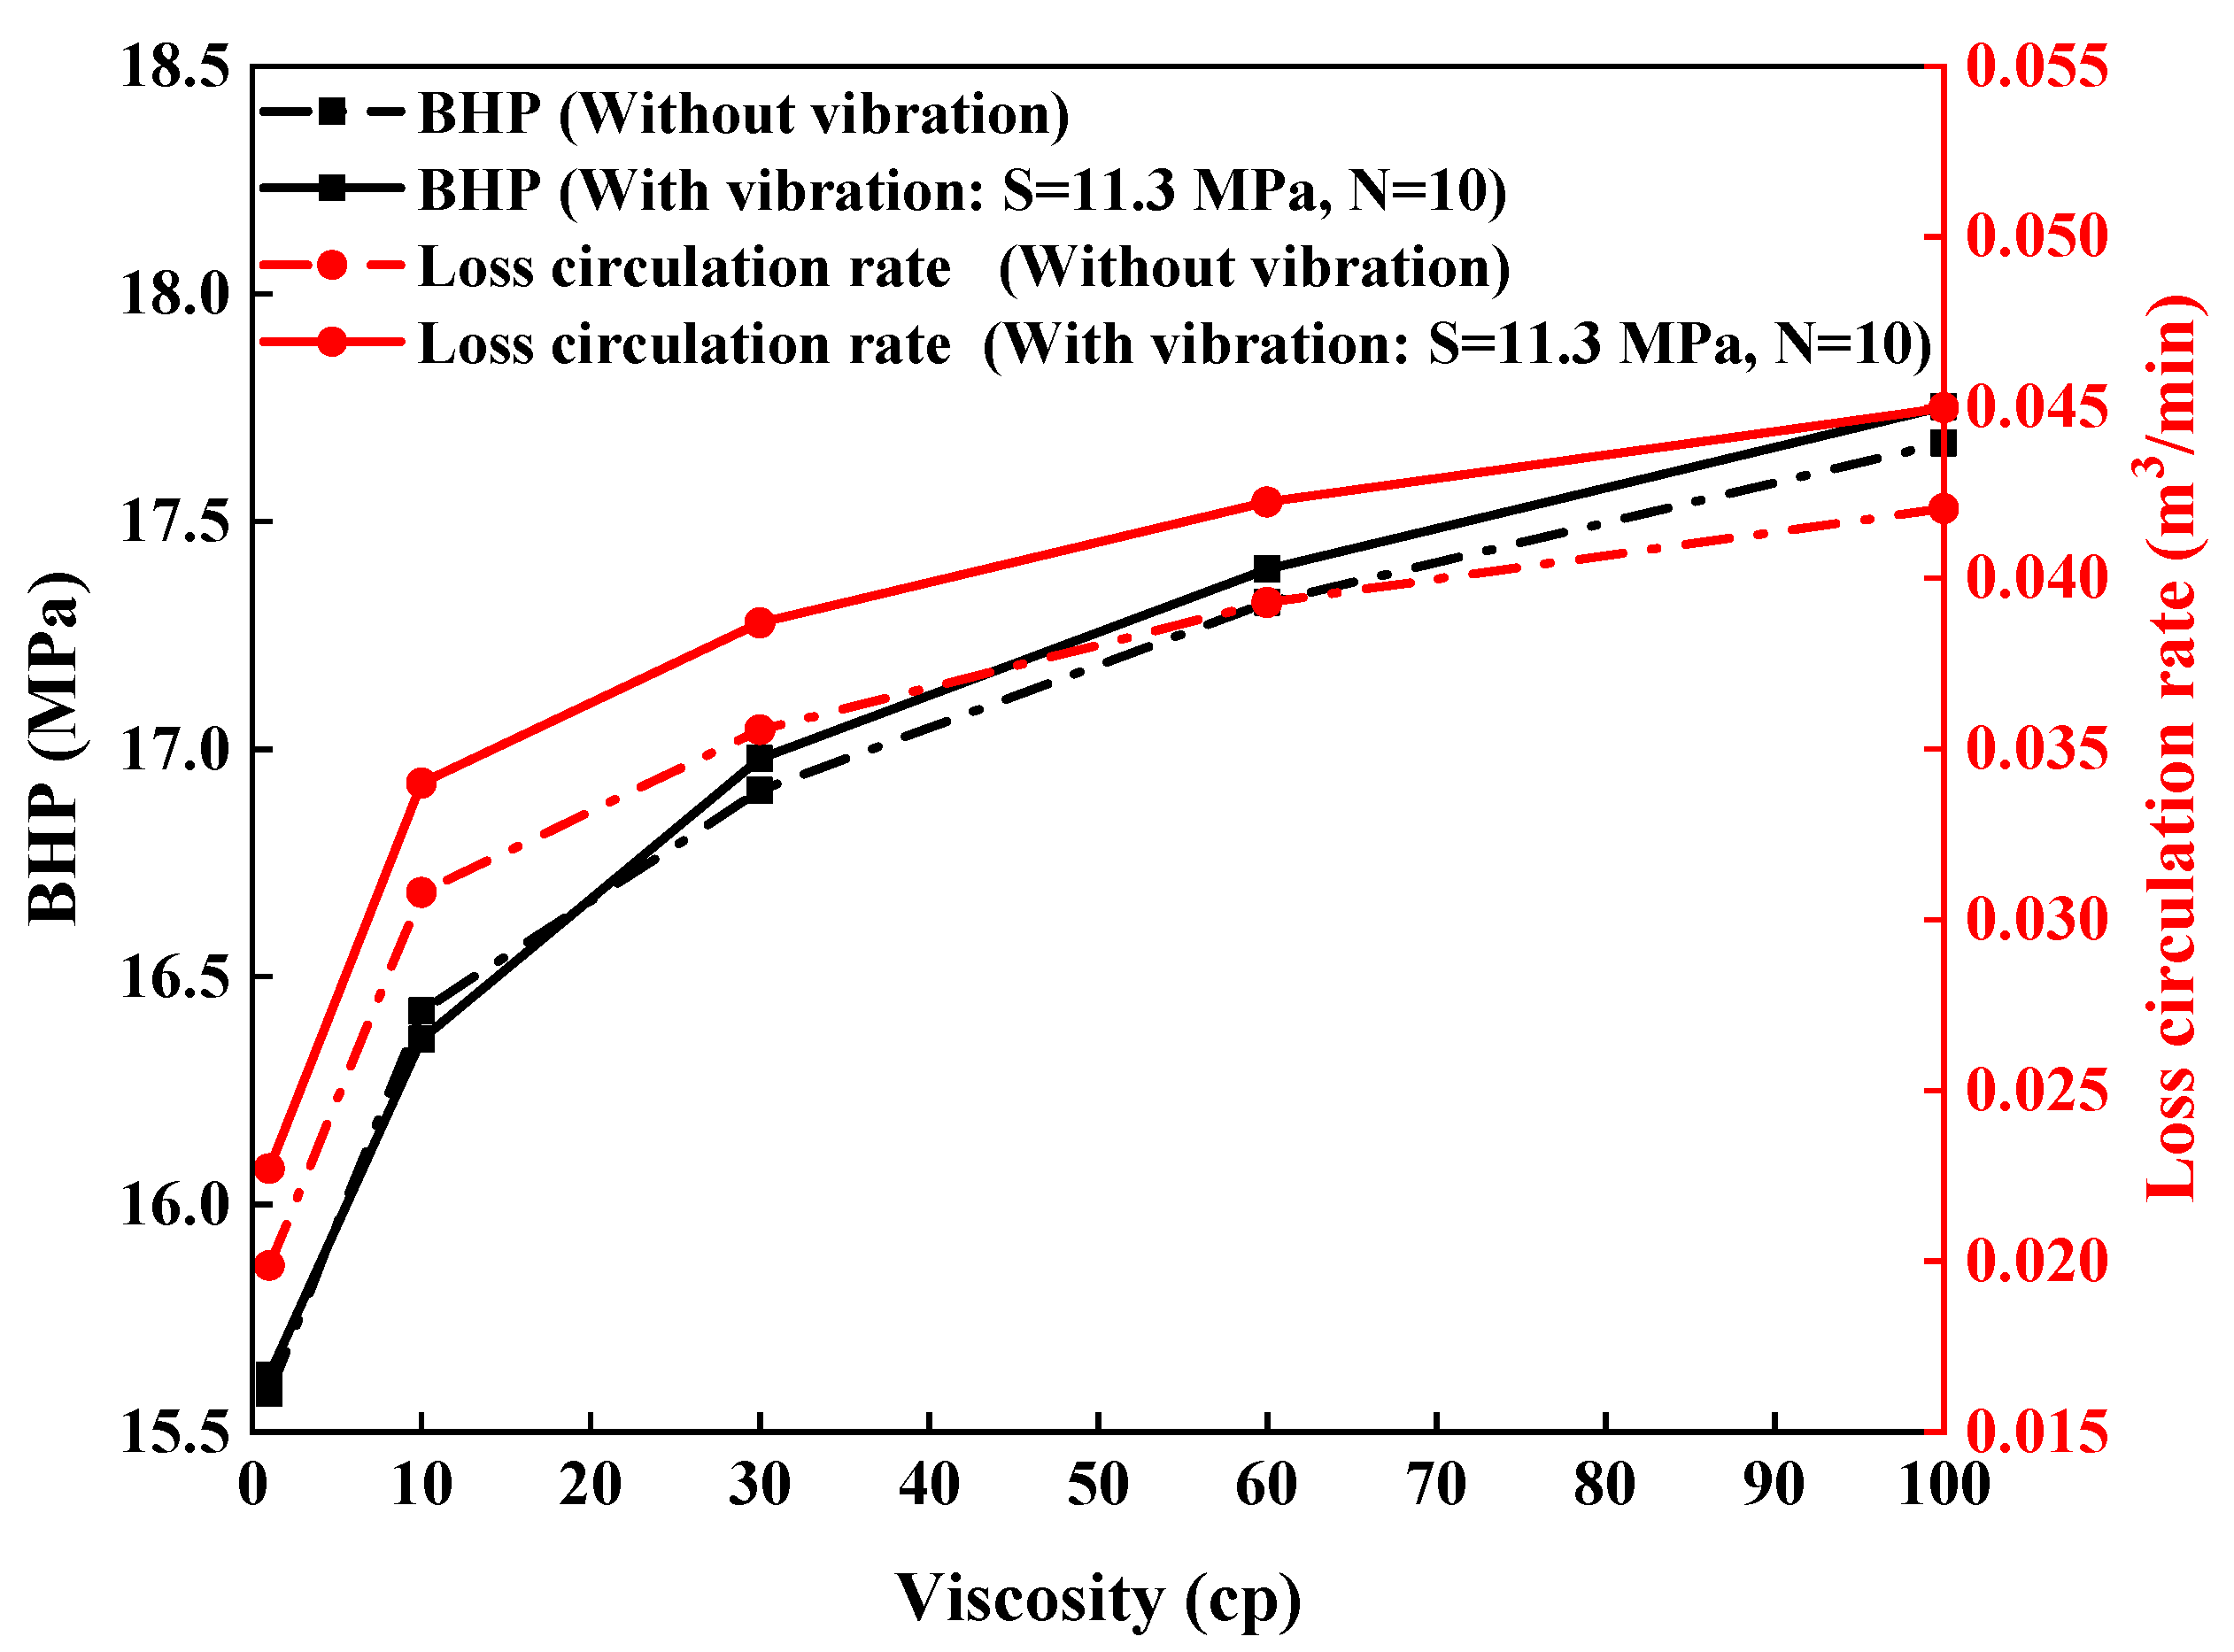
It is also interesting to study the effect of mud viscosity on the loss circulation rate and the BHP with and without vibration cyclic loads. From
Figure 15, it is observed that the loss circulation rate and the BHP increase with the mud viscosity because the increase of the mud viscosity will result in the elevation of the viscous pressure losses which will in turn lead to the augmentation of the BHP. Importantly, the increase of the BHP also enhances the risk of loss circulation which is materialized in the system by an increase of the loss circulation rate.
The results also showed that the BHP values do not change too much when drill string vibration cyclic loads are considered in the simulation. The maximal percentage of the BHP increase after integration of drill string vibration did not exceed 0.5%. However, the loss circulation rates increase when drill string vibration cyclic loads are considered in the simulation. The loss circulation rate increased by 14.3% after drill string vibration cyclic loads with parameters
S = 11.3 MPa and
N = 10 was added in the system. Some researchers such as [
35,
36] arrived at contrasting conclusions when they demonstrated that the higher the viscosity of the drilling mud, the lower the loss circulation rate inside the fracture. In this paper, the dimensions of the wellbore (depth, length and width) are far greater than the dimensions of the wellbore natural fracture, therefore it is the BHP which is the key driver of the loss circulation inside the fracture, so when the mud viscosity will increase, the viscous pressure loss will also increase and it will finally lead to an increase of the BHP and the loss circulation rate.
7.3. Effect of Pump Rate on the Fracture Development Integrating Drill String Vibration
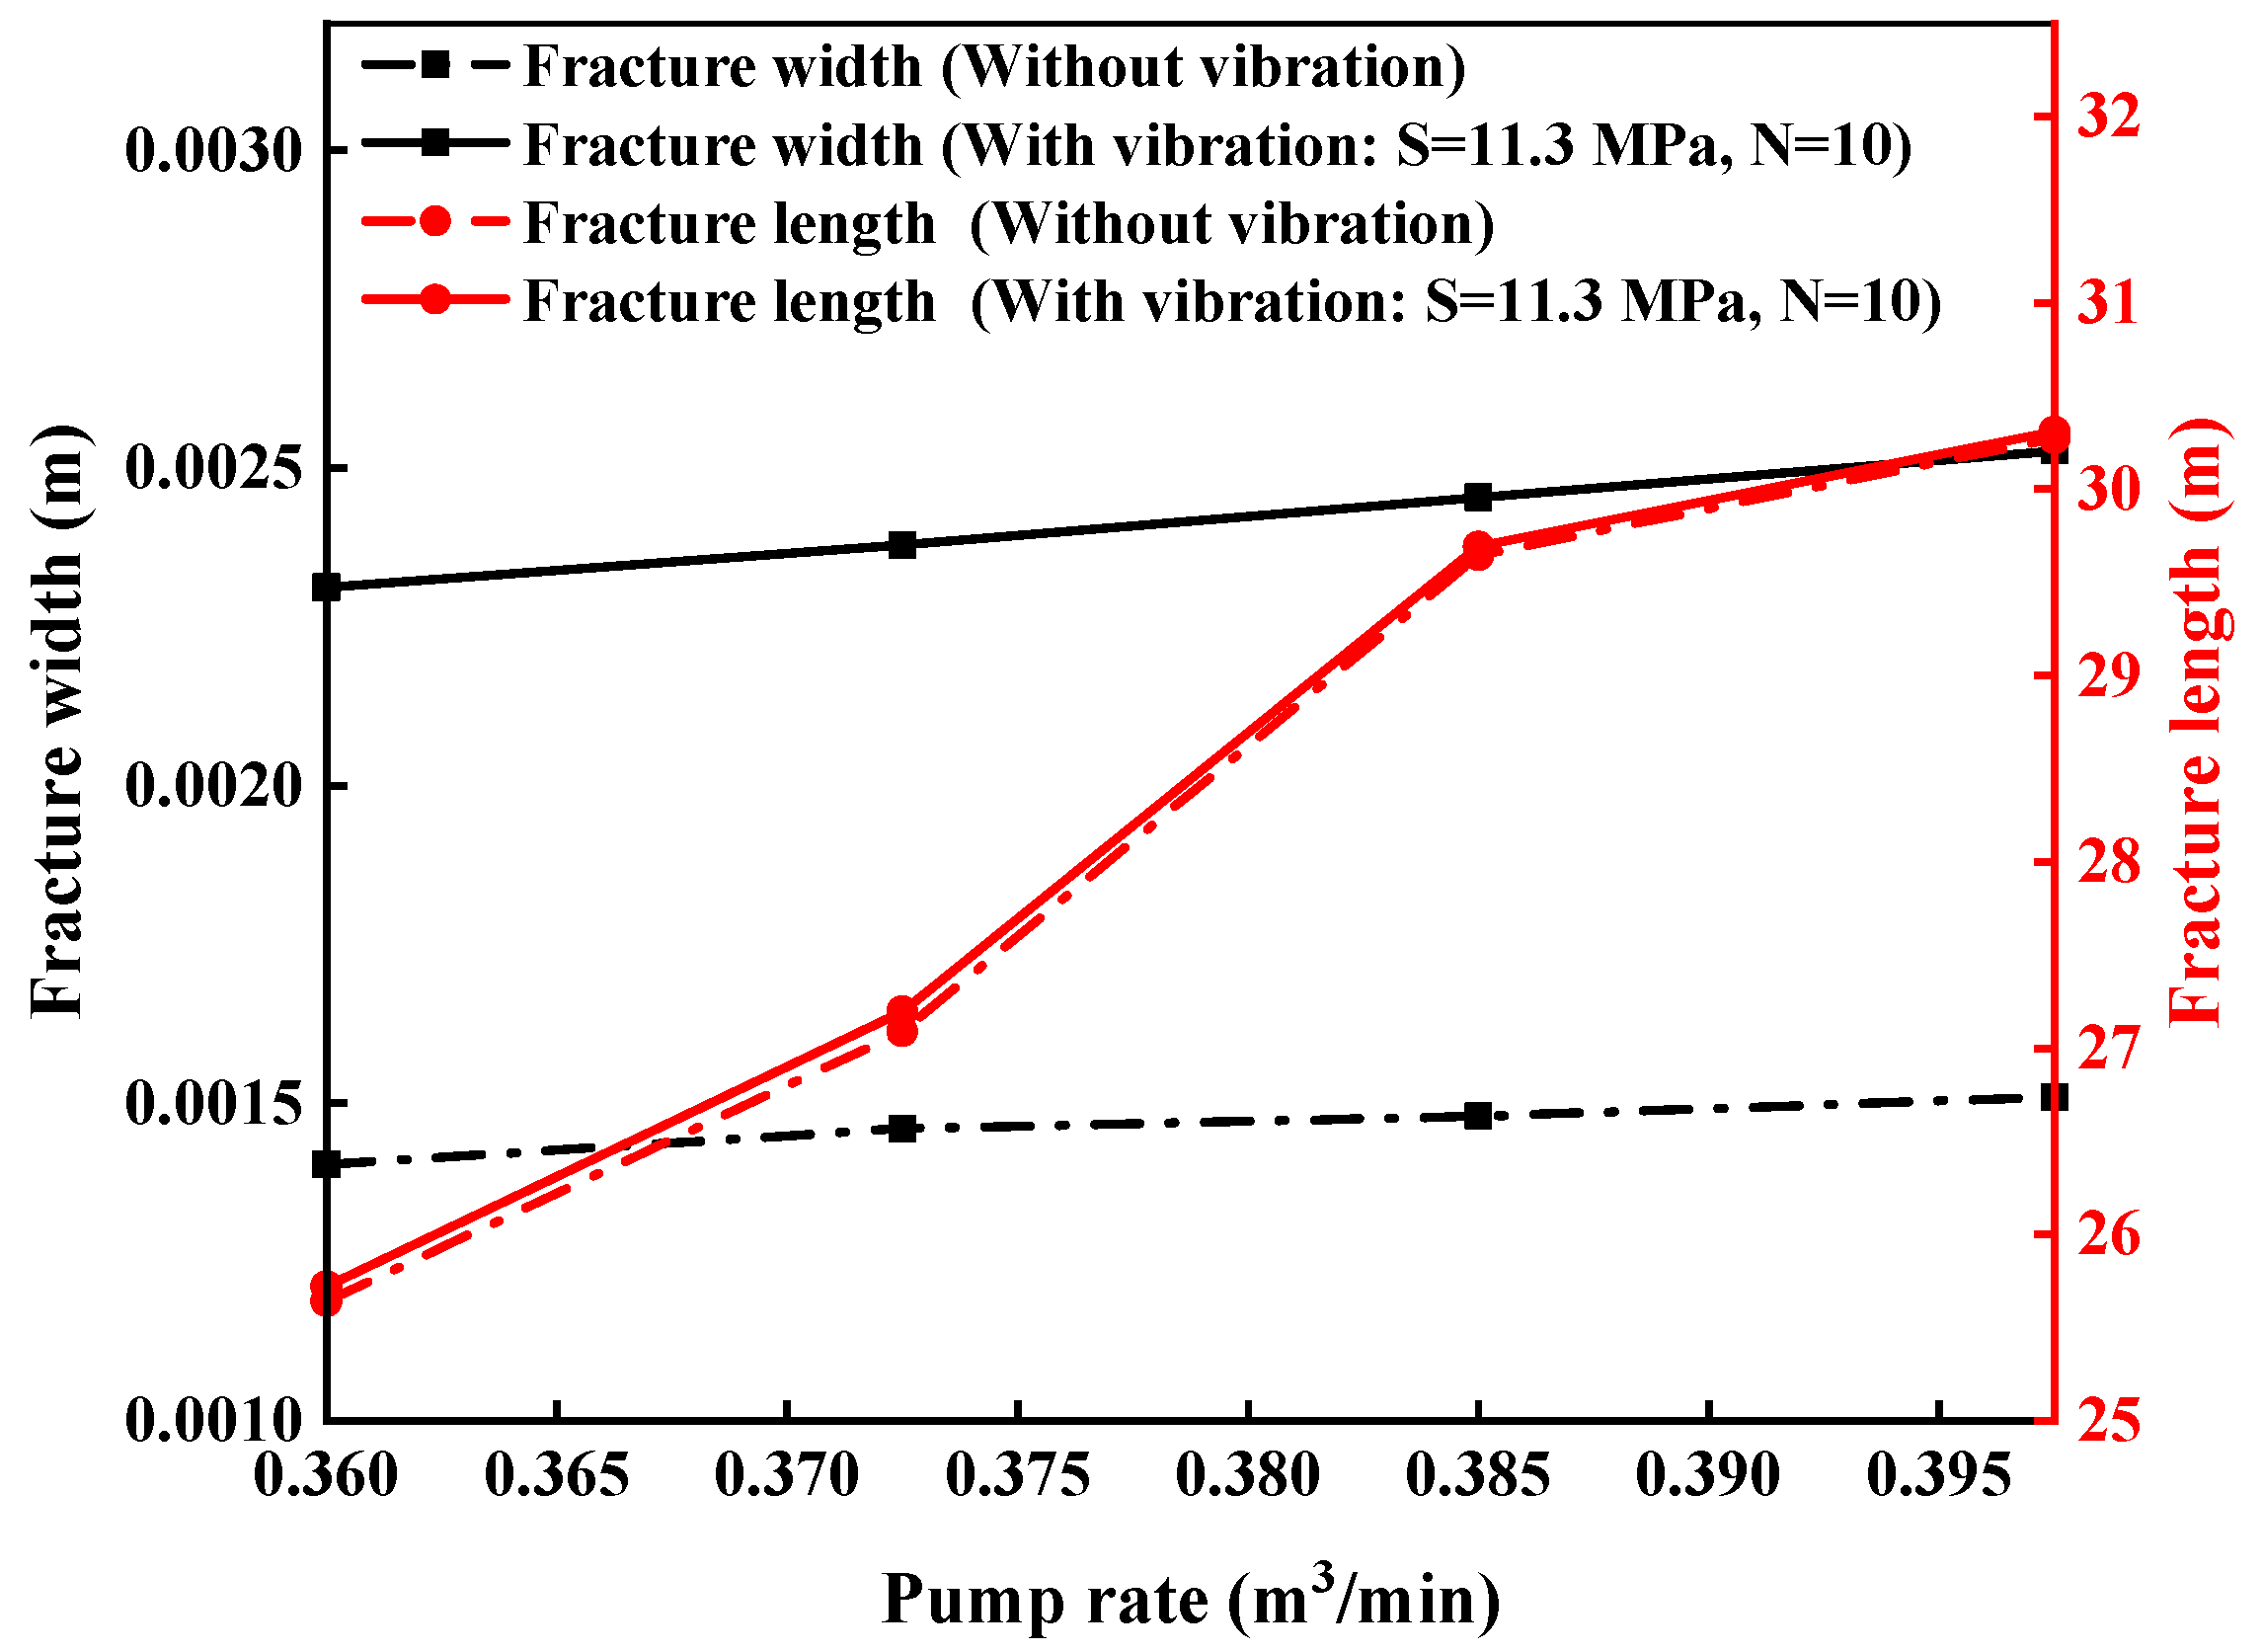
The pump rate is one of the dominating factors that control the fluid flow velocity inside the wellbore. The effect of pump rate on fracture length and fracture width with and without vibration cyclic loads is presented in
Figure 16. The results showed that the fracture width and fracture length increase with pump rate due to the augmentation of the wellbore pressure. The fracture width obtained when the drill string vibration cyclic loads are implemented in the system are greater than those obtained without vibration cyclic loads. An average increase of 64.94% of the fracture width is observed when the drill string vibration are considered during the simulation. It is equally observed that the fracture length did not evolve too much after integration of vibration cyclic load in the system because the impact of cyclic loads is localized on the wellbore surface.
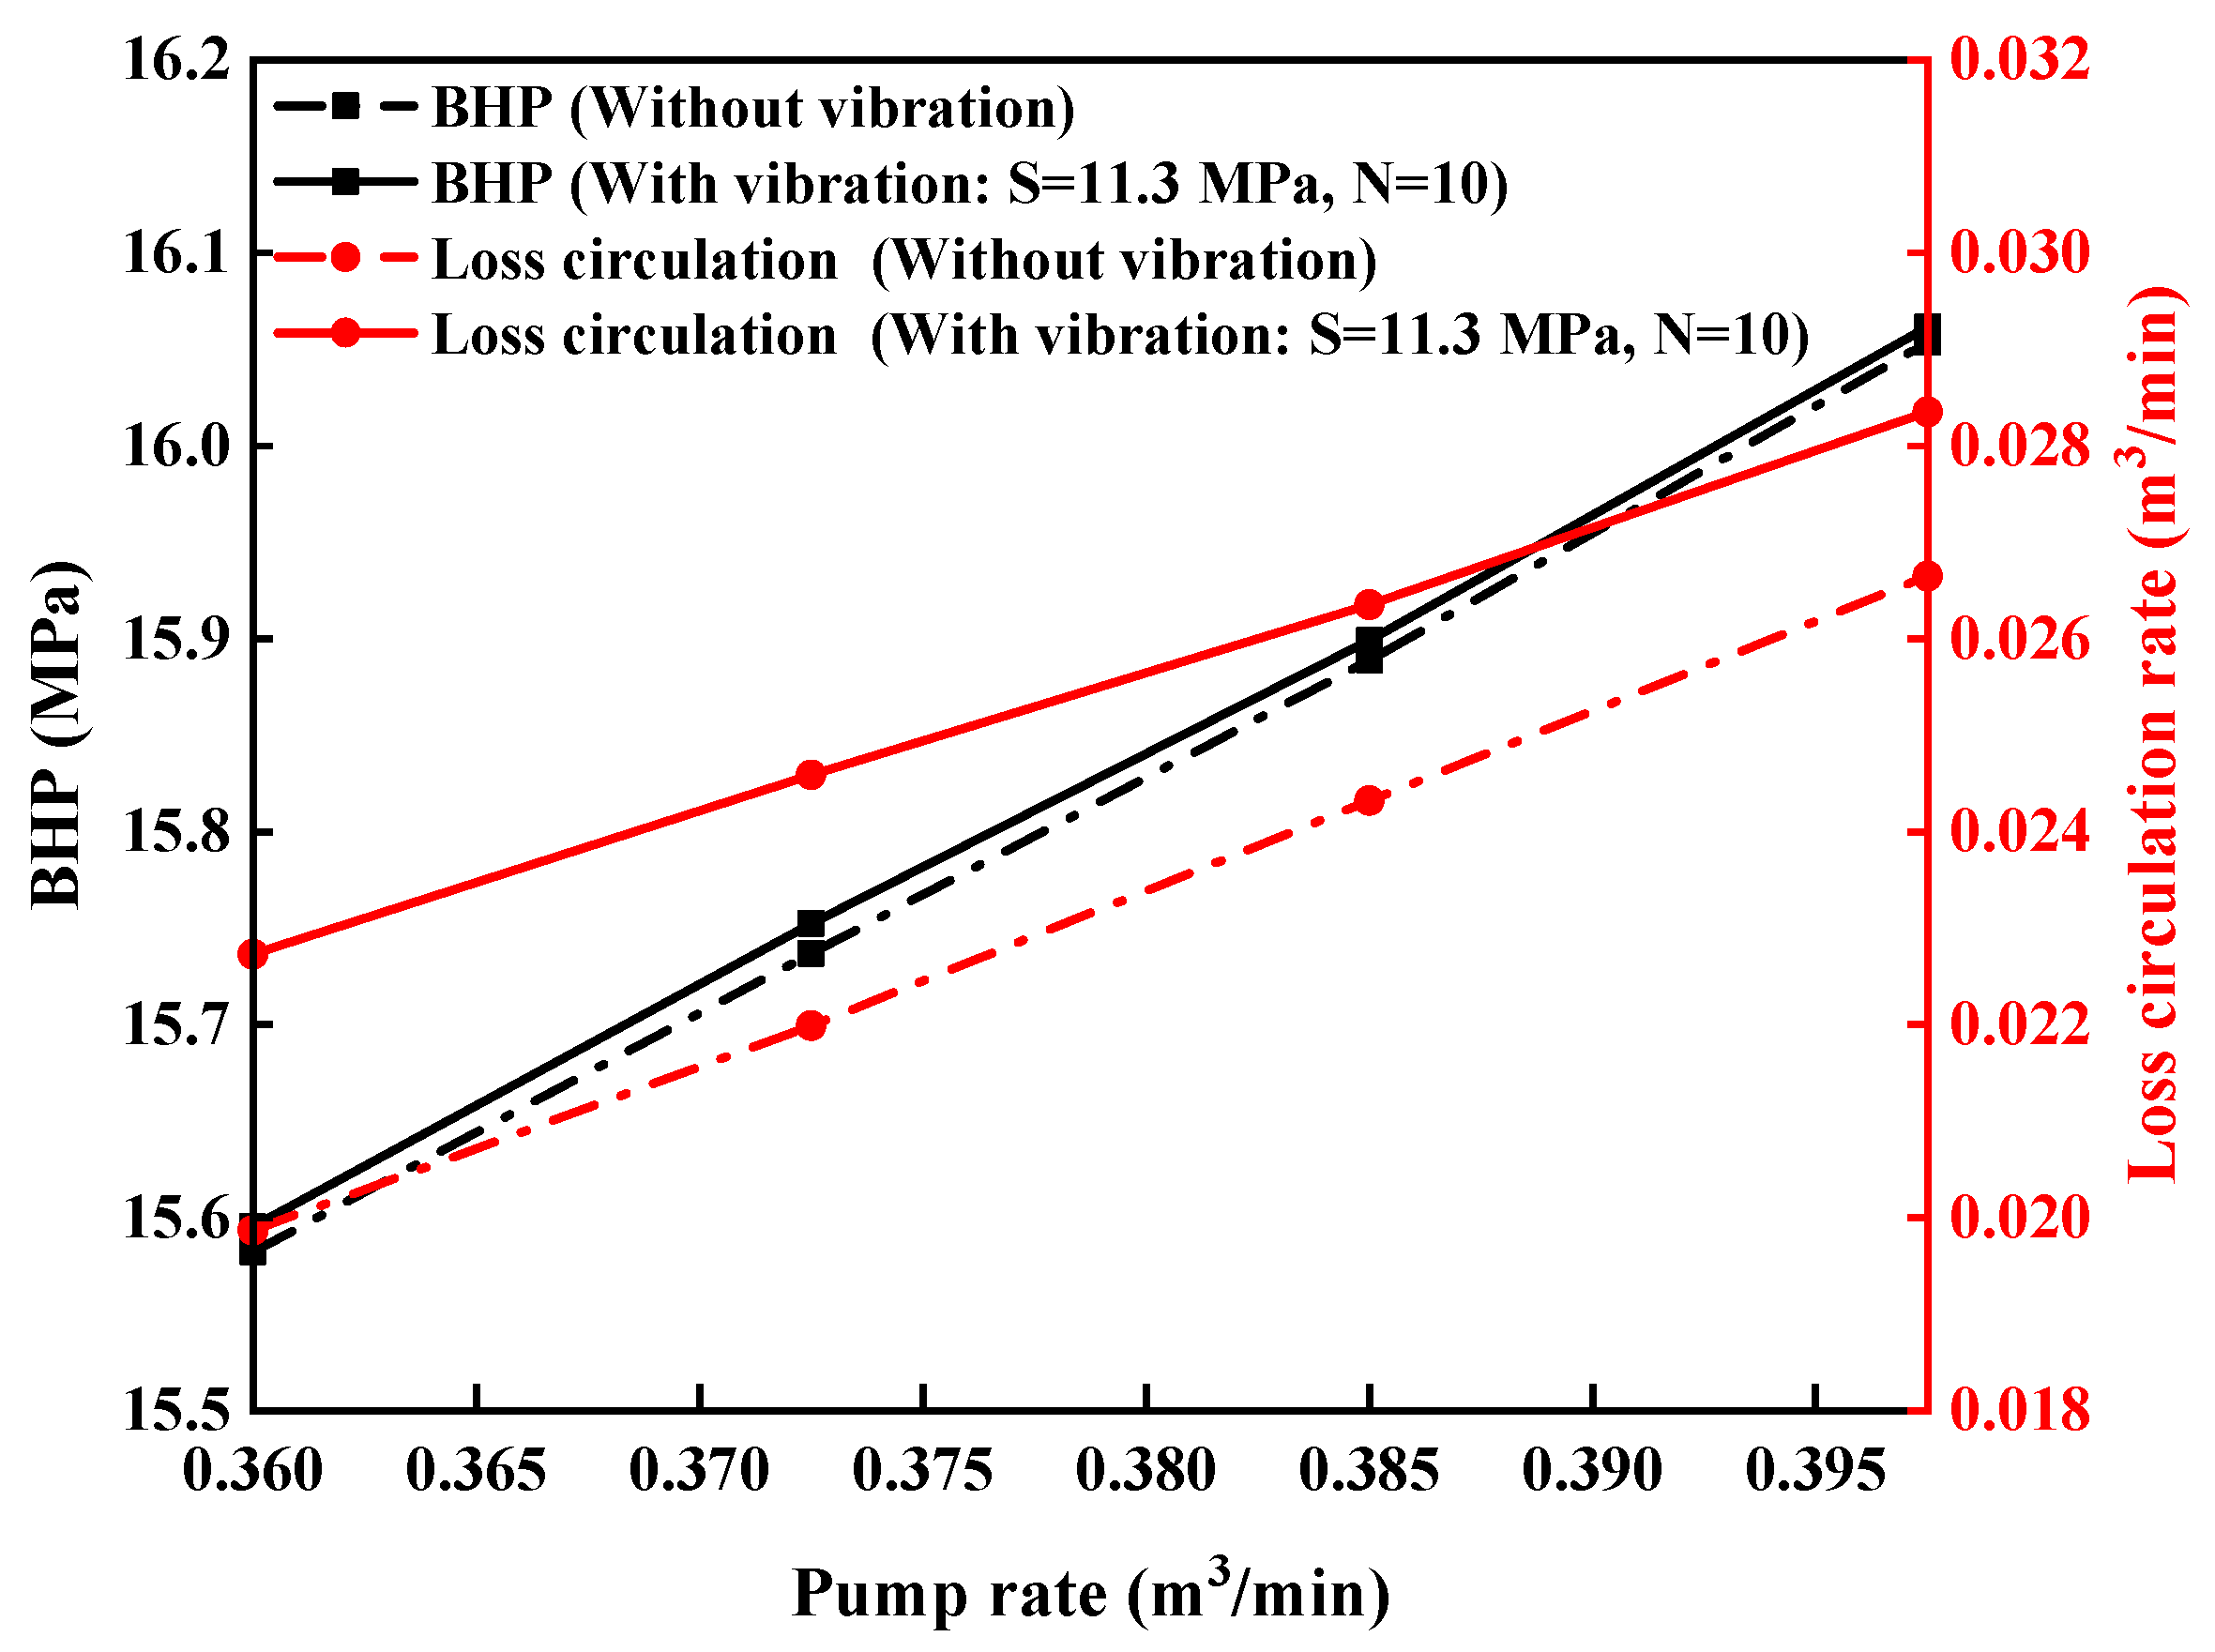
The effect of pump rate on loss circulation rate and the BHP when the drill string vibration are integrated in the system have equally been investigated.
Figure 17 shows that the loss circulation rate and the BHP increase with the pump rate. The loss circulation rate obtained with drill string vibration cyclic loads are greater than those obtained without vibration cyclic loads. These results confirm that the tripping operations should be made very slowly in order to avoid high values of pump rates. This will enable to prevent uncontrolled fracture growth development and loss circulation.
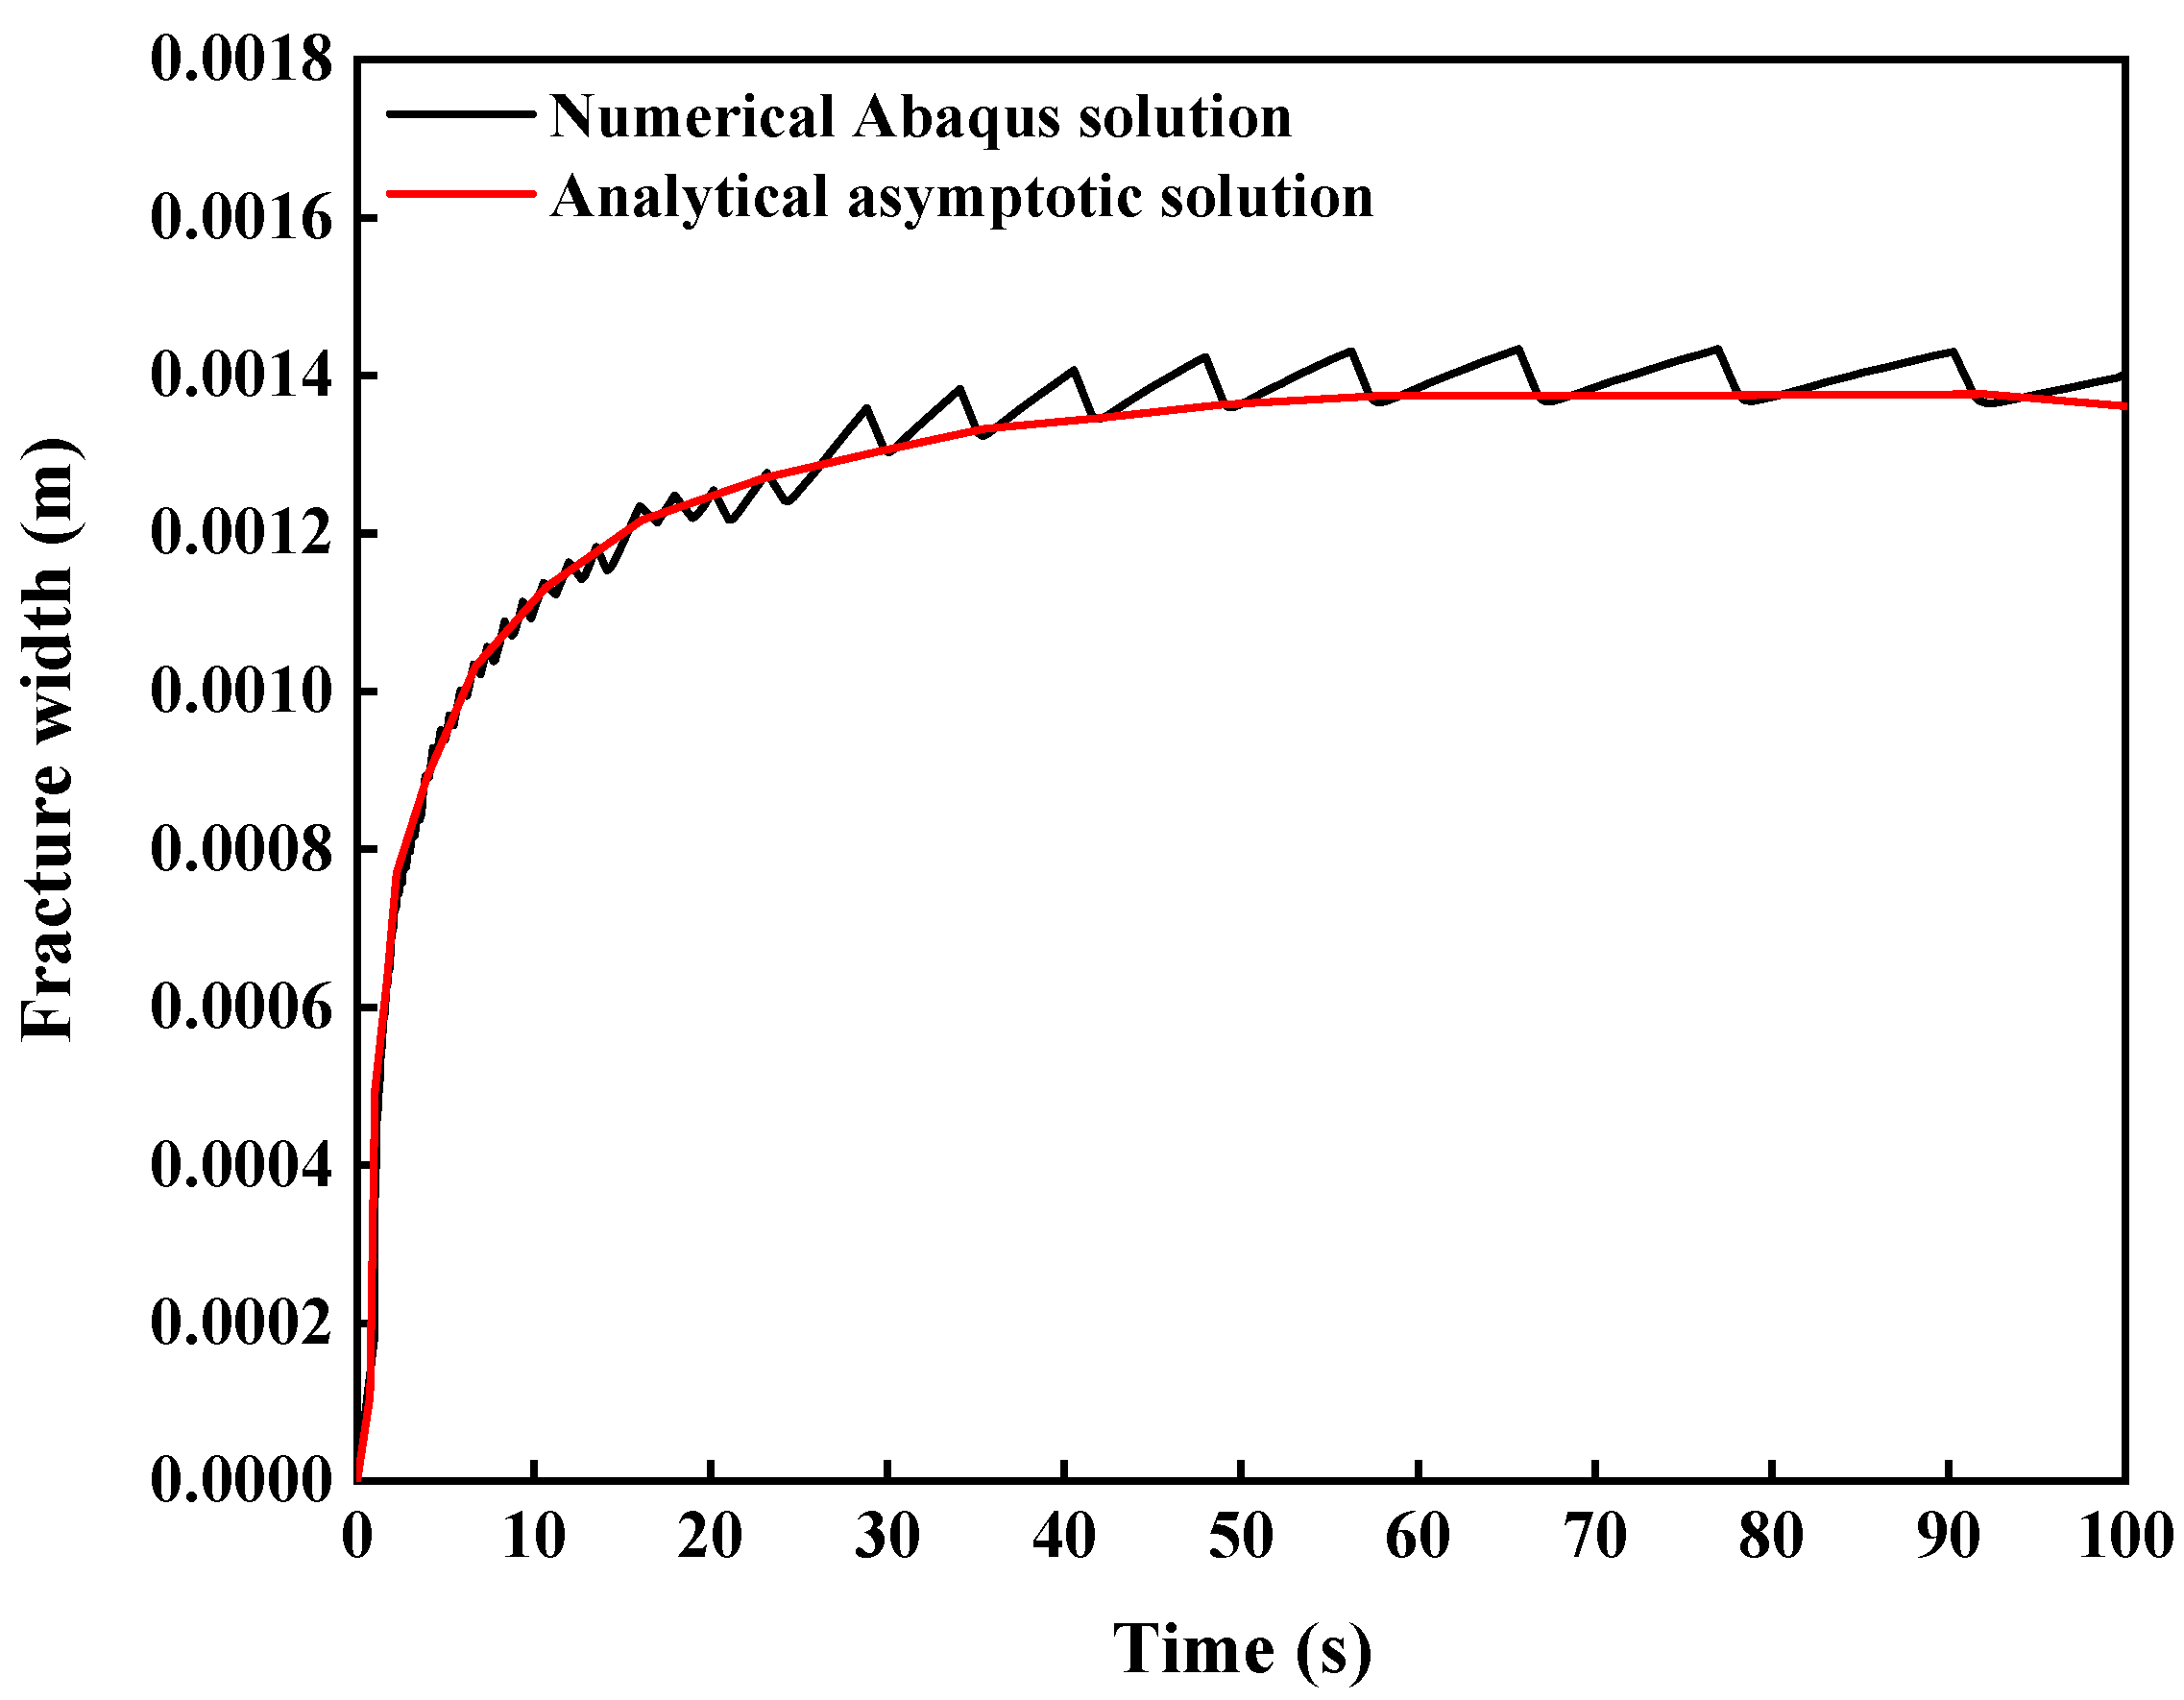
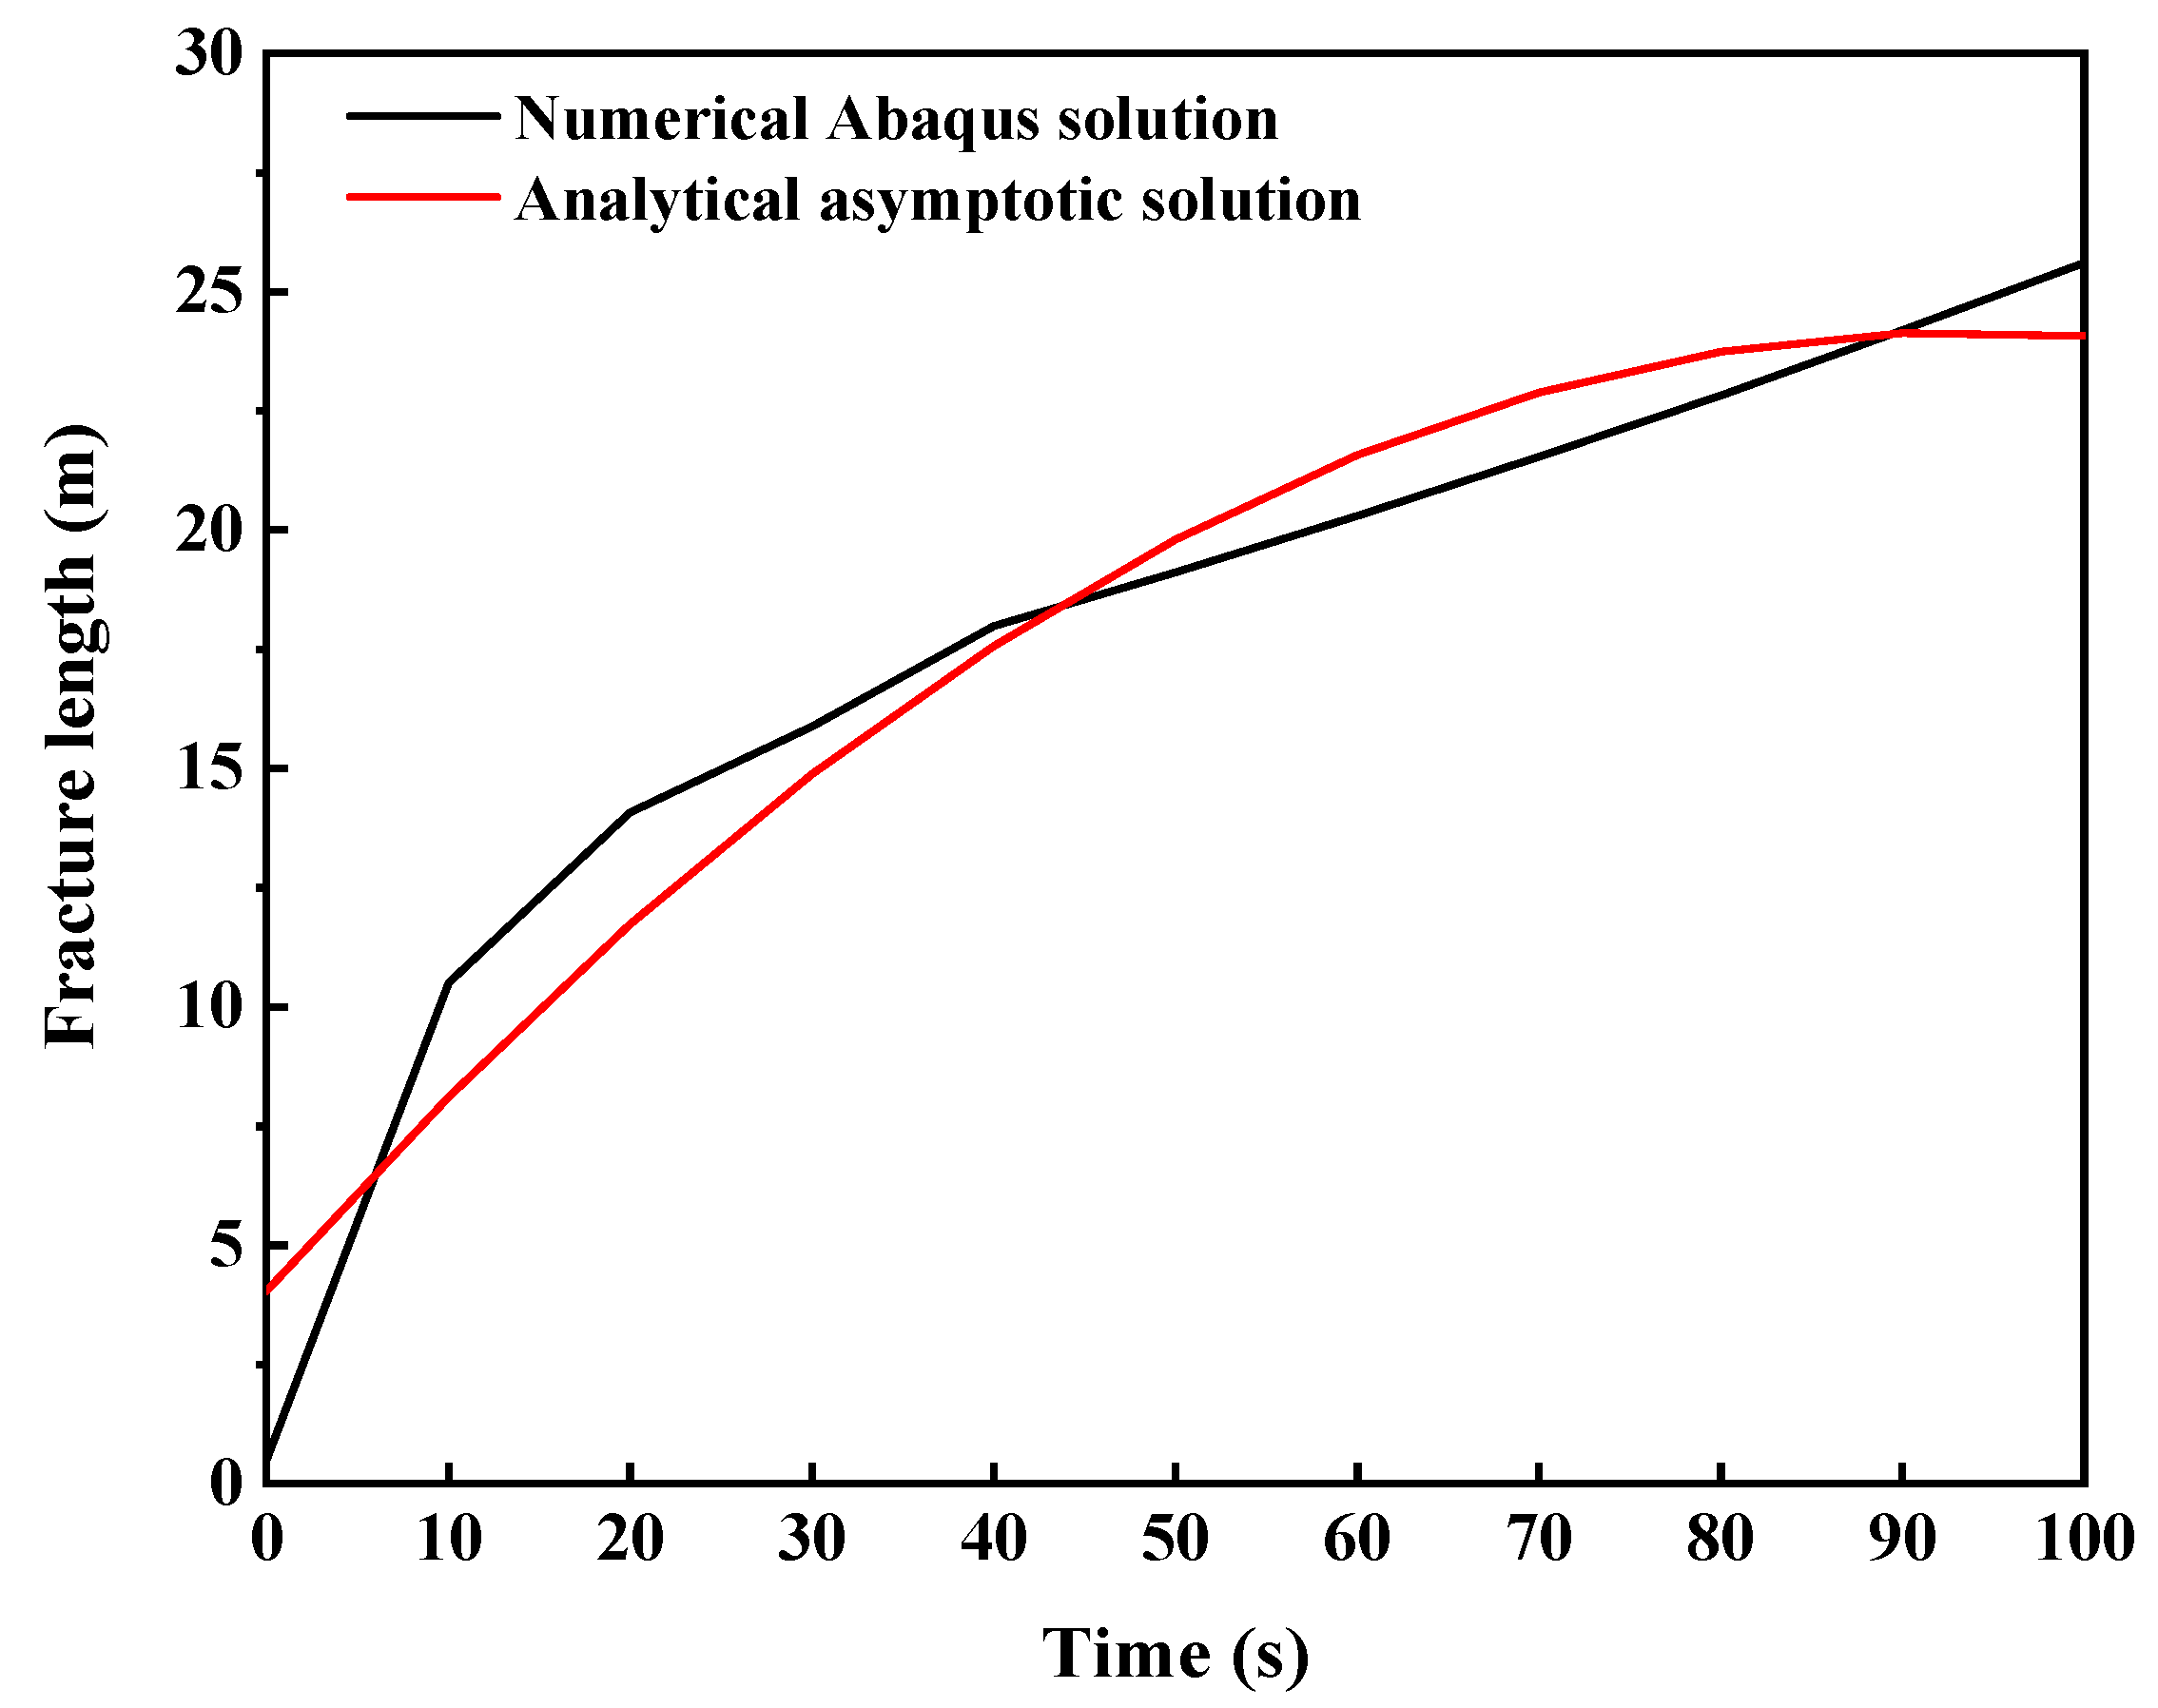
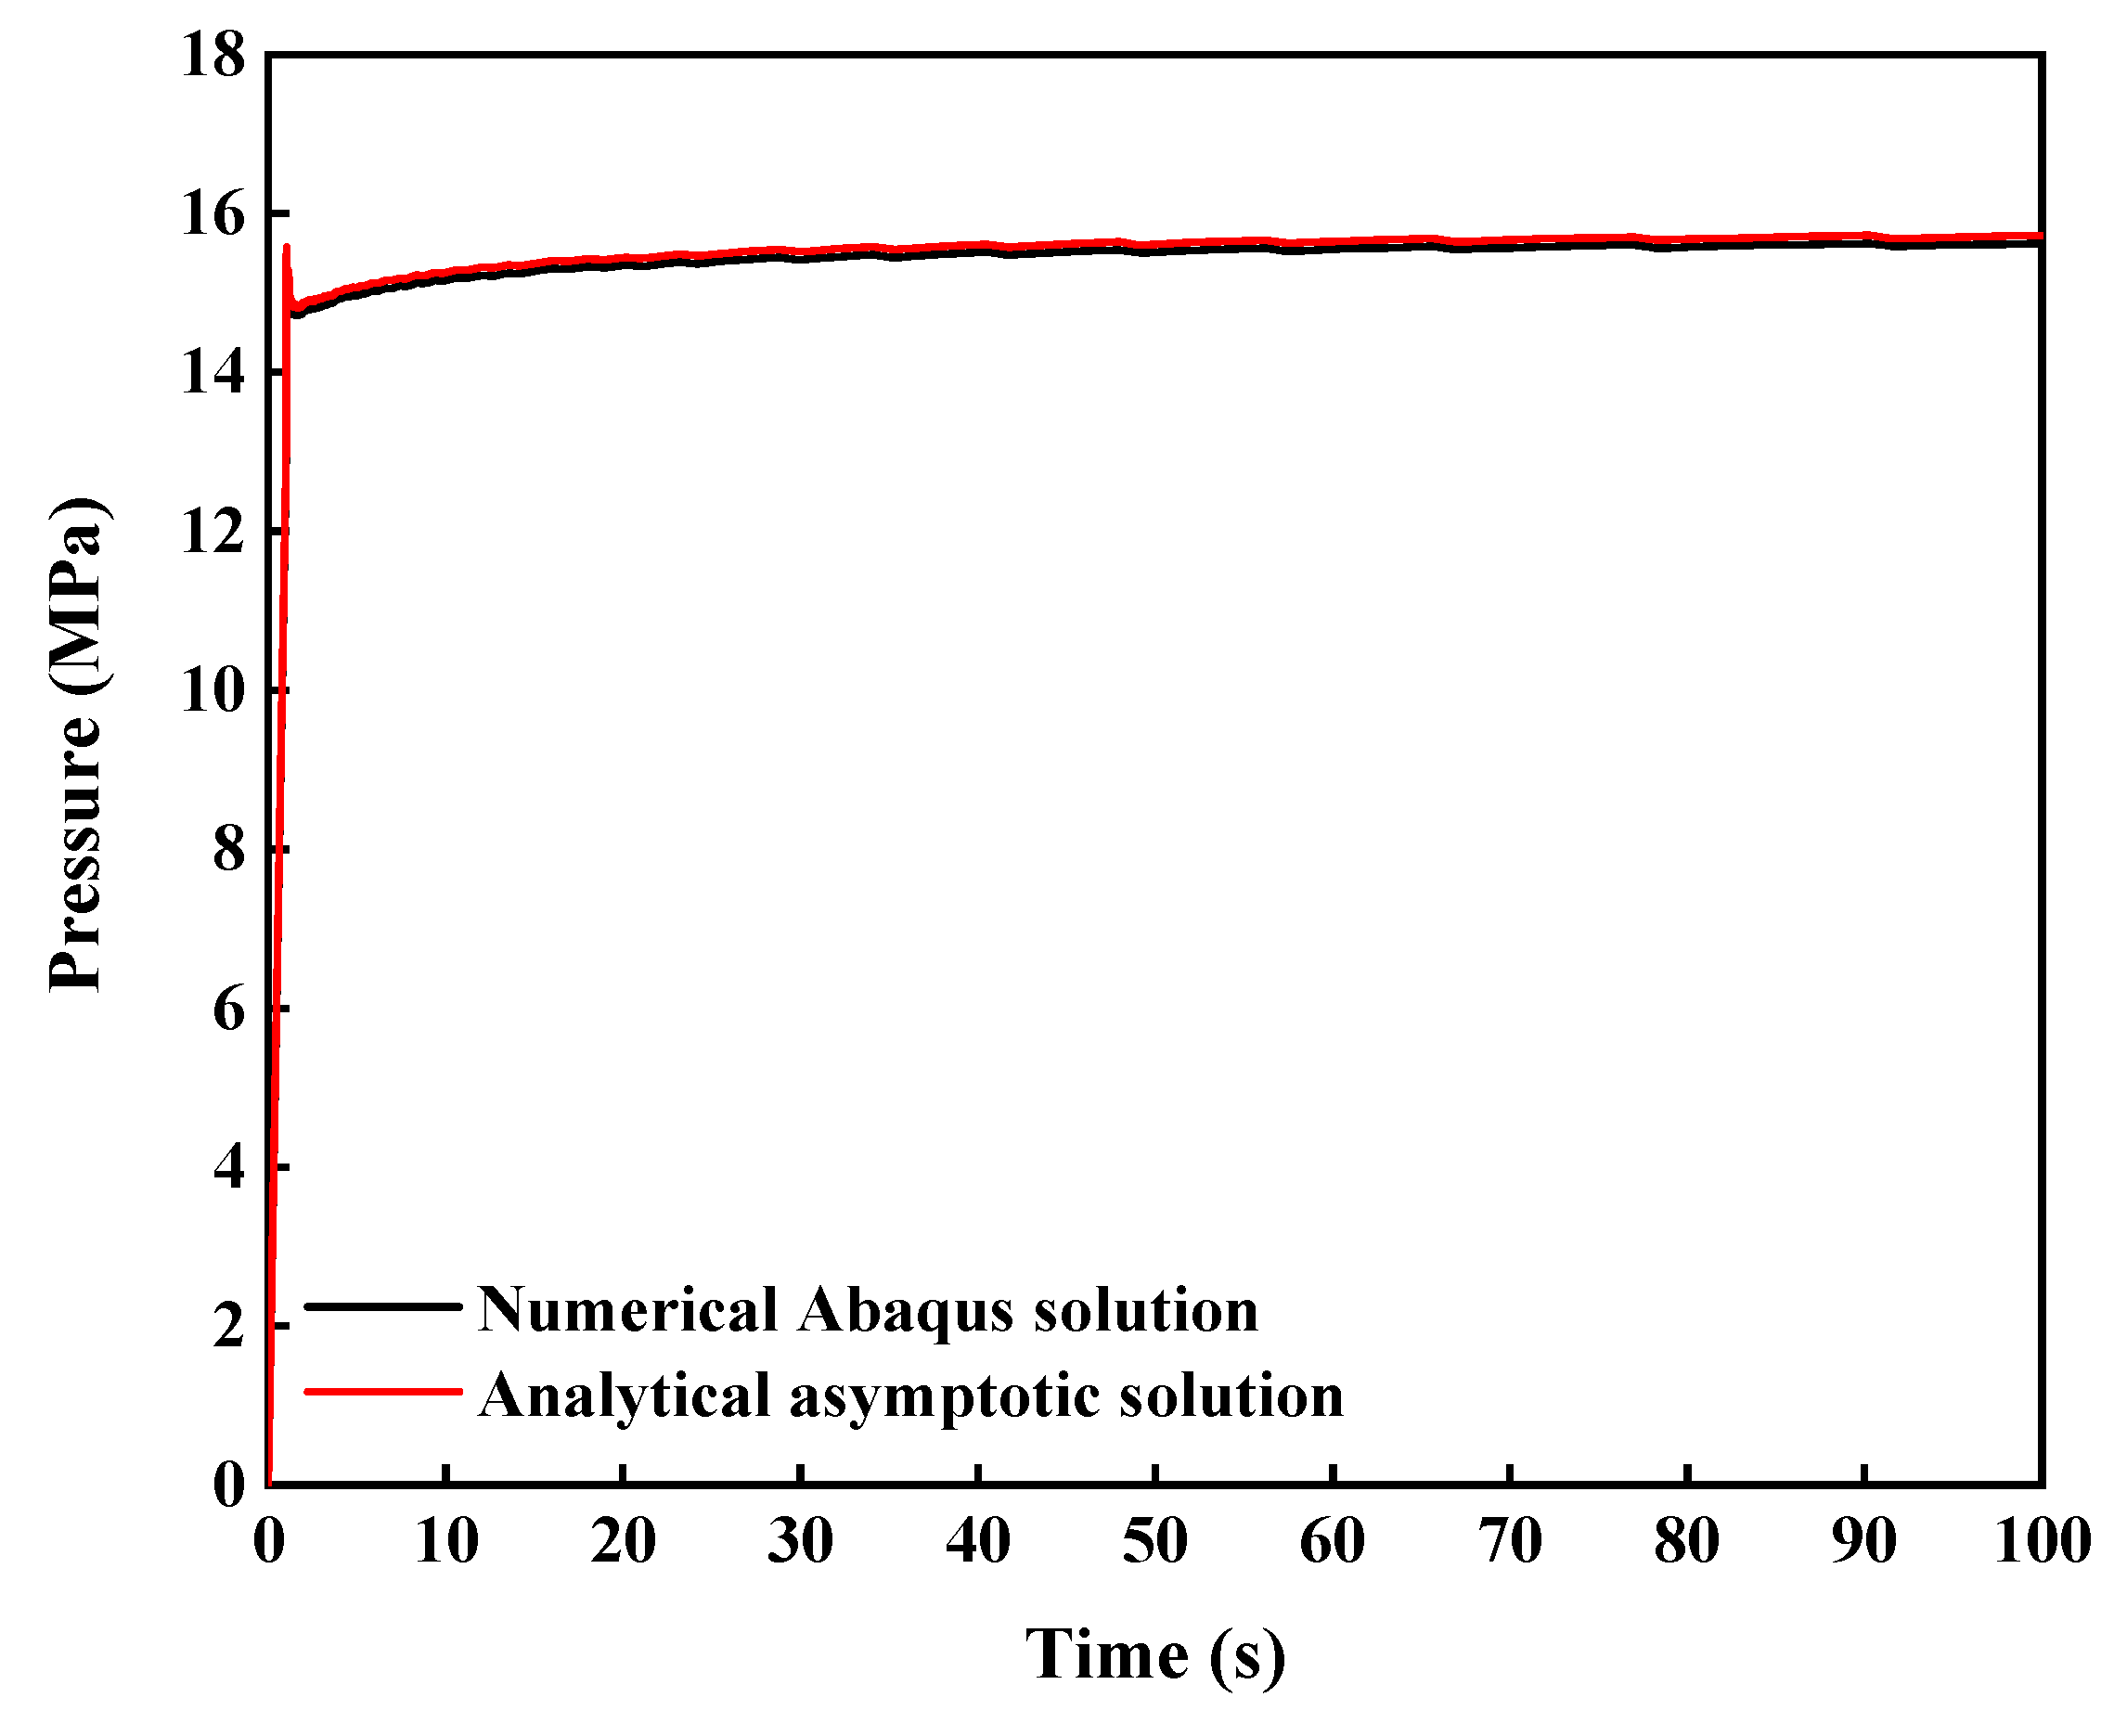
Figure 18,
Figure 19 and
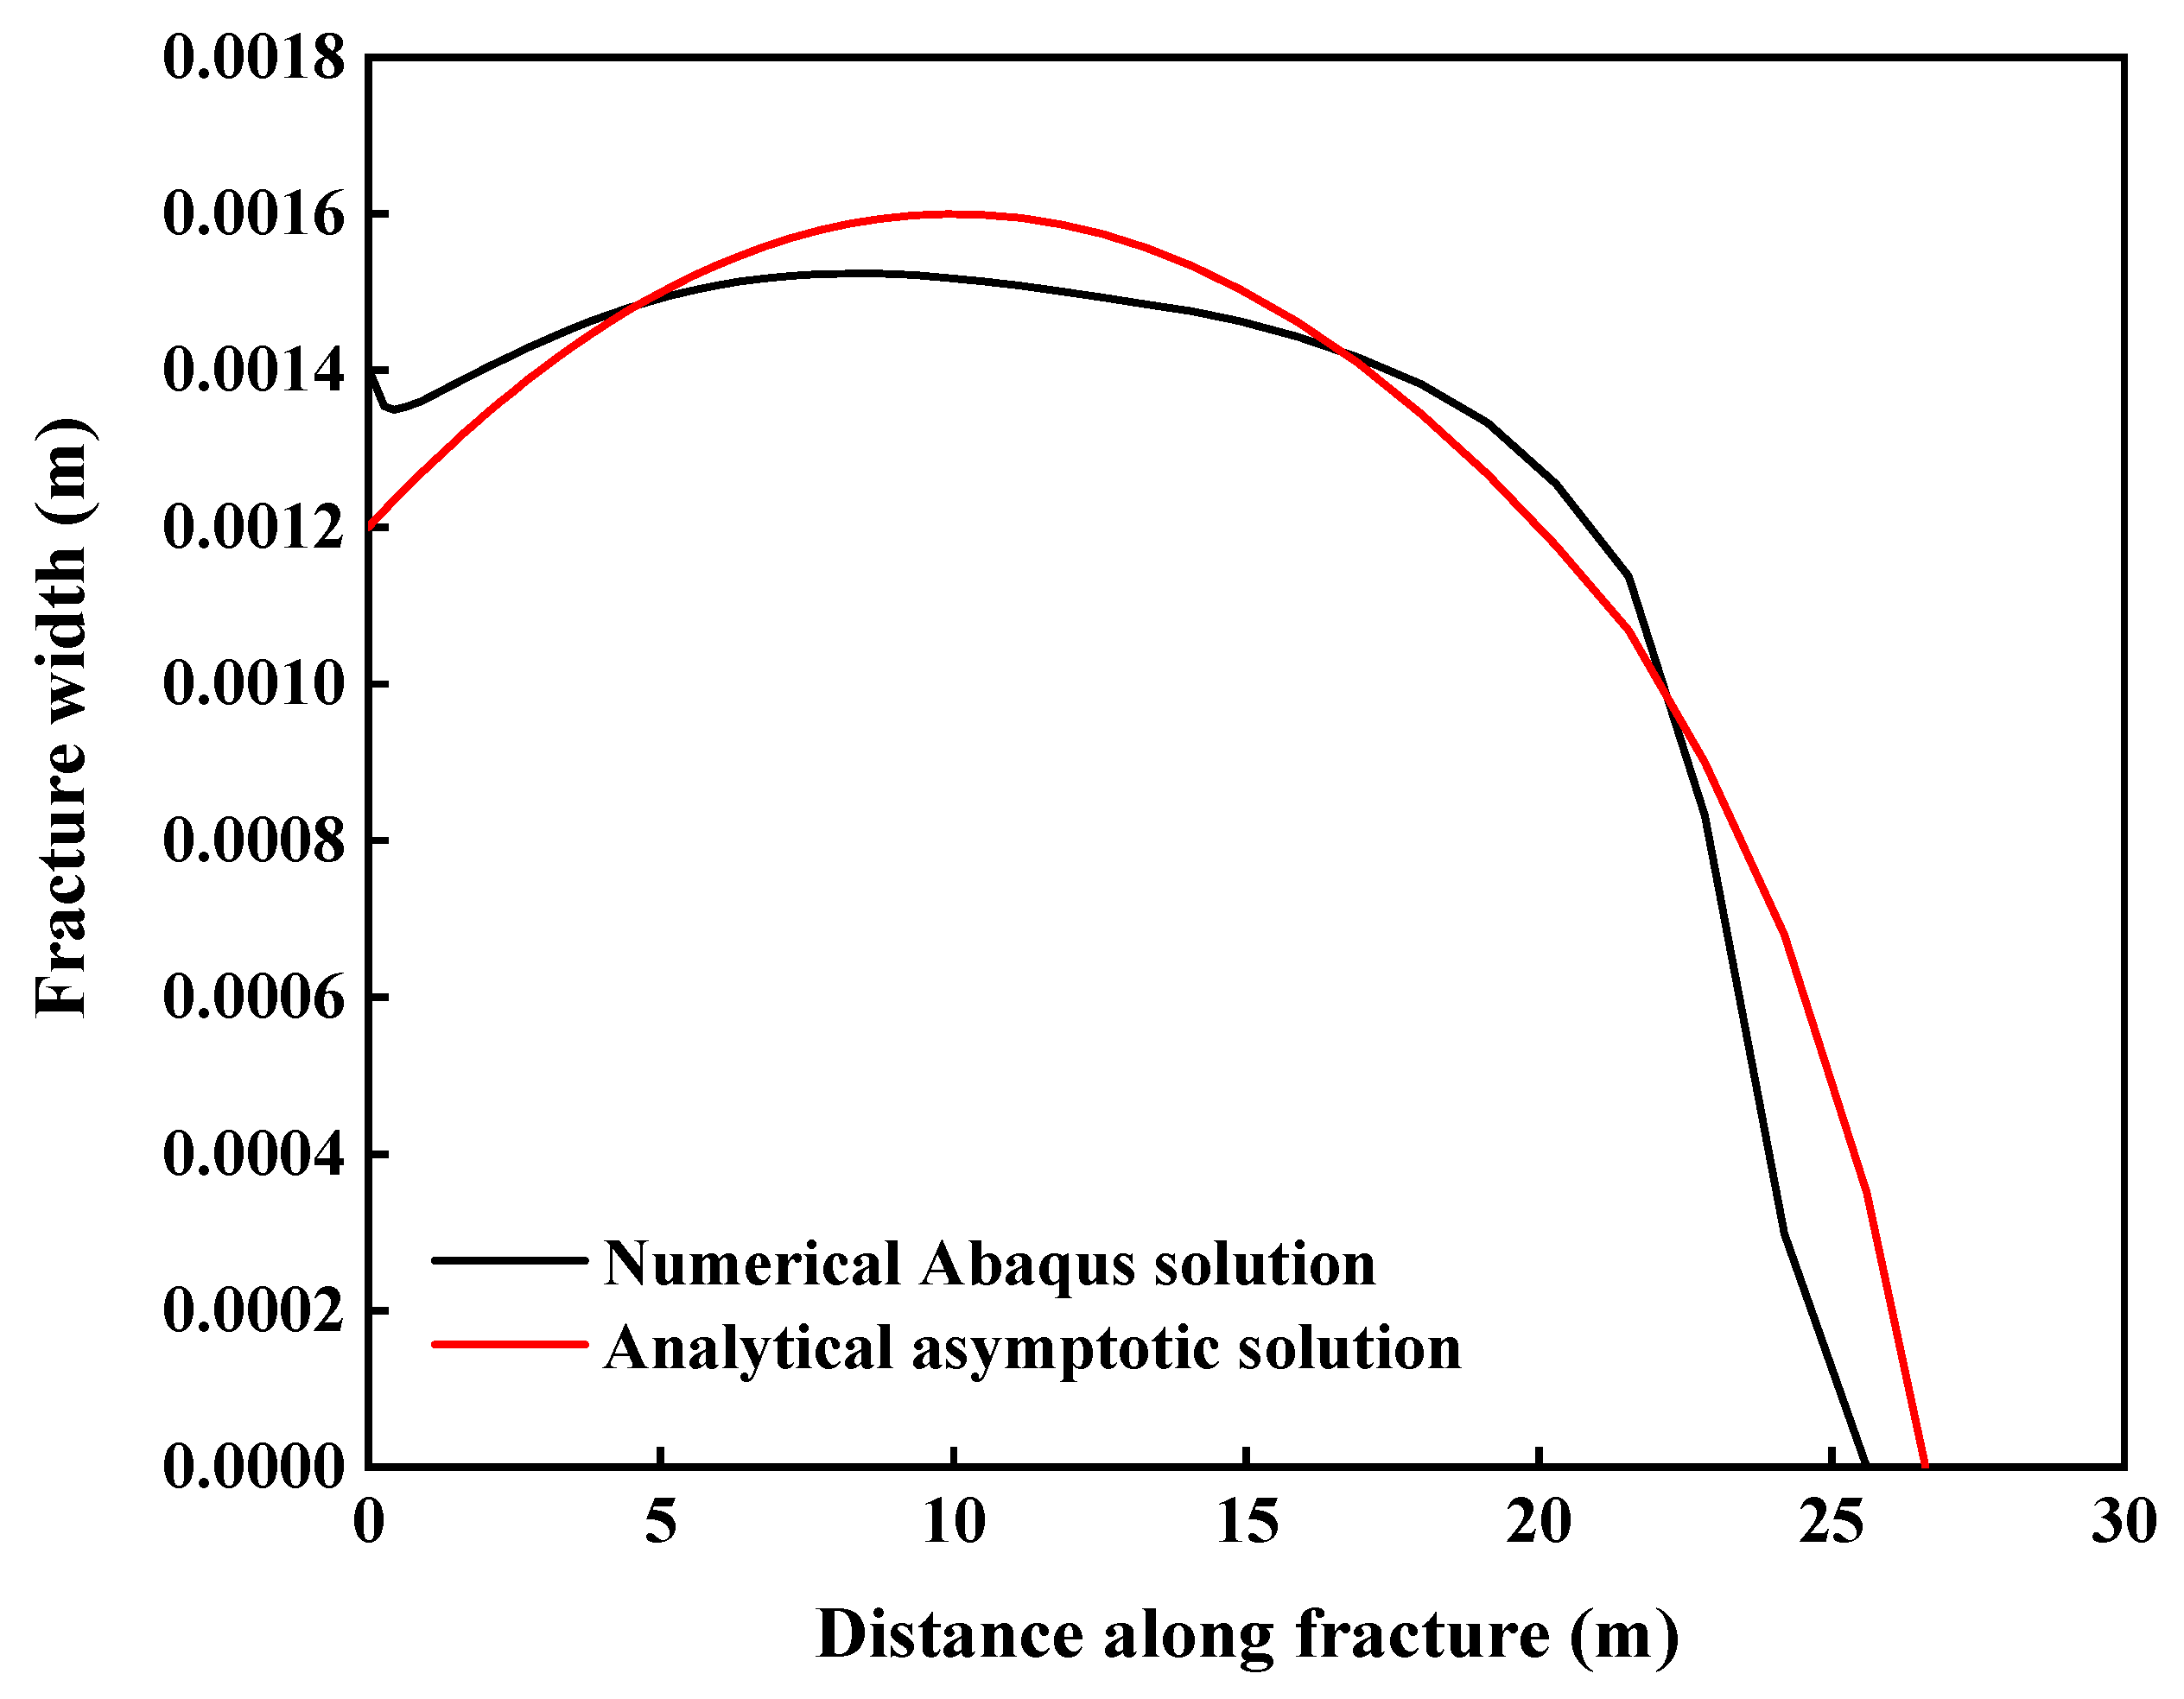
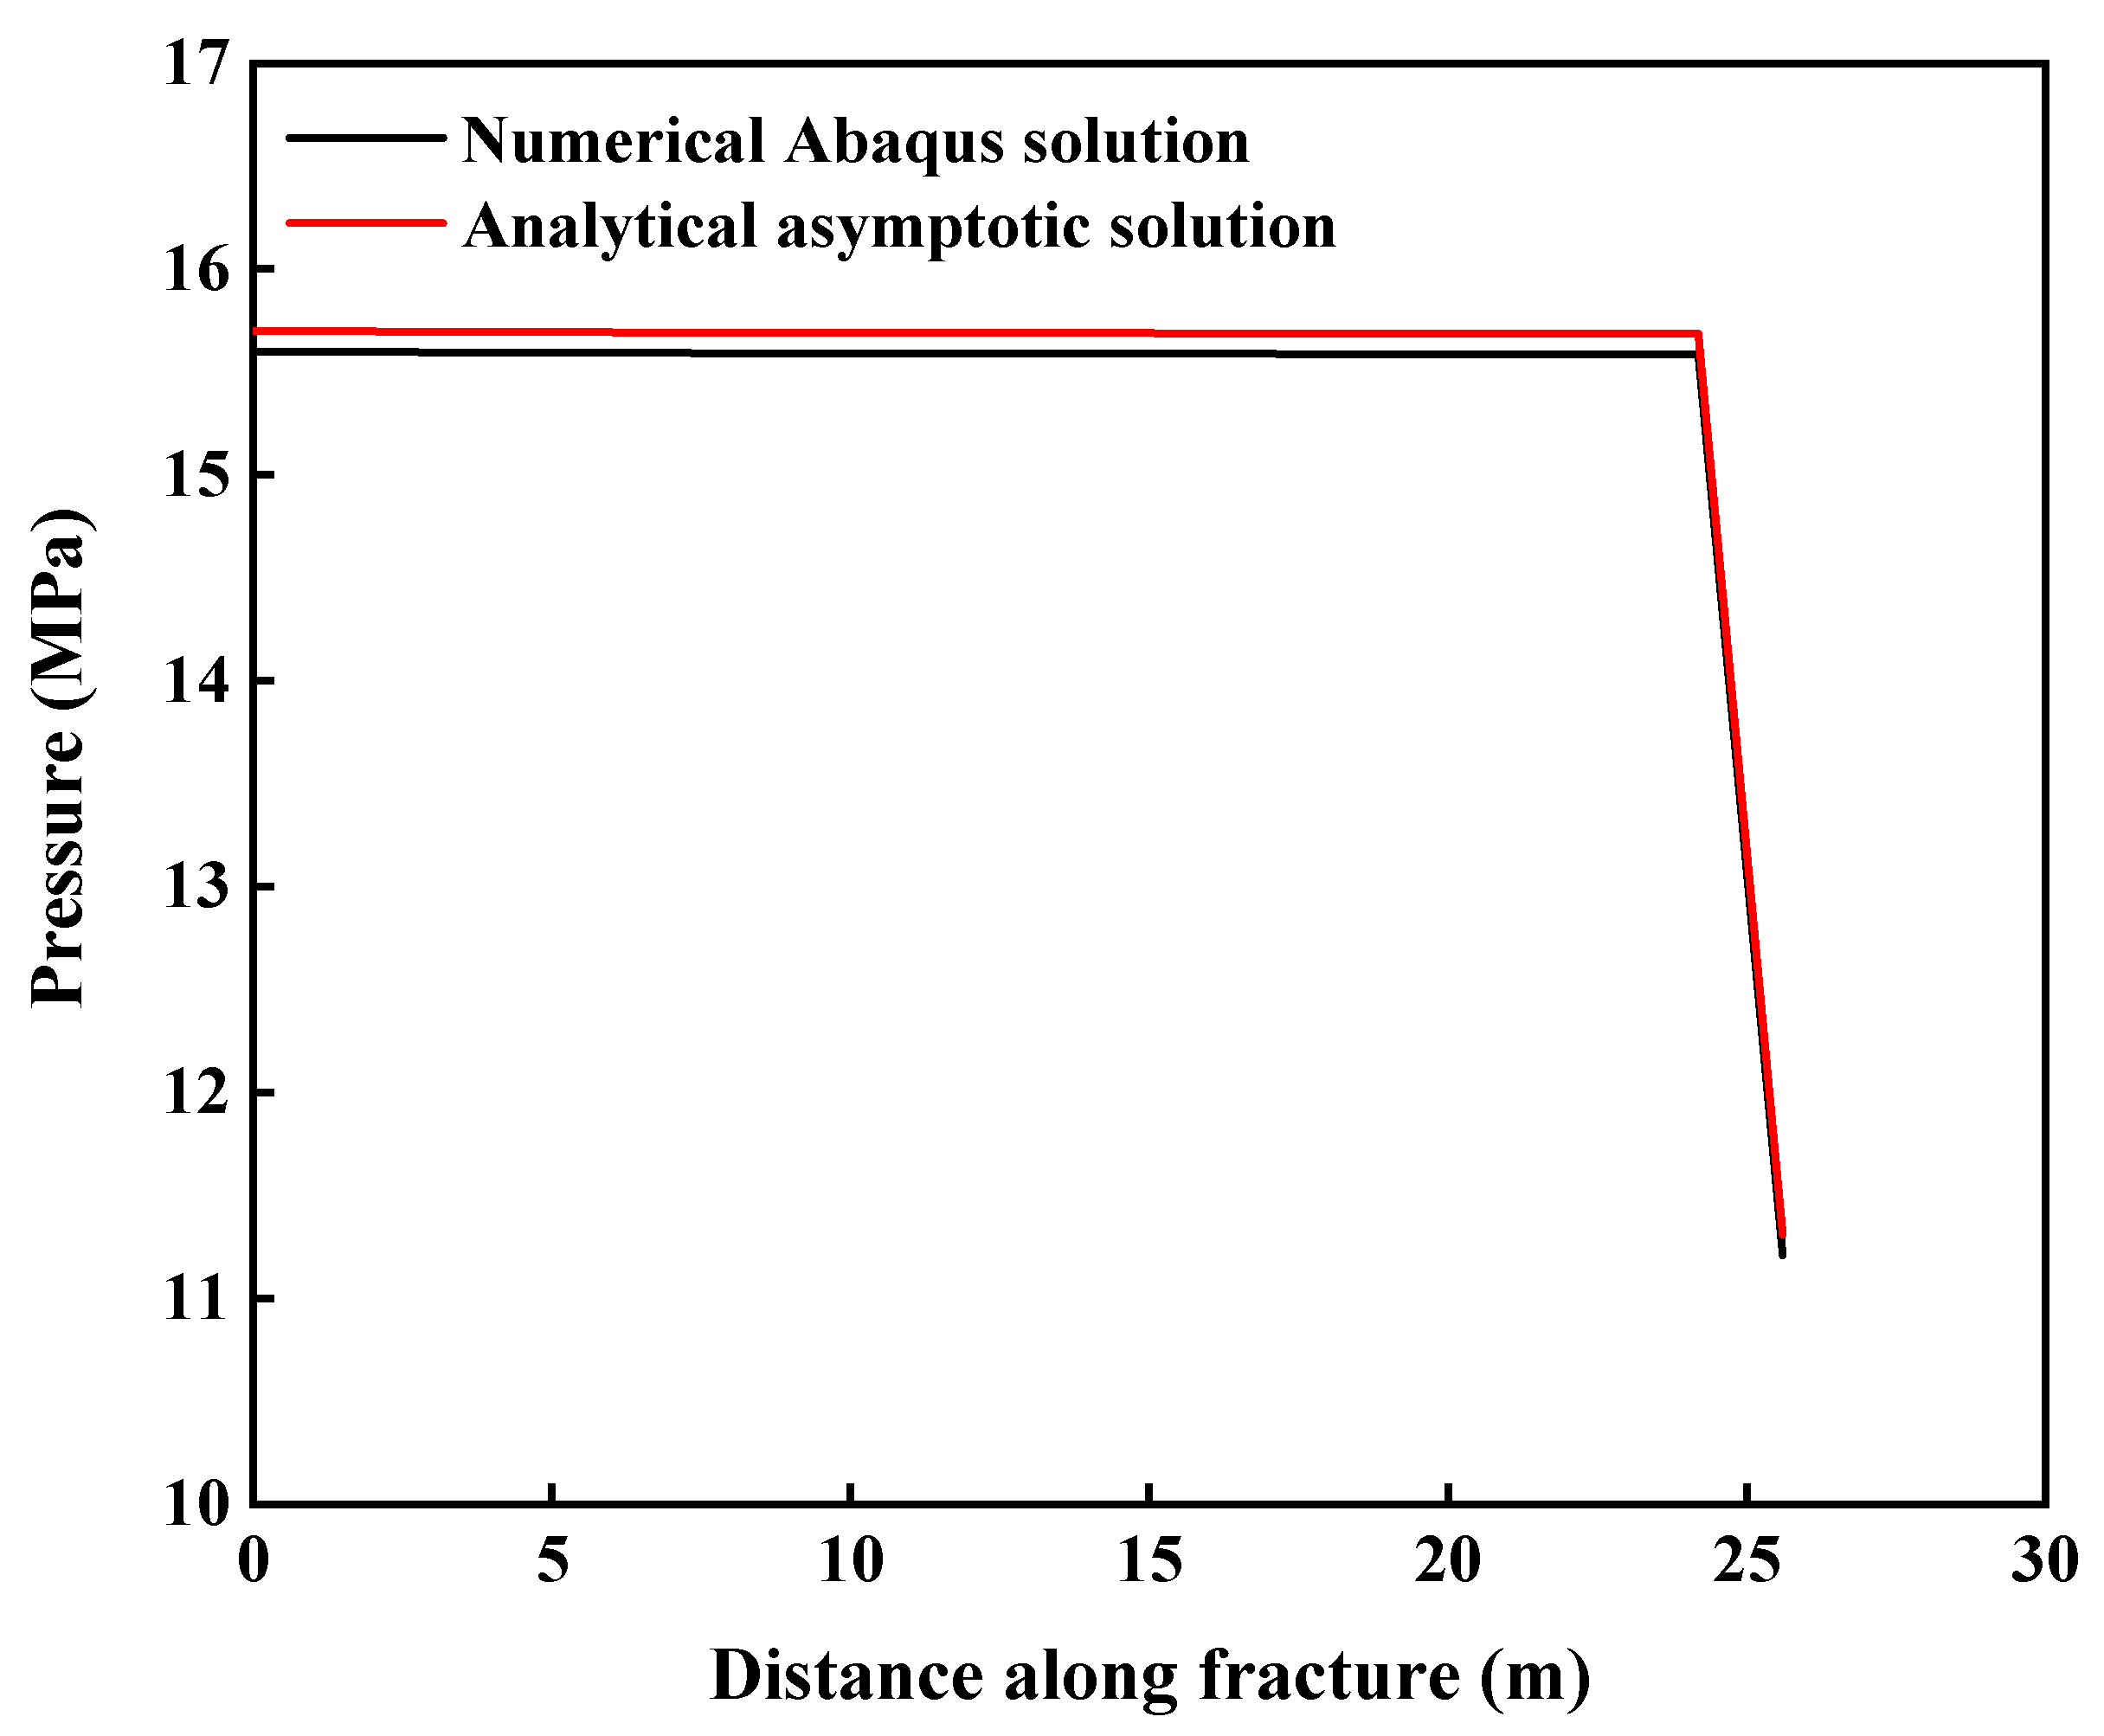
Figure 20 present the asymptotic solutions of time evolution of fracture aperture, fracture length and fluid pressure inside the crack. The asymptotic solutions of the pressure and fracture distribution along the fracture are also presented in
Figure 21 and
Figure 22. The asymptotic solutions were obtained by following the steps of the flowchart in
Figure 3. Good agreement between asymptotic solutions and numerical ABAQUS solutions is observed which allows to validate the numerical model. The numerical results and conclusions obtained in this study can therefore be trusted due to the establishment of the verification analytical model.
8. Conclusions
In this research, a poro-elasto-plastic model based on a finite element method has been established to analyze the influence of the drill string vibration cyclic loads on the development of the wellbore natural fracture. The flow of the fluid inside the wellbore is modeled with the pipe element theory in ABAQUS. Drill string vibration is modeled with a sinusoidal function of time characterized by the magnitude of the stress vibration S and the number of cyclic loads N. The ABAQUS coupled pressure/deformation cohesive zone model is used to simulate the fracture propagation and the fracturing fluid flow, while the pore fluid flow inside the rock formation and the porous medium deformation is described with coupled pore-pressure/deformation continuum finite elements model. The main results of the research showed that:
- (1)
The S-N curve for the formation is subdivided into three main regions: a plastic region with an ultimate strength of 28.85 MPa, the elastic region with a yield strength of 23.5 MPa and an infinite life region with an endurance limit 11.3 MPa;
- (2)
The fracture width as a function of the time profiles follows a sinusoidal behavior similar to the drill string vibration cyclic loads profile; For different increasing cyclic load magnitude S with constant number of cyclic loads N, the maximal values of the fracture width on each fracture profile increased with the cyclic load magnitude; the fracture width increased by 64.77% after application of cyclic loads with parameters S = 11.3 MPa and N = 10;
- (3)
For constant cyclic load magnitude with different number of cyclic loads, an increase of 63.12% of the fracture width is observed after application of cyclic loads with parameters S = 11.3 MPa and N = 15. The maximal values of the fracture width on each fracture profile are almost the same and the oscillating period of the fracture width increases with the number of cyclic loads;
- (4)
For different increasing cyclic load magnitude and constant number of cyclic loads: (i) The fracture width increased with fracture length in the near wellbore region (fracture length less than 5.16 m; (ii) For fracture lengths between 5.16 m and 22.83 m, the fracture width decreased with the fracture length and (iii) for fracture lengths greater than 22.83 m, the profiles of the fracture width in function of the fracture length remain the same;
- (5)
The fracture width profiles in function of the fracture length are almost the same for different increasing number of cyclic loads and constant cyclic load magnitude;
- (6)
The drill string vibration cyclic loads which are hitting the wellbore surface do not greatly affect the fracture length and the bottom hole pressure; However, the fracture width and the loss circulation rates are considerably impacted by the drill string vibration cyclic loads; The fracture width and loss circulation rate increased by 64.77% and 14.3%, respectively, after integration of cyclic loads with parameters S = 11.3 MPa, N = 10 and mud density equal to 1.3 .
The newly built model can accurately predict the natural fracture growth when the wellbore pressure is subjected to fluctuations caused by drill string vibration cyclic loads. The results obtained in this research can be used for wellbore strengthening studies to determine the optimal PSD necessary to plug the natural fractures and mitigate the lost circulation during drilling operations.
