Abstract
With the increasing depth of coal mining, the quantitative evaluation of the degree of geological structure development is becoming increasingly important for the control of mine water hazards in coal mining areas. Understanding the complexity of geological structure development can improve the safety and efficiency of coal production. At present, various evaluation indicators of the geological structure development cannot fully reflect the complexity of faults and folds, and the evaluation process is usually affected by subjective human factors. In this paper, the fractal dimension from fractal theory is used as the evaluation indicator to quantitatively analyze and evaluate the complexity of fault and fold structure in the mining area. To verify the evaluation results, the mathematical geology method is applied in an analysis of the trend surface of fault and fold networks. The results indicate that the fractal dimension can be applied for the quantitative analysis and evaluation of the complexity of fault and fold networks. In addition, the outcome of this work provides new insights into how to characterize the fault and fold structures of coal mining areas in northern China, and has some important implications to ensure the coal production safety.
1. Introduction
Faults and folds are the main geological structures, and their existence in the coal mining area will seriously threaten the safety of coal mining [1,2,3]. Quantitative evaluation of mine fault and fold complexity is of great significance for the control of mine water hazards, the optimization of mining operations and the reduction of invalid drilling footage, which contributes to more safely and reasonably exploiting coal resources [3,4,5]. The geological structures are also the main factor controlling the karst development of coal mines in northern China. In order to prevent water inrush accidents caused by exposed faults and collapse columns, a comprehensive analysis on the complexity of fault and fold networks is necessary to determine the karst development and water-rich areas distribution in mining area [6,7,8,9]. To date, the evaluation indicators often used for characterizing fault and fold structures include the fold extension length, the fold direction, the fault throw, the average length of fault strike, and the uniformity of fault and fold distribution. However, there was no single index to fully and quantitatively reflect the complexity of fault and fold structures. In 1975, the fractal theory was first proposed for a quantitative description of complex and irregular objects in nature, which reveals the self-similarity between the part and whole [10]. The fractal theory has been widely applied in various research fields of geomorphology, rock structure, ore deposition evaluation, minerogenetic prediction, and so on [11,12,13,14,15,16,17,18].
Meanwhile, a large number of studies have proved that the fault and fold networks satisfy fractal characteristics [19,20,21], and the fractal theory has been successfully employed in the quantitative evaluation of fault and fold zone complexity. Scholz and Aviles were the first to apply the fractal theory in the quantitative description of spatial distribution and geometric development of the fault network [22]. Barton and Hsieh made a large number of field outcrops statistics, and found that the fracture distribution have statistical self-similarity [23]. Koukouvelas et al. used the fractal theory to explore the evolution law of normal faults, and analyzed the relationship between the total strain accommodated by faults and the fractal dimension of faults [1]. Shi et al. used the fractal dimension as evaluation index to study the development degree of floor fault in the 3rd mining zone of the No. 15 coal seam in the Liangzhuang coal mine. Results indicate that the complexity of floor fault is positively correlated with its fractal dimension, and the larger the fractal dimension, the higher the risk of water inrush from coal floor [24]. In addition, the degree of fault complexity was quantified by using fractal dimension, and a linear relationship between the water irruption rate and the fault fractal dimension was established to evaluate the risk of mine water hazards [3]. The quantitative relationship between the fault fractal characteristics and the fracture fractal characteristics was also established to predict the fracture development zone for oil-gas exploration [20].
In this paper, four coal mines of the Kailuan Group located in the southeast of the Kaiping syncline are selected as the main research objects, namely the Fan Gezhuang, Qian Jiaying, Lin Xi, and Lv Jiatuo mines. The fractal dimension of the fault and fold structures in this coal mining area is calculated to analyze and evaluate the complexity of the geological structures, quantitatively. In general, the fractal theory is applied to study the degree of geological structure development in the mining area, and the distribution and extent of faults and folds are revealed based on the self-similarity of geological structures.
2. Study Area
The Kailuan mining area, located in Hebei Province, North China, is a typical water-rich mining area, and its geological structure and hydrogeological conditions are complex. The Ordovician limestone aquifers under the seam are not only water-rich with a strong flow but also exhibit a high hydraulic head pressure, and the prevention and control of water inrush from the Ordovician limestone are crucial for safe production in this mining area. At present, the main coal seams (the upper group of coals) are far from the Ordovician limestone in the Qian Jiaying and Fan Gezhuang mines, and the sum of the thicknesses of the separated and thin limestone layers exceeds 100 m. Normally, Ordovician groundwater is unlikely to cover a mining face with such a large vertical thickness, but if the mining encounters a complicated structure in the mining area, the structure and rock fractures can act as water channels, and the Ordovician groundwater may progressively encroach, abruptly increasing the risk of water inrush in the mine.
The structure in the study area has become complicated following Permian-Carboniferous coal formation. The area has experienced different stress fields in the Hercynian-Indochina period, the early and middle Yanshanian movement, the late Yanshanian period, the end of the Yanshanian-early Himalayan and the middle Himalayan periods, and the various multiperiod phases of compression and changes in the orientation of the stress field have produced the current structural assemblage [25]. We have found that the Lv Jiatuo anticline in the south, the Fan Gezhuang TaTuo syncline, the JinKou syncline area, and the northeastern region of the Qian Jiaying mine are high-compression areas with stress oriented in the SW and NE directions. The stress in the study area is relatively concentrated in these areas. A sketch map of the various structures in the research area is shown in Figure 1.
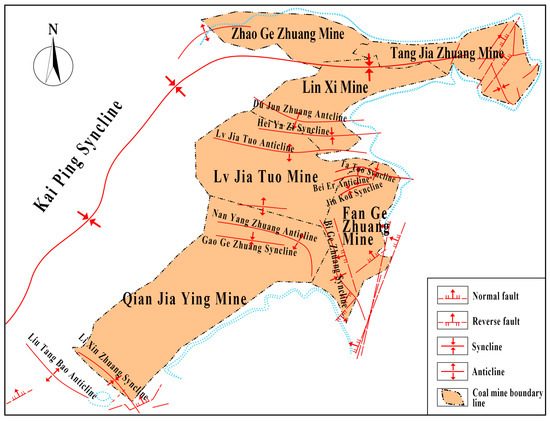
Figure 1.
Sketch map of the structures in the southeastern Kaiping syncline.
3. Fractal Evaluation of the Fault Network Complexity
3.1. Fractal Theory
In 1975, mathematician Benoit B. Mandelbrot for the first time proposed the fractal concept, which is derived from the Latin word fractus. Its original meaning is scored, irregular, or broken [26]. He published his first book, “Fractal: Form, Chance and Dimension,” which marked the official introduction of fractal theory. At present, there is no clear physical definition of a fractal. In space, fractals exhibit the form of a non-integer dimension indicating the theoretical existence from a thought perspective, which, in a certain sense, is a general term for the shape and structure of self-similarity without assigning a characteristic length [27]. Fractal theory emphasizes that in regard to substances or phenomena in regional and local areas, the structure, function, and space in these areas contain particular self-similarity characteristics [28]. The principles of self-similarity and iteration are important tenets of fractal theory, which states that fractals remain invariant under general geometric changes. Fractals can be described by the fractal dimension, which reflects the basic characteristics [29]. The common fractal dimensions include the Hausdorff dimension , similar dimension , capacity dimension , information dimension , and box-counting dimension [30,31,32].
Suppose that a whole is divided into small figures of exactly the same size and shape, and the linearity of each small figure is times that of the original figure, then the Hausdoff dimension is:
where represents the number of small figures contained in the whole .
Suppose that a fractal object (the whole) is divided into subsets (local units) of the same size, and each subset is similar to the original set with a similarity ratio , then the similar dimension of the fractal set defined as:
Suppose that the graph is a finite set in -dimensional Euclidean space , and a sphere with radius is used to fill the graph. If is the minimum number of spheres, then the capacity dimension is:
Consider the number of fractals set elements contained in each covering in the Hausdoff dimension, and let represent the probability that the elements in the fractal set belong to the covering U, then the information dimension is:
Suppose A ∈ H(Rm), where Rm is the Euclidean space, covering A with a closed square box with side length . If Nn(A) represents the number of boxes contained in , then the box-counting dimension is:
As can be seen from the above, fractal dimension has different definitions and calculation methods. The calculation method of fractal dimension is selected according to the characteristics of fractal objects. Here, the fractal dimension of faults and folds are determined by changing the observation scale. We apply two-dimensional and orthogonal grids with the same size, shape, and grid length to cover the topographic map of structure in the mining area. Counting the number of grids containing any traces of faults and folds, we change the grid size from to , and the number of new statistical grids is . The calculation results reveal that and satisfy an exponential relationship as follows:
If the statistical data of and are fitted in the double logarithmic coordinate system, the fitting graph is almost a straight line. The regression equation is:
In Equations (6) and (7), is the size of the two-dimensional and orthogonal grid, and are constants, is the number of grids for the different mesh sizes containing fault and fold traces, and are the fractal dimensions of the fault and fold structures, respectively.
The fault network is associated with a widely developed fault in the mining area. In recent years, research results have revealed that the structure of faults and folds with fractal characteristics involves a complex system [33,34,35]. The complexity of the fault and fold networks in the mining area is expressed by the degree of damage to geological block. It is difficult to quantitatively characterize the complexity of faults and folds by conventional mathematical and statistical methods. If we apply the fractal dimension from fractal theory, we can obtain more accurate results than with conventional statistical methods [3,20]. The fractal dimension is employed to quantitatively evaluate the fold and fault network complexity in the geological block to comprehensively represent various changes in fault and fold indexes, including the extension length, scale, and distribution. According to the determined fractal dimension, we plot contour diagrams of the fault and fold complexity levels in the mining area.
3.2. Determination of the Fold Fractal Dimension
The current data are based on the fault data of the mining engineering plan of coal seam No. 9 in the Fan Gezhuang mine (Figure 2), using the grid coverage method to delineate the structure of the mine and calculate the fractal dimension of each partitioned unit. We plot a contour map of the mine based on the calculation result and quantitatively evaluate the complexity of the geological structure in the Fan Gezhuang mine. The fold and fault fractal dimensions of the Fan Gezhuang mine are calculated as an example, and we describe the acquisition process of the fractal dimension of the faults and folds in the study area below.
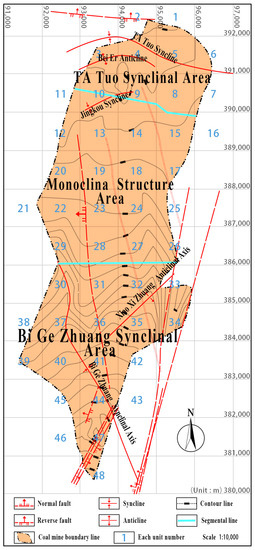
Figure 2.
Diagram of the unit division method of the folds and structures in the Fan Gezhuang mine for fractal evaluation.
3.2.1. Calculation of the Fractal Dimension of Folds in the Fan Gezhuang Mine
First, the unit division is evaluated. Combined with the existing excavation engineering plan of the Fan Gezhuang mine, whereby the grid length is successively halved and divided into four grid levels, the dimensions of the various grids are 1000 m × 1000 m, 500 m × 500 m, 250 m × 250 m, and 125 m × 125 m, thus forming dense grids with an exponential increase in the number of grid blocks, as shown in Figure 2. Thereafter, we sum the number of different grid blocks containing fold traces. The grid classification method is shown in Figure 3. Hence, the complexity of the fault network in the area of the Fan Gezhuang mine can be quantified.
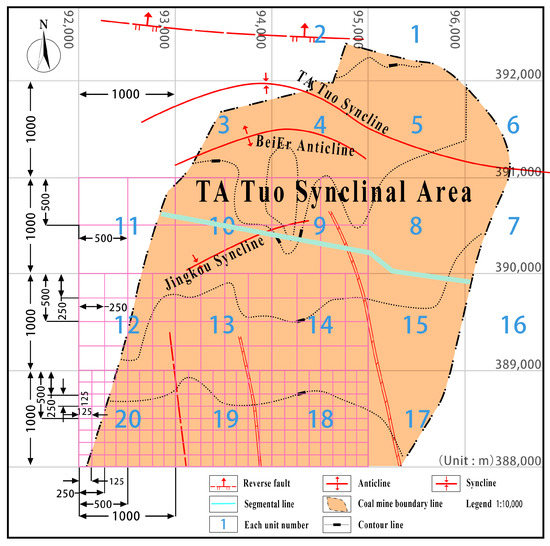
Figure 3.
Sketch diagram of the fractal dimension measurement method.
Second, the number of grids containing a fold is counted, and the fractal dimension of the folds is calculated. All the above grids contain fold traces, and their individual fractal dimensions represent the value at the center point of the partitioned unit. Combined with the analysis results obtained via double logarithmic linear regression of the partitioned unit areas and the whole Fan Gezhuang area, in the Fan Gezhuang mine, the fractal dimension of the folds is 1.144 (Figure 4), and the fractal dimension of most units is higher than 0.90. This indicates that folds are well developed in the Fan Gezhuang mine.
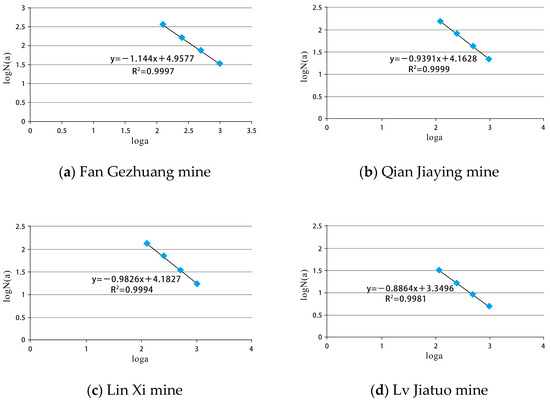
Figure 4.
Double logarithmic fitting chart of the fractal dimension of each mine fold, they are listed as: (a) Fan Gezhuang mine; (b) Qian Jiaying mine; (c) Lin Xi mine; (d) Lv Jiatuo mine.
The fractal dimension of each grid is mostly between 0 and 1.41. According to Table 1, the primary fractal dimension exhibits a wide range, and the fractal dimension of folds is between 0.97 and 1.23 for each partition. The fractal dimension is high, which indicates the structure of folds in the mine area is complicated.

Table 1.
The fold fractal dimension results for the Fan Gezhuang mine.
Fold development is complicated in the northwestern part of the TaTuo syncline and the northeastern and southern parts of the Bi Gezhuang syncline, where the fractal dimensions are 1.199 and 1.227, respectively. The fold development in the partitioned units is much higher than that in the other units. The fold fractal dimension of the other units is low or almost zero. The fractal dimension value is much higher than that in the area with little fold development. Fold development and complexity exhibit high heterogeneity in the mining area.
3.2.2. Calculation of the Fractal Dimension of Folds in the Qian Jiaying Mine
Based on the analysis of the fractal theory and the calculation method of the fractal dimension, the fold fractal dimension of the Qian Jiaying mine is 0.9391 (Figure 1). Most of the fractal dimensions of the partitioned units are less than 0.71. This explains why the fold distribution is fairly homogeneous and the fold complexity is relatively low. Only in grid numbers 95, 75, 11, 25, 36, 48, 24, 92, 37, 27, 50, and 73 is the fold fractal dimension higher than 1.00. This is consistent with the Qian Jiaying mine area being divided into the fold areas in the northeastern and southwestern regions and the middle of the monoclinic structure. The fold fractal dimension of the northeastern region is high, that of the middle region is low, and that of the southwestern region is high.
3.2.3. Calculation of the Fractal Dimension of Folds in the Lin Xi Mine
By calculating and comprehensively analyzing the fractal dimension, we concluded that the fold fractal dimension of the Lin Xi mine is 0.9826 (Figure 4c). The whole region is divided into 43 grids, and the fold fractal dimension is zero in most units. Only in grid numbers 6, 7, 26, 32, 33, 34, 35, and 36 is the fold fractal dimension higher than 1.00. This implies that the fold in the mine has a small distribution range and is unevenly distributed.
3.2.4. Calculation of the Fractal Dimension of Folds in the Lv Jiatuo Mine
By dividing and covering the geological structure map of the Lv Jiatuo mine, we determine that the fold fractal dimension of the Lv Jiatuo mine is 0.886 (Figure 4d). The folds in the Lv Jiatuo mine are unevenly distributed. Except for the Lv Jiatuo anticline, which has a large influence range, the rest of the folds only slightly influence the mine.
By denoting the mesh size as and the grid number of the fold as , we determine that the correlation between the units in the study area is good. We entered all the coordinates and fractal dimensions of the center points of all units into MATLAB software to plot the fold fractal dimension in the study area using a computer.
As shown in Figure 5, all the fold structures in the Fan Gezhuang mine are larger than those in the Qian Jiaying mine. Only the northeastern Qian Jiaying mine area, which is located near the Fan Gezhuang mine, features well-developed folds. A well-developed subsurface fold structure indicates a relatively high concentration of tectonic stress.
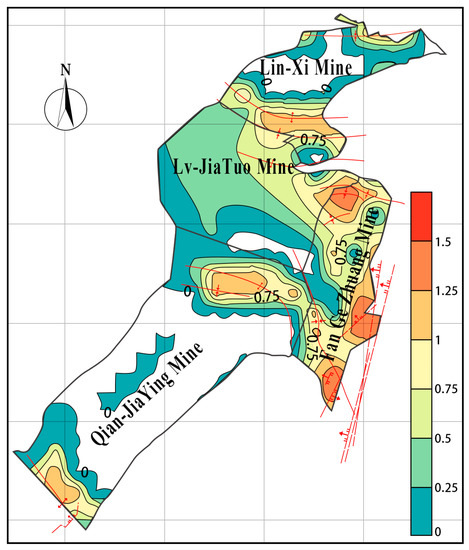
Figure 5.
Map of the fold fractal dimension of the eastern four mines.
3.3. Determination of the Fault Fractal Dimension
3.3.1. Calculation of the Fractal Dimension of Faults in the Fan Gezhuang Mine
We establish grids to cover the geological structure chart and calculate the fractal dimension of the fault, and the fractal dimension of the Fan Gezhuang mine fault is 1.5766 (Figure 6a), while the majority of the fractal dimensions of the partitioned units are higher than 0.8, namely, between 1 and 1.96. This indicates that many faults are unevenly distributed in the Fan Gezhuang mine study area. The fractal dimensions in grid numbers 14, 26, 18, 10, and 23, which are concentrated in the Ta Tuo syncline area of the Fan Gezhuang mine, are higher than 1.90. Fault structures are relatively well developed in these areas, and most faults are normal faults.
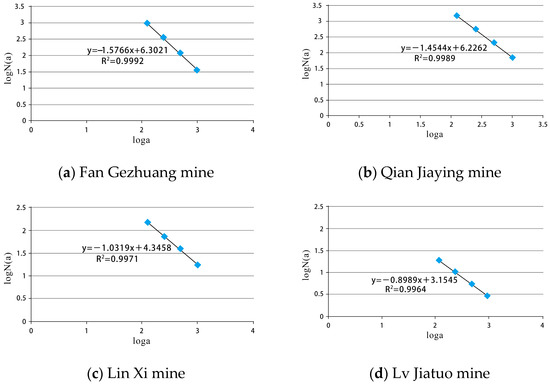
Figure 6.
Double logarithmic fitting chart of the fractal dimensions of faults in each mine, they are listed as: (a) Fan Gezhuang mine; (b) Qian Jiaying mine; (c) Lin Xi mine; (d) Lv Jiatuo mine.
3.3.2. Calculation of the Fractal Dimension of Faults in the Qian Jiaying Mine
Combining the results of double logarithmic linear regression of the grid data for each unit and the fault network analysis of the entire Qian Jiaying mine, we determine that the fault fractal dimension of the Qian Jiaying mine is 1.4544 (Figure 6b). Most of the fractal dimensions of the partitioned units are greater than 0.9, and the values are between 0.90 and 1.96, which reveals large differences. This implies that many faults are well developed and unevenly distributed in the Qian Jiaying mine. The fractal dimensions in grid numbers 22, 39, 21, 38, 29, 30, and 69, which are concentrated in the northeastern Qian Jiaying mine, are higher than 1.9. This indicates that the fault structures are relatively well developed in this area, and the faults are extensional normal faults.
3.3.3. Calculation of the Fractal Dimension of Faults in the Lin Xi Mine
Using the same method, we calculate the fractal dimension of the Lin Xi mine fault to be 1.0319 (Figure 6c). The majority of the fractal dimensions of the partitioned units approach 0, and the values are between 0.80 and 1.50. Many faults occur in a certain part of the Fan Gezhuang mine, and their distribution is very uneven. We observe that the fault structures are well developed in the northeastern and southeastern corners of the Lin Xi mine, as shown in Figure 7.
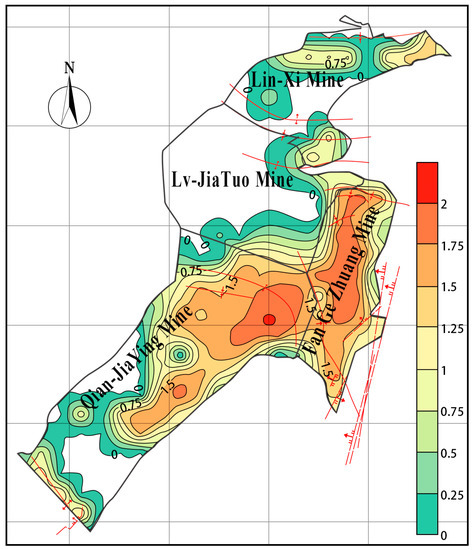
Figure 7.
Map of the fractal dimension of the fault network in the eastern four mines.
3.3.4. Calculation of the Fractal Dimension of Faults in the Lv Jiatuo Mine
The fractal dimension of faults in the Lv Jiatuo mine is calculated, and we obtain a fault fractal dimension of 0.9964, as shown in Figure 6d. Most partitioned units exhibit a fractal dimension higher than 0, namely, between 0.80 and 1.00. The fault structures are not widely distributed, and fault development is concentrated and complicated in the Lv Jiatuo mine.
According to the obtained fractal dimension data, we applied MATLAB software to generate a synthesized contour map of the fault and fold fractal dimensions in the Qian Jiaying and Fan Gezhuang mines, as shown in Figure 8. The figure demonstrates that the fault and fold fractal dimensions of the Ta Tuo syncline area and Jin Kou syncline are high and that the developed structure is complex.
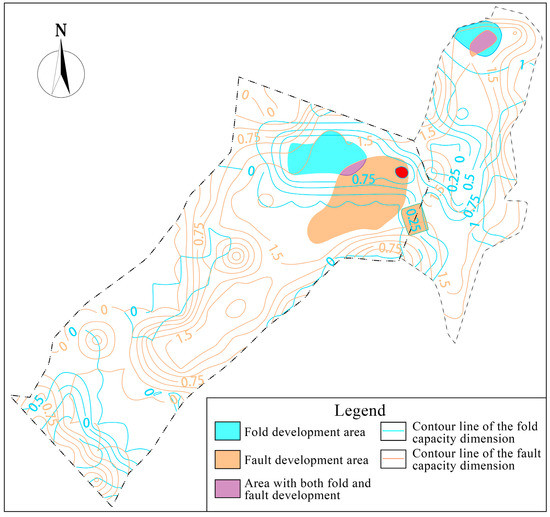
Figure 8.
Synthesized map of the fault and fold fractal dimensions in the Qian Jiaying and Fan Gezhuang mines.
4. Analysis of the Mathematical Geology
In addition to using the fractal dimension, we can also apply the mathematical geology method to assess the development level of geological structures, thereby verifying the analytical fractal calculation results. Here, the trend surface analysis of mathematical geology method is conducted based on the distribution of the structures, which is to use simple power polynomials to fit complex curved surfaces to flatten and fill real curved surfaces. Selecting the No. 9 coal seam with an extremely well-developed fault as an example, we describe the pattern of fault and fold development.
Figure 9 shows a contour map of the floor of the No. 9 coal seam, and the distribution of the geological structure in the Qian Jiaying mine is depicted. The geological structures in the No. 9 coal seam are well developed, and the central shape is a monoclinal structure dipping to NW. The fold structure expands in the northeast and southwest of the mining area, and the fold is very well developed in the northeast of the mining area. The fold axis is oriented approximately NW, and the fault is very well developed in the Qian Jiaying mine.
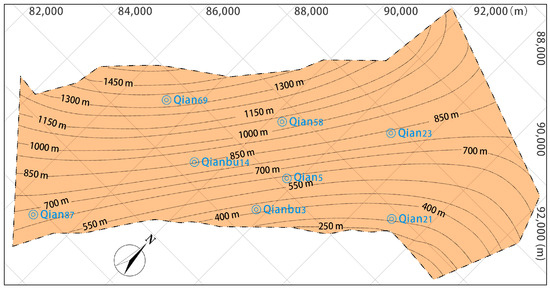
Figure 9.
Diagram of the cubic trend surface of the No. 9 coal seam floor in the Qian Jiaying mine.
With the use of the mathematical geology method, we analyzed the trend surface corresponding to the floor of the No. 9 coal seam in the Qian Jiaying mine. The one-variable multiple linear equation is selected as the trend surface model to fit the spatial surface of the geological structure. The results show that the fitting degree of the initial trend surface analysis is higher than 0.64, and the quadratic fitting degree reaches 0.77, which is a high fitting level. Moreover, the cubic fitting degree of the trend surface is very high, namely, up to 0.91.
Therefore, this research applies the gridding method with MATLAB software to analyze the results of the cubic trend surface and to obtain the cubic trend surface chart and cubic residual diagram of the No. 9 coal seam floor (Figure 9 and Figure 10, respectively). Based on the cubic trend surface diagram of the No. 9 coal seam floor in the Qian Jiaying mine, we deduce that only the monoclinal structure in the middle mining area is consistent with the contour map of the coal floor, and the overall structure is anomalous in the NE direction. The trend surface in the northeastern and southwestern regions is not consistent with the contour map of the No. 9 coal seam floor, and the trend surface indicates a higher curvature of the bend. This phenomenon illustrates that the fold structure in the Qian Jiaying mine is a small fold and is not notable.
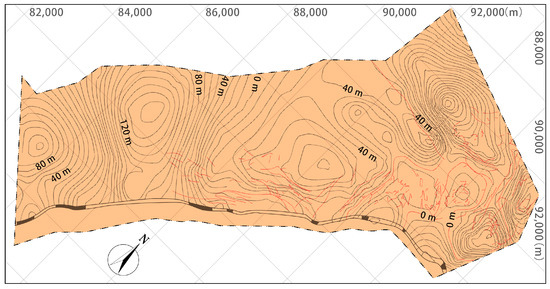
Figure 10.
Diagram of the cubic residual contours of the No. 9 coal seam floor in the Qian Jiaying mine.
The cubic residual diagram of the No. 9 coal seam floor in the Qian Jiaying mine shows that the distribution of the residual contours in the northeast of the No. 9 coal seam floor is clear, and that there are three extremely thick residual contours. The geological structure of this area is extremely complex. The fold structure in the region is represented by the distribution of the zero line, but the extension direction of the zero line in the southwest of the fold region accurately reflects the position of the fold axes in the division of the structure. This is consistent with the distribution of the fractal dimensions of folds and faults in the northeastern Qian Jiaying mine. This approach could be applied to quantify various indexes, including the structural complexity, extension length, size, and distribution of the structure. The quantitative evaluation of the complexity of the faults and folds by the fractal dimension is assessed with the conventional mathematical statistics method, and the fractal dimension method yields better results.
5. Conclusions
In this work, the fractal theory is used to quantitatively evaluate the complexity of geological structures in the coal mine area. The fractal dimensions of folds and faults in four coal mines are calculated respectively and used as evaluation indexes to evaluate the development degree of faults and folds, and the mathematical geology analysis is conducted to verify the accuracy of the evaluation. The results of this method reflect certain advantages, and are of great significance to coal production safety. The main conclusions are as follows:
- (1)
- The value of the fold fractal dimension of the Fan Gezhuang mine is 1.44, and this value is very high, which indicates the geological structures in the mine area is complicated. The fractal dimension of each partitioned unit is mainly between 0.97 and 1.23, and the obtained results on the structural complexity of the region reveal a high heterogeneity. The value of the fault fractal dimension is 1.5766, and the fractal dimension is between 1.00 and 1.96 in most partitioned units and is higher than 0.8 everywhere. Many uniformly distributed faults are concentrated in the Ta Tuo syncline area, and most faults are well-developed extensional normal faults.
- (2)
- The fold fractal dimension value in the Qian Jiaying mine is 0.9391. The fractal dimension of the majority of the partitioned units is less than 0.71, which shows the fractal dimension of the many uniformly distributed folds is high in the northeast, low in the middle, and high in the southwest. The fault fractal dimension is 1.4544, and the fractal dimension of most partitioned units is between 0.9 and 1.96, with most being higher than 0.9, which reveals a wide range. Many faults are uniformly distributed in the northeastern region, and most faults are well-developed extensional normal faults.
- (3)
- Three extremely thick residual contour areas occur in the northeast of the No. 9 coal seam floor. The fold structure in the region is represented by the distribution of the zero line. The extension direction of the zero line of the fold in the southwestern region accurately reflects the position of the fold axes in the structure division. The synthesized diagram of the fold and fault fractal dimensions in the Qian Jiaying and Fan Gezhuang mines is consistent with the distribution of the fold and fault fractal dimensions in the northeast of the Qian Jiaying mine. This method can be applied to quantify various indexes including the number, scale, development degree, and combination manner.
Author Contributions
Conceptualization, G.Z. and J.G.; methodology, J.G.; validation, B.X., L.X., and G.Z.; formal analysis, G.Z.; investigation, J.G.; resources, S.Y.; data curation, J.G.; writing—original draft preparation, G.Z.; writing—review and editing, M.R.S.; visualization, B.X.; supervision, L.X.; project administration, Z.D.; funding acquisition, S.Y. All authors have read and agreed to the published version of the manuscript.
Funding
This research was funded by the Key Natural Science Foundation of Hebei Province, grant number D2017508099 and National Natural Science Foundation of China, grant numbers 41772253, 41972249, and 51774136. Additional funding was provided by the Engineering Research Center of Geothermal Resources Development Technology and Equipment, Ministry of Education, China.
Institutional Review Board Statement
Not applicable.
Informed Consent Statement
Not applicable.
Data Availability Statement
Data available in this manuscript.
Conflicts of Interest
The authors declare no conflict of interest.
References
- Koukouvelas, I.K.; Asimakopoulos, M.; Doutsos, T.T. Fractal characteristics of active normal faults: An example of the eastern Gulf of Corinth, Greece. Tectonophysics 1999, 308, 263–274. [Google Scholar] [CrossRef]
- Zhang, R.; Jiang, Z.; Zhou, H.; Yang, C.; Xiao, S. Groundwater outbursts from faults above a confined aquifer in the coal mining. Nat. Hazards 2013, 71, 1861–1872. [Google Scholar] [CrossRef]
- Li, R.; Wang, Q.; Wang, X.; Liu, X.; Li, J.; Zhang, Y. Relationship Analysis of the Degree of Fault Complexity and the Water Irruption Rate, Based on Fractal Theory. Mine Water Environ. 2017, 36, 18–23. [Google Scholar] [CrossRef]
- Adinehvand, R.; Raeisi, E. Characterization of a karst aquifer in a complex tectonic region, Southwestern Iran. J. Cave Karst Stud. 2018, 80, 190–205. [Google Scholar] [CrossRef]
- Rainaud, J.F.; Clochard, V.; Dele′pine, N.; Crabie, T.; Poudret, M.; Perrin, M.; Klein, E. Building a 3D faulted a priori model for stratigraphic inversion: Illustration of a new methodology applied on a North Sea field case study. J. Appl. Geophys. 2018, 154, 128–135. [Google Scholar] [CrossRef]
- Schwartz, V.B.; Orndorff, W. Hydrogeology of the Mississippian Scarp-Slope Karst System, Powell Mountain. J. Cave Karst Stud. 2009, 71, 168–179. [Google Scholar] [CrossRef]
- Li, H.; Bai, H.; Wu, J.; Ma, Z.; Ma, K.; Wu, J.; Du, Y.; He, S. A Cascade Disaster Caused by Geological and Coupled Hy-dro-Mechanical Factors-Water Inrush Mechanism from Karst Collapse Column under Confining Pressure. Energies 2017, 10, 1938. [Google Scholar] [CrossRef]
- Foudili, D.; Bouzid, A.; Berguig, M.C.; Bougchiche, S.S.; Abtout, A.; Guemache, M.A. Investigating karst collapse geo-hazards using magnetotellurics: A case study of M’rara basin, Algerian Sahara. J. Appl. Geophys. 2019, 160, 144–156. [Google Scholar] [CrossRef]
- Yin, S.; Zhang, X.; Xu, H.; Liu, M.; Xu, B. Optimization of permeability coefficient and aquifer thickness in large-well-method. Coal Geol. Explor. 2015, 43, 53–56. (In Chinese) [Google Scholar]
- Mehaute, A.L. Fractal Geometries Theory and Applications; CRC Press: Boca Raton, FL, USA, 1991; p. 181. [Google Scholar]
- Liucci, L.; Melelli, L. The fractal properties of topography as controlled by the interactions of tectonic, lithological, and geomorphological processes. Earth Surf. Process. Landforms 2017, 42, 2585–2598. [Google Scholar] [CrossRef]
- Haddad-Martim, P.M.; Carranza, E.J.M.; Roberto, C.; Filho, D.S. The fractal nature of structural controls on ore formation: The Case of the Iron oxide copper-gold deposits in the carajás mineral province, Brazilian amazon. Econ. Geol. 2018, 113, 1499–1524. [Google Scholar] [CrossRef]
- Liu, Y.; Zhu, L.; Ma, S.; Guo, F.; Gong, Q.; Tang, S.; Gopalakrishnan, G.; Zhou, Y. Constraining the distribution of elements and their controlling factors in the Zhaojikou Pb–Zn ore deposit, SE China, via fractal and compositional data analysis. Appl. Geochem. 2019, 108, 104379. [Google Scholar] [CrossRef]
- Simonov, D.A.; Zakharov, V.S.; Bryantseva, G.V. Complex Geomorphological, Morphological, and Fractal Analysis of the Most Recent Vertical Tectonic Movements of the Kerch Peninsula. Mosc. Univ. Geol. Bull. 2019, 74, 549–558. [Google Scholar] [CrossRef]
- Yu, Q.; Dai, Z.; Zhang, Z.; Soltanian, M.R.; Yin, S. Estimation of Sandstone Permeability with SEM Images Based on Fractal Theory. Transp. Porous Media 2019, 126, 701–712. [Google Scholar] [CrossRef]
- Dong, S.; Xu, L.; Dai, Z.; Xu, B.; Yu, Q.; Yin, S.; Zhang, X.; Zhang, C.; Zang, X.; Zhou, X.; et al. A Novel Fractal Model for Estimating Permeability in Low-Permeable Sandstone Reservoirs. Fractals 2020, 28, 2040005. [Google Scholar] [CrossRef]
- Yu, Q.; Xiong, Z.; Du, C.; Dai, Z.; Soltanian, M.R.; Soltanian, M.; Yin, S.; Liu, W.; Liu, C.; Wang, C.; et al. Identification of rock pore structures and permeabilities using electron microscopy experiments and deep learning interpretations. Fuel 2020, 268, 117416. [Google Scholar] [CrossRef]
- Zhou, S.-G.; Zhou, K.-F.; Wang, J.-L. Geochemical metallogenic potential based on cluster analysis: A new method to extract valuable information for mineral exploration from geochemical data. Appl. Geochem. 2020, 122, 104748. [Google Scholar] [CrossRef]
- Mandelbrot, B. How Long Is the Coast of Britain? Statistical Self-Similarity and Fractional Dimension. Science 1967, 156, 636–638. [Google Scholar] [CrossRef]
- Fan, C.; Qin, Q.; Hu, D.; Wang, X.; Zhu, M.; Huang, W.; Li, Y.; Ashraf, M.A. Fractal characteristics of reservoir structural fracture: A case study of Xujiahe Formation in central Yuanba area, Sichuan Basin. Earth Sci. Res. J. 2018, 22, 113–118. [Google Scholar] [CrossRef]
- Stanton-Yonge, A.; Cembrano, J.; Griffith, W.; Jensen, E.; Mitchell, T. Self-similar length-displacement scaling achieved by scale-dependent growth processes: Evidence from the Atacama Fault System. J. Struct. Geol. 2020, 133, 103993. [Google Scholar] [CrossRef]
- Scholz, C.H.; Aviles, C.A. Fractal dimension of the 1906 San Andreas fault and 1915 Pleasant Valley faults. Earthq. Notes 1985, 55, 20. [Google Scholar]
- Barton, C.C.; Hsieh, P.A. Physical and hydrologic flow properties of fractures. In Proceedings of the 28th International Geological Congress Field Trip Guidebook T385, Geophysical Union, Washington, DC, USA, 9–19 July 1989. [Google Scholar]
- Shi, L.; Liu, L.; Zhou, J.; Xing, T.; Niu, C.; Wang, Y. Fault Fractal Information Dimension and Its Application in Floor Water Burst. Coal Ming Technol. 2014, 19, 12–16. (In Chinese) [Google Scholar]
- Li, X.; Wang, Q.; Hong, Y.; Yan, H.; Liu, D. Tectonics Control on Coal Measures in Donghuantuo Coalmine, Kailuan Mining Area. Coal Geol. China 2008, 20, 42–44. (In Chinese) [Google Scholar]
- Mandelbrot, B.B.; Wheeler, J.A. The Fractal Geometry of Nature. Am. J. Phys. 1983, 51, 286–287. [Google Scholar] [CrossRef]
- Adler, P.M.; Thovert, J.-F. Fractal porous media. Transp. Porous Media 1993, 13, 41–78. [Google Scholar] [CrossRef]
- Gao, M.; Ji, P.; Miao, Z.; Wan, K.; He, Q.; Xue, S.; Pei, Z. Pore structure evolution and fractal characteristics of Zhaotong lignite during drying. Fuel 2020, 267, 117309. [Google Scholar] [CrossRef]
- Rostamzadeh, H.; Salimi, M.R.; Taeibi-Rahni, M. Pore-scale modeling of rarefied gas flow in fractal micro-porous media, using lattice Boltzmann method (LBM). J. Therm. Anal. Calorim. 2018, 135, 1931–1942. [Google Scholar] [CrossRef]
- Karimpouli, S.; Tahmasebi, P. 3D multi-fractal analysis of porous media using 3D digital images: Considerations for heter-ogeneity evaluation. Geophys. Prospect. 2019, 67, 1082–1093. [Google Scholar] [CrossRef]
- Xia, Y.; Cai, J.; Wei, W.; Hu, X.; Wang, X.; Ge, X. A New Method for Calculating Fractal Dimensions of Porous Media Based on Pore Size Distribution. Fractals 2018, 26, 26. [Google Scholar] [CrossRef]
- Foroutan-pour, K.; Dutilleul, P.; Smith, D.J. Advances in the implementation of the box-counting method of fractal di-mension estimation. Appl. Math. Comput. 1999, 105, 195–210. [Google Scholar]
- Matsumoto, N.; Yomogida, K.; Honda, S. Fractal analysis of fault systems in Japan and the Philippines. Geophys. Res. Lett. 1992, 19, 357–360. [Google Scholar] [CrossRef]
- Dimitrakopoulos, R.; Scott, J.; Li, S. Multi-fractal conditional simulation of fault populations in coal seams using analogues: Method and application. Int. J. Mining Reclam. Environ. 2018, 33, 340–352. [Google Scholar] [CrossRef]
- Yang, B.; Yuan, J.; Duan, L.; Liu, Q. Using GIS and Fractal Theory to Evaluate Degree of Fault Complexity and Water Yield. Mine Water Environ. 2018, 38, 261–267. [Google Scholar] [CrossRef]


Publisher’s Note: MDPI stays neutral with regard to jurisdictional claims in published maps and institutional affiliations. |
© 2021 by the authors. Licensee MDPI, Basel, Switzerland. This article is an open access article distributed under the terms and conditions of the Creative Commons Attribution (CC BY) license (https://creativecommons.org/licenses/by/4.0/).