Abstract
This paper summarizes the risk assessment and management workflow developed and applied to the Southwest Regional Partnership on Carbon Sequestration (SWP) Phase III Demonstration Project. The risk assessment and management workflow consists of six primary tasks, including management planning, identification, qualitative analysis, quantitative analysis, response planning, and monitoring. Within the workflow, the SWP assembled and iteratively updated a risk registry that identifies risks for all major activities of the project. Risk elements were ranked with respect to the potential impact to the project and the likelihood of occurrence. Both qualitative and quantitative risk analyses were performed. To graphically depict the interactions among risk elements and help building risk scenarios, process influence diagrams were used to represent the interactions. The SWP employed quantitative methods of risk analysis including Response Surface Method (RSM), Polynomial Chaos Expansion (PCE), and the National Risk Assessment Partnership (NRAP) toolset. The SWP also developed risk response planning and performed risk control and monitoring to prevent the risks from affecting the project and ensure the effectiveness of risk management. As part of risk control and monitoring, existing and new risks have been tracked and the response plan was subsequently evaluated. Findings and lessons learned from the SWP’s risk assessment and management efforts will provide valuable information for other commercial geological CO2 storage projects.
1. Introduction
Storage of CO2 in geologic formations is one of the most applicable options for mitigating anthropogenic CO2 emissions contributing to climate change [1,2,3]. Particularly, CO2-enhanced oil recovery (CO2-EOR, an oil production method in which oil recovery is enhanced by CO2 injection) and storage have gained specific interest for its potential economic benefits of increasing hydrocarbon recovery and reducing risks of overpressure [4,5,6,7,8]. However, due to the nature of the deep subsurface environment and its uncertainties, geologic CO2 storage (GCS) projects require appropriate assessment and management of risks for safe operation.
The Southwest Regional Partnership (SWP) Phase III project is an industrial research collaboration focused on an active CO2-EOR and storage field, the Farnsworth Unit (FWU), located within the Anadarko Basin of northernmost Texas along the Oklahoma border [9]. The FWU is both a CO2 sequestration demonstration and a research project managed by the SWP, one of seven regional carbon sequestration partnerships (RCSP’s) instigated and supported by the U.S. Department of Energy (DOE) and its National Energy Technology Laboratory (NETL) [10].
The FWU project seeks to predict and to monitor the effects of injecting CO2 into an actively producing oilfield. The outcomes of the FWU project research are of value to oilfield operators, who seek CO2-EOR and storage, as well as other stakeholders interested in long-term GCS.
For the SWP’s FWU project, risk information was routinely applied toward both strategic and tactical design and adjustment of project activities so that risk of failure (in any dimension) can be minimized. Risks associated with GCS include CO2 leakage (to shallow subsurface and/or atmosphere), geomechanical risks (e.g., fault reactivation and induced seismicity), storage/injectivity loss, production decrease in CO2-EOR, etc. This paper summarizes the risk assessment workflow developed and applied to the FWU project. The risk assessment workflow is an iterative process where potential risks are identified and monitored. The likelihood and severity of the risks are quantified, and a response plan is subsequently established and updated.
2. Risk Assessment Workflow
To accomplish the effective risk assessment and risk management, SWP formed a risk assessment working group (RAWG) from the initial stage of the project and established and applied the continuous and iterative risk assessment and management workflow shown in Figure 1. Other major working groups within the SWP include monitoring, verification, and accounting (MVA), characterization, and simulation. Each working group comprises of active project personnel of each discipline.
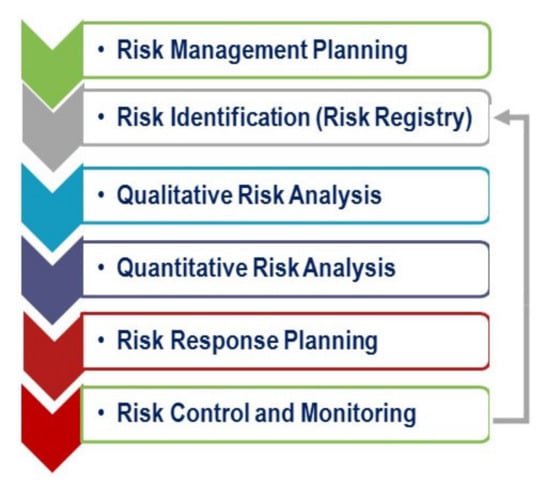
Figure 1.
Risk assessment and management workflow diagram depicting six primary tasks and how they relate.
The SWP’s risk assessment approach consists of six primary tasks: risk management planning, risk identification, qualitative risk analysis, quantitative risk analysis, risk response planning, and risk control and monitoring. Tools essential to risk communication are applied within several of these tasks.
2.1. Risk Management Planning
The risk management plan comprises roles and responsibilities of personnel, budget assignment, and timing and frequency of risk assessment tasks. In this task the RAWG defined the best methodologies, tools, and data sources for both technical and programmatic risks. This task also sets how RAWG coordinated with other working groups. For example, RAWG coordinated with the simulation group to ensure models were developed on identified risk pathways (e.g., wellbore leakage, shallow groundwater impacts, caprock integrity, induced seismicity, and performance goals). Coordination among working groups in regard to risk management planning is a key aspect of internal risk communication.
2.2. Risk Identification
Risk identification (also known as risk source assessment) is the process of determining project risks and their characteristics. The RAWG first developed an initial (draft) risk registry that included programmatic/operational risks as well as technical/sequestration risks by using a Features, Events, and Processes (FEPs)-based approach. A FEP is a broad entity: an individual FEP could create negative impact on the project values through various chains of events (scenarios) and could function in combination with various other FEPs. Based on the initial FEPs registry, the SWP performed its risk survey from 2014 to 2017 annually. The purpose of this risk survey was to identify and evaluate current risks to project objectives. Participants of the risk survey evaluated FEPs, each of which was associated with one or more example scenarios.
On 13 January 2014, a live web-based risk workshop was held to evaluate and rank the identified risks and to newly identify additional risks associated with the SWP Phase III project. Then, the evaluation of 24 additional FEPs collected from the online workshop was completed by a follow-up spreadsheet. Initially, a total of 405 FEPs were identified for the SWP Phase III project. Twenty-three (23) project professionals participated in the workshop and all the personally attributed data were collected and evaluated. Project professionals provided self-assessments of areas of expertise. After FEPs were screened for redundancy and relevance to the SWP, 103 FEPs were ranked by risk with the expertise-weighted evaluation method.
In August 2015, the second risk survey was conducted. The 2015 survey was executed entirely via email and telephone communication, with spreadsheets as the primary information tool, whereas the 2014 assessment included a “live” online workshop with discussion and real-time visibility of charted data. The risk elements evaluated in the 2015 risk assessment exercise were the 50 highest risks as determined in 2014, of the 103 total risks evaluated at that time. Respondents in 2015 (to a large degree, the same individuals who participated in 2014) were invited to add “new” risks or re-nominate other “old” risks for evaluation, but in practice no risks beyond the 2014 top-50 set were identified.
In September 2016, substantially the same group of project professionals again re-evaluated the project risks. The process focused on 69 risk entities comprising the 50 FEPs evaluated in 2015 plus additional FEPs nominated or agreed by risk-workshop participants. The additional FEPs grew out of information gathering that was used to identify the important new or potentially higher-risk elements.
On 14 December 2017, the fourth risk workshop was held as a one-day face-to-face session during the SWP annual meeting at New Mexico Tech, Socorro, New Mexico. The 23 workshop participants included nearly all persons actively involved in the project. The risk workshop followed a day of plenary meetings in which the staff shared information on project technical and managerial topics. This shared information formed a solid basis for exposing and exploring sources of risk to project objectives.
2.2.1. Risk Calculation
Risk was calculated as the product of Severity (S) and Likelihood (L), each of which factors was judged on a categorical 5-point scale (Table 1) by the risk workshop participants. S is defined as “severity of potential negative impact to defined project values,” and L is defined as “likelihood that the specified severity level will occur during the project lifespan.” In the 2014 and 2016 risk surveys, participants provided two values of S and one of L for each FEP. The S values are upper-bound Severity (Sub) and best-guess Severity (Sbg), and the L value is Likelihood of the best-guess Severity (L of Sbg, or simply L). The Sub or worst-case severity value is of specific interest. In addition, the process of its elicitation provides a measure of self-calibration for participants. For each risk element, the Sub value is elicited first, followed by the Sbg value. In this way, each participant’s best-guess severity value is appropriately related to the just-provided “worst case” aspect of the same risk element.

Table 1.
Severity and likelihood scales.
Whereas, in the 2015 and 2017 workshop, a single Sbg and the L of Sbg values were collected for each FEP, rather than separate values for Sub versus Sbg in contrast to 2014 and 2016 evaluations. This saved workshop time and recognized the fact that worst-case severity data collected during previous workshops was likely to be sufficiently representative. A “worst-case severity” ranking was computed from the 2017 workshop data based on the provided severity values plus one standard deviation.
Using the data gathered from all the participants including experts and non-experts, various risk values and rankings can be constructed by using different weightings of expert and non-expert views. As noted earlier, participants self-rated their areas of technical expertise. In 2014, the selected expertise-weighted ranking used gradational weighting based on gradations of expertise. In 2015, the selected ranking used “triple-weighted” values from experts and single-weighted values from non-experts, based on a binary (“yes/no”) designation of subject-matter expertise. Given that experts’ presumably greater accuracy in estimating risk cannot be confirmed until the project is well advanced, there are no clear criteria for “optimal” weighting. However, as for 2015 and similar to 2014, a “triple-weighted experts” risk calculation and ranking based on binary expertise have been constructed from the 2016 data.
2.2.2. Risk Rankings
Table 2 compares FEP rankings in 2017 (“all participants” ranking) to rankings in the prior years. Of the 69 FEPs evaluated in 2017, 57 were from the previous evaluations and 13 were newly added. Among the 69 FEPs evaluated in 2016, 46 were evaluated in 2015, and all but two (new in 2016) were evaluated in 2014. Table 2 shows risk rankings for those four successive evaluations. In 2015, only the highest-ranking 50 FEPs from 2014 were evaluated. Only a single ranking method from each year is shown for comparison.
Table 2.
Features, Events, and Processes (FEPs) rankings of four annual evaluations since 2014. Thirteen FEPs evaluated in 2016, but not in 2017, are listed at bottom. FEPs whose titles were worded slightly differently in prior years are indicated by an asterisk. FEPs not evaluated during a particular year are shown ranked as “N/A.” For most FEPs the related specific risks are evident to CCS practitioners; certain FEPs followed by a letter in parentheses are further explained below the table.
The dominance of red to yellow colors in the upper part of the list shows that many high-risk issues (especially programmatic issues) have remained high-risk throughout the project. In some cases, progressively cooler colors suggest technical learnings that reduced the perceived risk; examples include geomechanical characterization, H2S, and Health and Safety Inspections.
Rankings from 2017 show that programmatic issues remain top concerns: oil price (as in previous years) and DOE financial support (new FEP in 2017) were rated as the highest project risks. After the steep drop of oil price from the second half of 2014, price of oil has been placed at the first in the risk ranking. Other operational risks related to CO2-EOR were also relatively ranked high due to the concerns about oil price. Except for those newly included in 2017, most FEPs evaluated in multiple years have maintained roughly consistent rank positions.
Among the scientific issues, relatively high risk is ascribed to the parameters used for simulation and modeling and to reservoir heterogeneity. This may imply that for this project, given geologic heterogeneity, modeling indicates that the extensive available field data have not constrained model outputs to the degree anticipated. Some FEPs re-included in 2016 were evaluated as relatively high risk in 2016. The re-included FEPs had not been evaluated in 2015 based on their low risk in 2014, but were included for 2016 because of high 2014 severity values. Their emergence as high risk in 2016 (e.g., ranks #10, 12–15) is surprising and may suggest recent changes in project status (including funding and economics) or information that had not been articulated during the information-gathering process that preceded the workshop.
Based on the four risk workshops and analyses, we have learned that the results of FEPs-based risk evaluation can be applied toward risk management as follows:
- Using risk rankings and other statistics, select a set of FEPs for which action (treatment) will be undertaken. It is often useful to select roughly 15–35% of the evaluated FEPs.
- Parse the selected FEPs by FEP group and assign a risk-treatment coordinator for each group.
- For each FEP, clarify the specific scenarios (chains of events) by which impact would occur. Develop risk treatments to lower the likelihood of their occurrence and/or the severity of impact in case of occurrence. Assign and track treatment execution, and periodically evaluate the effectiveness in treating the target risks (residual risk level).
- Evaluate the effectiveness of treatments in also treating/controlling the non-target (lower) risks; confirm that all identified risks are adequately controlled.
- Re-evaluate risk whenever there is a substantial change to project information or objectives.
2.3. Qualitative Risk Analysis
The RAWG applied both qualitative and quantitative analysis processes. The qualitative risk analysis is mainly for prioritizing the identified risks according to their potential effects on the project objectives and for identifying interactions between FEPs, which includes:
- Continue (update) relative ranking or prioritization of project risks,
- Risk categorization by root cause and potential impacts,
- Define interactions between FEPs,
- Identify risks that require responses in the near-term,
- Identify risks that require more analysis or investigation, and
- Develop watchlists for lower risks for monitoring.
The significant risk matrix components necessary for the risk assessment were first identified to define the FEPs interaction. For example, for the risks to oil recovery, reservoir temperature, reservoir pressure, oil composition, and oil viscosity were defined as four independent (or uncertain) parameters and associated dependent variables (or risk factors) include oil production, water cut, and methane production. Similarly, we identified independent and dependents variables for three additional categories such as CO2 storage, geomechanics, and CO2 leakage which are risk areas in the quantitative risk assessment. Table 3 summarizes the uncertain parameters and dependent variables identified in the four different risk areas; CO2 storage, oil recovery, geomechanics, and CO2 leakage.
Table 3.
Risk matrix components including independent and dependent variables.
Based on the FEPs identification, relevant classification and ranking, and risk matrix development, the SWP utilized process influence diagrams (PIDs). PIDs graphically depict the interactions between FEPs and help in building risk scenarios, which form an instrument for effective risk communication. The initial site-specific PID for the SWP project was based on the PIDs developed for a typical CCUS-EOR project through a previous DOE-funded project (DE-FE0001112). Appropriate scenarios identified throughout the PIDs can subsequently be used for the quantitative risk analysis.
Figure 2 shows the PIDs for CO2 storage and CO2-EOR risks/FEPs. Similarly, the PID associated with the geomechanics and CO2 leakage is illustrated in Figure 3. The risks (dependent variables) that can be quantified in terms of probability density function (PDF) or cumulative distribution function (CDF) are highlighted in the PIDs. In the PIDs, an arrow represents the influence path showing cause and effect. The circle indicates the interaction between FEPs. No loop or chain start with Events in the PIDs. In other words, there should be an appropriate cause for an effect. PID only considers direct impact.
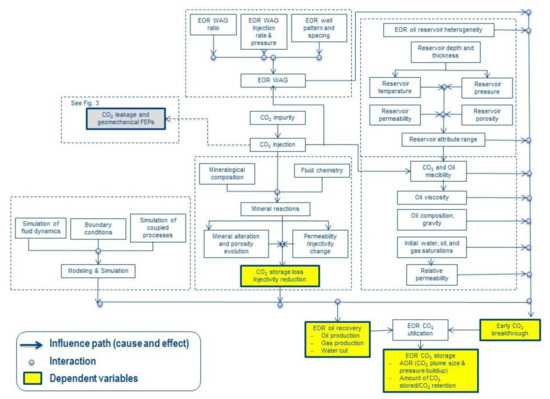
Figure 2.
Process influence diagram (PID) for CO2 storage and CO2-EOR risks/FEP in Southwest Regional Partnership (SWP) project. An arrow shows the influence path and each connection point is represented by a filled circle.
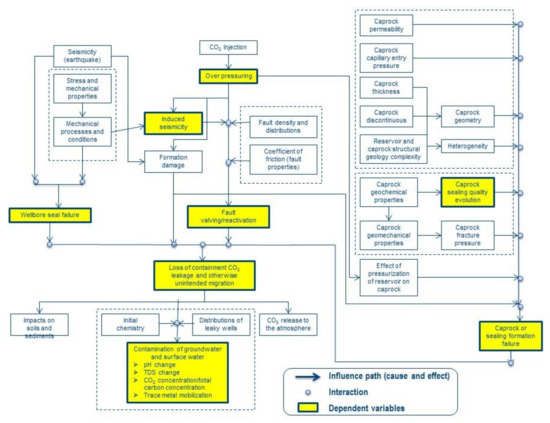
Figure 3.
Process influence diagram for geomechanical and CO2 leakage risks/FEP in SWP Farnsworth project. An arrow shows the influence path and each connection point is represented by a filled circle.
For example, if we inject CO2, combined with mineralogical composition and fluid chemistry, it would affect the mineral reactions which might lead to mineral alteration and subsequently porosity/permeability change. Therefore, as a result there could be a storage loss or injectivity reduction. This risk scenario identified with PID was used in the quantitative risk analysis.
2.4. Quantitative Risk Analysis
Quantitative risk analysis for the FWU project has been conducted to numerically quantify the effect of risk scenarios on the project objectives. In general, integral aspects of risk assessment involve:
- Formalism and comprehensiveness of identified risks, which add confidence to the risk assessment;
- Development of common framework and approaches, which allow inter-comparison of probabilities for different elements or sites;
- Explicit treatment of uncertainties, which arise from factors such as incomplete parameters and process constraints, heterogeneities in natural systems, incomplete knowledge of the natural systems at the site, etc.
The SWP Farnsworth project employed formal quantitative methods of risk analysis specified in the following sub-tasks (based on evaluation of uncertainty):
- Quantify critical elements or variables that may affect the risk in question;
- Define the scenarios or conceptual model for each risk;
- Conduct probabilistic risk assessment with an appropriate tool for each potential risk;
- Synthesize the overall risk assessment using National Risk Assessment Partnership (NRAP) tools (formerly CO2-PENS and other newly developed tools), to evaluate CO2 and brine fate and associated impact.
Response Surface Method (RSM), Polynomial Chaos Expansion (PCE), and NRAP toolset are the main computational tools used for quantitative risk assessment in the Farnsworth project.
2.4.1. Response Surface Method
RSM (also known as proxy model) was used for developing PDFs or CDFs for each critical risk factor of interest. The RSM with appropriate experimental design has been applied to reservoir engineering applications such as performance prediction, sensitivity analyses, upscaling, history matching, and optimization studies [11,12,13]. Comprehensive simulations with a conventional Monte Carlo approach may be computationally expensive given the uncertainties in model parameters, whereas RSM with a statistically linear model uses only a small number of runs at specified sampling points. We applied RSM combined with Monte Carlo sampling to efficiently provide probabilistic assessment.
Figure 4 summarizes the RSM workflow, which first determines independent variables/factors to construct the design of experiment (DoE), followed by the numerical experiments. Then, the response surface (regression equation or proxy model) is delineated with a stepwise regression technique applied to eliminate insignificant factors from the regression equation. Then, several goodness-of-fit measurements examine the performance of the regression model. Lastly, Monte Carlo samplings of mutually independent input parameters were used in the obtained response surface models in order to generate the CDFs of output responses from the given input distributions without running numerical simulations
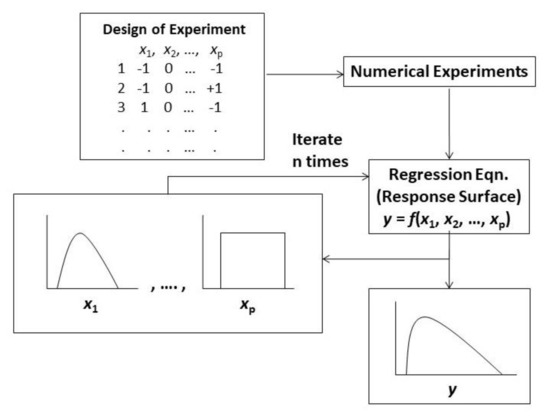
Figure 4.
Workflow for the response surface methodology combined with Monte Carlo simulation. For example, reservoir permeability, anisotropy ratio of permeability (kv/kh), water-alternating-gas (WAG) time ratio are x1, x2, x3, and x4. In addition, net CO2 storage and oil production are y1 and y2 in Pan et al. [14].
The RSM consists of mathematical and statistical techniques to develop a functional relationship between a response or dependent variable (y) of interest and associated independent variables or factors (x1, x2, …, xk). The response surface method is typically a polynomial approximation to the responses (y) obtained with a linear regression given the input/design variables (xi) in a chosen DoE. For example, the Box-Behnken design (BBD), which is a particular subset of the factorial combinations from the 3k factorial designs, consists of three levels (−1, 0, 1) corresponding to (lower, middle, upper endpoint) for each factor [15]. Each factor is placed at one of the three equally spaced values. The BBD has been widely used because of its economical design (smaller number of runs) compared to the full factorial designs. Full factorial design with 2-level (−1, 1) or 3-level (−1, 0, 1) is fully crossed design requiring 2k and 3k runs, respectively. In addition, the BBD contains not only the interaction terms of factors but also the higher-order quadratic effects. We utilized the stepwise regression technique to eliminate the insignificant factors from the regression equation. The RSM was efficiently implemented within a Monte Carlo framework to assess uncertainty.
Pan et al. [14] applied RSM with Monte Carlo sampling to quantify the uncertainties in the key reservoir parameters of Farnsworth project. Forecasted net CO2 storage and oil production were predicted by the CDFs given the uncertainty in key reservoir parameters such as reservoir permeability, anisotropy ratio of permeability (kv/kh), water-alternating-gas (WAG) time ratio, and initial oil saturation. Similarly, with three independent parameters (CO2 saturation, reservoir pressure, wellbore fracture proportion), Xiao et al. [16] quantified potential risks of CO2 and brine leakage into the overlying USDW (the Ogallala aquifer) with RSM and identified water chemistry parameters as early detection indicators based on up-to-date site monitoring data.
Dai et al. [17] developed a multiscale statistical framework for CO2 accounting and risk analysis at the FWU. A set of geostatistical-based Monte Carlo simulations were conducted for risk and global sensitivity assessment of CO2-hydrocarbon-water flow in the Morrow B formation. The major risk metrics include CO2/water injection/production rates, cumulative net CO2 storage, cumulative oil/gas productions, and CO2 breakthrough time. A response-surface-based economic framework was also derived to calculate the CO2-EOR profitability for the FWU with an oil price of $38/bbl, suggesting that approximately 31% of the 1000 realizations can be profitable.
Our RSM-based work [14,16,17] demonstrated useful tools which can be used to numerically and probabilistically quantify the effect of risk scenarios on the project objectives. In terms of computational time, the RSM was efficient compared to the conventional Monte Carlo simulation. However, simulation processes inherently contain uncertainty. Thus, it would be critical to correctly define the ranges and distribution of uncertain parameters to significantly reduce the uncertainty. In addition, the RSM applied for quantifying risks are tested and verified with numerical outputs rather than actual data, thus they unavoidably contain epistemic uncertainty.
2.4.2. Polynomial Chaos Expansion
In addition to the RSM described in the previous section, non-intrusive polynomial chaos expansion (PCE) was also used in the Farnsworth project, as it only requires a small number of sampling and does not modify the governing equations. RSM uses a polynomial regression to model the response, where input parameters, . Whereas, if the input parameters vector x is uncertain [18], an element in the vector y can be represented by a PCE as follows:
where the are coefficients and the B’s are multivariate polynomial basis functions. Hermite polynomials basis functions are generally used for normally distributed parameters [19]. Once is simulated from geo-cellular models, the coefficients can be solved with linear inversion, e.g., . Then reduced order models (ROMs) can be developed by substituting the calculated coefficients into Equation (1). With the flexibility regarding the basis functions and not requiring the DoE, PCE is capable of constructing ROMs for a variety of properties of interest, such as the pressure and CO2 saturation in each cell of the reservoir model. For the reviews and details of PCE techniques, see the previous studies such as [20,21,22].
Jia et al. [23] evaluated primary CO2 trapping mechanisms of Morrow B sandstones at the FWU. In particular, the heterogeneity of petrophysical properties (porosity and permeability) was considered as the source of parameter uncertainty. Their impacts were analyzed using PCE-derived ROMs combined with Monte Carlo simulations. Model outputs of interest in CDFs include amounts of CO2 trapped by three different trapping mechanisms: hydrodynamic trapping, oil dissolution trapping, and aqueous dissolution trapping. The wide ranges of CDFs (as shown in Figure 5 in Jia et al. [23]) demonstrate significant variations in CO2 storage at FWU due to the uncertain reservoir porosity and permeability. However, the results of the uncertainty analysis suggest that the hydrodynamic trapping is the dominant trapping mechanism at FWU.
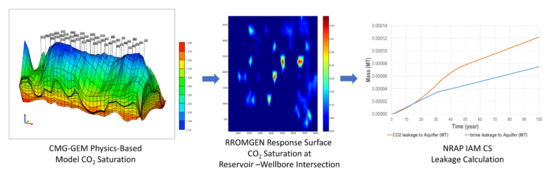
Figure 5.
Workflow from physics-based simulators to leakage calculations using National Risk Assessment Partnership (NRAP) tools.
2.4.3. National Risk Assessment Partnership Toolset
As part of the quantitative risk assessment for the SWP, the NRAP toolset is being applied to evaluate CO2 and brine leakage risks at the FWU. The NRAP toolset is a computational toolkit that includes ten science-based computational tools that predict environmental risk performance of geologic CO2 storage sites [24,25]. In order to conduct a quantitative risk assessment of wellbore leakage at the FWU multiple realizations must be run to span to parameter space of key parameters such as wellbore permeability and the time evolution of CO2 and water saturation in the reservoir. The physics-based simulators of the reservoir and detailed simulations of the wellbore are computationally intensive and cannot be practically coupled and run 1000s of times to bound the uncertainty in the system. The NRAP toolset is being used to establish a comprehensive workflow between physics-based simulators of the reservoir and physics-based simulators of the wellbore using the concept of ROMs [26].
NRAP tool RROM-Gen is used for generating response surfaces for the time evolution of CO2 and water saturation at the depth where wellbores intersect the reservoir. The response surfaces are generated from output data of a reservoir simulator that simulate CO2 injection into the reservoir. Response surfaces of CO2 saturation and pressure are generated as a function of time using RROM-Gen [27]. These response surfaces were then used to estimate the leakage risk from wellbores using NRAP-IAM-CS (formerly CO2-PENS, [28]) from the NRAP tool kit. The workflow is shown in Figure 5 for a generic CO2 sequestration site.
Chu et al. [29] summarized the leakage risk assessment work for FWU. NRAP tools were used for risk assessment and uncertainty quantification of wellbore leakage that covers the full parameter range of ECLIPSE reservoir simulations at FWU representing various reservoir conditions with different assignments for relative permeability and capillary pressure to control the CO2 injection amount and fluid mobility for leakage potential. Various wellbore integrity distribution scenarios were also examined including several different wellbore permeability probability distribution models such as Alberta, Gulf of Mexico, and FutureGen low/high flow rate scenarios. The results show that the highest possible leakage scenario (open well) could result in ~0.1% cumulative CO2 leakage after 25-year CO2 injection and 50-year post-injection.
2.5. Risk Response Planning
To avoid delays, underperformance, or failure of a project, risk factors need to be identified and promptly addressed. Therefore, the development of a risk response plan is crucial for the success of a project. Risk responses, or treatments, focus on reducing the occurrence probability (prevention) and/or the consequences (mitigation) of a risk to the project objectives and values. Risk transfer is a type of mitigation in which occurrence probability is unchanged, but negative consequences would be borne by a third party (such as an insurer), by contract.
Risk identification and analysis tasks discussed in the previous sections provided the basis for developing a comprehensive risk response (risk treatment) program which consequently led to the update in project management plan. We updated risk prevention and mitigation treatments according to the top 40 FEPs identified from the annual risk survey. For example, Table 4 shows the 2017 top 10 risks for the Farnsworth site and corresponding risk prevention and mitigation treatments. Treatments are developed by and shared among all project staff, forming another key element of internal risk communication.
Table 4.
Prevention and mitigation treatments for the top 10 FEPs of 2017 risk survey.
Risk treatments were developed by project staff with areas of technical expertise relevant to the treatment activities. Accordingly, these individuals are also likely to be tasked to carry out the treatments. Because many of the highest-ranked risks are programmatic in nature, many treatments were developed by management staff and working-group leaders. To help further inform the management on resource allocation for treatment activities, working group leaders were then requested to describe each treatment in terms of its degree of completion, its expected effectiveness in reducing risk, and its cost. Each of these attributes was rated on a categorical one-through-five scale. As of this writing, the treatment attributes work is not yet complete; however, generally it shows that most treatments suggested midway through the project have been largely completed, and most are deemed moderately to fully effective in reducing risks.
The SWP also participated in the RCSP Interpartnership Simulation and Risk Assessment Working Group to focus collaborative efforts on mitigation planning, as well as integration of monitoring with risk assessment, with an ultimate objective of updating the RCSP BPM for Simulation and Risk Assessment [30]. The SWP participation in this working group serves to support the external risk communication efforts.
2.6. Risk Control and Monitoring
Risk control and monitoring are needed in order to ensure the appropriate operation of the risk response plan previously developed in the Risk Response Planning task and to evaluate their effectiveness during the project execution. We iteratively continued risk identification, analysis, planning, and tracking of new and existing risks, including the watch list. In addition to characterization and MVA results, outcomes from Quantitative Risk Analysis Task, and Risk Response Planning Task, provided a basis for monitoring and controlling risks.
There is a strong need for risk communication which includes formalizing the links between the various qualitative and quantitative risk assessments performed at FWU and then conveying those risks to internal project staff, professionals working in other CCUS projects, and external stakeholders. High-risk elements identified during risk workshops need to be subjected to scenario modeling to define the pathways by which risk targets would be impacted, thereby specifying the quantities that could be usefully constrained through modeling. Evaluation of risk status before and after modeling work and its communication with other efforts (characterization, monitoring, and simulation) is important.
Internal risk communications for the FWU project were organized largely around technical working groups among which all staff members were assigned. In simplest form, each working group’s weekly meeting provided opportunity to communicate risk status arising within the technical areas covered by other working groups. The SWP internal project report by Hnottavange-Telleen [31] identified a set of internal stakeholders among whom regular risk communications should be pursued; internal stakeholders consist of the existing working groups, plus a hypothetical “Operations” group that would involve a field operator, plus project management.
Communications (including about risk) with and among the external stakeholders were relatively well established at the start of the SWP Phase III demonstration project, given that FWU was a long established producing oilfield. Consequently an elaborate new scheme for external risk communication was not needed. Hnottavange-Telleen [31] tabulates external stakeholders with whom—in a greenfield or otherwise new CCUS project—risk communications would be needed. Table 5 lists these external stakeholders.
Table 5.
List of external stakeholders.
Internal and external stakeholders both need certain risk information, and possess or can generate key risk information needed by other stakeholders. These different types of information needed or offered are tabulated in the above referenced report, for a generic commercial-scale CCUS project. An effective network of risk communication is needed among all stakeholders, in order that each can best judge its own risks and knowledgeably fulfill its role in the project.
3. Findings and Lessons Learned
The risk identification task indicates that programmatic risks (oil price, legislation, CO2 supply, operator) and issues specific to EOR were high in the rankings. Among GCS technical risks, concerns about simulation efforts remain high. With regard to geological aspects of site suitability, concerns about reservoir rock have remained moderate, which makes sense considering the pre-project knowledge of the Farnsworth Unit oilfield. Concern about caprock petrology and mineralogy (heterogeneity) has decreased in response to project-generated information, but concern about caprock stratigraphy (lateral extent and continuity) has increased. This observation is noteworthy as a demonstration that increased information (ostensibly decreasing uncertainty) does not necessarily lead to a decrease in judged risk; rather, increased information can reveal that hidden assumptions had been in play, leading to under-estimated risk.
Several FEPs ranked #10, 12–15 in 2016 and #2, 4, 10, 13 in 2017 were not evaluated in prior years because they ranked below #50 in 2014. However, they were re-instituted in 2016 or 2017 because of their “Black Swan” nature; their high upper-bound severity values. The high ranking of certain of these FEPs may reflect actual change in risk or probably changed the appreciation of risk. In designing risk responses, it may be useful to distinguish between those two potential sources of change.
Our quantitative risk analysis demonstrated useful tools to numerically and probabilistically quantify the effect of risk scenarios on the project objectives. However, simulation processes (especially geological ones) inherently contain aleatory uncertainty. Thus, it would be most helpful to correctly define the ranges and distribution of uncertain parameters to significantly reduce the uncertainty. In addition, reduced order models and tools applied for quantifying risks are tested and verified with the numerical outputs rather than real world data, thus they unavoidably contain epistemic uncertainty. Without a lot of real-world data, it is difficult to test whether a proxy model or ROM adequately represents the physics of a process. Thus, the validation of a model would require history matching, which cannot happen within a short time period.
To support risk management efforts effectively, risks should be re-assessed approximately annually, or more frequently when major changes occur in project circumstances or information. Common examples of possible substantial changes include passage into a new project phase, acquisition of new data that significantly alters the understandings of site attributes or potential project-induced effects, or changes in the external funding or regulatory environment that could affect the ability to reach project objectives.
For a path forward with the risked FEPs, the following five steps are recommended:
- Identify a discrete set of high-ranking FEPs to be managed.
- As necessary, further develop or clarify the scenarios under which each higher-risk FEP will plausibly create negative impacts within this specific project.
- Among the higher-risk scenarios, distinguish those with especially high severity from those with especially high likelihood.
- Develop at least one actionable prevention and one actionable mitigation treatment for each scenario. To the extent practical, prefer reducing high likelihoods (i.e., develop preventive actions); and next prefer low-cost efforts to reduce high severities (e.g., ensure that personal protective equipment is worn).
- Assign responsibility for completing risk treatments and for tracking their effects on inferred risk levels.
In addition to the above findings on risk evaluation processes and results, some observations on risk communication can be drawn from the work at FWU:
- Much internal communication about factors that influence risk has occurred informally and semi-formally, among the researchers and managers involved in the project. Capturing this information in a structured way requires additional effort from the researchers themselves as well as from at least one individual whose role is so tasked and resourced. Some level of additional resourcing to support formal internal risk communication is probably justified, but the optimal level is difficult to assess.
- External communications about FWU work (on risk and other topics) have focused on extensive technical publications and presentations within the specialized CCS/CCUS community. Because the project has taken place within an operating oilfield whose activity, geographic footprint, and risk have not materially changed, the previously established relationships with neighboring landowners have been largely sufficient for external risk communications.
Author Contributions
Conceptualization, S.-Y.L. and K.H.-T.; methodology, S.-Y.L. and K.H.-T.; investigation, F.P., W.J., S.C., T.X. and Z.D.; writing—original draft preparation, S.-Y.L. and K.H.-T.; writing—review and editing, S.-Y.L., T.X. and K.H.-T.; supervision, B.M. and H.V.; project administration, R.B. All authors have read and agreed to the published version of the manuscript.
Funding
This research was funded by the U.S. Department of Energy’s (DOE) National Energy Technology Laboratory (NETL) through the Southwest Regional Partnership on Carbon Sequestration (SWP) under Award No. DE-FC26-05NT42591.
Institutional Review Board Statement
Not applicable.
Informed Consent Statement
Not applicable.
Data Availability Statement
Not applicable.
Conflicts of Interest
The authors declare no conflict of interest.
References
- International Energy Agency. 20 Years of Carbon Capture and Storage; International Energy Agency: Paris, France, 2016. [Google Scholar]
- Metz, B.; Davidson, O.; De Coninck, H.; Loos, M.; Meyer, L. IPCC Special Report on Carbon Dioxide Capture and Storage; Campridge University Press: New York, NY, USA, 2005. [Google Scholar]
- Vitillo, J.G.; Smit, B.; Gagliardi, L. Introduction: Carbon capture and separation. Chem. Rev. 2017, 117, 9521–9523. [Google Scholar] [CrossRef]
- Ampomah, W.; Balch, R.S.; Grigg, R.B.; McPherson, B.; Will, R.A.; Lee, S.Y.; Dai, Z.; Pan, F. Co-optimization of CO2-EOR and storage processes in mature oil reservoirs. Greenh. Gases Sci. Technol. 2017, 7, 128–142. [Google Scholar] [CrossRef]
- Dai, Z.; Middleton, R.; Viswanathan, H.; Fessenden-Rahn, J.; Bauman, J.; Pawar, R.; Lee, S.-Y.; McPherson, B. An integrated framework for optimizing CO2 sequestration and enhanced oil recovery. Environ. Sci. Technol. Lett. 2014, 1, 49–54. [Google Scholar] [CrossRef]
- Godec, M.L.; Kuuskraa, V.A.; Dipietro, P. Opportunities for using anthropogenic CO2 for enhanced oil recovery and CO2 storage. Energy Fuels 2013, 27, 4183–4189. [Google Scholar] [CrossRef]
- Gozalpour, F.; Ren, S.R.; Tohidi, B. CO2 EOR and storage in oil reservoir. Oil Gas Sci. Technol. 2005, 60, 537–546. [Google Scholar] [CrossRef]
- Mac Dowell, N.; Fennell, P.S.; Shah, N.; Maitland, G.C. The role of CO2 capture and utilization in mitigating climate change. Nat. Clim. Change 2017, 7, 243–249. [Google Scholar] [CrossRef]
- Balch, R.; McPherson, B. Integrating Enhanced Oil Recovery and Carbon Capture and Storage Projects: A Case Study at Farnsworth Field, TEXAS. In Proceedings of the SPE Western Regional Meeting, Anchorage, AK, USA, 23–26 May 2016; Society of Petroleum Engineers: Houston, TX, USA, 2016. [Google Scholar]
- Rodosta, T.; Bromhal, G.; Damiani, D. US DOE/NETL Carbon Storage Program: Advancing Science and Technology to Support Commercial Deployment. Energy Procedia 2017, 114, 5933–5947. [Google Scholar] [CrossRef]
- Bu, T.; Damsleth, E. Errors and uncertainties in reservoir performance predictions. SPE Form. Eval. 1996, 11, 194–200. [Google Scholar] [CrossRef]
- Chu, C. Prediction of steamflood performance in heavy oil reservoirs using correlations developed by factorial design method. In Proceedings of the SPE California Regional Meeting, Ventura, CA, USA, 4–6 April 1990; Society of Petroleum Engineers: Houston, TX, USA, 1990. [Google Scholar]
- Willis, B.J.; White, C.D. Quantitative outcrop data for flow simulation. J. Sediment. Res. 2000, 70, 788–802. [Google Scholar] [CrossRef]
- Pan, F.; McPherson, B.J.; Dai, Z.; Jia, W.; Lee, S.-Y.; Ampomah, W.; Viswanathan, H.; Esser, R. Uncertainty analysis of carbon sequestration in an active CO2-EOR field. Int. J. Greenh. Gas Control 2016, 51, 18–28. [Google Scholar] [CrossRef]
- Montgomery, D.C. Design and Analysis of Experiments; John Wiley & Sons. Inc.: New York, NY, USA, 2001; Volume 1997, pp. 200–201. [Google Scholar]
- Xiao, T.; McPherson, B.; Pan, F.; Esser, R.; Jia, W.; Bordelon, A.; Bacon, D. Potential chemical impacts of CO2 leakage on underground source of drinking water assessed by quantitative risk analysis. Int. J. Greenh. Gas Control 2016, 50, 305–316. [Google Scholar] [CrossRef]
- Dai, Z.; Viswanathan, H.; Middleton, R.; Pan, F.; Ampomah, W.; Yang, C.; Jia, W.; Xiao, T.; Lee, S.-Y.; McPherson, B. CO2 accounting and risk analysis for CO2 sequestration at enhanced oil recovery sites. Environ. Sci. Technol. 2016, 50, 7546–7554. [Google Scholar] [CrossRef]
- Wiener, N. The homogeneous chaos. Am. J. Math. 1938, 60, 897–936. [Google Scholar] [CrossRef]
- Xiu, D.; Karniadakis, G.E. Modeling uncertainty in flow simulations via generalized polynomial chaos. J. Comput. Phys. 2003, 187, 137–167. [Google Scholar] [CrossRef]
- Jia, W.; McPherson, B.J.; Pan, F.; Xiao, T.; Bromhal, G. Probabilistic analysis of CO2 storage mechanisms in a CO2-EOR field using polynomial chaos expansion. Int. J. Greenh. Gas Control 2016, 51, 218–229. [Google Scholar] [CrossRef]
- Oladyshkin, S.; Class, H.; Nowak, W. Bayesian updating via bootstrap filtering combined with data-driven polynomial chaos expansions: Methodology and application to history matching for carbon dioxide storage in geological formations. Comput. Geosci. 2013, 17, 671–687. [Google Scholar] [CrossRef]
- Zhang, Y.; Sahinidis, N.V. Uncertainty quantification in CO2 sequestration using surrogate models from polynomial chaos expansion. Ind. Eng. Chem. Res. 2012, 52, 3121–3132. [Google Scholar] [CrossRef]
- Jia, W.; Pan, F.; Dai, Z.; Xiao, T.; McPherson, B. Probabilistic risk assessment of CO2 trapping mechanisms in a sandstone CO2-EOR field in northern texas, USA. Energy Procedia 2017, 114, 4321–4329. [Google Scholar] [CrossRef]
- Dilmore, R. NRAP Phase I Tool Development and Quality Assurance Process; National Energy Technology Laboratory (NETL): Pittsburgh, PA, USA; Morgantown, WV, USA, 2016. [Google Scholar]
- Pawar, R.J.; Bromhal, G.S.; Chu, S.; Dilmore, R.M.; Oldenburg, C.M.; Stauffer, P.H.; Zhang, Y.; Guthrie, G.D. The National Risk Assessment Partnership’s integrated assessment model for carbon storage: A tool to support decision making amidst uncertainty. Int. J. Greenh. Gas Control 2016, 52, 175–189. [Google Scholar] [CrossRef]
- Viswanathan, H.S.; Pawar, R.J.; Stauffer, P.H.; Kaszuba, J.P.; Carey, J.W.; Olsen, S.C.; Keating, G.N.; Kavetski, D.; Guthrie, G.D. Development of a hybrid process and system model for the assessment of wellbore leakage at a geologic CO2 sequestration site. Environ. Sci. Technol. 2008, 42, 7280–7286. [Google Scholar] [CrossRef]
- King, S. Reservoir Reduced-Order Model–Generator (RROM-Gen) Tool User’s Manual Version 2016.11-1.2; National Energy Technology Laboratory-Energy Data eXchange NETL: Morgantown, WV, USA, 2016. [Google Scholar] [CrossRef]
- Stauffer, P.H.; Viswanathan, H.S.; Pawar, R.J.; Guthrie, G.D. A system model for geologic sequestration of carbon dioxide. Environ. Sci. Technol. 2009, 43, 565–570. [Google Scholar] [CrossRef] [PubMed]
- Chu, S.; Viswanathan, H.; Moodie, N.; Jia, W. SWP Milestone Report for MS8: Extended Quantitative Brine and CO2 Leakage Calculations; LA-UR-20-24728; LANL: Los Alamos, NM, USA, 2020. [Google Scholar]
- NETL. Best Practices: Risk Management and Simulation for Geologic Storage Projects, DOE/NETL-2017/1846; NETL: Pittsburgh, PA, USA, 2017; p. 114. [Google Scholar]
- Hnottavange-Telleen, K. Risk Communications among Project Stakeholders; Southwest Regional Partnership (Internal Report); NETL: Pittsburgh, PA, USA, 2019; p. 20. [Google Scholar]
Publisher’s Note: MDPI stays neutral with regard to jurisdictional claims in published maps and institutional affiliations. |
© 2021 by the authors. Licensee MDPI, Basel, Switzerland. This article is an open access article distributed under the terms and conditions of the Creative Commons Attribution (CC BY) license (https://creativecommons.org/licenses/by/4.0/).