Abstract
The amount of heat lost through the envelope of a building is one of the most important variables that affects the energy performance evaluation of a house. In addition, it is especially important to estimate and accurately diagnose the amount of heat produced by windows. In Korea, windows’ U-values reflect a building’s initial design values and thermal characteristics that determine the thermal performance of an existing building, and is a factor that can overestimate the energy performance of a building. Therefore, there is a need for a field measurement method that can accurately measure the total U-value of windows in an existing house. This study provides a method of quantitatively measuring the total U-value of windows using the infrared (IR) method in ISO 9869-2. As a result of measuring the U-value using the infrared (IR) method, the Korean Standard (KS F 2278) for window performance test result values and the root mean square error (cvRMSE) for the U-value measurements using the IR method showed a high accuracy of about 3.29%. In addition, we confirmed that the IR method is an effective (cvRMSE about 7% improvement) method that can measure the comparison result faster than the heat flow meter (HFM) method, which is a conventional thermal performance measurement method.
1. Introduction
1.1. Background and Purpose
The Korean government has proposed a target for reducing greenhouse gas emissions of 37% and has issued amendments to the energy-saving design standards related to reducing greenhouse gases and strengthening the insulation of building envelopes. Among them, national efforts have been made in the building sector, such as strengthening insulation standards and expanding certification systems to save energy [1]. However, many of these efforts are limited to new buildings and are difficult to apply to existing buildings. Energy savings are necessary because existing buildings have greater potential for energy savings than that of new buildings. In particular, energy savings are necessary in residential buildings that use more than 60% of the energy of the domestic building sector. It is very important to measure the living environment insulation performance of existing houses, and therefore to confirm energy performance it is necessary to measure existing houses’ envelope U-values. The value lost through the building envelope when calculating the energy demand of a building envelope is one of the most important parameters. However, for domestic buildings, energy-saving design standards are currently being used to regulate the rate of heat transfer in buildings. This is different from the value actually measured at the site, and errors occur due to aging and heat exchange during construction. These results are factors that can overestimate the energy performance of a building. It is important to accurately measure the U-value of an existing housing envelope in site. The U-value measurement method of the window, which is a particularly heat-sensitive area, should provide measures to improve thermal performance. However, currently, there are not any standards or methods for measuring the U-value of a window including the glass and frame. Therefore, in order to calculate the actual heat transfer rate of a window, it is necessary to evaluate the U-value through in situ measurements. Typical methods for measuring the current building envelope U-value include a heat flow meter (HFM) method described in ISO 9869-1 [2,3,4,5] and an infrared (IR) method described in ISO 9869-2 [6,7]. The HFM method can derive an accurate thermal transmissivity value in steady-state conditions. Therefore, this method is the most commonly used method when measuring building envelopes in the field; however, to obtain effective data, the HFM method requires measurements for approximately 72 to 168 h (7 days) under steady-state (i.e., normal) conditions. In addition, the contact surface is limited because the measuring device is directly connected. The infrared (IR) method is a technique for analyzing the temperature of the surface of a measurement target using a thermal image camera. This method is a non-contact, non-destructive evaluation method. The IR method allows you to calculate heat transmittance by measuring the emission of the object being measured, reflection temperature, surface temperature of the object, and temperature of the internal and external environments. The IR method can evaluate multiple objects in a short period of time and generates quantitative results on the thermal performance of difficult-to-measure areas. Therefore, in this study, we propose the ISO 9869-2 IR method, which can solve the drawbacks of the ISO 9869-1 HFM method which is an existing method for measuring envelope thermal performance.
The purpose of this study is to measure the U-value of a window using the IR method and compare the obtained results with an existing U-value measurement method.
1.2. Literature Review
In this study, we reviewed previous studies that had analyzed the U-values of windows with traditional envelope insulation performance measurement methods. The HFM method is the most well-known method for analyzing the thermal performance of buildings using a heat flux sensor. The IR method is an effective technique for identifying heat defects and heat exchange by easily observing the internal surface temperature of an element or the entire area of a building. For the purpose of this study, the following precedent studies were analyzed.
Anna Laura et al. (2013) [8] analyzed the thermal performance of a wall using the HFM method and proposed a residential building energy remodeling method according to the analysis results.
Giorgio Ficco et al. (2015) [9] measured and evaluated the quantitative performance of walls using the HFM method in laboratory conditions. In addition, the U-value of the wall was compared with the design data and values estimated in the analysis.
Kim et al. (2018) [10] analyzed the wall thermal performance using an HFM method which was a high-precision diagnostic method for wall thermal performance, and air-surface temperature ratio (ASTR) which was a simple diagnostic method. The wall thermal performance of the existing apartment building was analyzed using the HFM method and ASTR method.
Gaspar et al. (2018) [11] improved the field measurement accuracy of the envelope U-value using the HFM method U-value was analyzed for three things: measurement time, temperature difference, and accuracy of the instrument. The analysis confirmed that U-value measurements require a temperature difference of at least 19 °C and a longer test period. The abovementioned studies analyzed thermal performance through field measurements of building envelope using the HFM method and confirmed that this method affects the measurement time and temperature difference.
Rossano et.al (2010) [12] used the IR method to estimate the actual U-value under specific measurement conditions through field measurements and proposed a new method to quantitatively analyze the actual heat transmission of building envelopes using infrared thermal imaging.
Francesco et al. (2012) [13] applied a quantitative infrared temperature measurement technique for the evaluation of heat loss through multiple heat bridges and showed that this method defined the actual heat loss of isolated buildings and verified that it was a fast and effective method for evaluating the benefits of heat bridge treatment.
Giuliano Dall’O et al. (2013) [14] used the IR method to measure the wall U-values of 14 existing buildings in Italy and analyzed the reliability and accuracy of the method. In addition, the diagnostic method was verified by analyzing the absolute deviation error rate according to the airflow velocity.
Maroy et al. (2017) [15] confirmed the thermal performance of an insulated glass unit (IGU) using the IR method and a boundary condition sensitivity analysis was performed using numerical simulations. The quantitative IR measurements of various glass types were performed in the laboratory and in situ.
Kim et al. (2019) [16] presented a method of evaluating the thermal performance according to the ratio of the temperature difference inside and outside a building using the IR method. The thermal conductivity was measured by a thermal spacer measurement method using the Korean Standard (KS F 2829) and a heat transfer coefficient calculation method using IR and the measured result was calculated by applying it to the actual target building exterior wall.
Xinfui et al. (2019) [17] proposed an external IRT method for in situ measurements on the outer walls of low-rise buildings using IR standards. In this study, it was confirmed that the temperature of the outer surface of a building drops below an ambient temperature at night. The convective heat transfer coefficient was measured in situ, and a backflow correlation was proposed for the locally measured wind speed.
Previous studies on improving a method for measuring the U-value of existing buildings have been conducted based on the results obtained using the HFM method, IR method, ASTR method, etc. However, research on building U-values is confined to walls and very little research on windows. To measure the U-value of windows including both glass and frame, you need to use an IR method that allows you to measure the thermal performance per building member. Therefore, in this study, we conducted an investigation to effectively measure the U-value including both the window glass and the frame using the IR method.
2. Overall Study Process and Methodology
The purpose of this study was to analyze the accuracy and measurement error rate of window U-values using a proposed IR method. Figure 1 shows the overall flow process for this study. In Step 1, the total U-value of the window was measured using the KS F 2278, which is a Korean window performance evaluation standard [18]. The value of the measurement result was determined as the standard U value for the U value for comparative analysis. In Step 2, the HFM method was used to measure the U-value of the window. A heat flux sensor and a T-type thermocouple were attached to measure the temperature and heat transfer amount. The measured values were calculated using the average method. In Step 3, the window U-value was measured using the IR method proposed in this study. The U-value was calculated by applying the measured temperature and the internal surface heat transfer coefficient according to each standard. In Step 4, the results of the HFM method and IR method were compared and analyzed based on the results of the KS F 2278 used in Step 1.
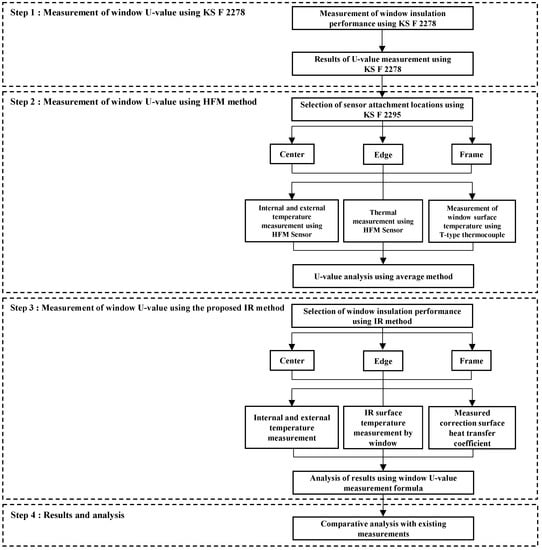
Figure 1.
Overall study process.
2.1. Measurement of Window U-Value Using the Korean Standard (KS F 2278)
In this study, the window performance measurement device was a device designed based on the KS F 2278 to maintain the internal and external temperatures constant (see Figure 2). In Figure 2b, (A) is a constant temperature chamber, (B) is a protective heat box, (C) is a low temperature chamber, (D) is a cold air extraction device, (E) is a heating device, (F) is a radiation protection plate and (G) is an air-flow agitation. Table 1 shows the equipment specifications for measuring the U-value of the window. Table 2 shows the measurement window specifications for measuring thermal performance. The window to be measured was a double-glazed window in an existing house.
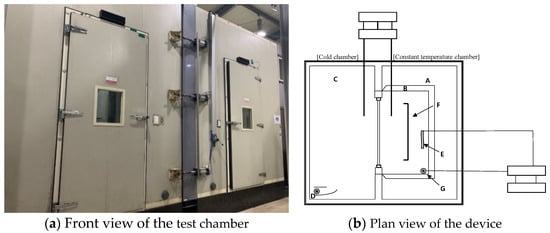
Figure 2.
Test chamber device for the Korean Standard (KS F 2278). (a) Front view of the test chamber; (b) Plan view of the device.

Table 1.
Equipment specifications.
Table 2.
Window specifications.
First, the window to be tested was 2000 × 2000 mm in size and was attached to the test attachment frame for measurement. The measuring device was maintained in a steady-state (normal) state by setting the cold chamber air temperature to 0 °C and the constant temperature room air temperature to 20 °C. The average value of the surface heat transfer resistance should be the surface of the protective heat box (0.11 ± 0.02 (∙K)/W) and the surface on the cold chamber side (0.05 ± 0.02 (∙K)/W) adjusts the airflow. Temperatures and calories were measured 3 times at 30-min intervals. The window U-value measurement Equations (1)–(3) [17] are as follows:
where is the correction value of the surface heat transfer resistance and the subscripts i and e represent the surface heat transfer resistance of the internal and external protective heat box, respectively; represent heat transfer resistance and heat transfer area, respectively; represent the average air temperature in the protective heat box and the cold chamber, respectively; and represent the amount of heat supplied from the heating device and the air-flow agitation device, respectively; is the calibration heat flow rate. The U-value is equal to the inverse of the total thermal resistance.
Resultant U-Value Measured Using the KS F 2278 Thermal Performance Test
Table 3 shows the average measurement results of the KS F 2278 window thermal performance test report. The measurement results for the total window U-value was measured at 2.54 W/(∙K), and the uncertainty of measurement was measured at 0.17 W/(∙K). The KS F 2278 thermal performance measurement results were calculated using Equations (1)–(3). The calculated result was applied as the reference U-value of the U-value measurement result of the HFM method and the proposed IR method. In order to measure the measurement uncertainty, the combined uncertainty is calculated by measuring the uncertainty of type A and type B through seven uncertainty coefficients (, , , , , A, and ). The equation for calculating the uncertainty is shown in Equation (2).
Table 3.
Window KS F 2278 thermal performance average results.
2.2. Measurement of Window U-Value Using the Heat Flow Meter (HFM) Method
In this study, the U-value of the window was measured using the HFM method by measured the internal and external temperature, surface temperature, and heat flux of the window. The internal and external temperatures and heat flux were measured using a heat flux sensor, and the surface temperature was measured using a T-type thermocouple. For the sensor attaching position for measurement, the standard of KS F 2295 was applied (see Figure 3) [18]. The device was attached to the center of the window glass at 1 point, at the corners at 6 points, and at the frame at 3 points to measure the window U-value. The measurement period was over a 72-h time period and the U-value was calculated by applying the average method [19,20,21,22]. The total U-value measurement equation for the window is Equation (4) [23,24,25] as follows:
where and A are heat transfer rate and area of window, respectively, and the subscripts indicate the center, edge, frame, and total of the window, respectively.
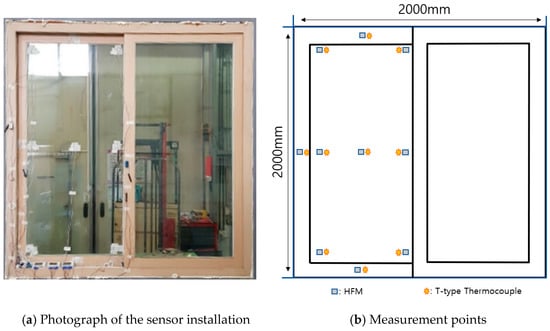
Figure 3.
Window measurements using the heat flow meter (HFM) method. (a) Photograph of the sensor installation; (b) Measurement points.
2.3. Measurement of Window U-Value Using the Infrared (IR) Method
In this study, we perform the U-value measurement of the window using the IR method based on a three-step process. The first step was to select the window measurement location for the IR method. The second step was to measure the window U-value using the IR method. The final step was to analyze the measurement results. Using an IR camera, measurements were taken for each point in the area of the window where the temperature change was small. In order to apply the IR method to the window, a blackbody was built to correct the emissivity and reflectance, which are contributing factors. Therefore, it was measured assuming that the emissivity was 1 and the reflectance was 0 [26]. Then, the surface temperature of the window was measured with an IR camera. The U-value of the window was measured by applying the measured surface temperature (see Figure 4) and the internal surface heat transfer coefficient based on the Korean energy-saving design standard and the ISO 6946 standard [27,28,29,30]. The two cases of measuring the window U-value using the IR method is shown in Table 4. The first case, , is the method of applying the h value of 9.09 from the Korean energy-saving design standard. The second case, , is the method of applying the h value of 7.69 from ISO 6946.
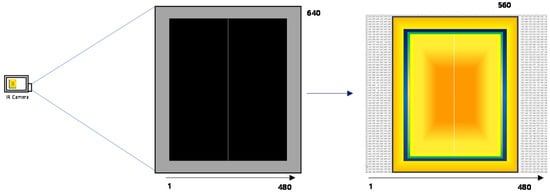
Figure 4.
Window measurements using the infrared (IR) method.
Table 4.
Measurement cases using the IR method.
The surface temperatures of the center, edge, and frame of the window are collected using the IR temperature information analysis tool. The total U-value of the window is calculated by applying the surface temperature, the total surface heat transfer coefficient in the room, and the area of each area. The total U-value measurement equation for the window is Equation (5). Equation (5) was derived by applying the following concept: The heat transfer per unit area due to convection and radiation transferred indoors, the heat transfer per unit area due to conduction through the window, and the heat transfer per unit area due to outdoor convection and radiation are the same [31].
The total U-value measurement is obtained using Equation (5) as follows:
where is total heat transmission rate for window; are the surface heat transfer coefficient and area of inner window, respectively and the subscripts indicate the center, edge, frame, and total of the window, respectively; W = ( is the difference between the indoor temperature and the outdoor temperature of the total window, = ( is the difference between the indoor temperature and the outdoor temperature of the center; Y = ( is the difference between the indoor temperature and the outdoor temperature of the edge; = ( is the difference between the indoor and outdoor temperature for the frame; T is the temperature and the subscripts I and e indicate the indoor and outdoor temperatures, respectively.
3. Results and Discussion
In this section, we discuss the U-value result of the window according to the measurement method. The measurement results were compared and analyzed for the reference U-value (KS F 2278) and the measurement relative error rate, absolute error, standard deviation, and cvRMSE.
3.1. U-Value Measured Using the HFM Method
Figure 5 shows the U-value of the window measured under steady-state conditions.
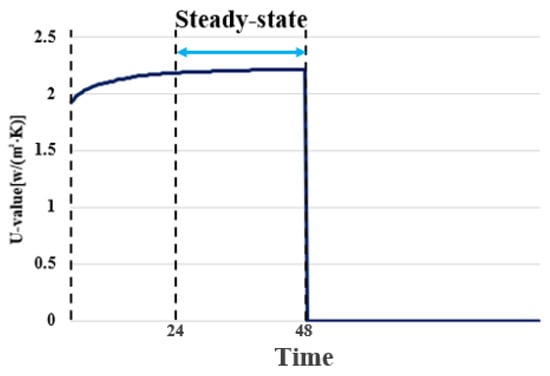
Figure 5.
Measured U-value under steady-state condition.
In the graph in Figure 5, the U-value of the window was measured while adjusting the temperature from an unsteady to a steady-state condition. The measurements confirmed a pattern that ended after 72 h of experimentation.
Table 5 shows the results of the heat transfer rate of the window using the HFM method. This result was applied to Equation (6) to calculate the U-value for each site [2]. The calculated results are shown in Figure 6 and Table 6.
Table 5.
Window U-value using the HFM method.
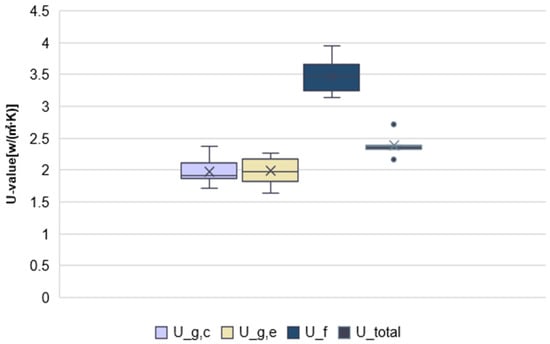
Figure 6.
Boxplot of U-value results using the HFM method.
Table 6.
Window U-value using the HFM method.
The U-value for each site on the window are calculated using Equation (6) as follows:
where U is the heat transfer rate of the window; q is the heat transfer rate; T is the temperature and the subscripts I and e indicate the indoor and outdoor temperatures, respectively; R is the thermal resistance and its subscript T represents total.
Figure 6 shows the total U-value results for the window calculated using the HFM method. The results indicate the minimum, 25% (1 quartile), median, 75% (3 quartile), and maximum values for each area of the window, i.e., center, edge, and frame. Table 6 shows the result of the HFM method as follows: The 25–75% of the U-value measurement results range from 1.91 to 2.08 W/(∙K) at the center and from 1.89 to 2.12 W/(∙K) at the edge. At the center, the U-value results are similar to the edges, but the distribution difference is greater than the edges. Regarding the frame U-value, 25–75% are distributed from 3.27 to 3.58 W/(∙K). The frame U-value results are considered to be heat sensitive and differ significantly from the center and the edge U-values. Finally, 25–75% of the total U-value was 2.35 to 2.39 W/(∙K), confirming the stability of the U-value measurement results. The median value of total U-value was applied to the comparison result with the reference value.
3.2. U-Value Measured Using the IR Method
The surface temperatures of each measured area of the window were measured using an IR camera. Figure 7 shows the temperature distribution of the window surface temperatures measured with a thermal imaging camera. The temperature measured by the thermal imaging camera was obtained using pixel information of 480 × 640, to obtain the temperature information of the center, edge, and frame of the window. The window U-value calculation was performed by applying the measured temperature information and the internal surface heat transfer coefficient [32,33].
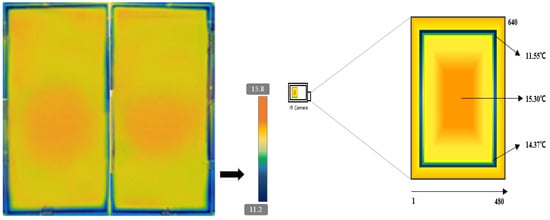
Figure 7.
Window surface temperature using an IR camera.
Figure 8 shows a boxplot of the U-value results applying the energy-saving design criteria. Figure 8 shows the minimum value, 25% value (1 quartile value), median, 75% value (3 quartile value), and maximum value.
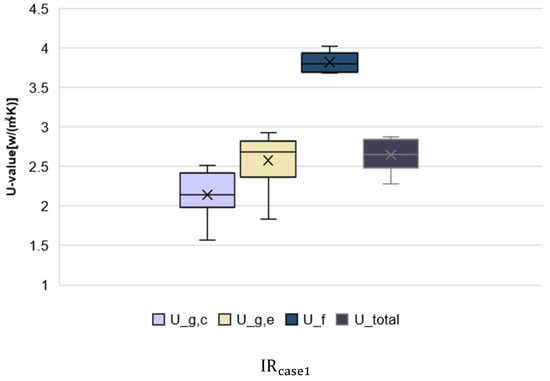
Figure 8.
Boxplot of the U-value results with energy-saving design criteria.
Table 7 shows the result for U-values applying the energy-saving design criteria, i.e., 25–75% of the U-value results were distributed at the center from 2.02 to 2.36 W/(∙K) and at the edges from 2.41 to 2.82 W/(∙K), and the frame results were from 3.71 to 3.94 W/(∙K). The center and edge have similar U-value results, while in the case of the frame, the measurement distribution is small, and the U-value result has the largest value. Finally, 25–75% of the total U-values were distributed from 2.57 to 2.65 W/(∙K)
Table 7.
Window U-values using the method.
Figure 9 shows a boxplot of the U-value results applying the ISO 6946 standard. Figure 9 shows the minimum value, 25% value (1 quartile value), median, 75% value (3 quartile value), and maximum value.
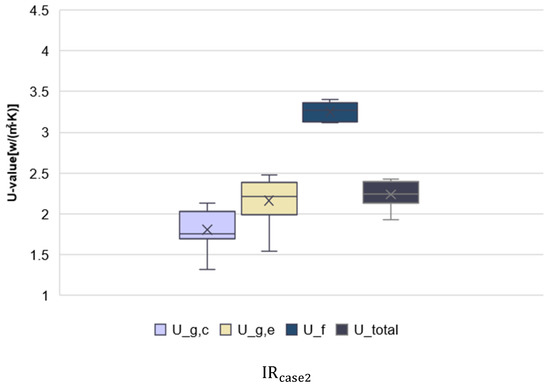
Figure 9.
Boxplot of the U-value results using the ISO 6946 standard.
Table 8 shows the U-value results applying the ISO 6946 standard, i.e., 25–75% of the U-value results were distributed in the center from 1.71 to 2.00 W/(∙K), the edge from 2.04 to 2.38 W/(∙K), and the frame from 3.13 to 3.33 W/(∙K). Figure 9 shows the U-value results with the same pattern as Figure 8. The 25–75% of the total U-value are distributed from 2.18 to 2.40 W/(∙K). The center and edge have similar U-value results, while in the case of the frame, the measurement distribution is small and the U-value result has the largest value.
Table 8.
Window U-values using the method.
For the IR result, the median value of the total U-value was applied for comparison with the reference value. Table 9 shows the U-value results for each measurement case.
Table 9.
Window U-value error rate analysis by measurement method.
It was confirmed that the accuracy of the error rate analysis results was higher in the order of , HFM, and . The reference value and error rate were the largest at 11.81% and 0.30 W/(∙K) for , and the smallest at 3.05 and 0.08 W/(∙K) for . The had the lowest error rate among the IR methods proposed in this study, and it was confirmed to have an improved accuracy of 2.85% as compared with the measurement result of the HFM method. The HFM method obtained similar results to the reference value when conditions such as temperature difference and measurement time were satisfied. The standard deviation result for the was ±0.19 which was the largest deviation, and the standard deviation result for was ±0.16, which was the smallest deviation. The reason that the deviation of is less than is because the result depends on the criterion of the heat transfer coefficient. In contrast, the cvRMSE result was the most accurate at 3.29% for the and the largest error at 30.33% for the . When applying a total surface heat transfer coefficient that does not match the internal conditions of the window, the error rate increased, affecting the measurement accuracy. Accordingly, it is expected that using the IR method applied with the surface heat transfer coefficient suitable for the site conditions is advantageous for more accurate U-value calculations.
4. Conclusions
It is essential to study the feasibility of measuring thermal performance as there is no U-value in situ measurement method for windows that includes the glass and frame.
Therefore, this study proposed the ISO 9869-2 IR method that could solve the shortcomings of the ISO 9869-1 HFM method, which is a method of measuring the thermal performance of building envelope. Using the IR method for the total U-value measurement of windows enables multiple areas to be measured and increases the measurement accuracy. In this study, in order to measure the window U-values, experiments were conducted using a window thermal performance test device that maintained a constant internal and external temperature. First, the total U-value result of the window was obtained using the KS F 2278 Standard window performance evaluation. The measurement result was used as a reference value for comparative analysis in this experiment. Regarding the U-value measurement result, it was confirmed that the , which had the smallest error rate using the IR method, was 3.29% more accurate than the measurement result using the HFM method, which suggests the advantage of this method for measuring the thermal performance reflecting the thermal bridge of a window including glass and frame in situ. In this study, measurement accuracy and reliability were confirmed through verification work with the results of the window performance evaluations. We also confirmed that the U-value of a window can be measured quickly using the IR method based on the comparison results with existing measurement methods for U-value. When measuring the U-value of a window using the IR method, surface temperature and various factors are required, and therefore the surface heat transfer coefficient should be considered in future studies. The U-value of a window would be more accurate by considering the actual measured surface heat transfer coefficient.
Author Contributions
Conceptualization, S.P., J.K. and S.L.D.; Investigation, S.P., S.H.K.; Methodology, S.P., S.L.D.; Project administration, H.J. Supervision, J.K. All authors have read and agreed to the published version of the manuscript.
Funding
This study is funded by the “ESS-based, small scale co-residual clean energy, smart home electrical study” research project supported by the Korea Energy Technology Evaluation Agency (KETEP) and the Ministry of Trade, Industry and Energy.
Institutional Review Board Statement
Not applicable.
Informed Consent Statement
Not applicable.
Data Availability Statement
Data sharing not applicable.
Acknowledgments
This work was supported by the Korea Institute of Energy Technology Evaluation and Planning (KETEP) and the Ministry of Trade, Industry & Energy (MOTIE) of the Republic of Korea (NO. 20172410104720).
Conflicts of Interest
The authors declare no conflict of interest.
References
- Korea Environment Corporation (KEC). Supporting Green House Gas Reduction Policies; Korea Environment Corporation: Korea, Seoul, 2017. [Google Scholar]
- International Organization for Standardization. Thermal Insulation—Building Elements—In-Situ Measurement of Thermal Resistance and Thermal Transmittance—Part 1: Heat Flow Meter Method; ISO Standard 9869-1; International Organization for Standardization: Geneva, Switzerland, 2014. [Google Scholar]
- Cesaratto, P.; Carli, M.; Marinetti, S. Effect of different parameters on the in situ thermal conductance evaluation. Energy Build. 2011, 43, 1792–1801. [Google Scholar] [CrossRef]
- Ghazi, K.; Binder, B.; Vonbank, R. A simple method to determine the specific heat capacity of thermal insulations used in building construction. Energy Build. 2003, 35, 413–415. [Google Scholar] [CrossRef]
- Cucumo, M.; Rosa, A.; Ferraro, V.; Kaliakatsos, D.; Marinelli, V. A method for the experimental evaluation in situ of the wall conductance. Energy Build. 2006, 38, 238–244. [Google Scholar] [CrossRef]
- International Organization for Standardization. Thermal Insulation—Building Elements—In-Situ Measurement of Thermal Resistance and Thermal Transmittance—Part 2: Infrared Method for Frame Structure Dwelling; ISO Standard 9869-2; International Organization for Standardization: Geneva, Switzerland, 2018. [Google Scholar]
- Cheng, X.; Kato, S.; Hiyama, K.; Sihwan, L. The Technological Investigation of Wall Thermal Performance Diagnosis. Seisan Kenkyu 2013, 65, 5–7. [Google Scholar]
- Pisello, A.L.; Goretti, M.; Cotana, F. Building energy efficiency assessment by integrated strategies: Dynamic simulation, sensitivity analysis and experimental activity. Appl. Energy 2011, 16–18, 1395–1412. [Google Scholar]
- Ficco, G.; Iannetta, F.; Ianniello, E.; Alfano, F.R.A.; Dell’I, M. U-value in situ measurement for energy diagnosis of existing buildings. Energy Build. 2015, 104, 108–121. [Google Scholar] [CrossRef]
- Kim, S.H.; Kim, J.H.; Jeong, H.G.; Song, K.D. Reliability Field Test of the Air–Surface Temperature Ratio Method for In Situ Measurement of U-Values. Energies 2018, 11, 803. [Google Scholar] [CrossRef]
- Gaspar, K.; Casals, M.; Gangolells, M. A comparison of standardized calculation methods for in situ measurements of façades U-value. Energy Build. 2016, 130, 592–599. [Google Scholar] [CrossRef]
- Albatici, R.; Tonelli, A.M. Infrared thermovision technique for the assessment of thermal transmittance value of opaque building elements on site. Energy Build. 2010, 42, 2177–2183. [Google Scholar] [CrossRef]
- Francesco, A.; Giorgio, B.; Francesco, B. A quantitative methodology to evaluate thermal bridges in buildings. Appl. Energy. 2012, 97, 365–373. [Google Scholar]
- Dall’O, G.; Sarto, L.; Panza, A. Infrared screening of residential buildings for energy audit purposes: Results of a field test. Energies 2013, 6, 3859–3878. [Google Scholar] [CrossRef]
- Maroy, K.; Carbonez, K.; Steeman, M.; Bossche, N.D. Assessing the thermal performance of insulating glass units with infrared thermography. Potential Limit. Energy Build. 2017, 138, 175–192. [Google Scholar] [CrossRef]
- Kim, C.M.; Jang, H.I.; Kim, E.J. Comparison of wall U-values according to existing measurement methods for thermography field tests. J. KIAEBS 2019, 13, 384–393. [Google Scholar]
- Lu, X.; Memari, A. Application of infrared thermography for in-situ determination of building envelope thermal properties. J. Build. Eng. 2019, 26, 100885. [Google Scholar] [CrossRef]
- Korean Agency for Technology and Standards (KATS). KS F 2278, Test Method of Thermal Resistance for Windows and Doors. Korean Agency for Technology and Standards: Chungbuk, Korea. Available online: https://standard.go (accessed on 4 December 2017).
- Korean Standard Association. KS F 2295 Test Method of Dew Condensation for Windows and Doors. Korean Standard Association: Chungcheongbuk-do, Korea. Available online: https://standard.go (accessed on 9 October 2017).
- Albatici, R.; Tonelli, A.; Chiogna, M. A comprehensive experimental approach for the validation of quantitative infrared thermography in the evaluation of building. Appl. Energy 2015, 141, 218–228. [Google Scholar] [CrossRef]
- Lucchi, E. Thermal transmittance of historical brick masonries: A comparison among standard data, analytical calculation procedures, and in situ heat flow meter measurements. Energy Build. 2017, 134, 171–184. [Google Scholar] [CrossRef]
- Ballarini, I.; Corgnati, S.P.; Corrado, V. Use of reference buildings to assess the energy saving potentials of the residential building stock: The experience of TABULA project. Energy Policy 2014, 68, 273–284. [Google Scholar] [CrossRef]
- O’Grady, M.; Lechowska, A.; Harte, A.M. Infrared thermography technique as an in-situ method of assessing heat loss through thermal bridging. Energy Build. 2017, 235, 20–32. [Google Scholar] [CrossRef]
- International Organization for Standardization. Thermal Performance of Window, Door and Shading Devices–Detailed Calculation; ISO 15099; International Organization for Standardization: Geneva, Switzerland, 2003. [Google Scholar]
- International Organization for Standardization. Thermal Performance of Windows, Doors and Shutters–Calculation of Thermal Transmittance–Part 1: Genera; ISO 10077-1; International Organization for Standardization: Geneva, Switzerland, 2017. [Google Scholar]
- International Organization for Standardization. Thermal Performance of Windows, Doors and Shutters–Calculation of Thermal Transmittance–Part 2: Numerical Method for Frames; ISO 10077-2; International Organization for Standardization: Geneva, Switzerland, 2017. [Google Scholar]
- Paul, W.N.; Joseph, A.S.; Nathan., J.P. Radiometric calibration of infrared imagers using an internal shutter as an equivalent external blackbody. Opt. Eng. 2014, 53, 123106. [Google Scholar]
- Korea Energy Agency. Commentaries for Building Energy Code; Korea Energy Agency: Yongin, Korea, 2018.
- International Organization for Standardization. Building Components and Building Elements—Thermal Resistance and Thermal Transmittance—Calculation Method; ISO Standard 6946; International Organization for Standardization: Geneva, Switzerland, 2007. [Google Scholar]
- Bienvenido-Huertas, D.; Rodriguez-Alvaro, R.; Jose Moyano, J.; Rico, F.; Marin, D. Determining the U-value of Facades Using the Thermometric Method: Potentials and Limitations. Energies 2018, 11, 360. [Google Scholar] [CrossRef]
- Lucci, E. Application of the infrared thermography in the energy audit of buildings: A review. Renew. Sustain. Energy Rev. 2018, 82, 3077–3090. [Google Scholar] [CrossRef]
- Rossano, A.; Francesco, P.; Arnaldo, M.T.; Stefano, G. Assessment of the thermal emissivity value of building materials using an infrared thermovision technique emissometer. Energy and Buildings 2013, 66, 33–40. [Google Scholar]
- Choi, D.S.; Ko, M.J. Comparison of Various Analysis Methods Based on Heat Flowmeters and Infrared Thermography Measurements for the Evaluation of the In Situ Thermal Transmittance of Opaque Exterior Walls. Energies 2017, 10, 1019. [Google Scholar] [CrossRef]
Publisher’s Note: MDPI stays neutral with regard to jurisdictional claims in published maps and institutional affiliations. |
© 2021 by the authors. Licensee MDPI, Basel, Switzerland. This article is an open access article distributed under the terms and conditions of the Creative Commons Attribution (CC BY) license (https://creativecommons.org/licenses/by/4.0/).