Article

Research on Optimal Charging of Power Lithium-Ion Batteries in Wide Temperature Range Based on Variable Weighting Factors

State Key Laboratory of Automotive Simulation and Control, Jilin University, Changchun 130022, China
*
Author to whom correspondence should be addressed.
Energies 2021, 14(6), 1776; https://doi.org/10.3390/en14061776
Submission received: 23 February 2021 / Revised: 6 March 2021 / Accepted: 19 March 2021 / Published: 23 March 2021
(This article belongs to the Special Issue Electric Vehicle Charging: Social and Technical Issues)

Abstract

:
With the popularity of electric vehicles (EV), the charging technology has become one of the bottleneck problems that limit the large-scale deployment of EVs. In this paper, a charging method using multi-stage constant current based on SOC (MCCS) is proposed, and then the charging time, charging capacity and temperature increase of the battery are optimized by multi-objective particle swarm optimization (MOPSO) algorithm. The influence of the number of charging stages, the cut-off voltage, the combination of different target weight factors and the ambient temperature on the charging strategy is further compared and discussed. Finally, according to the ambient temperature and users’ requirements of charging time, a charging strategy suitable for the specific situation is obtained by adjusting the weight factors, and the results are analyzed and justified on the basis of the experiments. The results show that the proposed strategy can intelligently make more reasonable adjustments according to the ambient temperature on the basis of meeting the charging demands of users.

1. Introduction

Electric vehicles (EVs) and plug-in hybrid electric vehicles (PHEVs) have been greatly developed in recent years, because they are environmentally friendly, non-polluting, quiet and less expensive to charge than traditional internal-combustion vehicles [1,2]. However, due to the electrochemical characteristics determined by the structure and material of the battery, there are also many shortcomings, limiting its wide range of applications, one of which is the battery charging control problem [3,4].
Compared with the traditional internal combustion engine, which can be refueled quickly, battery charging requires a longer time and an appropriate operating temperature. To overcome these shortcomings, on the one hand, new materials and structures need to be developed for the batteries; on the other hand, appropriate battery management systems and strategies could also play a crucial role in the improvement and protection of the battery [5]. To improve the charging speed, it is necessary to increase the charging current, leading to the inevitable increase of battery temperature. When the battery temperature is too high and the generated heat cannot be dissipated effectively, there will be a great impact on battery life. On the contrary, when the ambient temperature is low, the excessive charging current will also cause irreversible damage to the battery because of lack of activity. Many studies on optimizing the charging strategy have been carried out on how to improve the charging performance, such as shortening the charging time, reducing energy consumption and temperature increase during the charging process, etc. One of the traditional charging methods is constant current constant voltage (CCCV) [6], in which the battery is first charged using a constant current, and when the preset voltage is reached, the battery is charged by a constant voltage until the current reaches the threshold value. Optimization of CCCV has been studied in many works in the literature [5,7,8]. Abdollahi et al. proposed that CCCV optimization is the minimum problem of the weighted sum of charging time and energy loss, and obtained the analytical solution for the optimal charging time [9]. Hu et al. also set battery charging as an optimization problem of charging time and energy consumption [10]. Unlike Abdollahi, Hu’s solution was numerical. Chen and Xu et al. used dynamic programming (DP) to obtain the optimal charging curve of CCCV [11,12]. Then the charging time of CCCV can be reduced, as well as the temperature. The CCCV method is simple and easy to implement, but it is essentially open-loop control and does not consider the effects of charging time and battery temperature. Pulse charging charges the battery intermittently at a preset value and frequency, and the charging speed is improved by eliminating the polarization effect to some extent through the static time or reverse discharge current between the two pulses [13,14]. However, the control process of pulse charging is complex, the cost of the equipment is high, and the influence on battery life still needs further study, so it is difficult to apply in a wide range in the short term. Multi-stage constant current (MCC) is also a widely studied charging method, in which better charging performance can be achieved by optimizing the current at each stage [15,16,17,18]. Multi-stage constant current charging method can be divided into multi-stage constant current based on voltage (MCCV) [19,20] and multi-stage constant current based on SOC (MCCS) [17] according to the judgment conditions of current variation. The main purpose of these methods is to achieve optimal current combination through a certain algorithm, improving the charging speed or reducing the temperature and energy consumption. However, in these articles the impact of ambient temperature on the charging process is not considered either and the uncharged capacity caused by the constant current is also ignored. The search for the optimal battery charging strategy can be regarded as a comprehensive optimization problem and it is difficult to solve by using traditional methods [20]. Therefore, some papers use swarm intelligence algorithms, such as genetic algorithm [17,21], particle swarm algorithm [20], ant colony algorithm [22], Taguchi’s method and the continuous orthogonal array technique [23,24], which have been successfully used to improve the performance of charging time, life and energy consumption of batteries. In other papers, more complex intelligent control strategies such as neural network [25] and grey prediction theory [26] have also been proposed and applied. Although these strategies are relatively accurate, they need a lot of experimental data as support, otherwise their accuracy cannot be guaranteed, which limits their practical application.
Temperature also plays an important role in the performance and life of batteries [27,28]. Generally, when temperature increases, the lithium-ion battery becomes more active and will be more effective to electrochemical reaction, so the maximum charging current also increases with the increase of temperature. However, when the operating temperature is higher than the limit, the reaction kinetics will be inhibited due to the loss of active substances in the electrode and the failure of solid electrolyte interphase (SEI) film [29], and even the risk of thermal runaway will occur. At the same time, when charging below the operating temperature range, lithium may deposit on the anode surface rather than embedded in the anode particles. This so-called lithium coating can lead to capacity loss, which greatly affects service life [30]. Therefore, when the ambient temperature is low, it is necessary to speed up the temperature increase to improve the battery charging and discharging activity. On the contrary, when the ambient temperature is high, reducing the temperature increase as much as possible will be helpful to avoid the danger or damage caused by overheating.
To the best of our knowledge, regardless of the use of traditional CCCV or other aforementioned charging methods, usually, only a certain preset or optimized fixed optimal charging selection is given, and the influence of ambient temperature on battery performance in the charging process is rarely considered. However, the parameter characteristics of the battery will change with temperature, and this cannot be ignored. At the same time, in the daily use of EV, people will put forward different requirements for charging strategies according to different situations. Therefore, the specific optimal charging method may not be the optimal strategy under different requirements. The purpose of this article is to put forward constraint analysis for the charging time, battery temperature increase and charging capacity through an algorithm for multi-objective particle swarm optimization (MOPSO). Under the limitation of battery charging current, the strategy of fast charging and normal charging is obtained according to the weight factor allocation. Furthermore, the weight factor of normal charging is adjusted by monitoring the ambient temperature to adapt to the current temperature. Therefore, the charging strategy proposed in this paper can further optimize the battery charging strategy by intelligently adjusting the charging weighting factors according to the ambient temperature based on the user’s choice of fast charging and normal charging according to their demand, and finally achieve a good tradeoff between the convenience of the user’s choice and the proper temperature control of charging strategy.
The rest of this paper is organized as follows: in Section 2, the equivalent circuit and thermal models of battery are presented, then the multi-objective problem of charging is formulated. In Section 3, the experimental setup is presented, and model parameter estimation is carried out. In Section 4, the charging stages number and cur-off voltage are analyzed and selected for further analysis. In Section 5, the simulation results are compared and discussed, then the charging strategy based on variable weighting factors is given. Finally, the conclusions are drawn in Section 6.

2. Study of Battery Multi-Objective Charging Optimization

2.1. Simulation Model Building

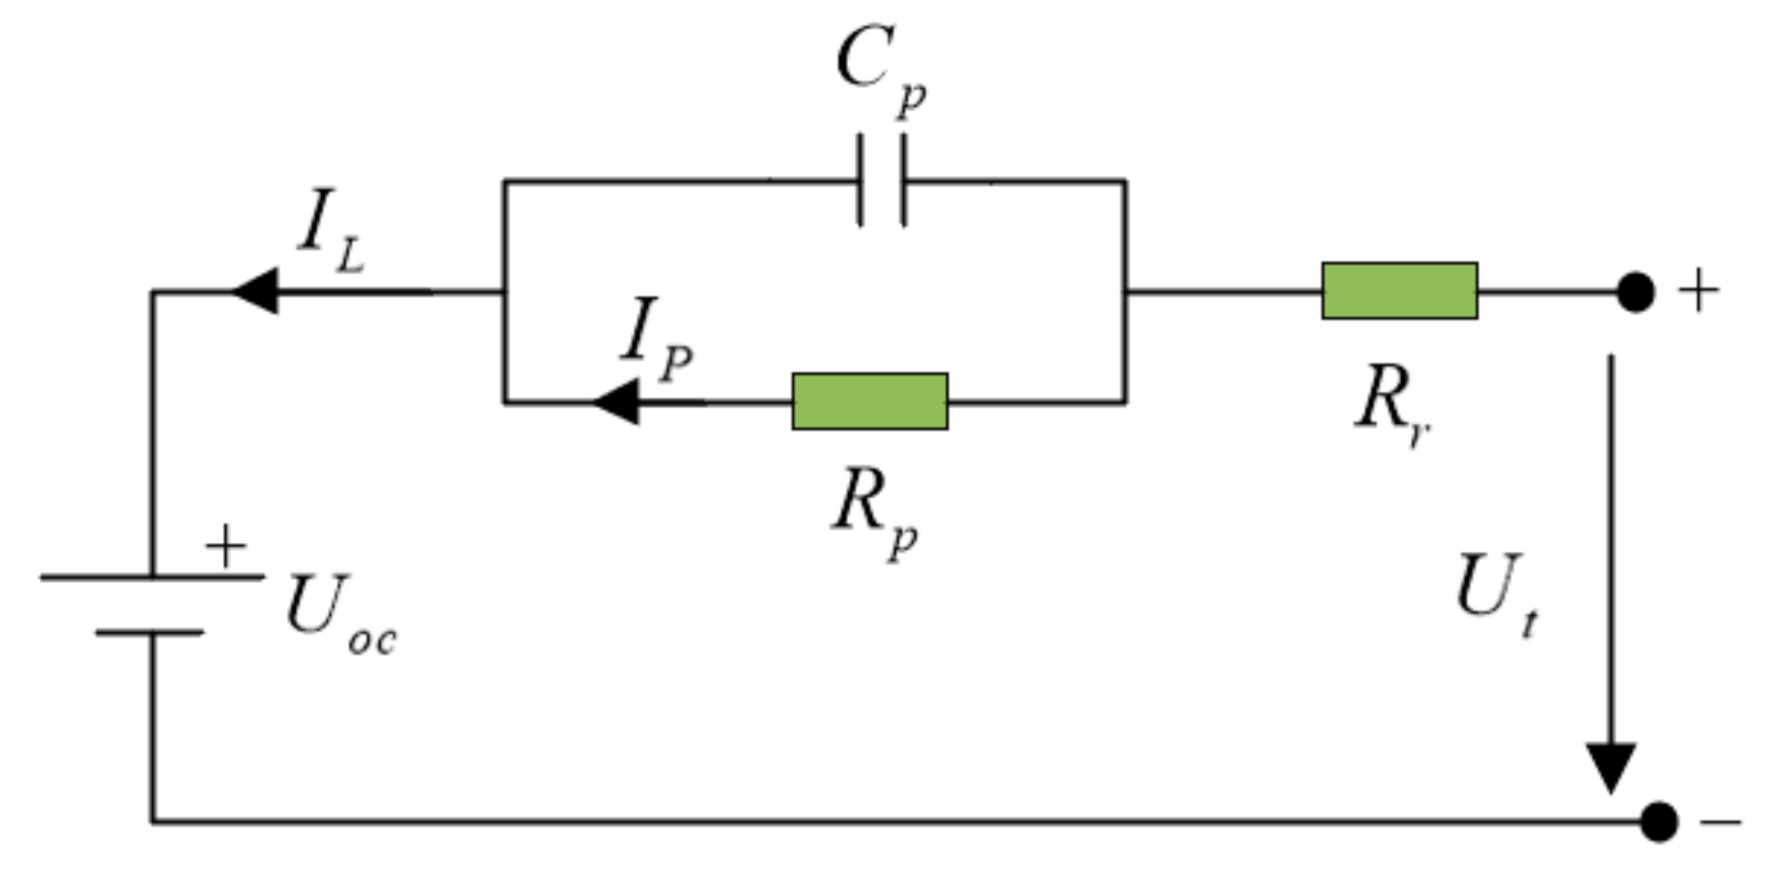
2.1.1. Equivalent Circuit Model

To optimize the charging current, a suitable battery model is needed. At present, the common method for studying battery characteristics is to establish a battery equivalent circuit model (ECM) or an electrochemical one. The electrochemical model is much more accurate, but it is so complex and computationally intensive that it is often used in battery designs, so ECM is adopted. Depending on the characteristics of the problem, the number of Resistor-Capacitance (RC) links is usually set to one or two. Further increasing the number of RC links increases the computational load without significantly improving the accuracy. In this paper, a first-order RC model was selected to achieve a good balance between model accuracy and computational complexity, as shown in Figure 1. U o c is the battery open circuit voltage (OCV); U t is the battery terminal voltage; I L is the battery load current (assumed to be negative for discharging and positive for charging); and I P is the outflow current of C p . R r is the ohmic resistance; R p is the polarization resistance; and C p is the polarization capacity. The RC network consisting of R p and C p describes the mass transportation effects and dynamic voltage performance of the battery. The polarization voltage on R r and C p is represented as U p .
U ˙ P = 1 C P R P U P + 1 C P I L U O C = U t I L R r U P
By discretizing (1) we can get the following results
U P ( k ) = exp ( Δ t τ ) × U P ( k 1 ) + ( 1 exp ( Δ t τ ) ) × I L ( k 1 ) R r U t = U O C + I L R r + U P
where U p ( k ) represents the value of U P at time k, and I k represents the value of I L at time k, τ = C p · R p is the time constant of the equivalent circuit, and Δ t is the sampling time.
All battery parameters are functions of SOC and temperature T, where SOC is defined as
S O C t = S O C i n i 0 t η I L ( t ) d t / Q C
where S O C t represents the SOC of the battery at time t, S O C i n i represents the initial value of the SOC of the battery (set as 0 in this paper), η is the current efficiency (set as 1 in this paper), and Q C is the rated capacity of the battery.

2.1.2. Battery Thermal Model

According to [31], the temperature of the battery surface can be assumed to be uniformly distributed, so that battery can be regarded as a particle for thermal modeling. The battery thermal model can be expressed as
C b a t t d T b a t t d t = Q R + Q L Q T
where C b a t t is the specific heat capacity of the battery, T b a t t is the temperature of the battery, Q R is the reversible heat caused by entropy change, Q L is the heat generated by overpotential during charging, and Q T represents convective heat dissipation.
Q R = T Δ S I e F
Δ S = n F d U O C V d T b a t t
Q T = h A ( T T a m b )
where Δ S is the entropy change, n is the number of electrons per reaction (n = 1 in this paper), F is the Faraday constant, U O C V is the open circuit voltage of the battery, T a m b is the ambient temperature controlled by the incubator, h is the thermal conductivity coefficient, and A is the total surface area of the battery.
According to [17], overpotential heat can be expressed as follows:
Q L = Q P + Q J
Q P = I U P
Q J = I 2 R r
where Q P is the energy loss caused by polarization, U P is the polarization voltage of the battery, and Q J is the energy loss caused by ohmic heating. By discretizing (4), we can get the following equation:
T b a t t , k = T b a t t , k 1 + I k 1 2 R r + U P 2 R P + T b a t t , k 1 I k 1 d U O C V d T b a t t A h ( T b a t t , k 1 T a m b ) m C b a t t
where m is the mass of the battery.
In this paper, the maximum temperature increase of the battery in the charging process is the main research object, and the maximum temperature increase corresponds to the high current fast charging process. In the case of high current charging, the order of magnitude, Q r = T Δ S I e F , is very small and can be ignored. Therefore, we can get the conclusion by omitting Q r to speed up the calculation without affecting the calculation accuracy:
T b a t t , k = T b a t t , k 1 + I k 1 2 R r + U P 2 R P A h ( T b a t t , k 1 T a m b ) m C b a t t
The equation is further simplified:
T b a t t , k = T b a t t , k 1 α ( T b a t t , k 1 T a m b ) + β I k 1 2 + γ U P 2 R P
α = A h m C b a t t
β = R r m C b a t t
γ = 1 m C b a t t
It is assumed that T b a t t , k = 0 = T a m b , and the change of battery temperature during charging can be obtained by Equation (13).

2.2. Theoretical Analysis

The charging process can be viewed as the process of charging from the initial SOC to the target SOC. In this paper, we adopt the multi-stage constant current charging strategy, which can be divided into multi-stage charging based on SOC (MCCS) and multi-stage charging based on voltage (MCCV) according to the different charging cut-off conditions. MCCV uses the charging voltage as the cut-off condition of each stage. When the voltage reaches a preset value, the charging current is changed to enable the charging to enter the next stage. However, MCCV is still essentially a CCCV charging method that splits the CV phase into several CC phases, which may affect the optimization and improvement of the charging effect. Here, MCCS is adopted, in which SOC is used as the judgment standard of current change.
The initial SOC is expressed as S O C i n i , and the charging target SOC is S O C t a r . The charging interval from S O C i n i to S O C t a r is divided into N stages, and each current corresponding to the charging interval needs to be optimized according to the objectives (time, temperature increase, capacity). The change of SOC in each stage is set as Δ S O C , then the relationship between N and SOC can be expressed as N = ( S O C t a r S O C i n i ) / Δ S O C . The charging time required in stage n can be described as
t n = Q n / I n = Δ S O C Q / I n
where I n is the current in the n-th stage, and Q is the target charging capacity of the battery. The total charging time of all stages can be obtained by the following equation:
t = n = 1 N 1 t n + t N
At the same time, the total charging battery capacity can be obtained
Q c h a r = S O C i n i + ( N 1 ) Δ S O C + Δ S O C N Q
The last charging stage, the Nth stage, is considered separately here, because the charging capacity at this stage may not reach the theoretical value Δ S O C Q . Q is obtained when the final charging current is 0.05 C, so exceeding this current in the Nth stage may cause the charging process to end prematurely. The charging cutoff voltage is 3.65 V, and the open-circuit voltage OCV at the end of the Nth stage of charging can be described as
O C V N = 3.65 U r U P
According to the SOC-OCV mapping curve, the SOC at the end of the Nth stage can be expressed as
S O C N = f 1 ( 3.65 U r U P )
Therefore, the charged capacity can be expressed as
Q N = Q [ S O C N Δ S O C ( N 1 ) ]
and the charging time is obtained as follows
t N = Q N / I N
Based on Equation (13), the temperature increase at time k during the charging process is given by
Δ T k = T k e n d T k i n i = β 0 t k I k 2 d t + γ 0 t k U P 2 R P d t α 0 t k T b a t t T a m b d t
Δ T max = T max T a m b
T max is the highest temperature of the whole charging process.
The purpose of this paper is to seek a balance among charging time, maximum temperature increase and charging capacity, so as to get the charging strategy most needed by users. In the process of charging, we will assign weights to the three charging objectives. The increase of weight factors means that the charging time will be reduced, the temperature increase will be reduced, and the charged capacity will be increased respectively. To unify the optimization problems of the three objectives and facilitate understanding, the concept of uncharged capacity Q u n c , namely the difference between the current charged capacity and the rated capacity, is proposed here, which is defined as follows
Q u n c = Q C Q c h a r
Q c h a r is calculated by Equation (19).
Therefore, the multi-objective problem in this paper can be described as
Minimizing   J = { t c h a r ( I ) , Δ T max ( I ) , Q u n c ( I ) }

2.3. Constraint Conditions

The objective of multi-stage charging optimization is to enhance the charging performance, the process of which is constrained by current, voltage, charging time and SOC limits. According to the maximum charging current provided by the battery manufacturer, the charging current differs with different battery temperature T b a t t . At the same time, the charging current in different stages also needs to be restricted according to the SOC range. Based on the polarization characteristics of the battery, the acceptable charging current is relatively high when the SOC is low, and gradually decreases with increasing SOC [32]. Therefore, in this paper, the charging current of the next stage was set to be less than or equal to the current of the previous stage. During charging, the battery voltage should not exceed the cut-off voltage U c u t o f f , that is U U c u t o f f ; by synthesizing Formula (2), we can get I U c u t o f f U o c U P / R r . The charging current interval is set to 0.01 C, and the minimum charging current is set to 0.1 C. Considering the actual use of overnight charging, the charging time is limited to less than 8 h. It is assumed that S O C i n i = 0, S O C t a r = 90%, and the ambient temperature is equal to the initial battery temperature. Therefore, the constraint conditions are listed in (28). The other simulation parameters, such as cut-off voltage and stage number, will be discussed in detail in Section 4.
T c h a r ( I ) 8 h 0.1 C I I c h a r max ( T b a t t ) I U c u t o f f U o c U P / R r I j I k , i f   j k ; j , k = 1 , 2 , , n s t a g e
where, when 0 °C < T b a t t < 10 °C, I c h a r max = 0.8 C; when 10 °C < T b a t t < 25 °C, I c h a r max = 1.5 C; when 25 °C < T b a t t < 40 °C, I c h a r max = 2 C.

2.4. Optimal Charging Current Calculation by MOPSO

For multi-objective optimization, the optimization objectives are often contradictory to each other, so there is no unique solution that meets all the optimization objectives. There may be many solutions that cannot be governed by each other, and these solutions are called Pareto optimal solution sets. Many researchers have studied multi-objective optimization algorithms, among which the particle swarm optimization algorithm (PSO) is an optimization algorithm based on the bird flock model. It has the advantages of a simple principle, fast convergence, and so on, so the particle swarm optimization algorithm is widely used in the optimization field [33,34]. In this paper, Coello’s multi-objective particle swarm optimization algorithm [35], based on the external archiving idea and the basic principle of Pareto domination, is adopted.
The detailed optimization procedures of MOPSO are as follows:
1.
Particle population initialization and velocity initialization of each particle. Firstly, the population with random position, zero velocity and m number of individuals is generated. The position of the i-th particle is x i = [ x i 1 , x i 2 x i n ] the velocity of the i-th particle is v i = [ v i 1 , v i 2 v i n ] , where n represents the dimension of the search space.
2.
The fitness of each particle in the population is evaluated according to the charging theory.
3.
The positions of particles representing nondominated particles are stored in rep and the rep is updated.
4.
Update the position and velocity of each particle according to the following formula:
v i n ( k + 1 ) = ω v i n ( k ) + Λ 1 R 1 ( P b e s t . i n x i n ( k ) ) + Λ 2 R 2 ( R E P ( h ) x i n ( k ) )
x i n ( k + 1 ) = x i n ( k ) + v i n ( k + 1 )
v i n ( k + 1 ) and v i n ( k ) represents the current and previous velocities of particle i in n-dimensional space, respectively. x i n ( k + 1 ) and x i n ( k ) represent the current and previous positions of particle i in n-dimensional space, respectively. ω is the inertia factor. Λ 1 is the individual learning factor and Λ 2 is the social learning factor, R 1 and R 2 are random numbers in the range of [0,1]. P b e s t . i n is the best position of particle i at time t, which is called the “self-knowledge part” of the learning sample of particles. R E P ( h ) is the best particle in the group at time t, which is called the “social part” of the learning sample of particles.
To determine R E P ( h ) , the research object is meshed with hypercube, and a fitness value is specified for the hypercube containing multiple particles by using the following function:
f i t n e s s [ i ] = n i 10
n i is the number of particles in the i-th hypercube. Then, R E P ( h ) is chosen through roulette.
5.
Convergence determination. The current particle swarm fitness value is compared with the previous particle swarm fitness value. If the difference is less than the threshold α, the search procedure will be terminated.
6.
Repeat steps 2 to 5 until the best value is reached or the number of iterations reaches the set value.
In this paper, the number of particle swarm is set to 100 to ensure better convergence and accuracy. The number of iterations is set to 200. The inertia factor is set to 0.7; Λ 1 and Λ 2 are set to 1.6 and 1.5, respectively, and the number of grids is set to 10.

2.5. Multi-Objective Decision Making Evaluation Method

Although the three optimization objectives are contradictory to each other and there is no absolute optimal solution, in order to get a specific charging strategy according to the demands of users, we can choose the most suitable solution in the Pareto solution set. This paper uses the weighted measurement method to solve this problem. Since the three optimization objectives have different orders of magnitude, we normalize the three optimization objectives by Equation (32), so that the values of the three objectives are all limited in the range of [0, 1], and their sum is set as 1.
f k ( X ) = f k ( X ) f k min ( X ) f k max ( X ) f k min ( X )
f k ( X ) is the value of the k-th objective. f k ( X ) is the normalized value. f k min ( X ) and f k max ( X ) are the minimum value and maximum value of the k-th objective respectively. Then the evaluation index J φ can be calculated by the weight factor:
J φ = φ 1 t c h a r ( I ) + φ 2 Δ T max ( I ) + φ 3 Q u n c ( I )
φ 1 + φ 2 + φ 3 = 1
0 φ 1 , φ 1 , φ 1 1
φ 1 is the weight factor of the charging time, φ 2 is the weight factor of the maximum temperature increase, and φ 3 is the weight factor of the uncharged capacity.

3. Experimental Setup and Parameter Estimation

3.1. Experimental Setup

The experimental equipment included: (1) A Lithium-ion phosphate battery with parameters as listed in Table 1; (2) Chroma battery cell charge and discharge test system model 17,011 (Taoyuan, China); (3) A host computer; (4) Data logger. The Chroma 72,001 battery is used to charge and discharge the battery with a maximum voltage of 5 V and a maximum current of 20 A with an accuracy of 1 mV voltage and 10 mA current. It has eight independent testing channels as well as eight temperature acquisition sensors. The current, voltage are saved in real time by the host computer through TCP/IP interface and temperature data is saved by the data logger. The experimental setup is shown in Figure 2.

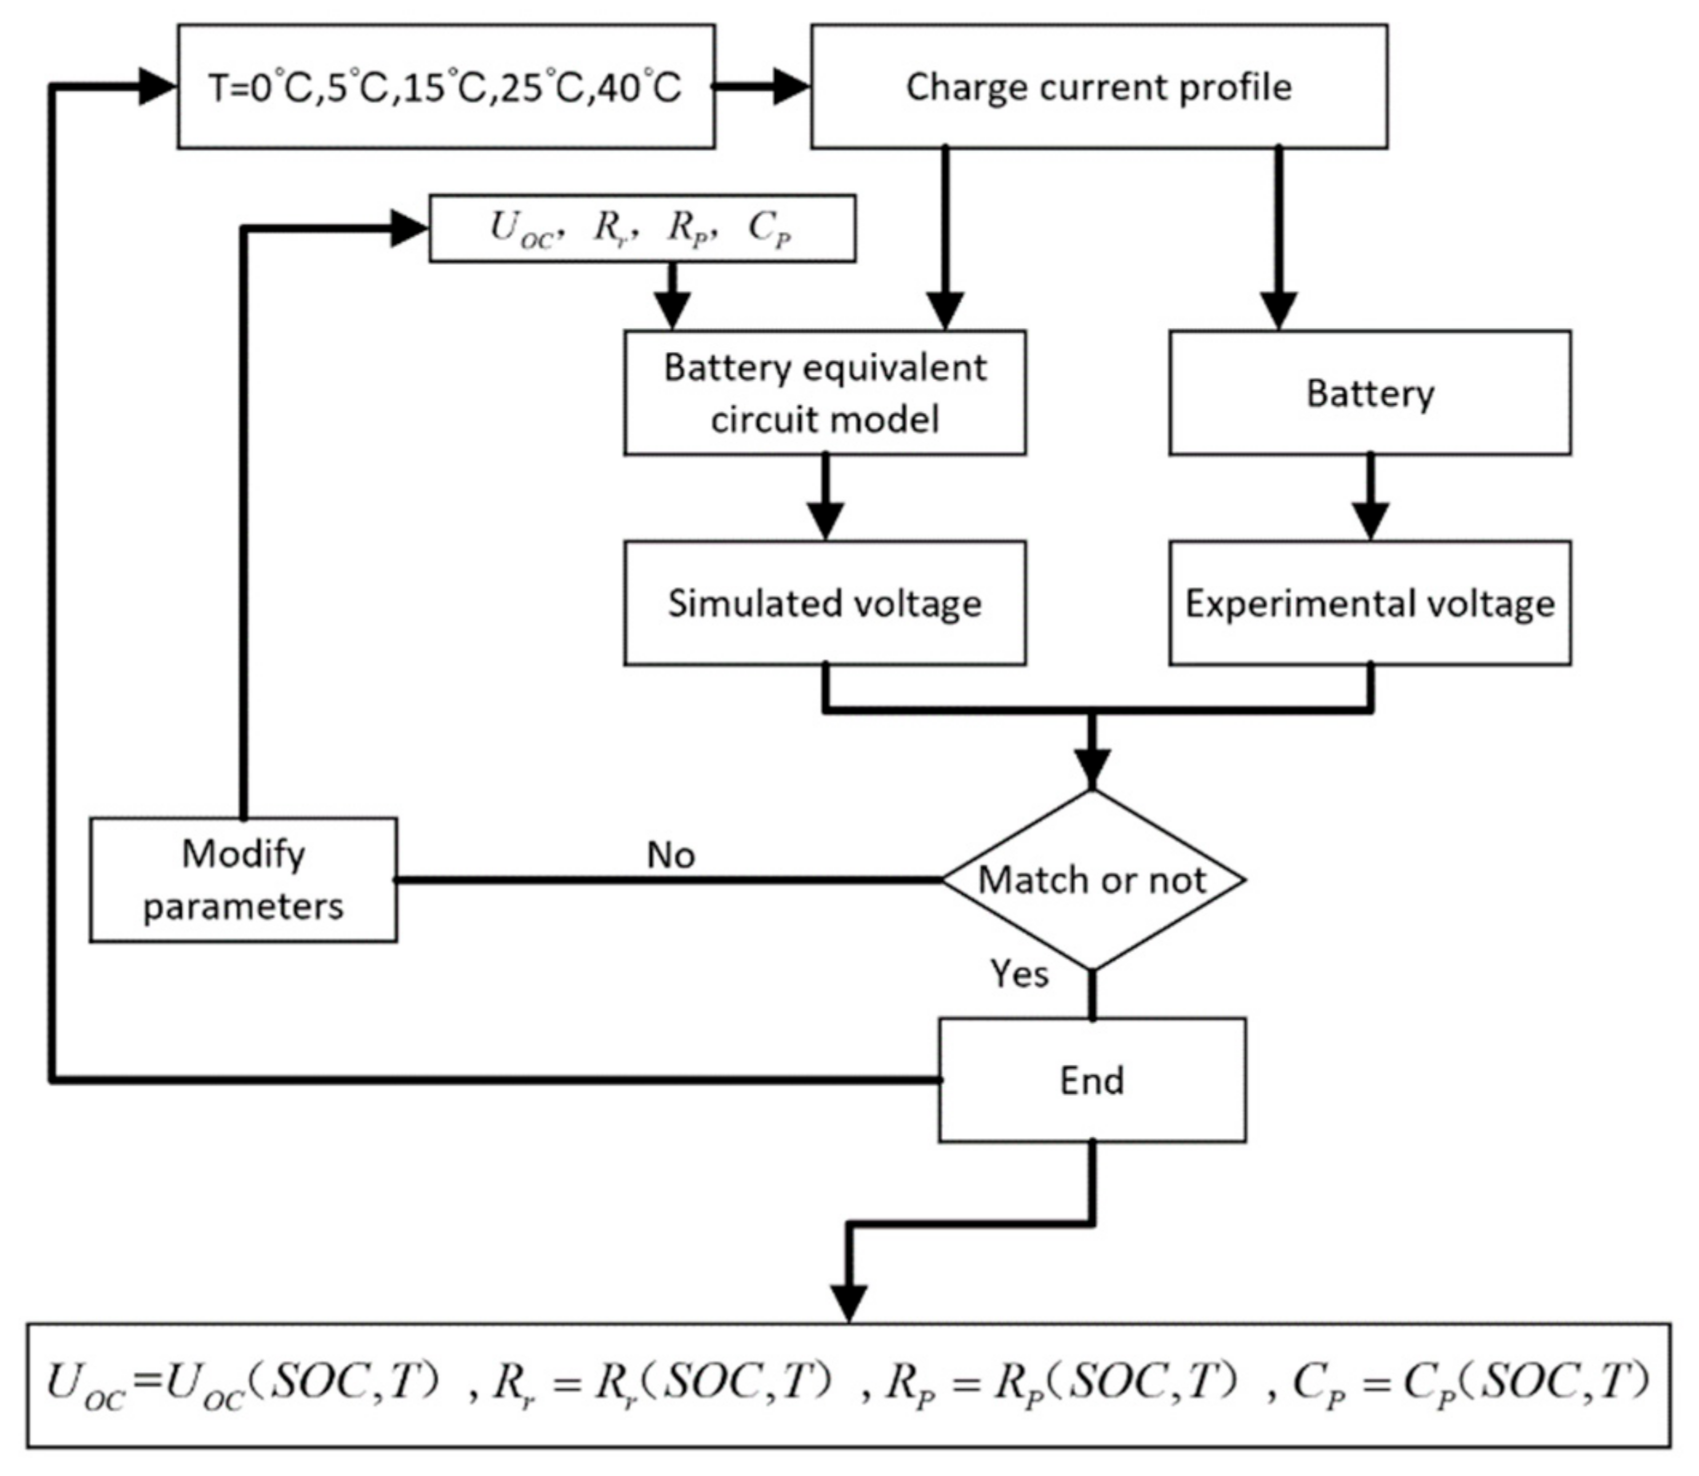
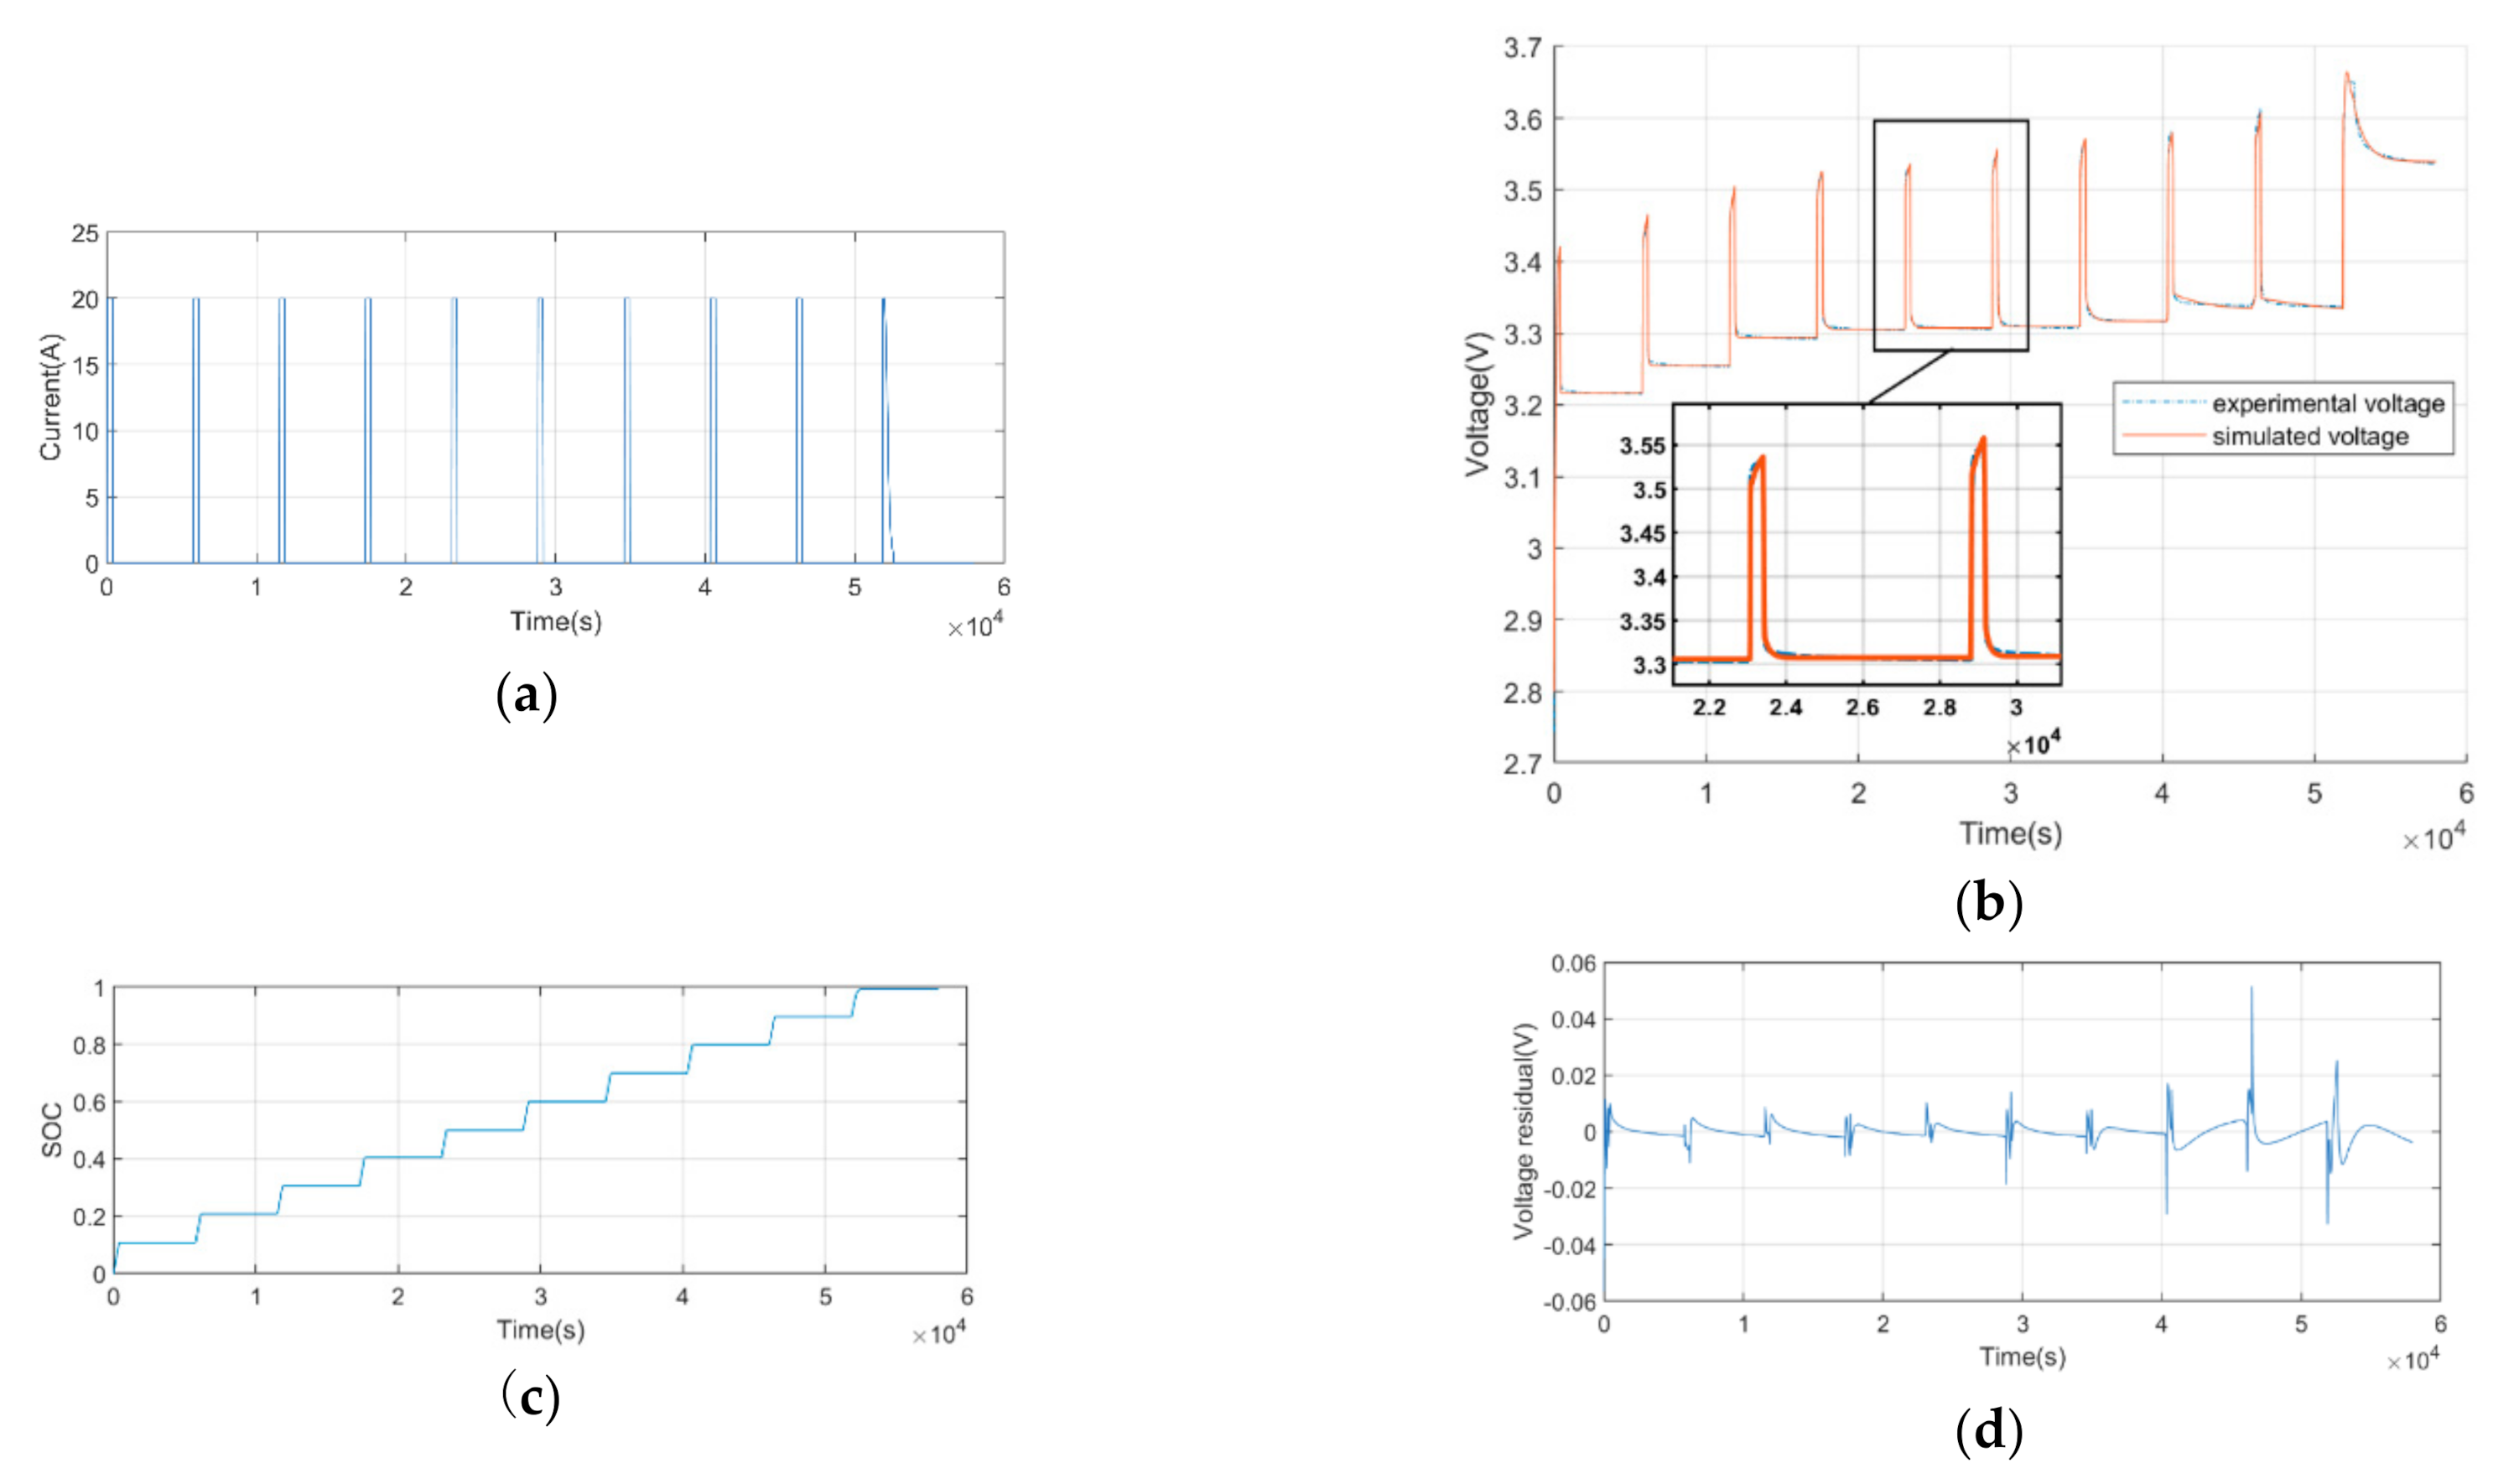
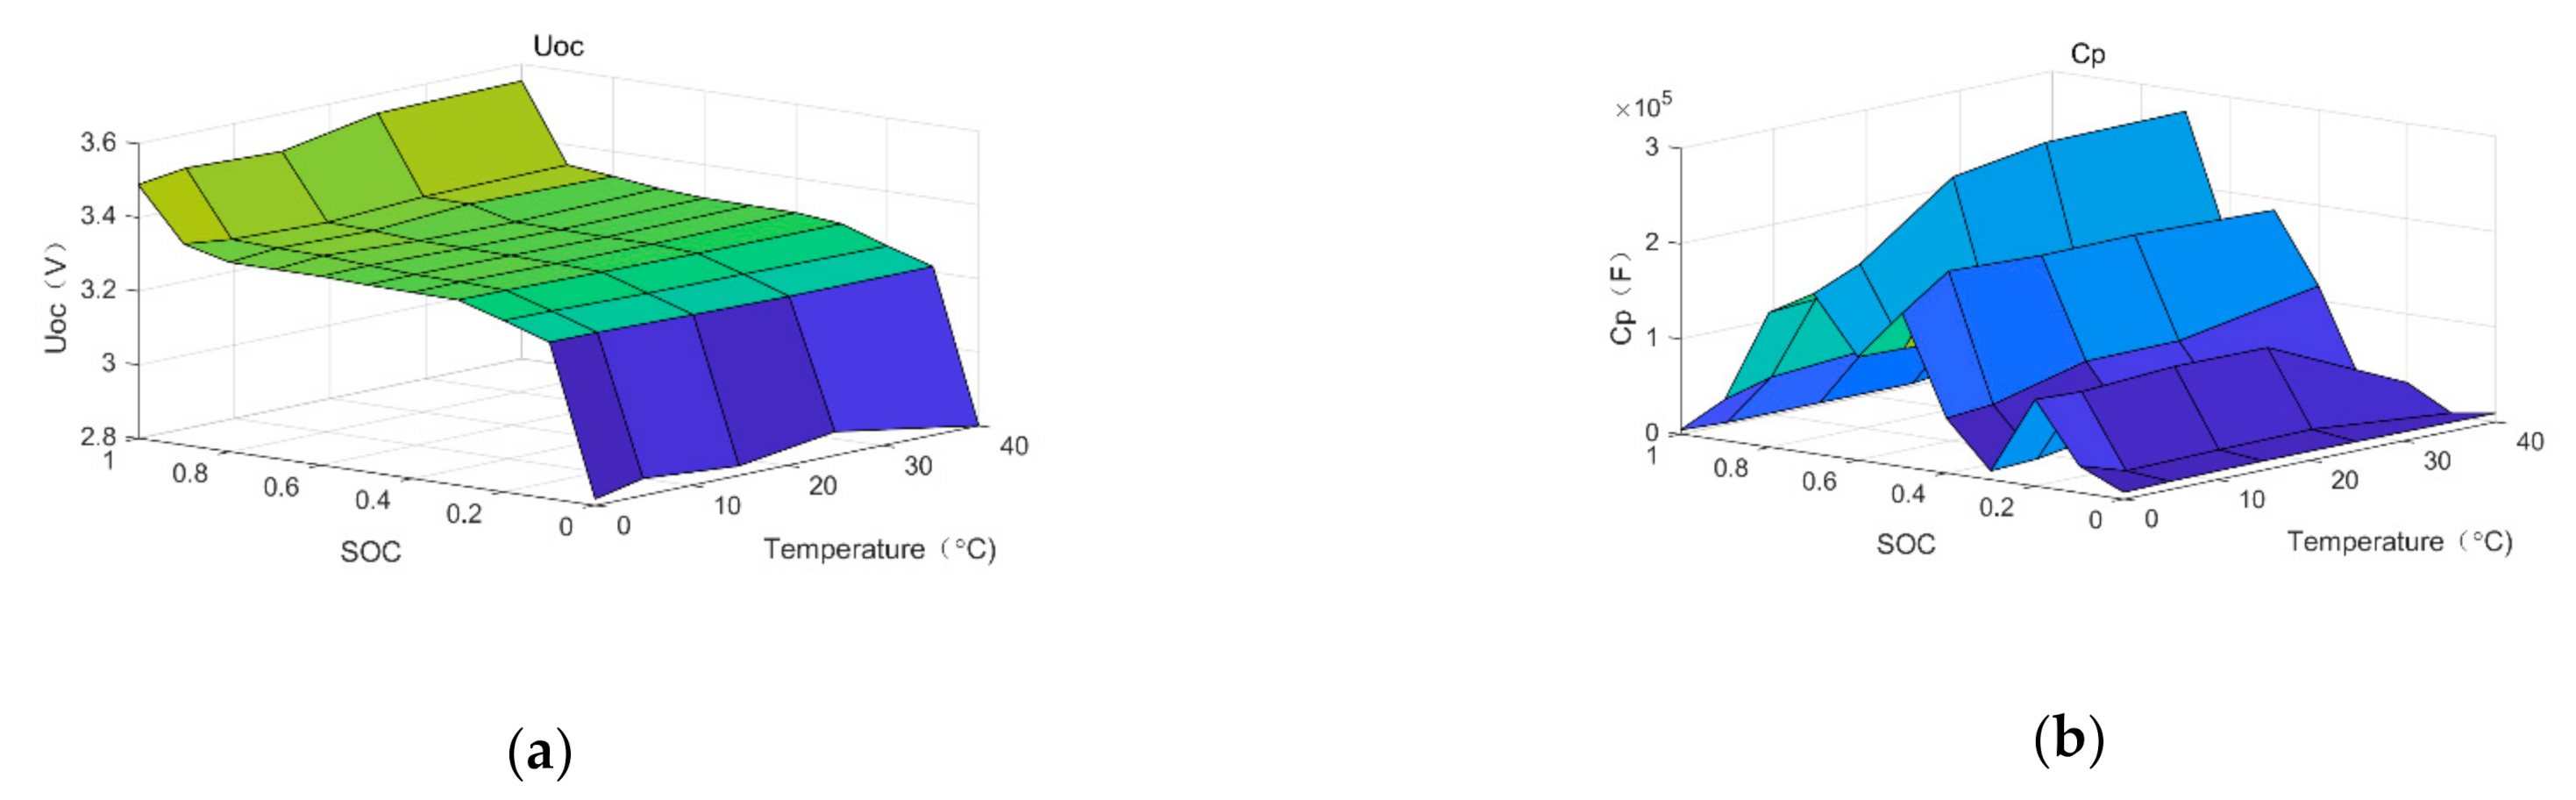
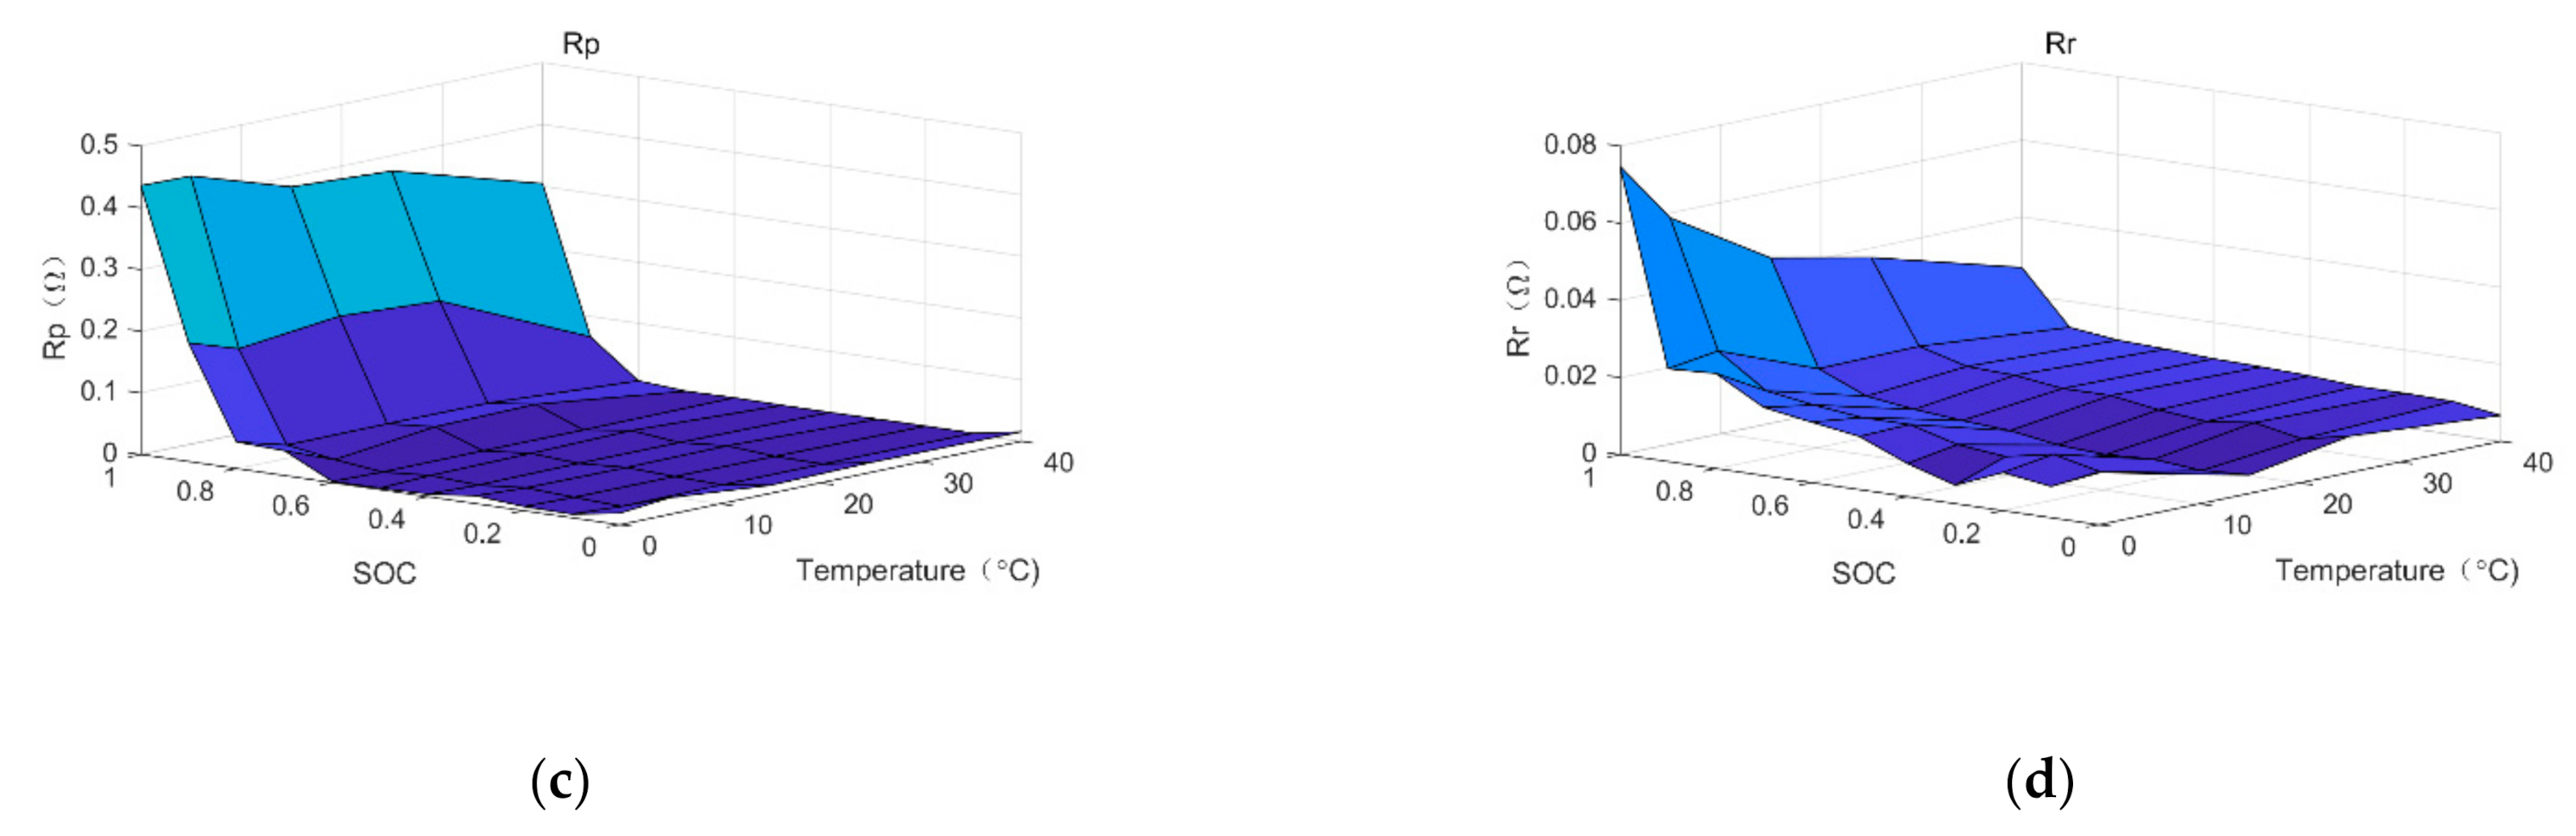
3.2. Model Parameter Estimation

The four parameters in the equivalent circuit diagram, U O C , R r , R P , C P , are all functions of SOC and temperature:
U O C = U O C ( S O C , T ) R r = R r ( S O C , T ) R P = R P ( S O C , T ) C P = C P ( S O C , T )
In this paper, the voltage and current changes of the battery during the charging process were obtained by pulse charging. The battery was emptied at 25 °C, and then the partial charge–rest phase cycle was carried out at five different ambient temperatures (0 °C, 5 °C, 15 °C, 25 °C, 40 °C). At the end of each 1.5 h rest period, the voltage can be regarded as the estimation of OCV, and SOC is calculated by Colombo counting method of current. Then the parameters of ECM are estimated by the algorithm of nonlinear least squares. The parameter estimation steps are shown in Figure 3. It is assumed that the change of cell impedance with current amplitude can be ignored [36].
Figure 4 shows the parameter estimation results when the ambient temperature is 25 °C. Figure 4a,c show that the simulation reproduced the 10 charge pulses and was able to keep track of the increasing in OCV as the battery charged. Figure 4b,d show that the first-order RC equivalent circuit model can simulate the actual performance of the battery accurately. Furthermore, the two-dimensional table of battery parameters can be obtained through nonlinear least squares, as shown in Figure 5.

4. Parameters Selection

The number of charging stages and cut-off voltages are important parameters in charging optimization. In this section we will compare and analyze them in detail and select suitable ones for the final charging strategy decision.

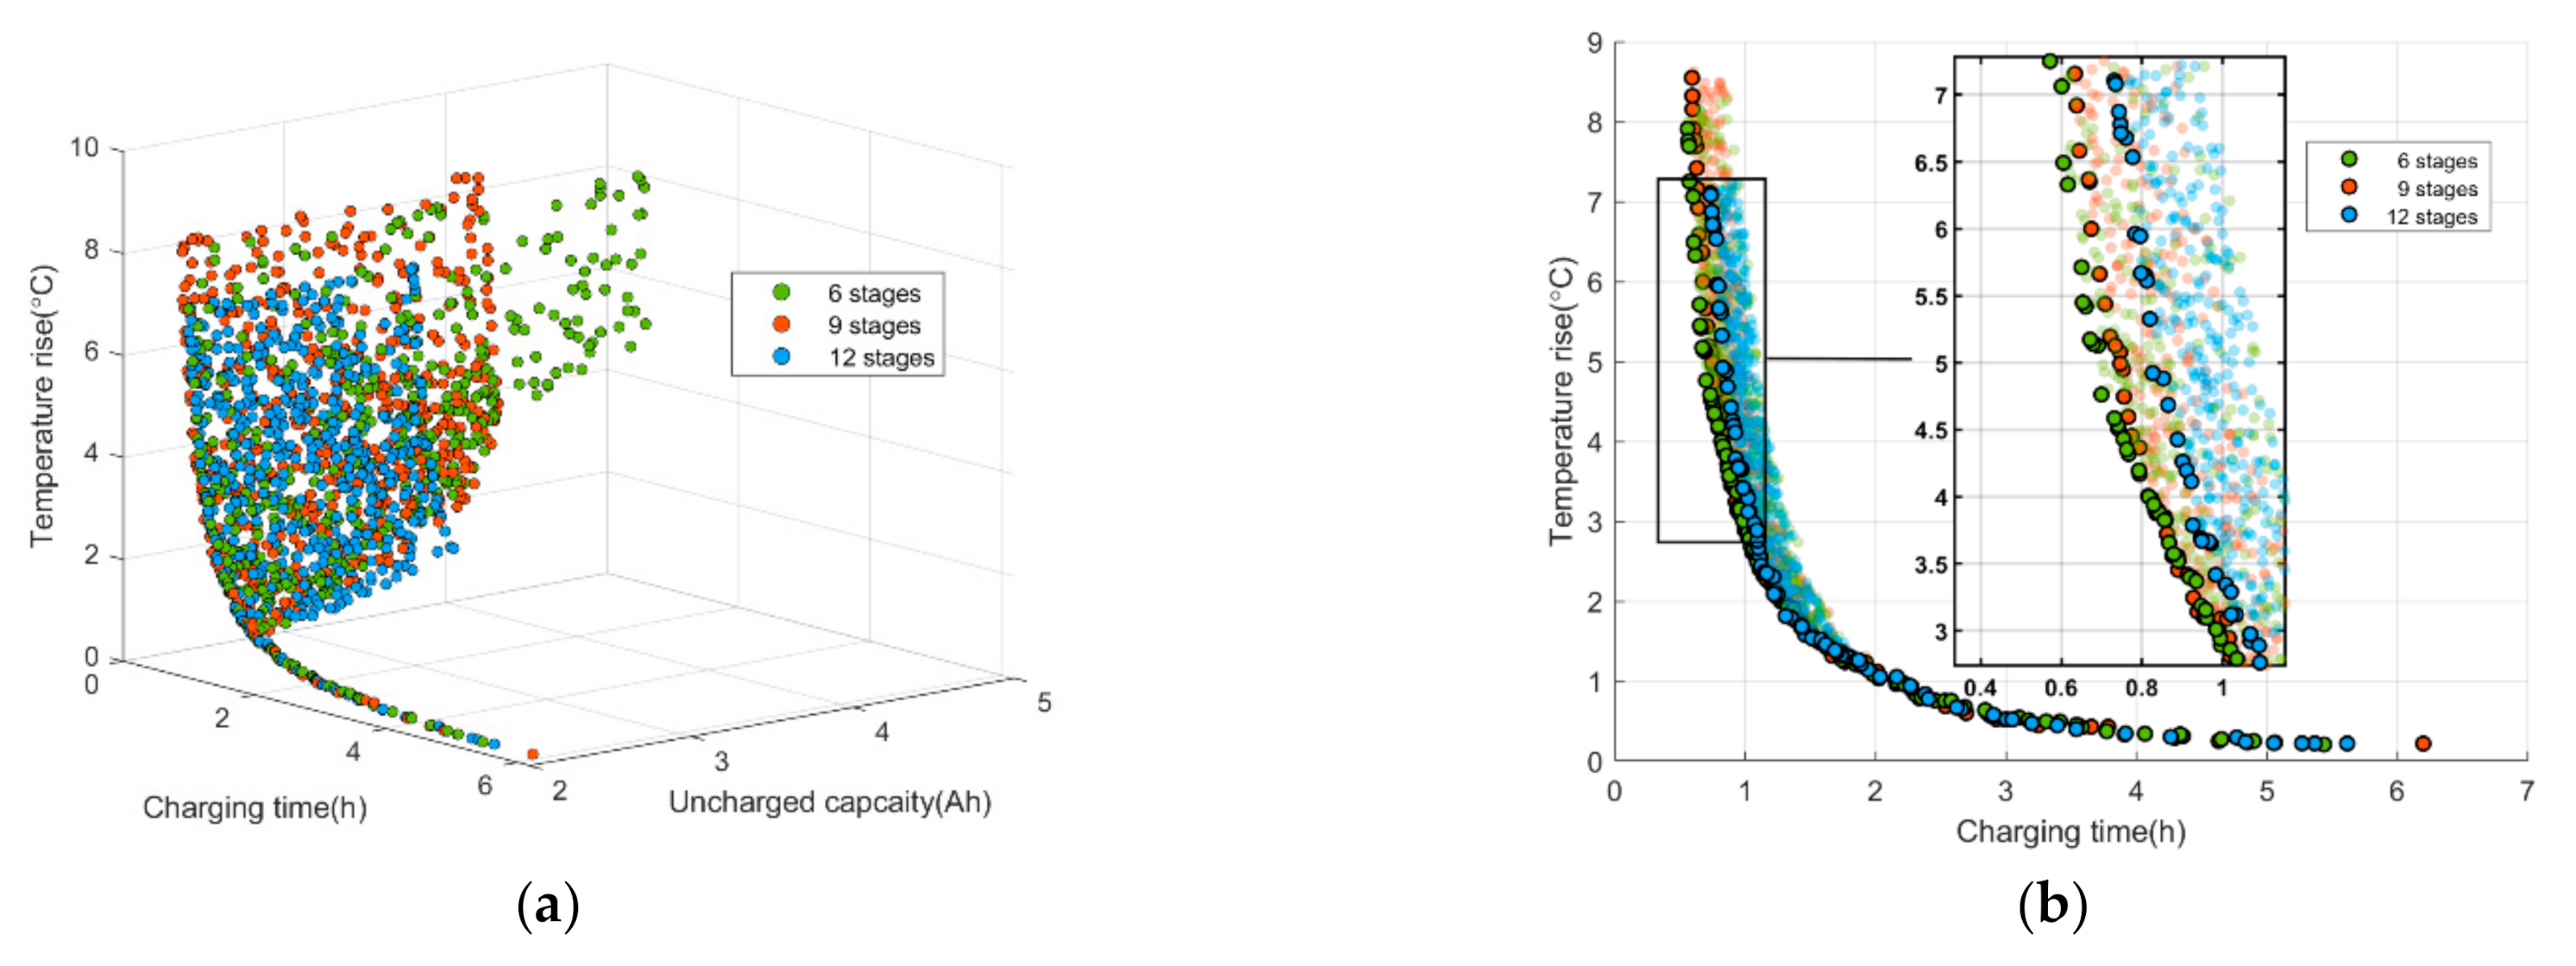
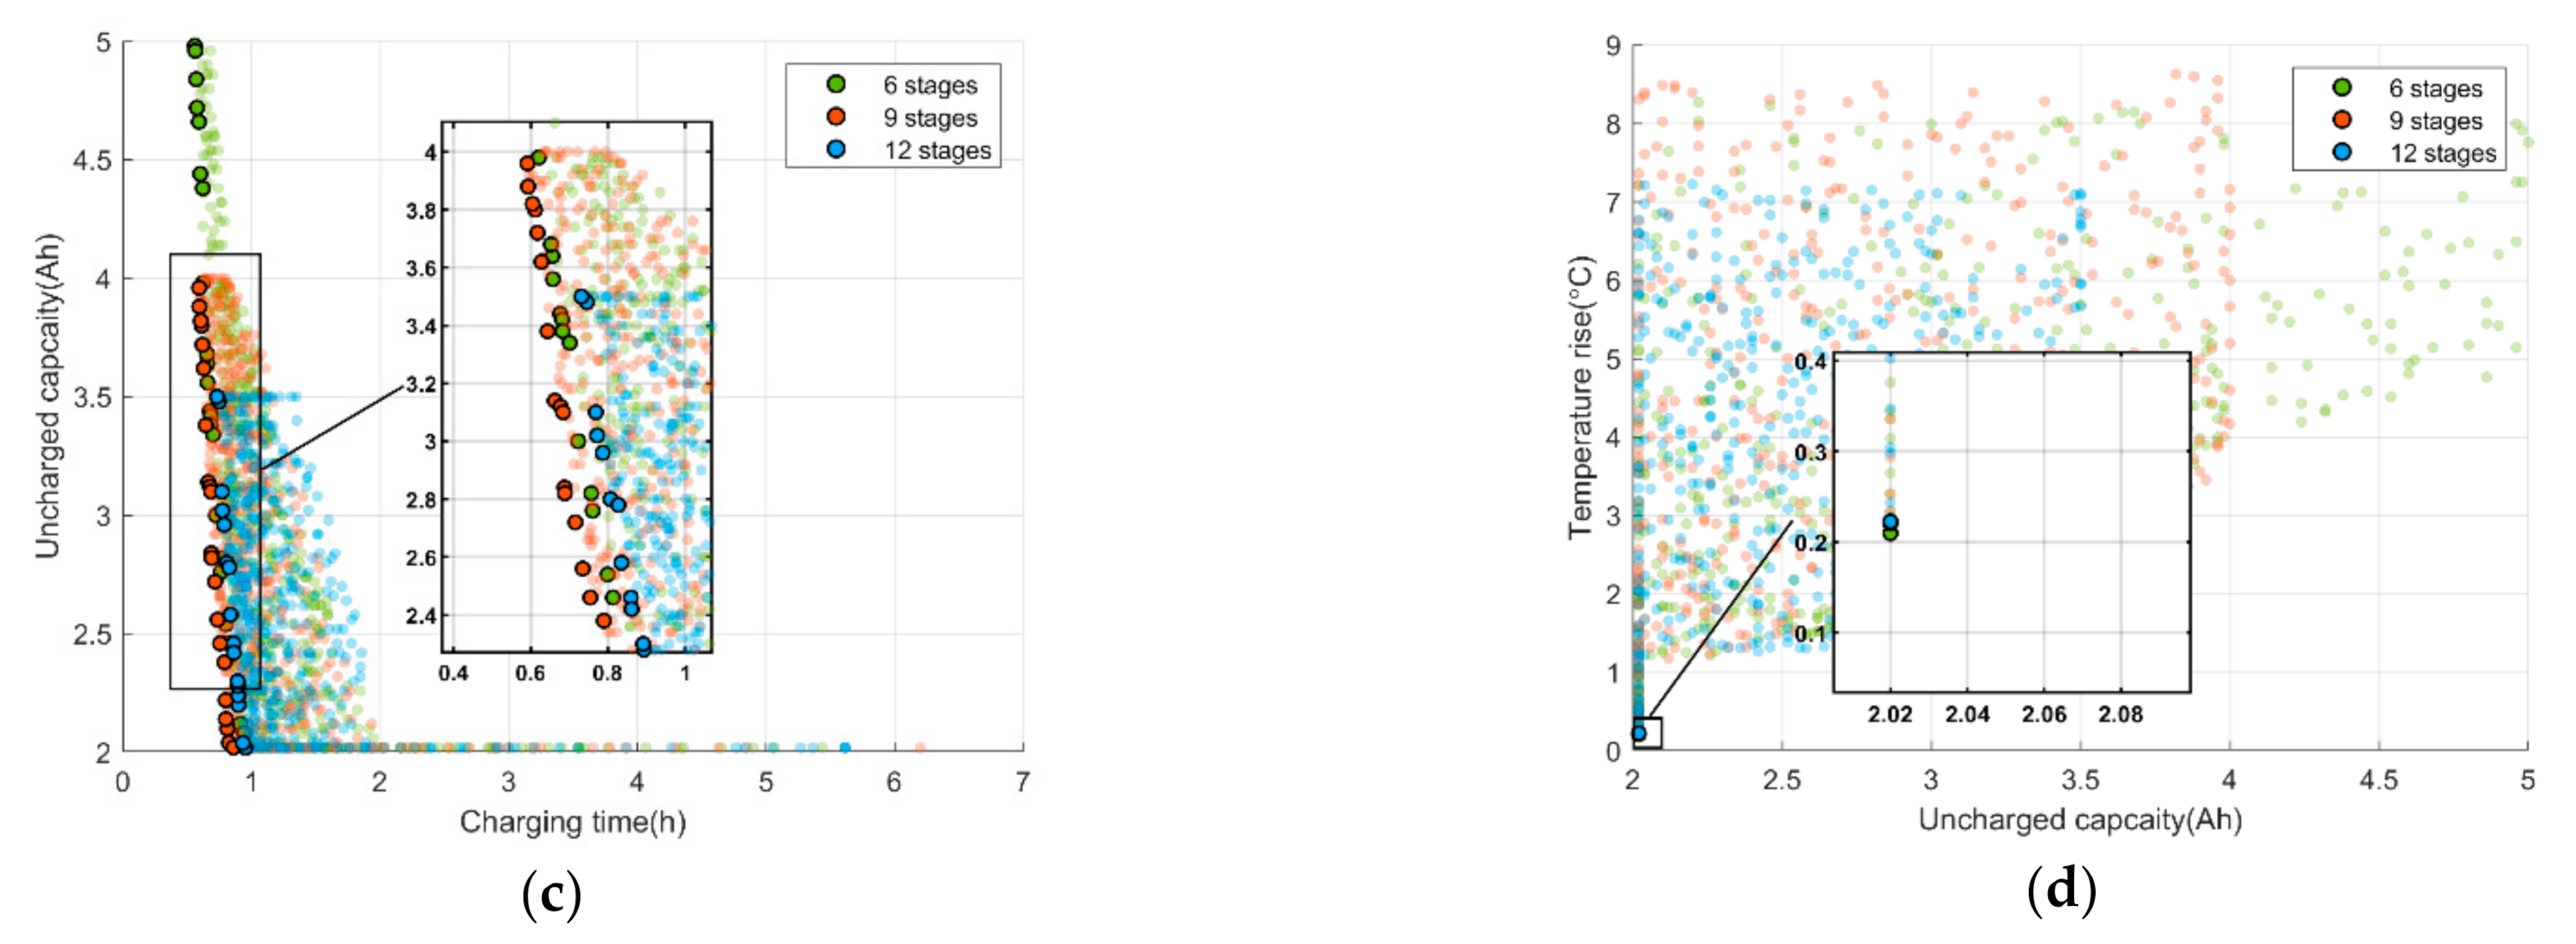
4.1. Charging Stage Numbers

In this section, the effect of the number of charging stages on the charging performance at 25 °C is studied. It is assumed that S O C i n i = 0 % and S O C t a r = 90 % , then the charging interval from S O C i n i to S O C t a r is divided into 6, 9 and 12 stages, respectively. According to N = ( S O C t a r S O C i n i ) / Δ S O C , the corresponding Δ S O C is 15%, 10% and 7.5%, respectively. Figure 6 shows the simulation results of the three different stages.
In Figure 6a, it can be clearly seen that the Pareto solution set consists of many three-dimensional scattered points, and there is no absolute optimal solution that enables the three optimization objectives to reach their minimum values simultaneously. To facilitate the analysis, the three-dimensional point cloud is projected onto the three coordinate planes, respectively, and the optimal Pareto solution in the two-dimensional plane is selected for further study. In Figure 6b,c, it can be seen that there are contradictions between the charging time and the maximum temperature increase, as well as the charging time and the uncharged capacity, which cannot be optimized at the same time. Meanwhile, in Figure 6d, both the uncharged capacity and the temperature increase can reach the optimal value at the same time. In Figure 6b, it can be seen that the temperature increase of stage 6 and stage 9 is similar, but are closer to the origin than stage 12, that is, the maximum temperature increase is lower during the same charging time. It can be seen from Figure 6c that the last stage may not be fully charged. Since the Δ S O C of stage 6 is larger, the maximum uncharged capacity is larger than the others, followed by stage 9, and the smallest is stage 12. At the same time, the Pareto solution of stage 9 is closer to the origin, which means closer to the optimal value, so more capacity is charged during the same charging time. In Figure 6d, there is little difference in capacity performance of the three stages with the best performance, and temperature performance of stages 9 and 12 is slightly better than that of stage 6. Above all, the charging performance of stage 9 and stage 12 is better than that of stage 6, but the charging performance of stage 12 is not significantly improved compared with that of stage 9. At the same time, too many segmentations of charging stages will increase the complexity of calculation and the loss of charging equipment. Therefore, the number of charging segments in this paper is set to nine.

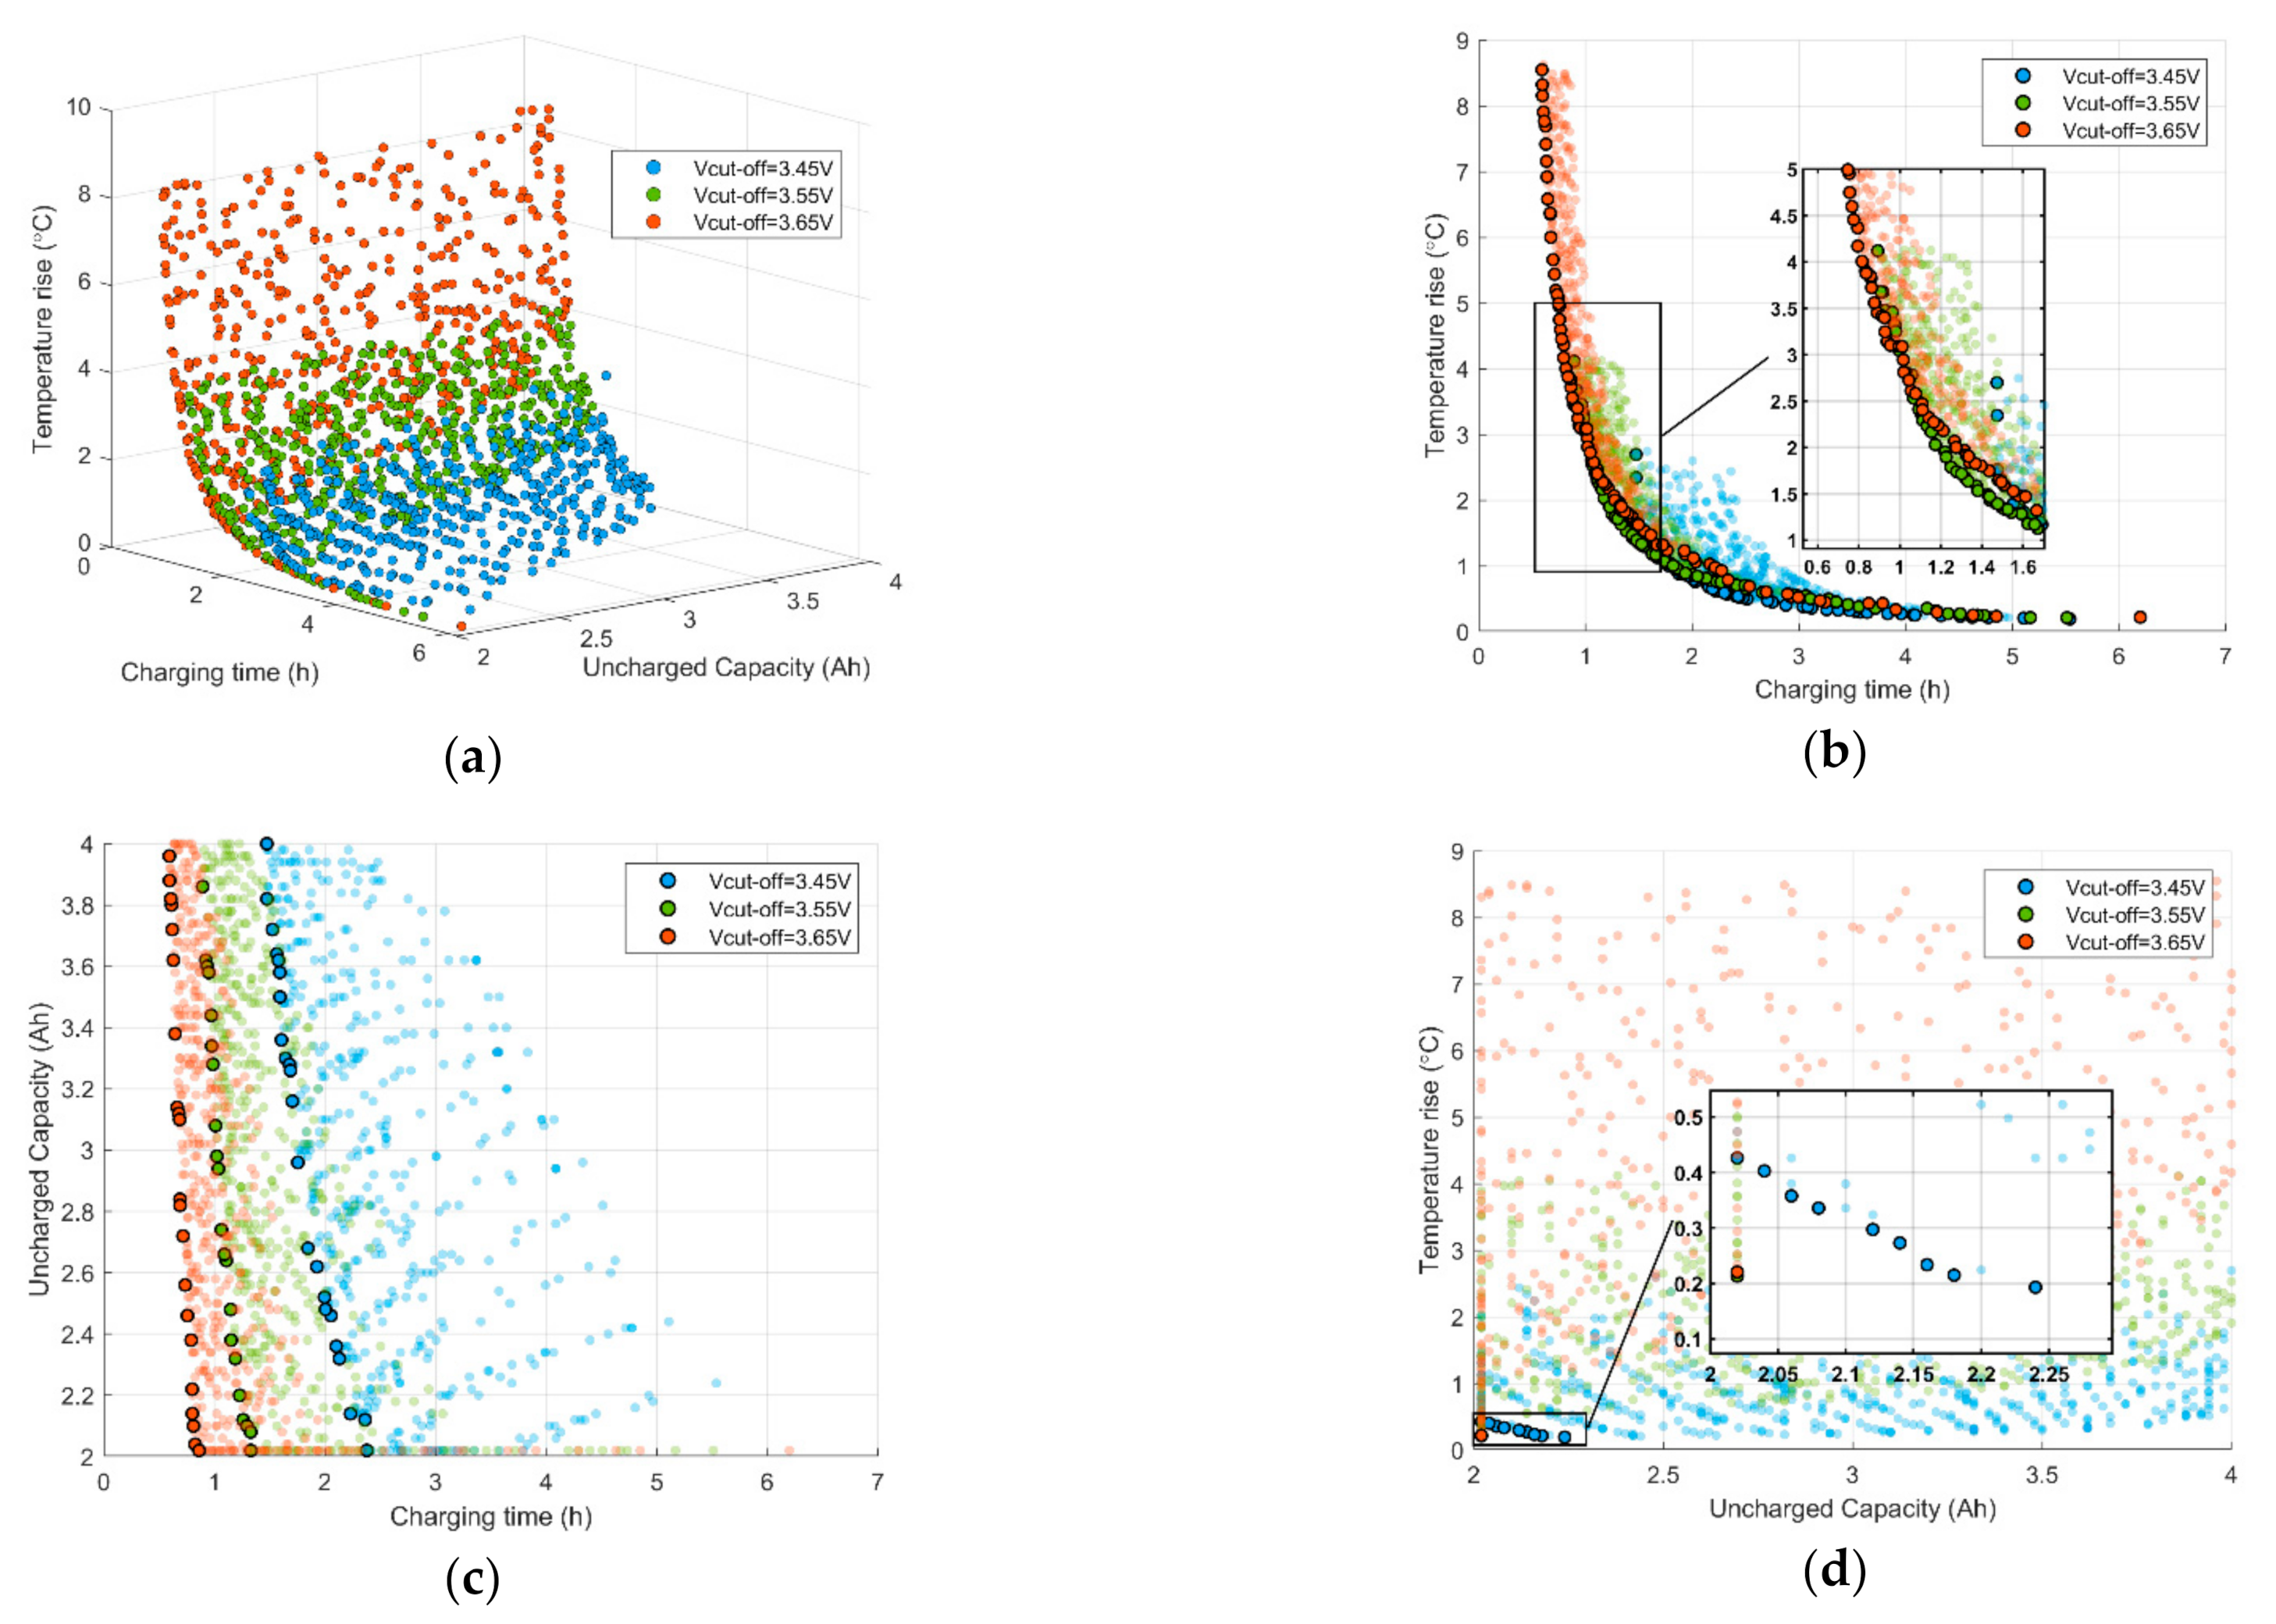
4.2. Cut-Off Voltage

In this section, the influence of cut-off voltage on charging performance is analyzed, and the ambient temperature is set as 25 °C. To charge the battery to capacity of Δ S O C ( N - 1 ) at least, the cut-off voltage needs to be higher than the battery open circuit voltage at the beginning of charging stage N. Therefore, the lowest candidate cut-off voltage is set as 3.45 V, the highest candidate cut-off voltage is 3.65 V recommended by the battery manufacturer, and the middle candidate cut-off voltage is 3.55 V.
Figure 7a shows a scatter cloud of Pareto sets of the three optimization objectives. It can be seen that the temperature increase distribution of 3.65 V charging cut-off voltage is higher, and its Pareto set can provide a shorter charging time. This can be seen more clearly in Figure 7b. The temperature increase of the corresponding Pareto sets of the three cut-off voltages during the same charging time is almost the same. With increasing cut-off voltage, the shortest charging time can be further decreased, because higher cut-off voltage can provide greater charging current. It can be seen from Figure 7c that the Pareto set of 3.65 V cut-off voltage is closer to the origin than that of 3.55 V and 3.45 V, and the charging time is significantly shortened under the same uncharged capacity. In Figure 7d, the cut-off voltages of 3.65 V and 3.55 V are similar in capacity and temperature increase, and much better than 3.45 V. Based on the above analysis, this paper selects the 3.65 V charging cut-off voltage recommended by the battery manufacturer.

5. Results and Discussion

For EV users, in most cases, the charging demand is divided into fast charging and normal charging. When the charging time is sufficient and the charging position is abundant, the normal charging can charge battery to the target power in relatively long time, which can well meet the needs of users. At this time, there is no need for the thermal management system to intervene, so the energy consumption of the charging system can be reduced. Meanwhile, in scenarios requiring high charging speed, such as highway charging stations, fast charging can be achieved by increasing the charging current, sacrificing part of the charging capacity. However, the large amount of heat generated will require a thermal management system to dissipate it in a timely fashion, which will also inevitably increase the energy consumption of the charging system.
Within the safe range, the higher the temperature, the higher the capacity that can be discharged [37]. Therefore, in the charging process, we hope that when the ambient temperature is low, the battery temperature can be increased to the most appropriate range through its internal resistance heat generation, so as to improve the capacity that can be discharged in the subsequent usage. However, when the ambient temperature is high, the battery is prone to accumulate heat, which may lead to the decrease of battery life and even the risk of thermal runaway. In this situation, it is necessary to reduce the charging current or activate thermal management.
In this paper, we will choose the optimal charging solution from the Pareto sets by adjusting the weighting factors ratio of the three optimization objectives, according to different charging demand and ambient temperatures. Therefore, it is necessary to discuss the influence of weight factors and ambient temperatures on the charging performance in detail, as follows.

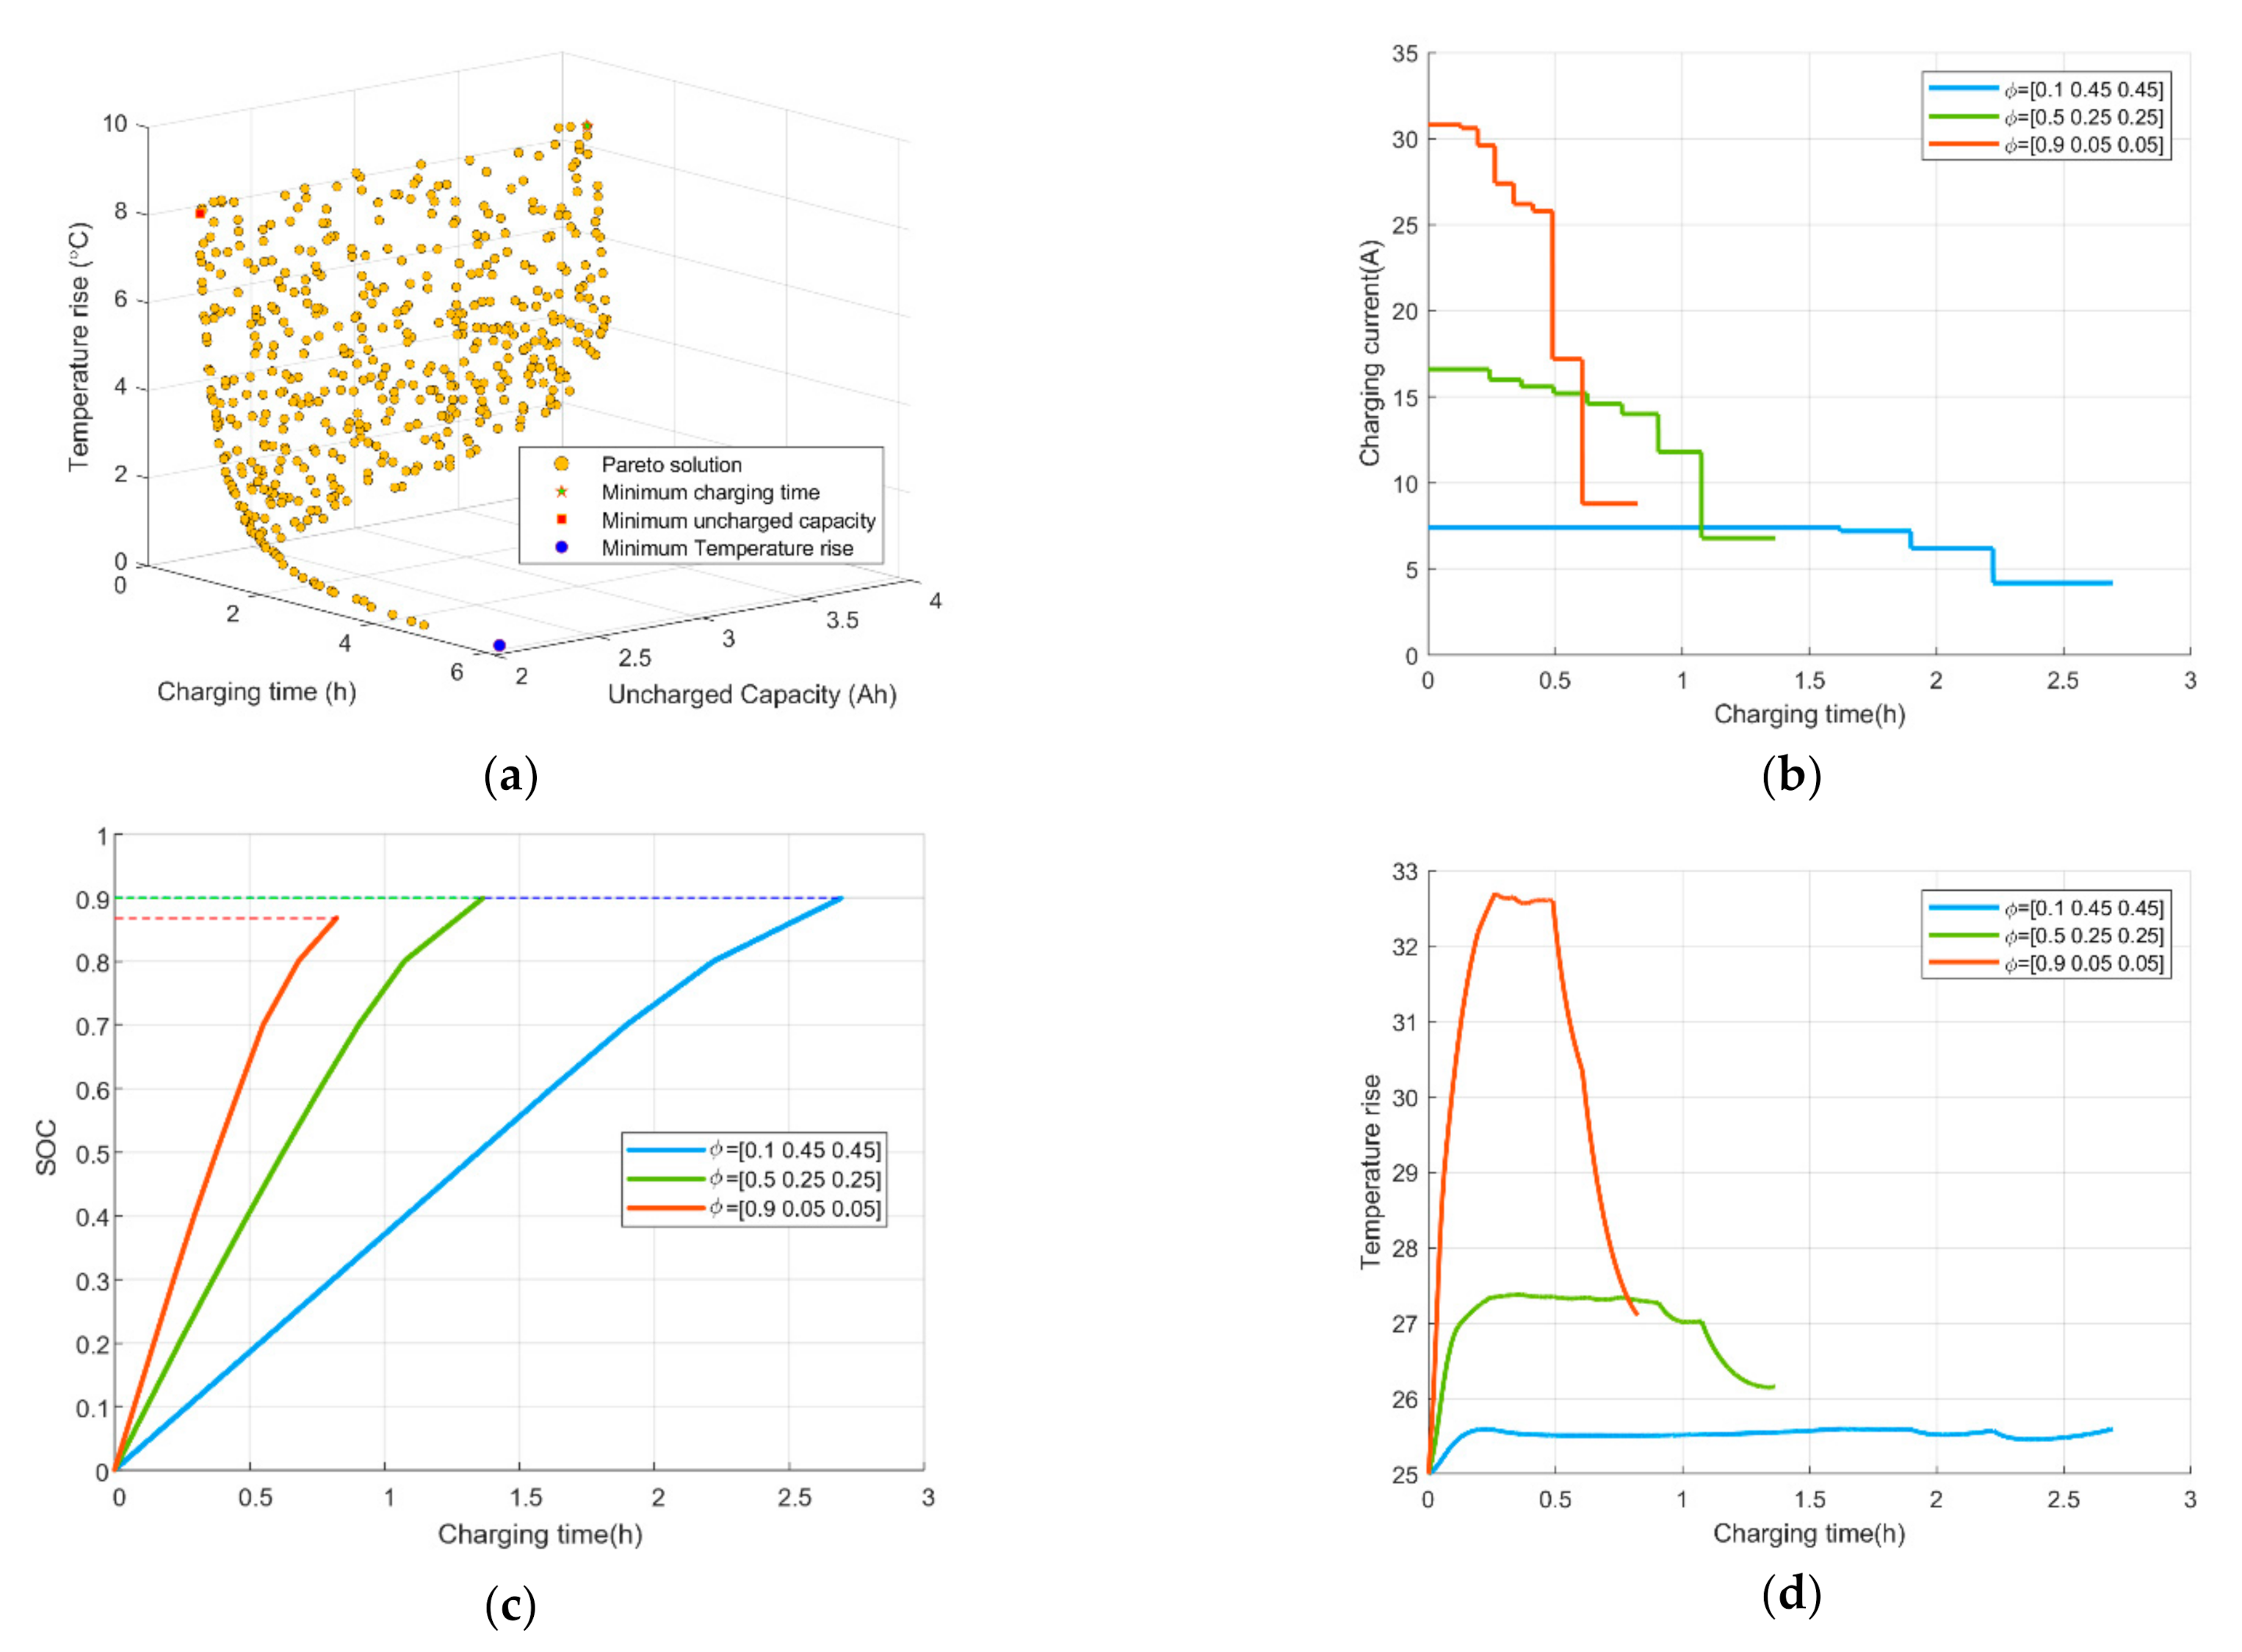
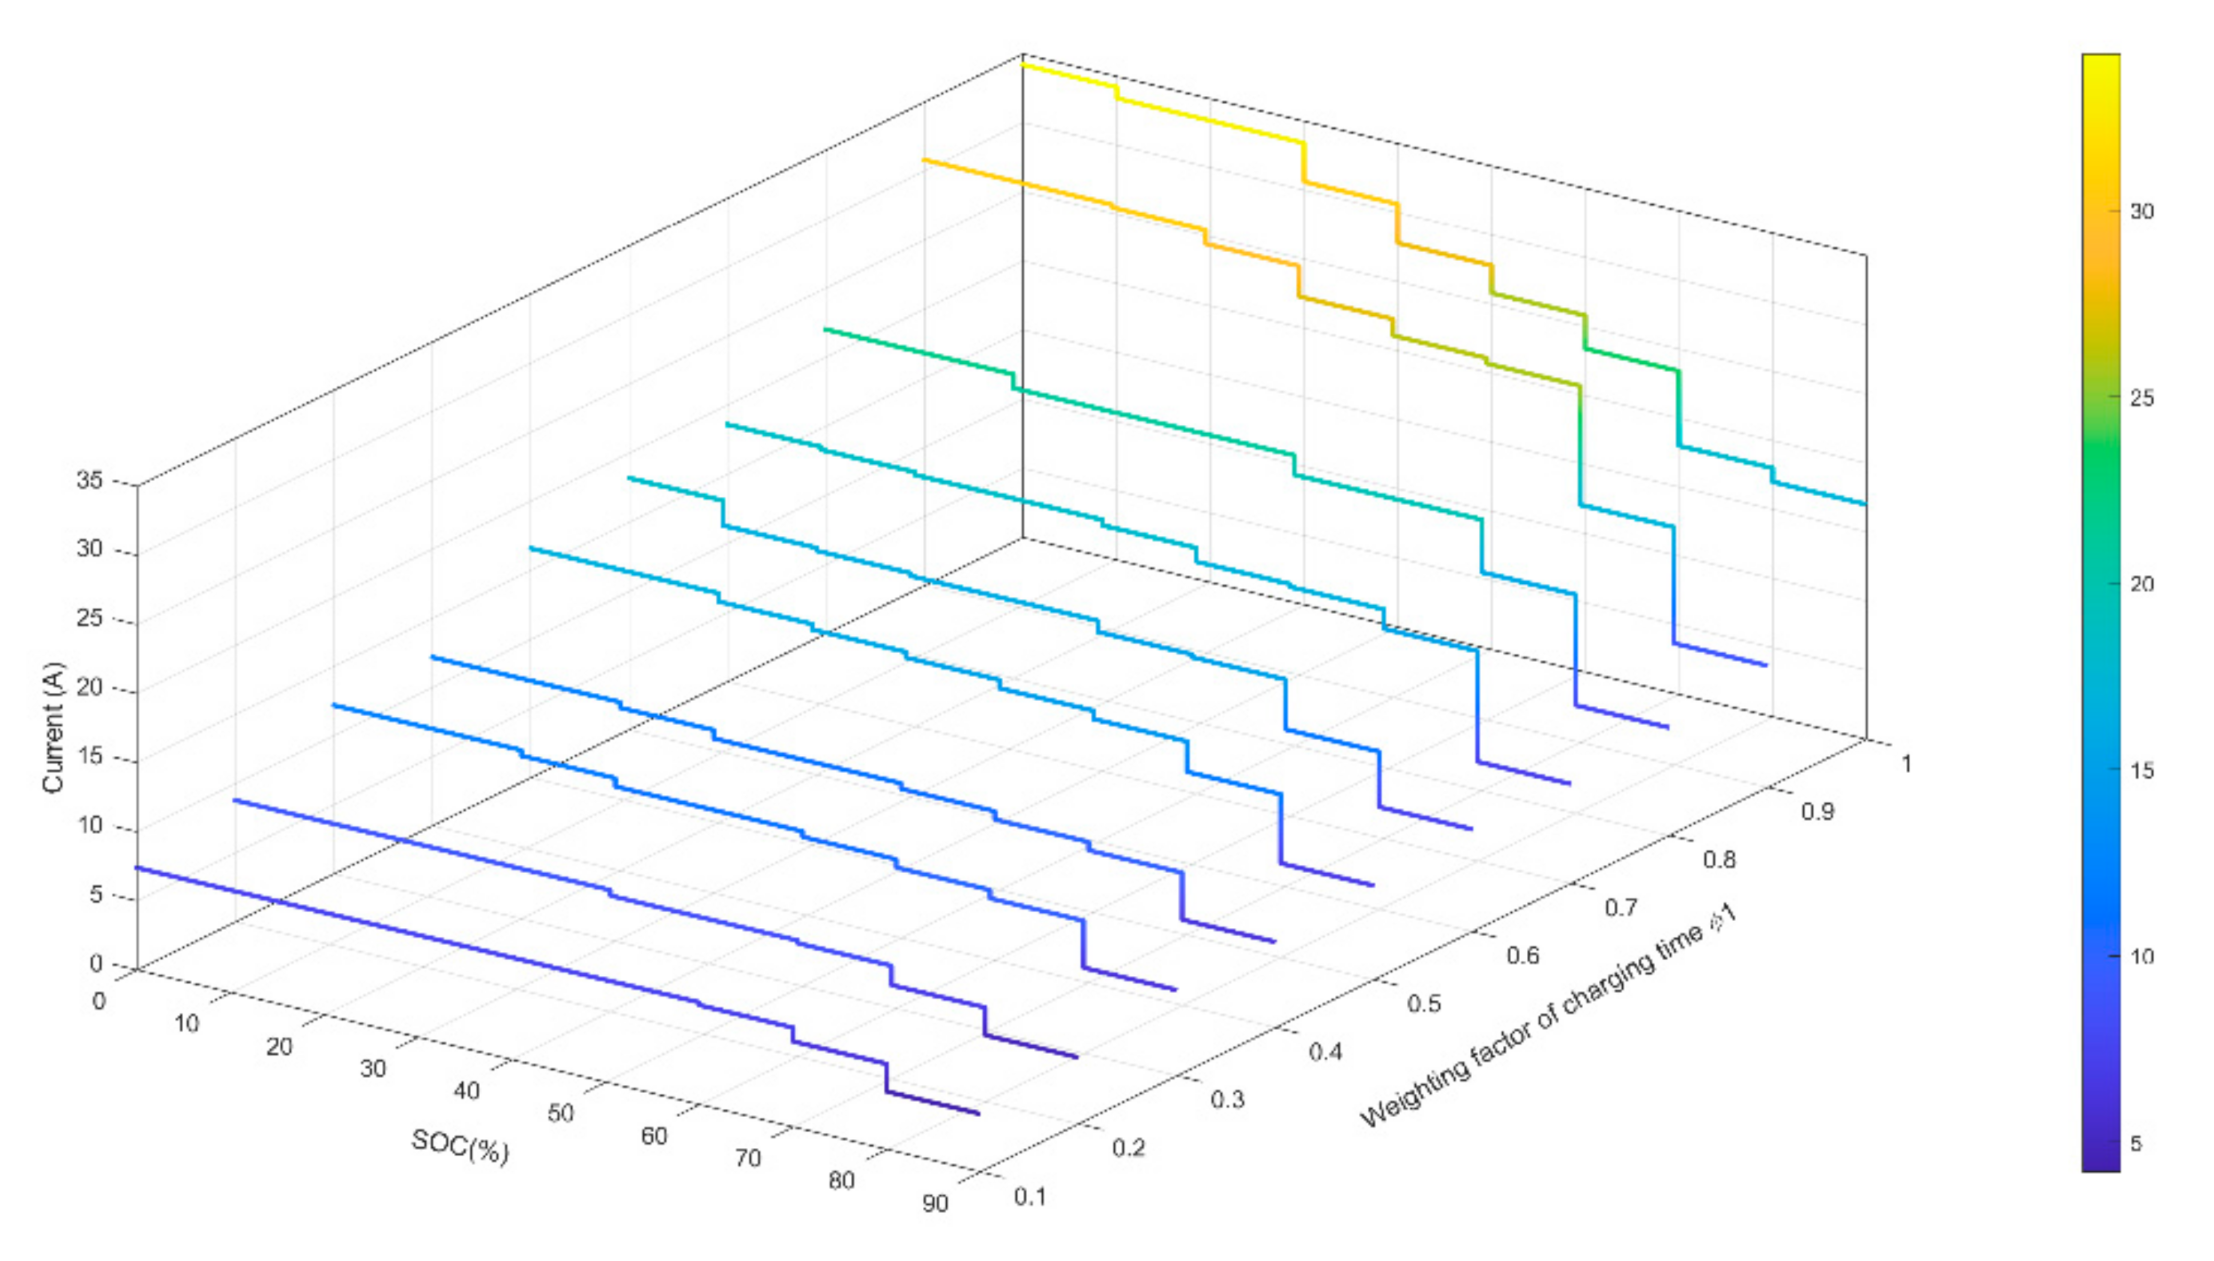
5.1. Effect of Weight Factors

This section will analyze the influence of weight factor on charging performance, and the ambient temperature is 25 °C. The results of charging optimization based on 3.65 V and nine charging stages are shown in Figure 8. It can be seen that the fastest charging time is 0.592 h (“★” mark point), the corresponding uncharged capacity is 3.96 Ah, and the temperature increase is 8.55 °C. The minimum uncharged capacity is 2.02 Ah, the corresponding temperature increase is 8.3 °C (“■” mark point). The minimum temperature increase is 0.22 °C (“●” mark point).
Figure 8a shows the overall Pareto solution sets of nine-stage charging strategies. In the daily use of EVs, according to the users’ different needs, an optimal solution under the specific requirements can be dertermined. To reflect the specific requirements in the selection of Pareto solution, this paper uses the method of weight metric factor. Since the charging time is an objective that users usually pay more attention to, the weight factor of charging time φ 1 is set from 0.1 to 1 to study the effect, and the interval is 0.1. The weight factors of uncharged capacity φ 2 and temperature increase φ 3 are set to be equal, and can be obtained using Equation (34).
Figure 9 shows the charging current curves of φ 1 from 0.1 to 1, respectively. It can be seen that the larger the weight factor of charging time, the larger the charging current is in each stage, especially in the stage with lower SOC, because higher φ 1 means higher requirements for charging time and the charging strategy will focus on reducing the charging time, and vice versa. To further analyze the performance of temperature increase and uncharged capacity, we choose the cases of φ 1 = 0.1, 0.5 and 0.9 for detailed study. Figure 8b shows the charging current curves of these three conditions, corresponding to Figure 9, which can provide reference for temperature increase and SOC change. Figure 8c shows the change of SOC during charging. When φ 2 is increased, more weight is given to the uncharged capacity, so the final SOC is also increased. It should be noted that as φ 2 is increased, SOC does not increase all the time since it has reached the preset value. Figure 8d shows the change of the battery temperature with the charging time. It can be seen that the temperature increase increases when φ 1 increases. The reason for this is that charging time is shortened by increasing the charging current, and the large current corresponds to a higher temperature increase. When the current gradually decreases with increasing SOC, the battery temperature also decreases, closer to the ambient temperature, because the rate of heat generation of the battery is less than the rate of heat dissipation.

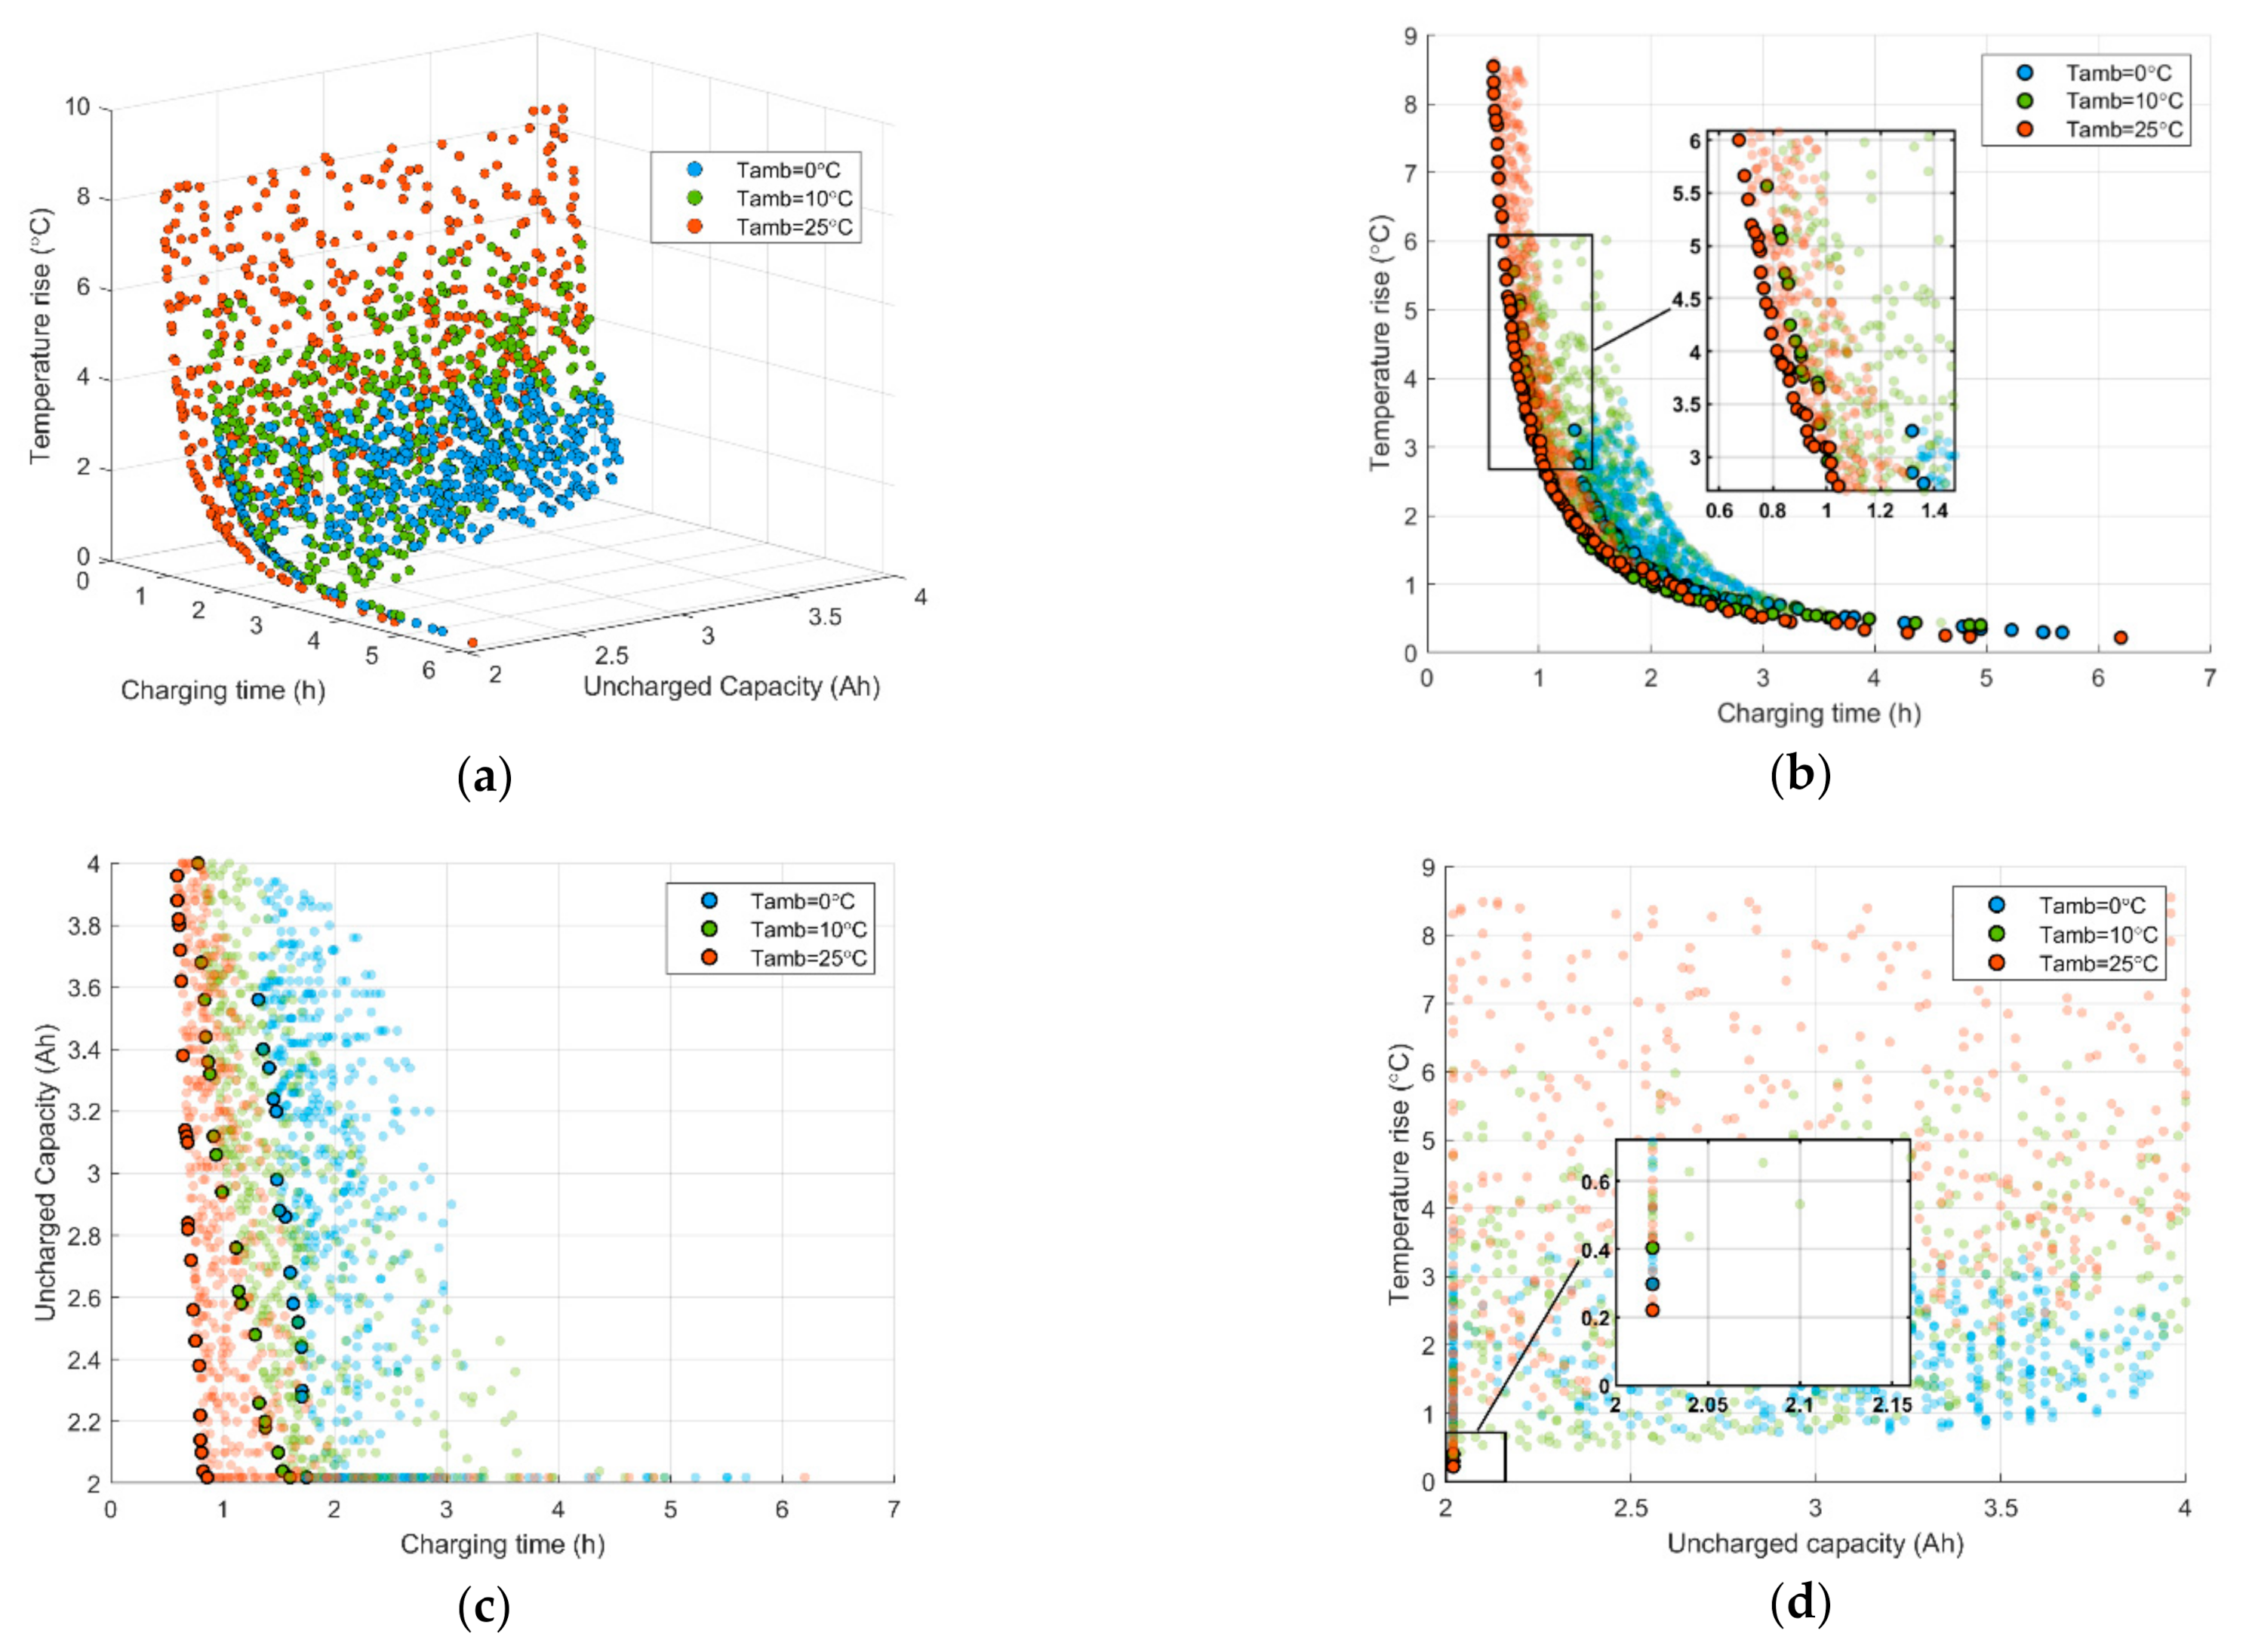
5.2. Effect of Ambient Temperatures

Based on the parameters decided previously, this section will discuss the influence of different ambient temperatures on charging performance. The ambient temperature was set as T a m b = 0 °C, 10 °C and 25 °C, respectively. According to the constraints, the maximum charging current at each ambient temperature is I c h a r max = 0.8 C, 1.5 C and 2 C, respectively. Figure 10a presents the simulation results at different ambient temperatures. It can be seen that the distribution of Pareto solution at different temperatures is quite different. Higher ambient temperature leads to a higher overall temperature increase distribution. Figure 10b clearly shows the relationship between temperature increase and time. Higher ambient temperature will allow greater maximum charging current, resulting in a higher temperature increase. However, at the same charging time, the temperature increase in the low temperature environment is higher, because the internal resistance of the battery becomes larger at low temperature, so that the same current will generate more heat. In Figure 10c, the higher the ambient temperature is, the closer the Pareto solution set is to the origin, and the same uncharged capacity corresponds to shorter charging time. The overall analysis shows that higher temperature can achieve a better optimization in the three optimization objectives, but the temperature should be limited in the safe range.

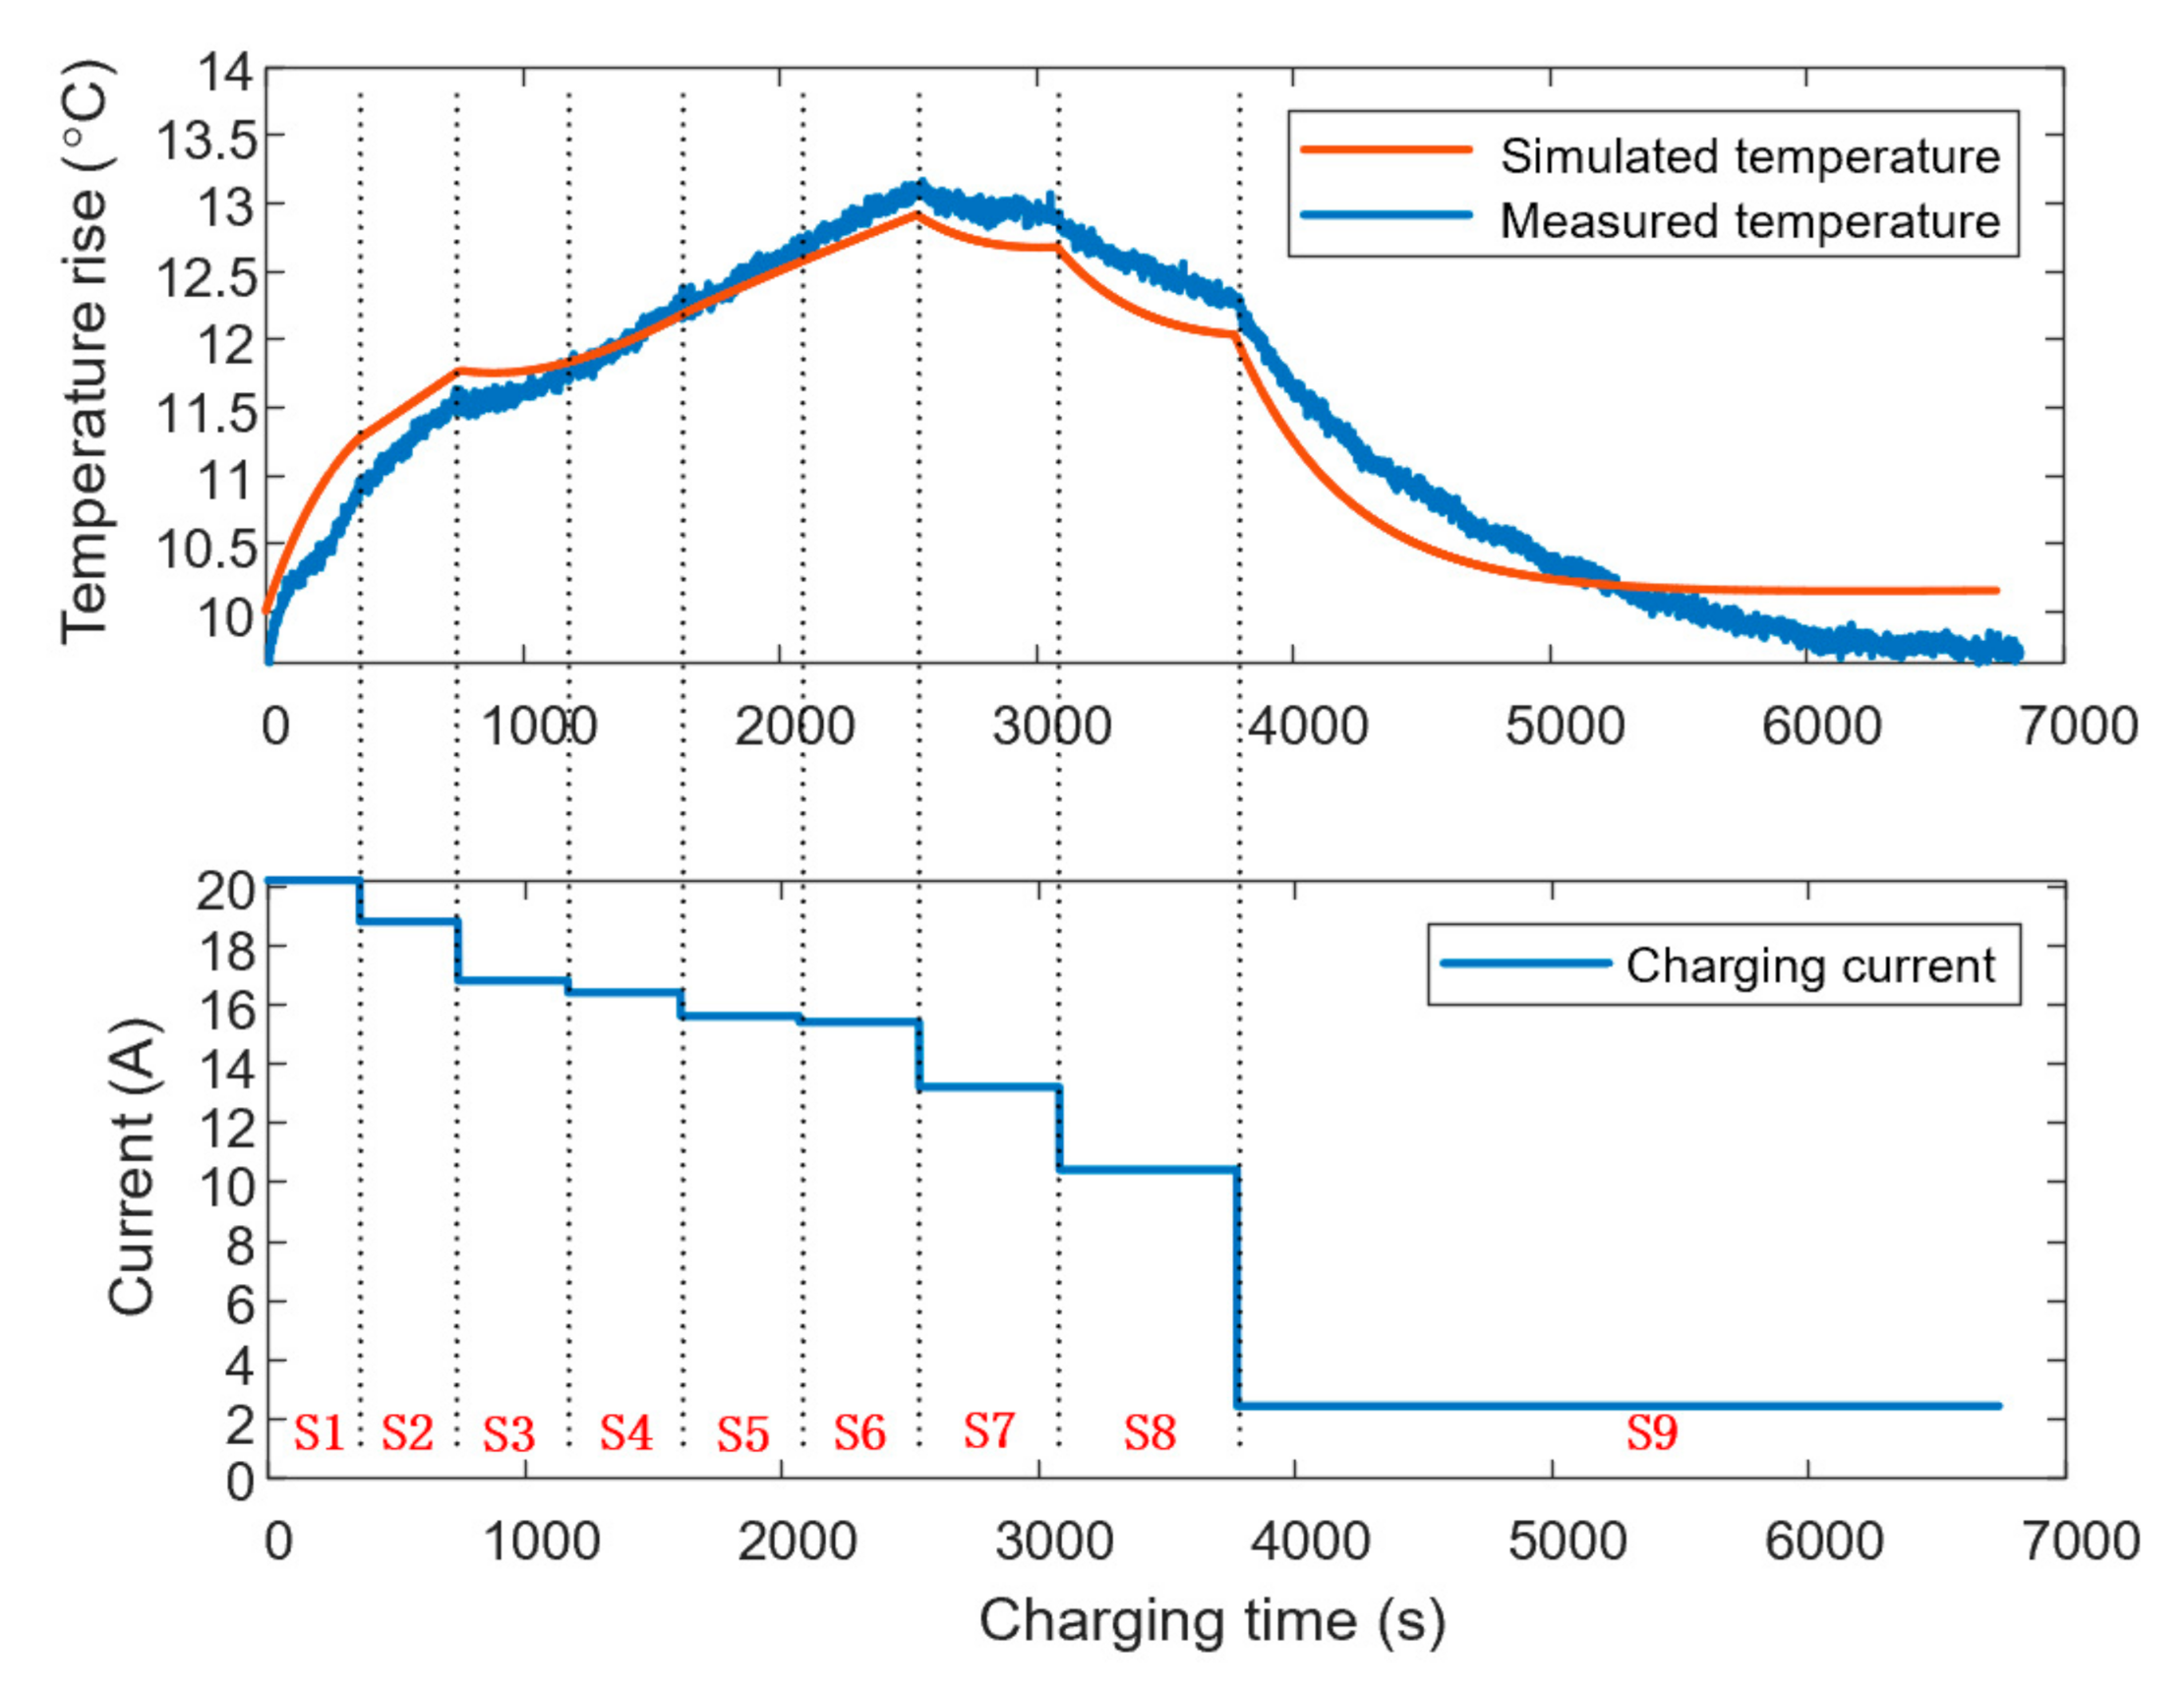
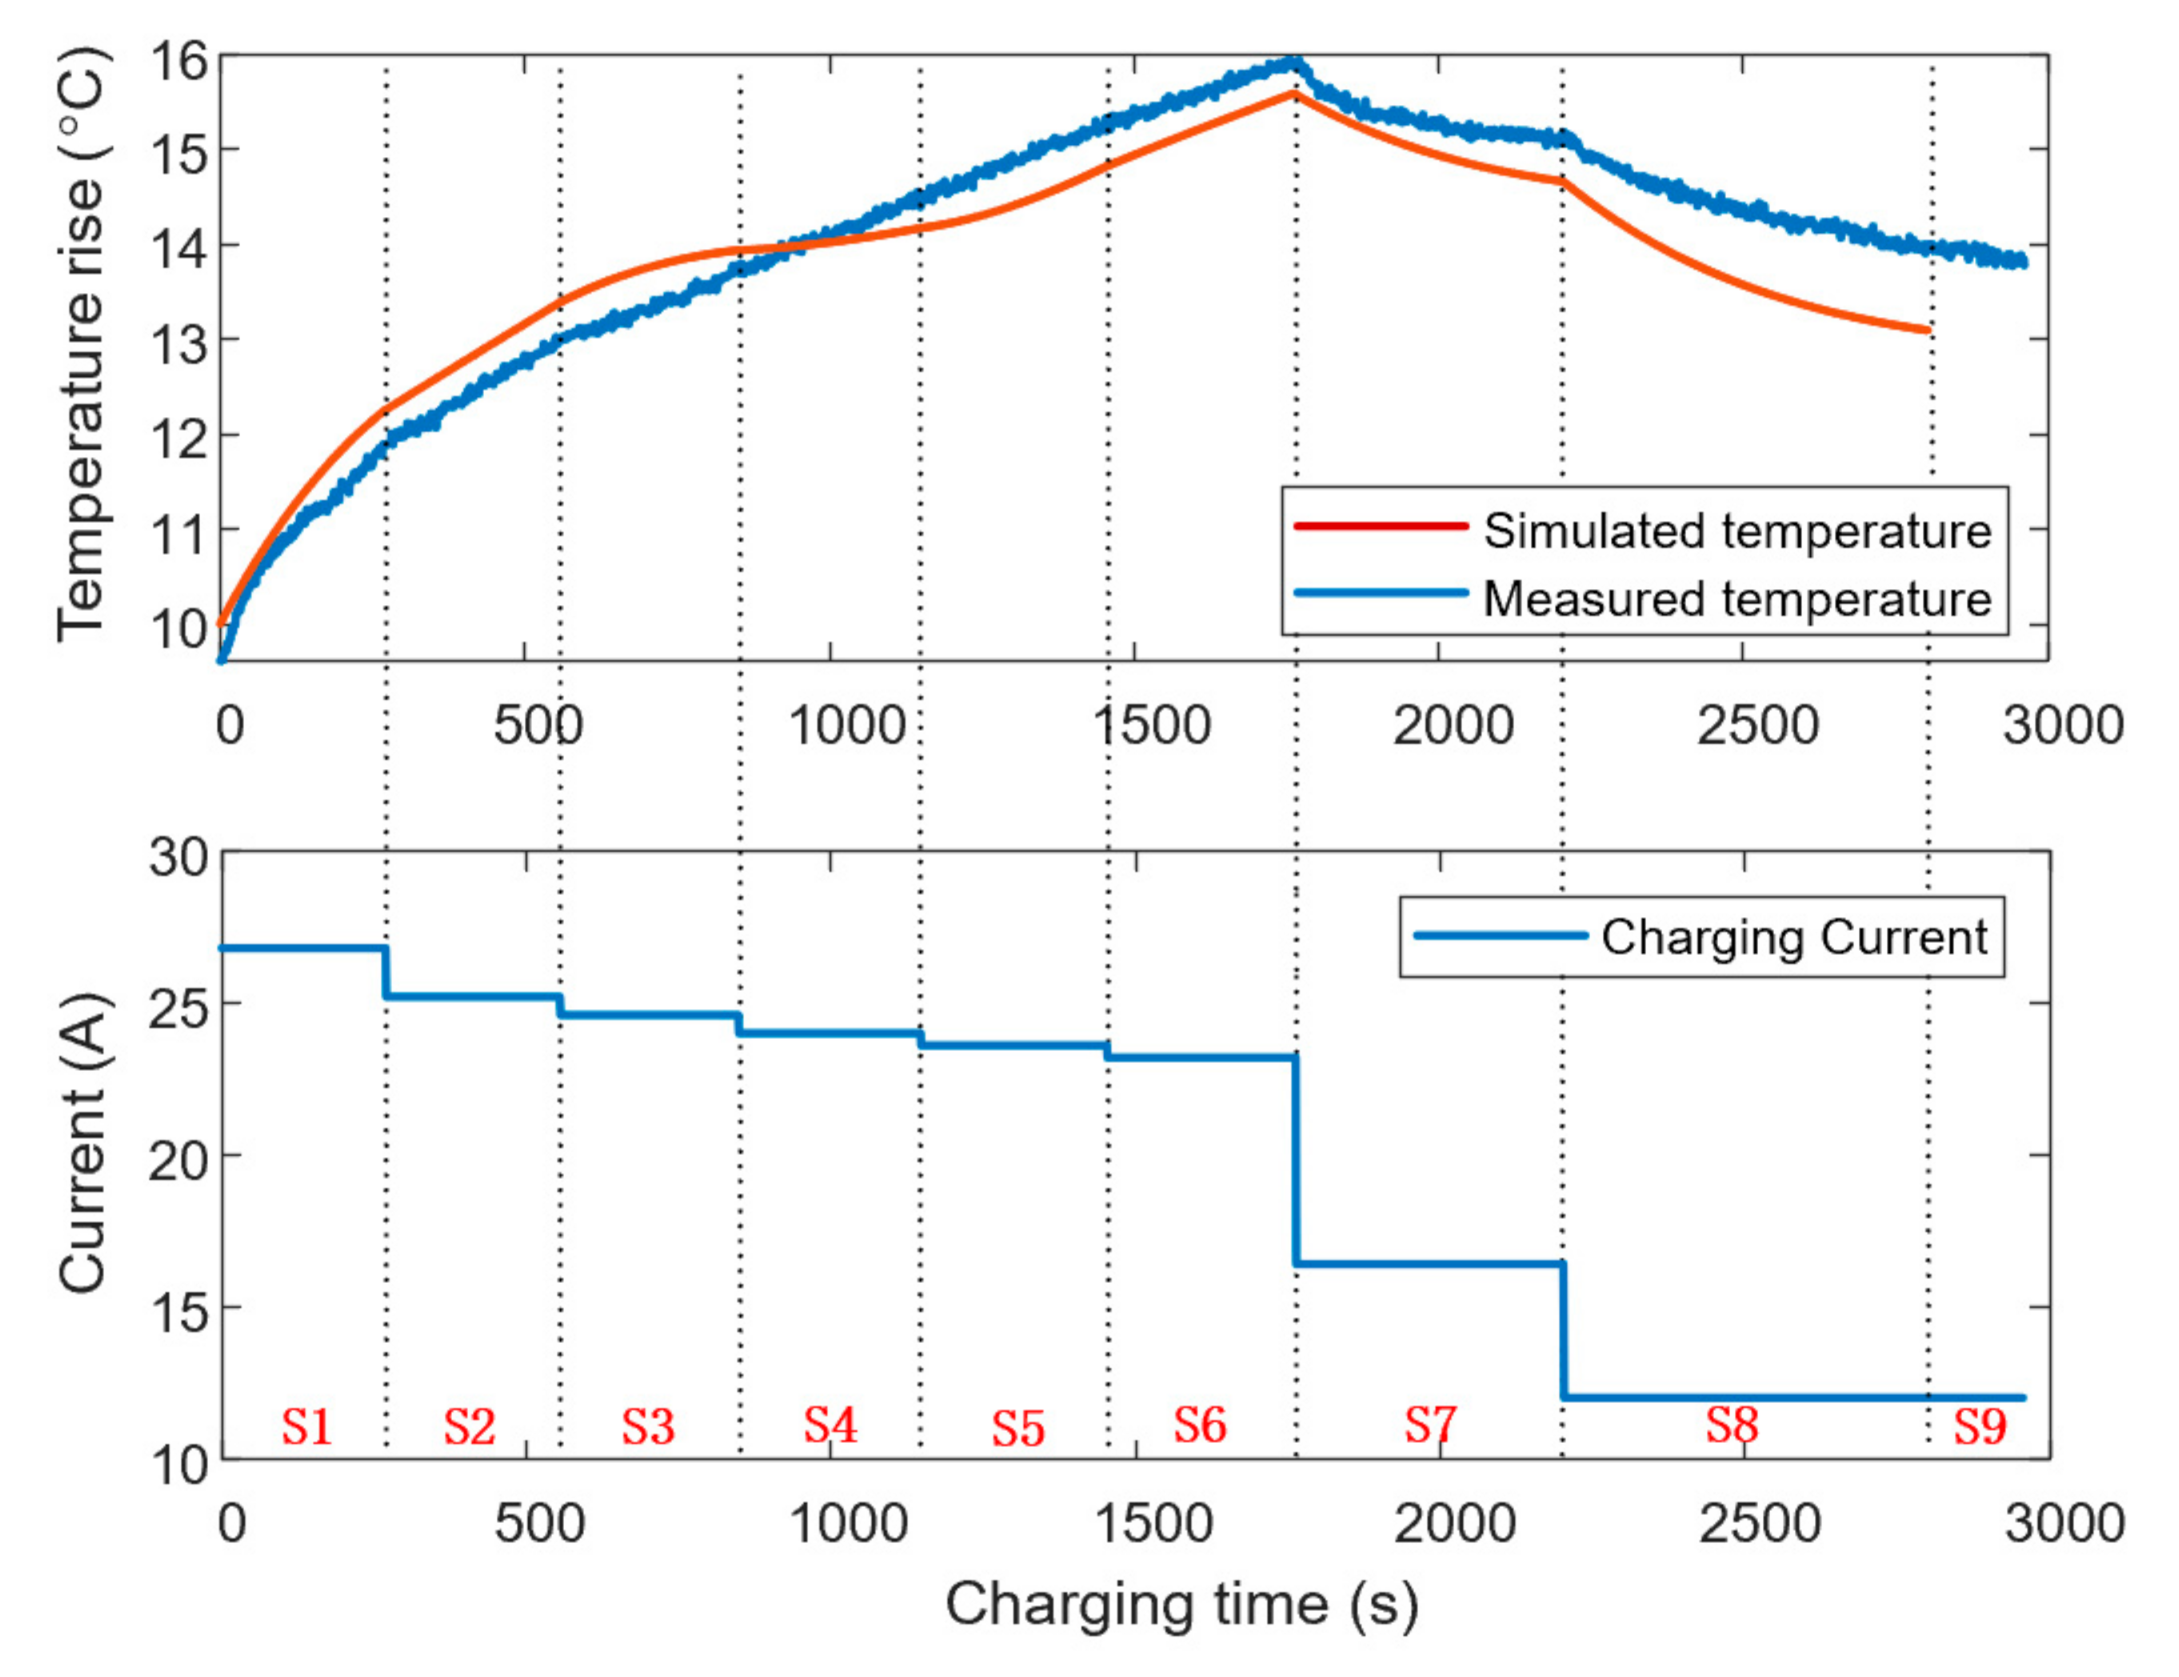
5.3. Optimal Charging Strategy and Verification Based on Temperature

In Section 4.1 and Section 4.2, the parameter selection of the SOC-based multi-stage constant current charging strategy was described. In Section 5.1 and Section 5.2, the influence of weight factor selection and ambient temperature on charging strategy was analyzed. This section will adjust the weight factors according to the ambient temperature to cause the battery to be charged in a more appropriate temperature range in order to meet the user’s needs.
In this paper, charging methods are divided into fast charging and normal charging by different weight factor combinations, and a more reasonable classification of normal charging based on ambient temperature is proposed. For normal charging, it is necessary to meet the requirements of capacity and temperature: the capacity needs to be fully charged to the target capacity within a limited time, and the temperature needs to be as close as possible to the optimal charging temperature under the condition of ensuring the battery life and safety. The target SOC is 90%, i.e., 18 Ah, and the optimal operating temperature is 10–25 °C. To meet these requirements, the weight factor is set according to the following rules: the uncharged capacity weight factor is set to 0.3 so that the battery is fully charged to the target capacity, and the adaption to different ambient temperatures is realized by changing the weight factor ratio between charging time and temperature increase. Specifically, when the ambient temperature is within [25 °C, 40 °C], φ = [0.4 0.3 0.3]; when the ambient temperature is within [10 °C, 25 °C], φ = [0.5 0.3 0.2]; when the ambient temperature is within [0 °C, 10 °C], φ = [0.6 0.3 0.1]. By changing the weight factors, the charging current will be adjusted for different ambient temperature ranges as well as temperature ranges. Figure 11 shows the charging current curves of different weight factor combinations for normal charging at 0 °C, 10 °C and 25 °C and their locations in the Pareto solution set.
In previous studies, an optimized solution with a fixed proportion of weight factors is always proposed regardless of the ambient temperature and users’ demands. Zhang et al. [17] set the ratio of charging time to temperature increase φ as 7:3 to speed up the charging process and to minimize battery life degradation. Sun et al. [18] used the TOPSIS method to determine the optimal ratio φ , which was 1:1. Based on their research, the fixed weight factor method was used for comparison in this paper. The fixed weight factor of the optimal charging was set as φ = [0.5 0.3 0.2], regardless of the ambient temperature, the same as that of the moderate temperature range, in order to seek a balance among the three objectives. Then the charging performance of the fixed and variable factor method under ambient temperatures of 0 °C, 10 °C and 25 °C were compared. As shown in Table 2, it can be seen that compared with the fixed factor method, when the ambient temperature is 0 °C, the variable factor method increases the temperature increase by 1.56 °C, reducing the charging time, and the charging capacity is the same, thus achieving the purpose of increasing the temperature increase at low temperature.
When the ambient temperature is 25 °C, compared with the fixed factor method, the temperature of the variable factor method is reduced by 3.45 °C, the charging time is extended, and the charging capacity is the same, which also reduces the possibility of battery life decay at high temperature. Charging time is not the main focus under the normal charging condition, so this method achieves the purpose of temperature control, especially when the vehicle power battery pack is densely arranged and heat accumulation is easily generated, the lower temperature increase will help keeping the battery pack in the safe working temperature range. Therefore, in environments with different ambient temperature ranges, the proposed charging strategy makes the charging temperature as close to the optimal charging temperature range as possible by changing the weight factors. When ambient temperature is lower than the optimal temperature, the current is increased as much as possible within the charging current limit, so as to raise the battery temperature; when within the optimal temperature range, a balance should be achieved between the temperature increase and the charging time under the condition of ensuring the charging capacity. In the case of high temperature, it is necessary to keep a low charging rate, which can ensure that the temperature of charging process is kept in the safe range.
For fast charging, this paper selects the weight factor as [1 0 0] under three temperature conditions, so that the charging strategy will focus on shortening the charging time. The simulation results are shown in Figure 12.
It can be seen from Figure 12b–d that in order to improve the charging speed, the final SOC is between 80% and 90% because of the constraint aforementioned. The charging strategy achieves the goal of fast charging by increasing the current and sacrificing part of the capacity. Table 3 shows the fast charging performance of variable and fixed weight factor. It can be seen that compared with fixed weight factor charging, the fast charging time of variable factor is significantly shortened of all the three ambient temperatures (e.g., charging time is reduced by 1.1 h when the ambient temperature is 10 °C), and the corresponding temperature increase also increases sharply. During the last stage of charging, due to the large current, the cut-off voltage of charging will be reached quickly, so the corresponding uncharged capacity of fast charging is larger. It is worth noting that in the case of high ambient temperature and if there is need for fast charging, the vehicle thermal management system is needed to monitor and timely cool the battery. At this time, the natural heat dissipation rate of the battery may not be enough for the large amount of heat generated by fast charging.
Finally, in order to verify the effectiveness of the strategy, experiments were carried out according to the current obtained at 10 °C. The temperature of the environmental chamber was set at 10 °C, and the surface of the battery was wrapped in foam and placed in a thermostat to keep it in a quasi-adiabatic state. The simulation and experimental results of fast charging and normal charging are shown in Figure 13 and Figure 14.
It can be seen from Figure 13 and Figure 14 that in the S1–S6 stage, when SOC is low, the charging current is large, so the initial temperature of battery temperature increases rapidly. Then, in S7–S9 stage, the current decreases and the heat dissipation rate is greater than the heat generation rate, so the battery temperature gradually decreases. The temperature error between simulation and experimental measurement is less than 1 °C and the maximum temperature increase error is less than 0.5 °C in the charging process, and the simulation curve can follow the actual temperature trend. For the normal charging in Figure 13, the uncharged capacity is 2 Ah, which is consistent with the simulation results. The charging time (6836 s) is only 1.3% longer than the simulation time (6743 s). In Figure 14, the uncharged capacity of fast charging is 3.5 Ah, which is 0.5 Ah less than the simulation results. This is because the actual charging process reaches the cut-off voltage in stage 9, later than the simulation due to the parameter estimation error. The charging time is 2963 s, which is only 5.7% more than the result in simulation (2803 s). Therefore, the experimental results show that the simulation results can accurately predict and follow the actual performance of three optimization objectives, and further verify the feasibility and effectiveness of the proposed strategy.

6. Conclusions

According to the different charging requirements of EV users under different conditions, this paper proposes an MCCV charging method based on variable weight factors. Firstly, the equivalent circuit model and thermal model are constructed, and the parameters of the model are identified by the data of pulse charging experiment and the least square method. Then, the charging time, charging capacity and maximum temperature increase are optimized based on MOSPO algorithm, and the Pareto solution sets under different simulation parameters are obtained. Then different weight factor proportions and charging environment temperatures are analyzed in detail. The analysis of the weight factor shows that the performance of charging target can be changed by adjusting the charging current according to the user’s demand by controlling the proportion of the factors, which provides a reference for the final strategy decision. The Pareto solution sets under different ambient temperatures show that higher temperature can achieve a better effect among the three optimization objectives. However, it is important that the charging temperature is within the safe range, so the temperature should be as close to the optimal temperature range as possible. By changing the ratio of weight factors, this paper puts forward normal charging and fast charging according to different needs of users. In normal charging, we further adjust the weight factors to adapt to the ambient temperature, which can achieve safe and efficient charging without the intervention of thermal management system. For the normal charging, compared with the strategy with fixed weight factors, the strategy with variable weight factors can improve the charging temperature by 1.56 °C when ambient temperature is 0 °C (increasing) and reduce the temperature by 3.45 °C when ambient temperature is 25 °C, making the temperature as close as possible to the optimal charging temperature range. For fast charging, charging time is reduced significantly under different ambient temperature ranges (e.g., charging time is reduced by 1.1 h when ambient temperature is 10 °C). Finally, the effectiveness of the strategy is further verified by experiments at 10 °C.

Author Contributions

B.W. and H.M. were responsible for overall article structure, design and writing; W.S. contributed to the analysis; Y.Y. contributed to the literature review and the funding support. All authors have read and agreed to the published version of the manuscript.

Funding

This research paper was funded by National Key R&D Program of China (Grant No. 2018YFB0106200); National Natural Science Foundation of China (No. 51775229); Jilin Province Science and Technology Development Program (Grant No. 20190302023GX, 20200501010GX).

Institutional Review Board Statement

Not applicable.

Informed Consent Statement

Not applicable.

Data Availability Statement

Not applicable.

Acknowledgments

The authors are thankful to Long Chen’s great patience in guidance of this paper.

Conflicts of Interest

The authors declare no conflict of interest.

References

  1. Chu, S.; Majumdar, A. Opportunities and challenges for a sustainable energy future. Nature 2012, 488, 294–303. [Google Scholar] [CrossRef] [PubMed]
  2. Hawkins, T.R.; Gausen, O.M.; Strømman, A.H. Environmental impacts of hybrid and electric vehicles—A review. Int. J. Life Cycle Assess. 2012, 17, 997–1014. [Google Scholar] [CrossRef]
  3. Chen, M.; Rincon-Mora, G.A. Accurate, compact, and power-efficient Li-ion battery charger circuit. IEEE Trans. Circuits Syst. Ii-Express Briefs 2006, 53, 1180–1184. [Google Scholar] [CrossRef]
  4. Rahimi-Eichi, H.; Ojha, U.; Baronti, F.; Chow, M. Battery Management System: An Overview of Its Application in the Smart Grid and Electric Vehicles. IEEE Ind. Electron. Mag. 2013, 7, 4–16. [Google Scholar] [CrossRef]
  5. Inoa, E.; Wang, J. PHEV Charging Strategies for Maximized Energy Saving. IEEE Trans. Veh. Technol. 2011, 60, 2978–2986. [Google Scholar] [CrossRef]
  6. Cope, R.; Podrazhansky, Y. The Art of Battery Charging. In Proceedings of the Battery Conference on Applications & Advances, Long Beach, CA, USA, 12–15 January 1999; pp. 233–235. [Google Scholar]
  7. Yang, G.; Zhang, C.; Liu, Q.; Yan, J.; Weiqiang, M.; Yong, M. An optimal charging strategy of lithium-ion batteries based on polarization and temperature rise. In Proceedings of the 2014 IEEE Conference and Expo Transportation Electrification Asia-Pacific (ITEC Asia-Pacific), Beijing, China, 31 August–3 September 2014; pp. 1–6. [Google Scholar]
  8. Abdel Monem, M.; Trad, K.; Omar, N.; Hegazy, O.; Mantels, B.; Mulder, G.; Van den Bossche, P.; Van Mierlo, J. Lithium-ion batteries: Evaluation study of different charging methodologies based on aging process. Appl. Energy 2015, 152, 143–155. [Google Scholar] [CrossRef]
  9. Abdollahi, A.; Han, X.; Raghunathan, N.; Pattipati, B.; Balasingam, B.; Pattipati, K.R.; Bar-Shalom, Y.; Card, B. Optimal charging for general equivalent electrical battery model, and battery life management. J. Energy Storage 2017, 9, 47–58. [Google Scholar] [CrossRef] [Green Version]
  10. Hu, X.; Li, S.; Peng, H.; Sun, F. Charging time and loss optimization for LiNMC and LiFePO4 batteries based on equivalent circuit models. J. Power Sources 2013, 239, 449–457. [Google Scholar] [CrossRef]
  11. Chen, G.; Liu, Z.; Su, H. An Optimal Fast-Charging Strategy for Lithium-Ion Batteries via an Electrochemical–Thermal Model with Intercalation-Induced Stresses and Film Growth. Energies 2020, 13, 2388. [Google Scholar] [CrossRef]
  12. Xu, M.; Wang, R.; Zhao, P.; Wang, X. Fast charging optimization for lithium-ion batteries based on dynamic programming algorithm and electrochemical-thermal-capacity fade coupled model. J. Power Sources 2019, 438, 227015. [Google Scholar] [CrossRef]
  13. Li, J.; Murphy, E.; Winnick, J.; Kohl, P.A. The effects of pulse charging on cycling characteristics of commercial lithium-ion batteries. J. Power Sources 2001, 102, 302–309. [Google Scholar] [CrossRef]
  14. Chen, L.-R. Design of Duty-Varied Voltage Pulse Charger for Improving Li-Ion Battery-Charging Response. IEEE Trans. Ind. Electron. 2009, 56, 480–487. [Google Scholar] [CrossRef]
  15. Ikeya, T.; Sawada, N.; Takagi, S.; Murakami, J.-I.; Kobayashi, K.; Sakabe, T.; Kousaka, E.; Yoshioka, H.; Kato, S.; Yamashita, M.; et al. Multi-step constant-current charging method for electric vehicle, valve-regulated, lead/acid batteries during night time for load-levelling. J. Power Sources 1998, 75, 101–107. [Google Scholar] [CrossRef]
  16. Ikeya, T.; Sawada, N.; Murakami, J.-I.; Kobayashi, K.; Hattori, M.; Murotani, N.; Ujiie, S.; Kajiyama, K.; Nasu, H.; Narisoko, H.; et al. Multi-step constant-current charging method for an electric vehicle nickel/metal hydride battery with high-energy efficiency and long cycle life. J. Power Sources 2002, 105, 6–12. [Google Scholar] [CrossRef]
  17. Zhang, C.; Jiang, J.; Gao, Y.; Zhang, W.; Liu, Q.; Hu, X. Charging optimization in lithium-ion batteries based on temperature rise and charge time. Appl. Energy 2017, 194, 569–577. [Google Scholar] [CrossRef]
  18. Sun, J.; Ma, Q.; Liu, R.; Wang, T.; Tang, C. A novel multiobjective charging optimization method of power lithium-ion batteries based on charging time and temperature rise. Int. J. Energy Res. 2019, 43, 7672–7681. [Google Scholar] [CrossRef]
  19. Min, H.; Sun, W.; Li, X.; Guo, D.; Yu, Y.; Zhu, T.; Zhao, Z. Research on the Optimal Charging Strategy for Li-Ion Batteries Based on Multi-Objective Optimization. Energies 2017, 10, 709. [Google Scholar] [CrossRef] [Green Version]
  20. Wang, S.; Liu, Y. A PSO-Based Fuzzy-Controlled Searching for the Optimal Charge Pattern of Li-Ion Batteries. IEEE Trans. Ind. Electron. 2015, 62, 2983–2993. [Google Scholar] [CrossRef]
  21. Surmann, H. Genetic optimization of a fuzzy system for charging batteries. IEEE Trans. Ind. Electron. 1996, 43, 541–548. [Google Scholar] [CrossRef]
  22. Liu, Y.H.; Teng, J.H.; Lin, Y.C. Search for an Optimal Rapid Charging Pattern for Lithium–Ion Batteries Using Ant Colony System Algorithm. IEEE Trans. Ind. Electron. 2005, 52, 1328–1336. [Google Scholar] [CrossRef]
  23. Liu, Y.-H.; Luo, Y.-F. Search for an Optimal Rapid-Charging Pattern for Li-Ion Batteries Using the Taguchi Approach. IEEE Trans. Ind. Electron. 2010, 57, 3963–3971. [Google Scholar] [CrossRef]
  24. Liu, Y.-H.; Hsieh, C.-H.; Luo, Y.-F. Search for an Optimal Five-Step Charging Pattern for Li-Ion Batteries Using Consecutive Orthogonal Arrays. IEEE Trans. Energy Convers. 2011, 26, 654–661. [Google Scholar] [CrossRef]
  25. Ullah, Z.; Burford, B.; Dillip, S. Fast intelligent battery charging: Neural-fuzzy approach. IEEE Aerosp. Electron. Syst. Mag. 1996, 11, 26–34. [Google Scholar] [CrossRef]
  26. Chen, L.-R.; Hsu, R.C.; Liu, C.-S. A Design of a Grey-Predicted Li-Ion Battery Charge System. IEEE Trans. Ind. Electron. 2008, 55, 3692–3701. [Google Scholar] [CrossRef]
  27. Liao, L.; Zuo, P.; Ma, Y.; Chen, X.; An, Y.; Gao, Y.; Yin, G. Effects of temperature on charge/discharge behaviors of LiFePO4 cathode for Li-ion batteries. Electrochim. Acta 2012, 60, 269–273. [Google Scholar] [CrossRef]
  28. Dubarry, M.; Truchot, C.; Liaw, B.Y.; Gering, K.; Sazhin, S.; Jamison, D.; Michelbacher, C. Evaluation of commercial lithium-ion cells based on composite positive electrode for plug-in hybrid electric vehicle applications. Part II. Degradation mechanism under 2C cycle aging. J. Power Sources 2011, 196, 10336–10343. [Google Scholar] [CrossRef]
  29. Wang, A.; Kadam, S.; Li, H.; Shi, S.; Qi, Y. Review on modeling of the anode solid electrolyte interphase (SEI) for lithium-ion batteries. NPJ Comput. Mater. 2018, 4, 1–26. [Google Scholar] [CrossRef] [Green Version]
  30. Harris, S.J.; Timmons, A.; Baker, D.R.; Monroe, C. Direct in situ measurements of Li transport in Li-ion battery negative electrodes. Chem. Phys. Lett. 2010, 485, 265–274. [Google Scholar] [CrossRef]
  31. Onda, K.; Ohshima, T.; Nakayama, M.; Fukuda, K.; Araki, T. Thermal behavior of small lithium-ion battery during rapid charge and discharge cycles. J. Power Sources 2006, 158, 535–542. [Google Scholar] [CrossRef]
  32. Jiang, J.; Liu, Q.; Zhang, C.; Zhang, W. Evaluation of Acceptable Charging Current of Power Li-Ion Batteries Based on Polarization Characteristics. IEEE Trans. Ind. Electron. 2014, 61, 6844–6851. [Google Scholar] [CrossRef]
  33. Chamaani, S.; Abrishamian, M.S.; Mirtaheri, S.A. Time-Domain Design of UWB Vivaldi Antenna Array Using Multiobjective Particle Swarm Optimization. IEEE Antennas Wirel. Propag. Lett. 2010, 9, 666–669. [Google Scholar] [CrossRef]
  34. Shen, Y.; He, Z.; Liu, D.; Xu, B. Optimization of fuel consumption and emissions for auxiliary power unit based on multi-objective optimization model. Energies 2016, 9, 90. [Google Scholar] [CrossRef] [Green Version]
  35. Coello, C.A.C.; Pulido, G.T.; Lechuga, M.S. Handling multiple objectives with particle swarm optimization. IEEE Trans. Evol. Comput. 2004, 8, 256–279. [Google Scholar] [CrossRef]
  36. Huria, T.; Ceraolo, M.; Gazzarri, J.; Jackey, R. High fidelity electrical model with thermal dependence for characterization and simulation of high power lithium battery cells. In Proceedings of the 2012 IEEE International Electric Vehicle Conference (IEVC), Greenville, SC, USA, 4–8 March 2012. [Google Scholar]
  37. Chen, Z.; Shu, X.; Xiao, R.; Yan, W.; Liu, Y.; Shen, J. Optimal charging strategy design for lithium-ion batteries considering minimization of temperature rise and energy loss. Int. J. Energy Res. 2019, 43, 4344–4358. [Google Scholar] [CrossRef]
Figure 1. Equivalent circuit model [18].
Energies 14 01776 g001
Figure 2. Experimental setup.
Energies 14 01776 g002
Figure 3. Parameter estimation steps.
Energies 14 01776 g003
Figure 4. Results of parameter estimation: (a) Profile of input pulse charging current; (b) Comparison between experimental and simulated voltages output; (c) Change of SOC; (d) Voltage error between experimental and simulated voltages output.
Energies 14 01776 g004
Figure 5. Result of parameter estimation: (a) Open circuit voltage U O C ; (b) Polarization Capacity C P ; (c) Polarization resistance R P ; (d) Ohmic resistance R r .
Energies 14 01776 g005aEnergies 14 01776 g005b
Figure 6. Simulation results of different charging stages. (a) Pareto solution of charging time, uncharged capacity and temperature increase; (b) Pareto solution set of charging time and temperature increase; (c) Pareto solution set of charging time and uncharged capacity; (d) Pareto solution set of uncharged capacity and temperature increase.
Energies 14 01776 g006aEnergies 14 01776 g006b
Figure 7. Simulation results of different cut-off voltages. (a) Pareto solution set of charging time, uncharged capacity and temperature increase; (b) Pareto solution set of charging time and temperature increase; (c) Pareto solution set of charging time and uncharged capacity; (d) Pareto solution set of uncharged capacity and temperature increase.
Energies 14 01776 g007
Figure 8. Simulation results of different weight factors of charging time. (a) Nine-stage Pareto solution set (b) Charging current curve; (c) Charging SOC performance; (d) Charging temperature increase performance.
Energies 14 01776 g008
Figure 9. Comparison of charging current curves for different weighting factors of charging time.
Energies 14 01776 g009
Figure 10. Simulation results of different ambient temperatures. (a) Pareto solution set for charging time, uncharged capacity and temperature increase; (b) Pareto solution set of charging time and temperature increase; (c) Pareto solution set of charging time and uncharged capacity; (d) Pareto solution sets of uncharged capacity and temperature increase.
Energies 14 01776 g010
Figure 11. Simulation results of normal charging at different ambient temperatures. (a) Pareto solution set of charging time, uncharged capacity and temperature increase; (b) Normal charging current curve at ambient temperature of 0 °C; (c) Normal charging current curve at ambient temperature of 10 °C; (d) Normal charging current curve at ambient temperature of 25 °C.
Energies 14 01776 g011
Figure 12. Simulation results of fast charging at different ambient temperatures. (a) Pareto solution set of charging time, uncharged capacity and temperature increase; (b) Fast charging current curve at ambient temperature of 0 °C; (c) Fast charging current curve at ambient temperature of 10 °C; (d) Fast charging current curve at ambient temperature of 25 °C.
Energies 14 01776 g012
Figure 13. The validation of normal charging in the proposed strategy.
Energies 14 01776 g013
Figure 14. The validation of fast charging in the proposed strategy.
Energies 14 01776 g014
Table 1. Sample battery parameters.
Capacity
(Ah)
Weight (kg)Size
(mm)
Average Heat Capacity
(J/kg·k)
Charge Voltage Limit
(V)
Discharge Voltage Limit (V)
200.512225 × 162 × 7810.533.652.0
Table 2. Comparison of normal charging.
TambCharging Time (h)Temperature
Rise (°C)
Uncharged
Capacity (Ah)
FixedVariableFixedVariableFixedVariable
0 °C2.3111.8291.533.0922
10 °C1.8731.8732.652.6522
25 °C1.011.7634.811.3622
Table 3. Comparison of fast charging.
TambCharging Time (h)Temperature
Rise (°C)
Uncharged
Capacity (Ah)
FixedVariableFixedVariableFixedVariable
0 °C2.3111.3171.533.2523.56
10 °C1.8730.7782.655.5624
25 °C1.010.5924.818.5523.96
Publisher’s Note: MDPI stays neutral with regard to jurisdictional claims in published maps and institutional affiliations.

