1. Introduction
According to the 2019 World Air Quality Report, which surveyed the average concentration of fine particulate matter (PM2.5) in 98 countries around the world, revealed that Korea’s air pollution level is the 26th most serious in the world and that the average concentration of ultrafine dust in Korea is the highest among OECD countries. In particular, Seoul was found to be the worst in Korea at 24.8
g/m
. In
Figure 1, panels A and B present average PM2.5 exposure by country during 2019 and PM2.5 annual mean (
g/m
) in Seoul, respectively.
Currently, diesel cars are known to be the biggest cause of fine dust in the South Korean metropolitan area, and environmental pollution problems are becoming more serious as particulate matter (PM) caused by diesel cars is added to carbon monoxide (CO), hydrocarbons (HC), and nitrogen oxides (NOx), which are harmful substances emitted from gasoline cars. If internal combustion locomotives are replaced with electric vehicles (EVs) that generate driving power by supplying electric energy from high-voltage batteries to electric motors, the air pollution problem caused by cars can be solved drastically because they do not emit air pollutants and greenhouse gases. For this reason, on 18 December 2018, the Ministry of Trade, Industry and Energy announced that it has significantly raised its domestic supply target for EVs to 430,000 units by 2022 [
1]. However, despite this supply policy, there are constant criticisms that they are reluctant to purchase eco-friendly cars due to insufficient charging stations. Therefore, in order to accelerate the introduction of EVs, it is important to expand the charging infrastructure, and it is necessary to install possible public chargers in places where the demand is high. That is, it is very important to increase charging stations but choose the optimal location for the efficient distribution of charging stations.
Some authors studied allocation for EV charging stations to optimally expand the charging infrastructure. Frade et al. [
2] studied on the optimal location of the EV charging stations for an area of Lisbon, the capital city of Portugal with a strong concentration of population and employment. Lam et al. [
3] provided four solutions to tackle the EV charging station placement problem: iterative mixed-integer linear program (MILP), greedy approach, effective MILP, and chemical reaction optimization. Chung and Kwon [
4] proposed a multi-period flow-refueling location model in order to find an optimal EV charging station location and applied the model to the real traffic flow data of the Korean Expressway network in 2011. Akbari et al. [
5] introduced a function based on the distance constructed with Haversine Formula [
6] to minimize the recharge cost of the EVs. Erbaş et al. [
7] provided the Geographic Information System-based Fuzzy Multi-Criteria Decision Analysis (GIS-based FMDA) methodology to select an optimal EV charging station location based on the fuzzy Analytical Hierarchy Process (AHP) and Technique for Order Preference by Similarity to Ideal Solution (TOPSIS). Fredriksson et al. [
8] provided an iterative approximation technique to solve the Route Node Coverage (RNC) problem that is used to identify the optimal location of charging stations for EVs in a road transport network. Dong et al. [
9] provided a new approach to find optimal locations of new charging stations by bringing together a spatial point process statistical model of charging points locations and a mathematical maximum coverage location model.
However, in practice, not only the slow charger, but also quick charger introduction and expansion are also very important issues to activate EV distribution. For example, the slow charger takes an average of four to five hours to buffer one EV, which greatly reduces user convenience due to their lower turnover rate compared to gas stations. This makes users prefer the quick charger, especially when driving in the suburbs, where quick charging infrastructure is scarce, the demand for the quick charger is bound to increase.
In keeping with these issues, this paper focuses on optimal allocation methods for quick charging stations for building quick charging infrastructures unlike existing studies, and studies efficient customized strategies to find areas that are expected to be in high demand through clustering analysis and machine learning techniques. The optimal allocation is analyzed in three aspects. One is a spatial interpolation method to process the missing values of the considered features, and the other is a cluster analysis based on the features to create a customized strategy for each cluster and machine learning techniques to identify the important features that predict each cluster of data.
The rest of this paper is organized as follows.
Section 2 develops a methodology that is applied to determine optimal locations for EV charging stations such as the spatial interpolation, clustering analysis, and machine learning methods producing feature importance.
Section 3 provides analysis based on real data for illustrative purposes. Finally, conclusions are provided in
Section 4.
2. Methodology
2.1. Spatial Interpolation
For interpolation of unmeasured points, we employ the kriging method, which is a method that can be applied to the analysis of physical phenomena or data that are distributed spatially or visually. It is known that this approach effectively predicts the value of an unmeasured point by grasping the distribution characteristics of given data and analyzing the correlation based on this.
The kriging analysis is modeled by defining the sample space of the variable of interest, collecting the data, and grasping the spatial interrelationship of the collected data, and there is a representative scale for this, namely, the variogram. Representatively, there are three types for the variogram: the spherical model, exponential model, and Gaussian model. The spherical model is generally the most used functional model, is expressed in the form of a third-order polynomial, and has the characteristic that the variogram value coincides with the sill value in the correlation distance. The exponential model is interpolated to approximate to the sill value and is widely used mainly in hydrological data. The Gaussian model is used when there is a strong correlation of data or when one wants to use a model with strong continuity.
In addition, the kriging technique includes simple kriging, the simplest method used under the assumption that the mean is known, ordinary kriging, which is widely used under the assumption that the mean is unknown but constant, and universal kriging, which is a method that takes into account the tendency of the mean. Among them, the ordinary kriging is the most widely used and it serves to estimate a value at a point of a region for which a variogram is known, using data in the neighborhood of the estimation location. The ordinary kriging is defined as follows.
Let
are given observations at spatial coordinates
, where
n is the number of observed locations, and
D is the geographical domain. Then, the ordinary kriging prediction [
10] is given by
where
is the kriging prediction at unmeasured points
and
is a vector of kriging weights
for
, which are obtained by minimizing the expected squared prediction error under an unbiasedness condition.
2.2. Clustering
Clustering analysis is a representative unsupervised learning method that groups n objects from multiple predictor values observed for each object into clusters with similar characteristics and analyzes the relationships between clusters by identifying the characteristics of the clusters formed. Information-theoretic methods as well as elbow and silhouette heuristic are considered to estimate the optimal number of clusters k.
In the heuristic method, the elbow method measures how homogeneity and heterogeneity within a cluster change for different values of
k, and then finds
k whose performance is weakened. To be more specific, the total within-cluster sum of squares (WSS) is calculated according to for each
k, then
k can be chosen at a point where brings less improvement to cluster homogeneity. However, it is sometimes ambiguous in that the point should be chosen subjectively. Alternatively, the silhouette method [
11] can be used, which provides the optimal
k is the one that maximizes the average silhouette of observations over a range of possible values for
k. In addition to these heuristic methods, 26 indices are considered to examine the relevant number of clusters.
For the information-theoretic method, the most commonly used indices include the Akaike’s information criterion (AIC [
12,
13]), Bayesian information criterion (BIC [
14]), and sample size-adjusted BIC (SABIC [
15]). The AIC and BIC are defined as
and
, respectively, where
L is the maximized likelihood, the last term in each is referred to as a penalty component that is penalized by the number of estimated parameters
p to discourage overfitting of a model. In addition, the SABIC is defined as
, which has been demonstrated in [
16] as the most accurate (>90%) information criterion through simulation studies if there are at least 50 subjects per latent class.
For clustering, the latent profile analysis (LPA) that is a branch of the Gaussian finite mixture modeling is conducted with the estimated k in real data analysis, which is known that it is superior to a data-driven approach like k-means that uses distance algorithms.
2.3. Feature Importance
In general, the feature importance can be assessed in two ways: model-specific and model-agnostic. This subsection gives a brief description of a model-agnostic method [
17] for assessment of the feature importance, which allows comparing the importance of features between models with different structures. The algorithm of [
17] is as follows.
Let be a non-negative loss function that quantifies goodness of fit of an estimated model based on the matrix of p features for all n observations , where and is the predictions corresponding to the values of the target variable for the estimated model.
Compute the value of the loss function for the original data, .
For each feature, create the new data by randomly permuting on n observations.
Compute predictions based on from the fitted model.
Compute the value of the loss function for the new data, .
Quantify the importance of each feature by calculating the difference or ratio .
Note that the larger difference or higher ratio in Step 5 is greater reliance on features because it indicates that the performance of the model has worsened after permuting the values of the feature. That is, the larger the change in the performance, the more important is the feature.
In addition, as the permuting data in Step 2 is created including randomness, the results based on this may depend on the composition of the permuted values. Then, the associated uncertainty can be assessed by repeating the procedure N times.
3. Analysis
For the purposes of illustration for analyzing the optimal location of EV charging stations, we consider the number of living population and work force people and the number of guest facility in the Seoul Metropolitan Government, where public data are best opened.
The Seoul Metropolitan Government began to estimate the living population data in accordance with the recommendations of the United Nations (UN) to predict administrative needs such as urban planning and to utilize the basic data needed to improve the allocation of administrative services. Currently, the living population in the Seoul Metropolitan Government refers to all the people that exist in a specific area of Seoul at a specific time, which were estimated using public big data held by the Seoul Metropolitan Government and KT telecom data.
For analysis, data sets acquired from Seoul Open Data website on 18 June 2020 (
http://data.seoul.go.kr/, accessed on 18 June 2020) are used. For simplicity, the following abbreviations are used:
There are 24 autonomous “gu” districts in Seoul, divided into 424 administrative “dong” sub-units in Seoul. The 424 administrative “dong” is plotted in the left panel of
Figure 2. Then, to understand the installation status of public quick chargers for EVs in Seoul, installation year and location of public quick EV charging stations using data on public quick chargers from the Public Data Portal (
data.go.kr, accessed on 29 June 2020) are plotted in the right panel of
Figure 2.
The compactness of each feature is plotted in
Figure 3, which indicates that features #WP and #GF have missing values in 68 and 82 administrative dongs, respectively. To predict the values in such administrative dongs with missing values, we employ the ordinary kriging prediction (
1) that does not require estimating the mean of the random field from the data as mentioned before.
First, to test whether there is spatial autocorrelation for the considered features, Moran’s I test [
18] is conducted after log transform of the features. These results are reported in
Table 1, which reveals that the features have significant positive spatial autocorrelation. For the variogram, an exponential model is chosen to fit the experimental semivariogram that provides the values of parameters for the spatial interpolation of kriging. Then, the missing values are replaced using the ordinary kriging prediction (
1).
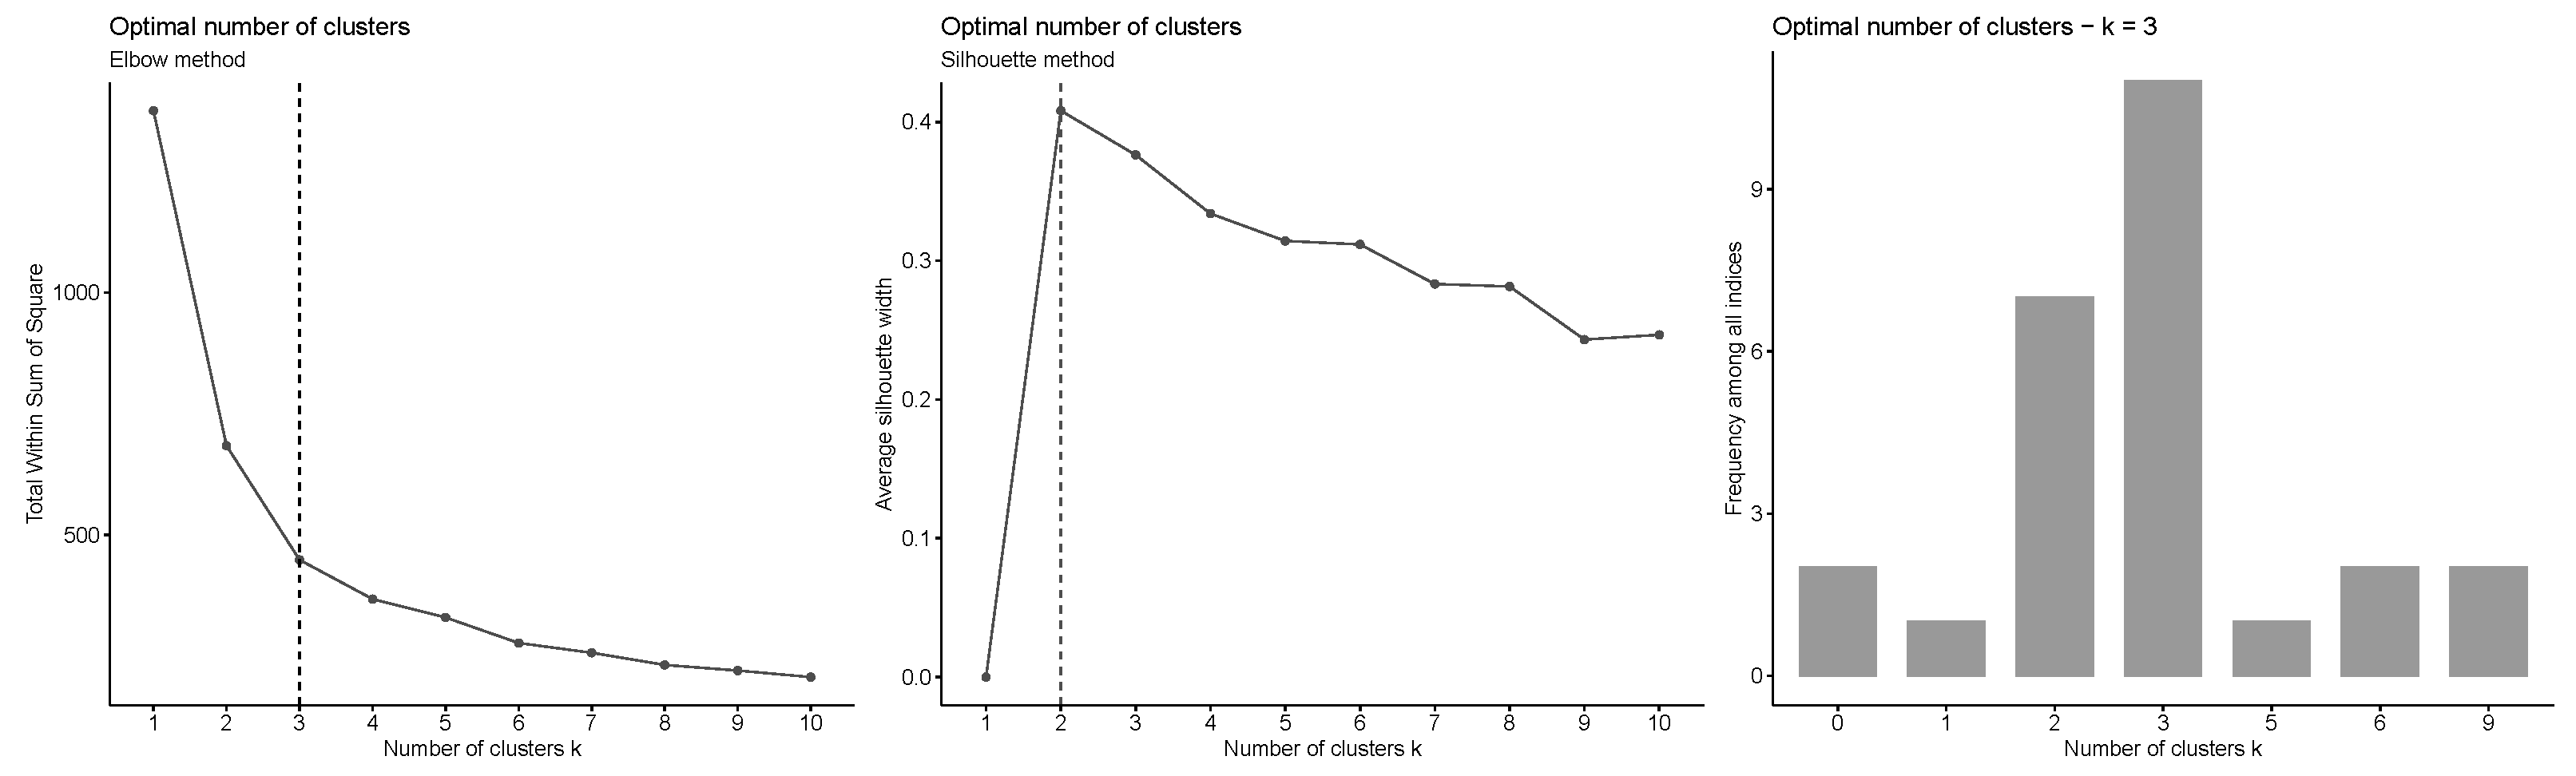
The 424 administrative dongs with spatially interpolated data are grouped into similar types of groups based on features considered. To determine the optimal value of
k, first the heuristic methods such as elbow method, silhouette method, and other 26 criteria are used. These results are plotted in
Figure 4. In addition, the LPA that is a model-based technique is applied to detect the number of latent classes based on information-theoretic methods including AIC, BIC, and SABIC.
For the LPA, four models with the following variance-covariance matrix are considered:
The results for the information-theoretic methods are reported in
Table 2.
In
Figure 4, the result for the elbow method suggests that
is the optimal number of clusters as it appears to be the bend in the knee (or elbow) and the silhouette method shows that
is the optimal number of clusters maximizing the average silhouette values with three clusters coming in as second optimal number of clusters. In addition, in the case of the other 26 criteria, 11 of 26 criteria suggest
as the optimal number of clusters.
Table 2 indicates that the version 3-class of Model 4 is the best model in terms of the AIC and SABIC, while the 2-class version of Model 4 is the best model in terms of the BIC. Considering the results and interpretability,
was chosen as the final number of clusters. Three clusters are denoted as “Class” 1, 2, and 3 for the unity of terms.
Then, we can naturally judge that the demand for quick charging stations will be high in places where the living population, working population, and guest facility are concentrated. To identify these characteristics of each Class, descriptive statistics and boxplots for 3 classes in each feature are reported in
Figure 5, which shows the least frequency with 48 (11.3%) administrative dongs belonging to Class 2, the highest 235 (
) administrative dongs belonging to Class 1 were found. In addition, the features #WP and #GF have the highest values for both mean and standard deviation (SD) in Class 2, while feature #LP do so in Class 3.
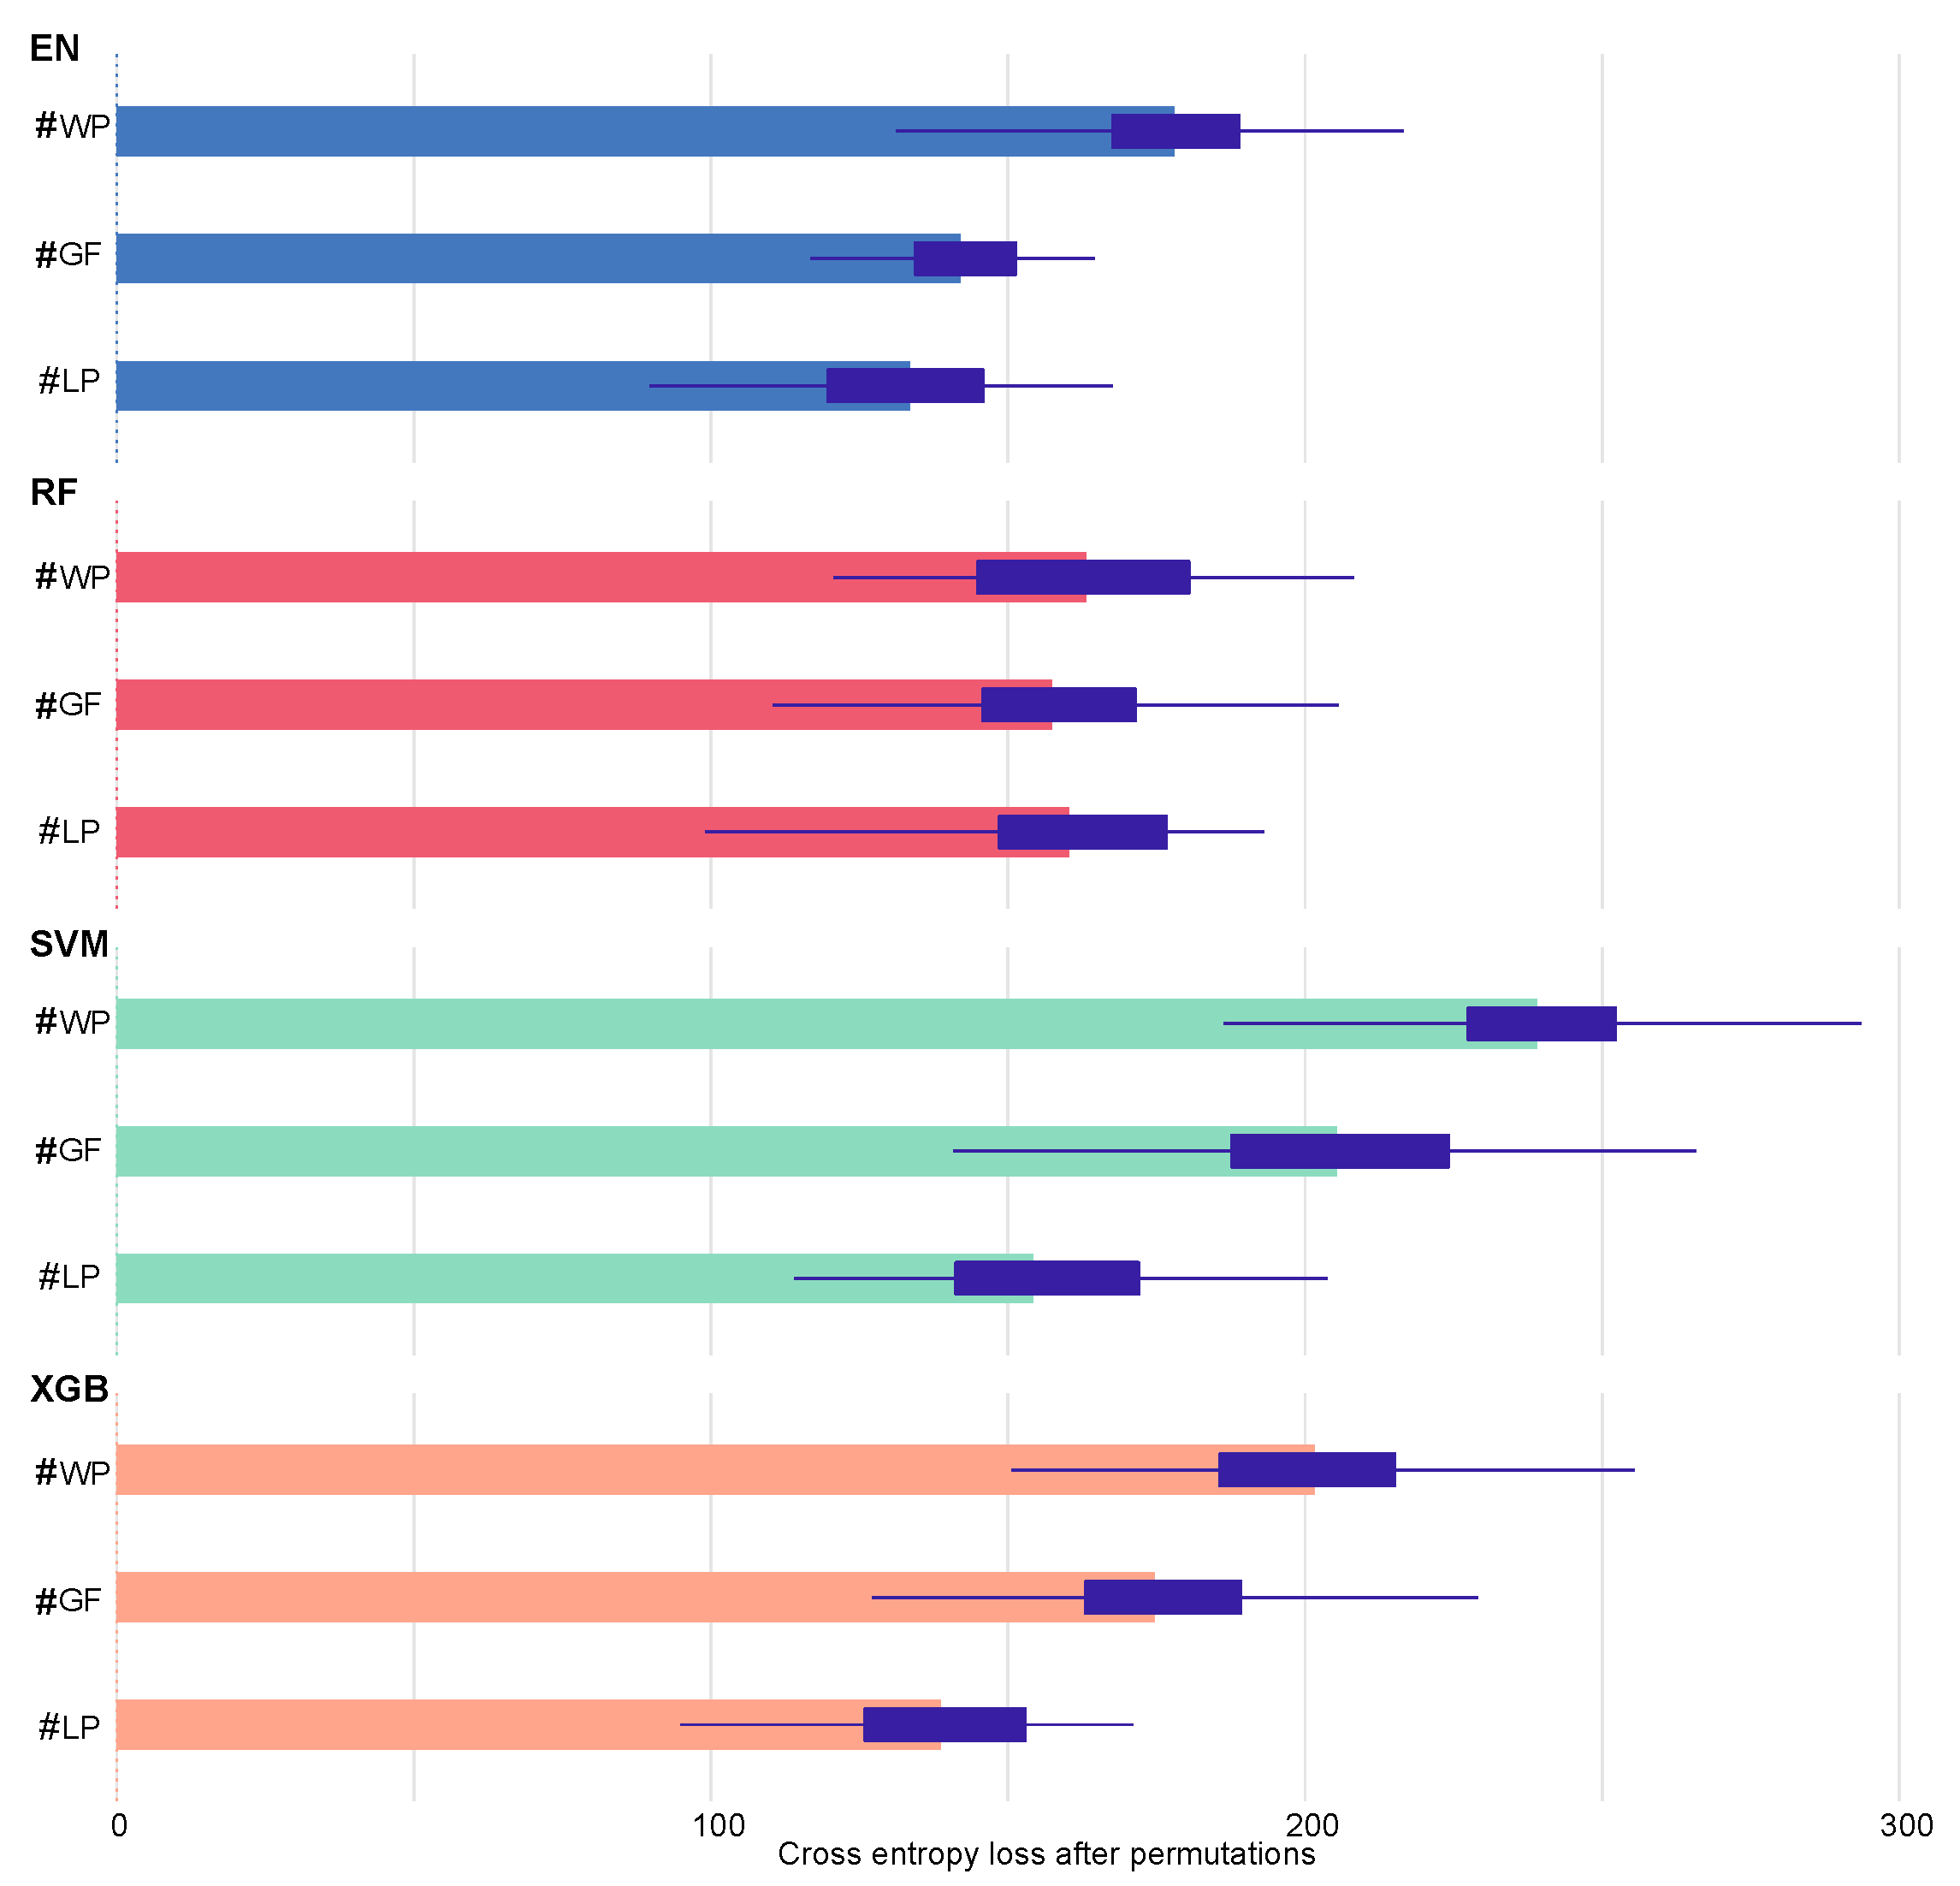
Here, to examine which features have a more significant impact on predicting classes of data, various machine learning techniques that can measure the feature importance based on the algorithm provided in
Section 2.3 are applied to observed data with Class determined through clustering analysis as the target variable. As the machine learning techniques, the elastic net (EN), random forest (RF), support vector machine (SVM), and extreme gradient boosting (XGB) are considered. To avoid overfitting and to tune the model’s hyperparameters during training, 5-fold cross-validation is done by splitting the original training data into 5 partitions. To find the optimal hyperparameters, the accuracy is used as the performance measure, which is computed by averaging 5 accuracy values from repeated 5 times. The accuracy from the models with the optimal hyperparameters is reported in
Table 3, indicating that the SVM has the best performance, and that there is no significant difference in performance between the remaining models. For the RF and XGB, the out-of-bag (OOB) error in addition to the cross-validation is applied to assess performance of the model. For the loss function (that is, model performance measure), the cross-entropy is considered as it is the multinomial classification solution. To take into account the uncertainty, the mean values over 50 permutations are computed. The results for the feature importance from the models are present in
Figure 6. In
Figure 6, the length of the bar corresponds to the mean value of difference
.
Figure 6 indicates that %WP is the most important feature in all considered models, followed by %GF and %LP except for the RF. From the result, we can consider Class 2 that is the place where working population and guest facility are concentrated the most as the optimal locations for EV charging stations.
4. Conclusions
This paper proposes a methodology for optimal quick charging station allocation to build an efficient EV quick charging station infrastructure to expand the distribution of EVs, an alternative to diesel vehicles, which are the main cause of environmental pollution.
The proposed method is implemented in three aspects: The first step is a spatial interpolation method through a kriging technique using spatial correlation for interpolation for unmeasured points. Then, by performing clustering analysis such as the LPA for an efficient customized strategy, we can find areas of high demand from users. Finally, machine learning techniques are applied to determine which features play an important role in predicting clusters of data. To examine the validity of the proposed method, it was applied to the Seoul Metropolitan Government, which has the easiest public data access.
Through this approach, it is possible to select the areas that correspond to priority where quick charging stations for EVs are needed by examining important features in areas with high demand, which makes efficient resource allocation possible. In addition, it can reduce uncertainty about the demand by identifying which features play a more important role in areas where customer demand is expected to be high.
As prospective research, a study is underway on the actual required number of chargers at each charging station based on the estimated charging demand of the selected candidate areas and the charging amount prediction considering the time and day of the week. In addition, although this study was proposed for the study of selecting the optimal location for EV charging stations, it can be applied to similar studies for the optimal location.


