
Effect of Permeability on Hydrate-Bearing Sediment Productivity and Stability in Ulleung Basin, East Sea, South Korea


1
Department of Civil and Environmental Engineering, Korea Advanced Institute of Science and Technology, Daejeon 34141, Korea
2
Department of Infrastructure Safety Research, Korea Institute of Civil Engineering and Building Technology, Gyeonggi 10223, Korea
3
The Petroleum and Marine Division, Korea Institute of Geoscience and Mineral Resources, Daejeon 34132, Korea
*
Author to whom correspondence should be addressed.
Energies 2021, 14(6), 1752; https://doi.org/10.3390/en14061752
Submission received: 2 February 2021
/
Revised: 17 March 2021
/
Accepted: 19 March 2021
/
Published: 22 March 2021
(This article belongs to the Special Issue Sustainable Geotechnical Engineering and Its Applications)
Abstract
:Methane hydrate has attracted attention as a next-generation resource, and many researchers have conducted various studies to estimate its productivity. Numerical simulation is the optimal method for estimating methane gas productivity. Meanwhile, using a reasonable input parameter is essential for obtaining accurate numerical modeling results. Permeability is a geotechnical property that exhibits the greatest impact on productivity. The permeability of hydrate-bearing sediment varies based on the sediment pore structure and hydrate saturation. In this study, an empirical permeability model was derived from experimental data using soil specimens from the Ulleung Basin, and the model was applied in numerical analysis to evaluate the sediment gas productivity and ground stability. The gas productivity and stability of hydrate-bearing sediments were compared by applying a widely used permeability model and the proposed model to a numerical model. Additionally, a parametric study was performed to examine the effects of initial hydrate saturation on the sediment gas productivity and stability. There were significant differences in the productivity and stability analysis results according to the proposed permeability model. Therefore, it was found that for accurate numerical analysis, a regional permeability model should be applied.
1. Introduction
Clathrate hydrates are compounds of guest molecules, such as methane, ethane, and propane, with water, and they form at high pressure (typically over 0.6 MPa) and low temperature (typically less than 300 K). Therefore, hydrates are readily formed in the deep ocean, which exhibits high pressure and low temperatures. The guest molecules (also called natural gas) in clathrate hydrates are considered to be premium fuel because they burn cleanly and produce less CO2 [1]. Also, gas hydrate is considered to be one of the new clean energy resources, which can replace coal, petroleum and conventional natural gas in the 21st century [2]. According to previous research, approximately 230 natural gas hydrate deposits have been investigated globally, with reserves of approximately 1.5 × 10¹⁵ m3 of natural gas [3]. The commercial production of 15% of the gas hydrate would provide the world with energy for 200 years at the current energy consumption level. The production of natural gas from the hydrates could contribute not only to sustained economic development of individual countries, but also to the global warming mitigation [2]. Various methodologies have been proposed to extract these natural gases from hydrate-bearing sediments, including heat, inhibitor injection, depressurization, CO2/CH4 exchange, and combined methods [4,5]. However, the field-scale production tests have been conducted in only three countries (the United States, Japan and China) due to the lack of technical fundamental for field production.
Methane hydrates are regarded as a vital future energy resource in South Korea. South Korea has imported over 98% of the energy used in the country. The South Korean government and research institutes (e.g., Korea Institute of Geoscience and Mineral Resources, Korea Gas Corporation, Korea Advanced Institute of Science and Technology, etc.) conducted the research projects Ulleung Basin Gas Hydrate drilling expedition 1 (UBGH1) and drilling expedition 2 (UBGH2) in 2007 and 2010, respectively, to investigate the geotechnical properties and geological characteristics of the Ulleung Basin in the East Sea of South Korea [6,7,8]. The methane hydrate deposit potential in the Ulleung Basin was estimated to be approximately 0.6 billion tons [9]. Several geotechnical and geological scientists have conducted productivity and stability analyses and production method research covering gas production to pilot methane gas production in the Ulleung Basin. Sand production in field production tests can incur large costs due to production interruption [10,11]. Therefore, it is essential to perform numerical analysis before field production tests to improve their economic efficiency [12,13,14].
In the numerical analysis, the estimated productivity and stability are significantly affected by the input models and properties of hydrate-bearing sediments. Therefore, applying a suitable constitutive model and properties is essential. Permeability is a key water and gas productivity property of hydrate-bearing sediments [15]. In gas production from hydrate-bearing sediments, there is a multiphase fluid flow mechanism affecting the solid hydrate, water, and dissociated gases existing in the pore. The relative permeability, which is the ratio of the effective permeability of each pore phase, has been studied by several researchers [16,17,18]. In particular, the permeability of hydrate-bearing sediments has been demonstrated to vary with the hydrate saturation. When the hydrate dissociates, the water channel increases, and the cross-sectional area through which water and gas flow inside the pore increases, increasing the permeability [19]. Several permeability models for hydrate-bearing sediments considering hydrate saturation have been developed using mathematical and experimental methods, and they have been widely used in productivity prediction analysis (Table 1). However, the particle size, pore size distribution, specific surface area, and hydrate saturation distribution all greatly affect the sediment permeability [15]. This means that the water permeability of hydrate-bearing sediments can vary based on the soil characteristics. Therefore, it is difficult to apply the current permeability models to all soil types. For accurate numerical estimation of productivity and stability, the suitable permeability model has to be derived through the experimental results using the sediments of target site.
In this study, a permeability test was conducted using an artificial sample that imitated Ulleung basin sediments. The permeability test modeled the hydrate production process. The permeability data were compared with those of existing models (e.g., Kleinberg and Masuda models) and were used to derive the experimental model for the Ulleung Basin. Comparative numerical analyses using two-dimensional fast Lagrangian analysis of continua (FLAC2D) were performed to estimate the gas and water productivities and stability of the sediments according to the permeability models and initial hydrate saturation. The productivity and stability results could be used as the reference data in the step of establishing a strategy for pilot filed-production test in the Ulleung basin, South Korea.
2. Site of Interest
2.1. Gas Hydrates in Ulleung Basin
Gas hydrate research in Ulleung Basin was initially conducted by KIGAM in 1996 [8]. In 1998, the potential presence of gas hydrates was first identified in Ulleung Basin, South Korea [23]. In 2007, the first Ulleung Basin Gas Hydrates Drilling Expedition (UBGH1) was performed, and the core along with the downhole log data at the depth range from 55.7 to 231.7 m below sea floor (mbsf) was collected. Gas hydrates were found at three core sites (e.g., UBGH1-04, 09 and 10). In the UBGH1-09 and UBGH1-10 sites, vein-filling gas hydrates were formed in the muddy sediments, while pore-filling gas hydrates were found within the turbidite sand layer in UBGH1-04 [24]. The second Ulleung Basin Gas Hydrates Drilling Expedition (UBGH2) was conducted to better identify the overall distribution of gas hydrate-bearing sediments and to find the potential site for future production tests. During the UBGH2 expedition, 13 sites were explored by logging-while-drilling and coring and characterized for their geological, geophysical, geochemical, geomechanical properties. From the acquired data sets, the geothermal gradient of the Ulleung Basin ranges from 97 to 115 °C/km. The average gas hydrate saturations of UBGH2-2_1 and UBGH2-2_2, which are fracture-dominated reservoirs (i.e., chimney structure), are estimated from the isotropic analysis of resistivity and acoustic velocity logs, which were found to be 46% and 45%, respectively. Meanwhile, the gas hydrate saturation of the UBGH2-10, in which the gas hydrates formed as pore-filling type within the turbidite sand reservoirs, was estimated to range between 35% and 57% [25]. Moreover, expeditions UBGH1 and UBGH2 showed that the gas hydrate in the Ulleung Basin was predominantly CH4, which was generated by microbial activity via CO2 reduction, with a structure I hydrate [26,27].
2.2. UBGH2-6
The UBGH2-6 is located at the most northern site of UBGH2 (N 36°01′07.69″ E 130° 15′51.48″), and is considered as a feasible pilot production site (Figure 1) [8]. The water depth of the UBGH2-6 is 2153 m. The UBGH2-6 contains “high-quality” hydrate-bearing sand reservoirs, and the total cumulative thicknesses of the hydrate-bearing sediments is the greatest of those encountered during the UBGH1 and UBGH2 expeditions. The gas hydrate zones (GHZ) of the UBGH2-6 site occur within the 112–154 m depths. The turbidite sands of UBGH2-6 usually consist of well-distributed coarse silt to fine sands. The gas hydrate saturations within the sand-rich reservoirs at the UBGH2-6 site range between 12% and 79%, with an average of approximately 52% [28].
3. Experimental Tests for Permeability Measurement
3.1. Soil
Due to the scarcity of in situ core samples, artificial samples that imitated core samples obtained from the silty sand layer in UBGH2-6 were used. The artificial specimen was composed of HAMA #8 sand, in which the iron contents present in the sand were removed before testing. The artificial sample closely resembled the core sample in particle size distribution, as shown in Figure 2. The sample exhibited a specific gravity of 2.62 and an average particle size of approximately 130 µm.
3.2. Experimental Setup
The experimental setup was designed to model high-pressure and low-temperature conditions under which hydrate can reliably form. Although the in situ gas hydrates are predominantly composed of CH4, CO2 gas was used for the experimental as CH4 is an explosive gas and CO2 and CH4 are both type I structure gas hydrates with similar mechanical properties [29]. In addition, as the purpose of the experiment was to measure the effective permeability, in which the solubility difference has negligible influence, the use of CO2 was considered appropriate. The experimental setup used in this study is illustrated in Figure 3. High-pressure conditions were maintained using an oedometer cell, and a low temperature was preserved by using a water bath. To measure the sample permeability, a pressure difference was generated between the two cross-sections of the specimen using a CO2 and water injection pump and a back-pressure regulator. This pressure difference allowed the pressure to be measured in real time by placing a pressure transducer (accuracy: 0.25% BFSL, Best Fit Straight Line) in front of the pump and using a back-pressure regulator. CO2 gas was injected from the bottom to the top of the sample. A K-type thermocouple (standard limits of error: 2.2 °C or 0.75% above 0 °C, 2.2 °C or 2.0% below 0 °C) was installed in the specimen to measure the specimen temperature. A CO2 gas-capturing system was also installed: The discharged CO2 gas volume from the dissociated gas hydrate was directly measured using the CO2 gas capturing system.
3.3. Experimental Procedure
The experiment consisted of measuring the permeability by sequentially decreasing the hydrate saturation. After dissociating a portion of the gas hydrate, a permeability measurement test was conducted and repeated throughout the dissociation stages.
3.3.1. Hydrate Formation
To simulate the conditions of gas hydrate-bearing sediments in the Ulleung Basin, a pneumatic machine was used to apply 600 kPa of pressure as the effective stress that is normally caused by seabed sediments. In this study, experiments were performed at a temperature of ~2 °C and pressure of ~3 MPa. At a temperature of approximately 2 °C, the gas hydrate is stable at a pressure of 1.7 MPa or greater; therefore, the gas hydrate formation conditions are satisfied. The Ulleung Basin gas hydrate-bearing sediments exhibit high gas hydrate saturations of ~60% at the UBGH2-6 site. It is difficult to achieve over 60% gas hydrate saturation in an experimental environment [30]. Therefore, gas hydrate formation was repeated four times to accomplish the formation of gas hydrates with a high degree of saturation.
After the primary gas hydrate was formed, N2 gas was injected into the sample to remove the remaining CO2 gas in the pores. Water was then injected at 2–3 times the volume of the voids to saturate the sample, and then additional N2 gas was injected at a level of twice the pore volume to remove the water from the pores. Water remained in the particle meniscus, and secondary gas hydrate was formed with the remaining water. N2 gas was injected to remove CO2 gas and water because the CO2 gas solubility is high, and the N2 gas reactivity is low. This process was repeated three more times to achieve a high gas hydrate saturation.
3.3.2. Permeability Measurement
Constant pressure was maintained in the pump that injected the water; at the surface where the water was drained, the pressure inside the test cell was maintained using a back-pressure regulator. The pressure and temperature of the system were continuously measured during entire process in order to monitor the stability of the gas hydrates. Testing was conducted while observing that no CO2 was released during the experimental procedure, thereby ensuring the stability of the gas hydrates. The water injection pressure was kept constant, and the pressure on the side where the water was drained was lowered to generate a pressure difference about 50 kPa between the two cross-sections; water then flowed along this pressure difference. The system pressure was maintained, and permeability was measured under steady-state conditions. The amount of water drained after back-pressure regulation and the flow rate through the sample per unit of time were measured. Based on these results, the permeability coefficient was calculated according to the Darcy law [31]. The permeability measurement was repeated for three different porosity values to see the effect of porosity on permeability.
3.3.3. Hydrate Dissociation
The gas hydrate was dissociated by depressurizing the test cell and controlling the back-pressure regulator. The pressure of the system was decreased until the dissociation of the hydrate specimens was observed. After the target volume of the gas was captured, the pressure of the test cell was increased at a constant temperature. Permeability was measured with a 50 kPa head difference at each step of gas hydrate dissociation. After each step, the samples were stabilized for 24 h to ensure that all gases in the pores flowed out and saturated with water. Testing was performed after each stabilization step. Gas hydrate dissociation occurred in 10 steps from the degree of hydrate saturation (Sh) = 0.6 to 0.0. The amount of hydrate dissociated in each step was calculated by collecting the generated CO2 gas. After gas hydrate dissociation was completed, the initial gas hydrate saturation was estimated using the total volume of the captured CO2 gas. The experimental process was conducted for 100 h. The water flow rate was low; the CO2 gas was therefore assumed to be fully dissolved in the water. The molar fraction of CO2 in the water under the experimental conditions was approximately 0.016 [32], which is approximately 12 times higher than the solubility of CO2 under atmospheric conditions. Therefore, using the captured volume of CO2 gas may overestimate the specimen gas hydrate saturation. This solubility difference was considered for the final gas hydrate saturation estimation.
3.4. Experimental Results and Discussion
The permeability results for various hydrate saturations are displayed in Figure 4a, where Kint is the permeability at no hydrate saturation and Keff is the permeability at a certain hydrate saturated condition. During the initial dissociation stage, from 0.6, the permeability did not change significantly, which is presumed to be due to the absence of local dissociation or an interstitial pore network. In contrast, when the gas hydrate saturation reduced to 0.3–0.4, the permeability sharply increased. A small change of porosity does not significantly affect the tendency of permeability according to the hydrate saturation. Based on these results, the permeability of the hydrate-bearing sediments was greatly affected by the hydrate saturation.
The results of the permeability measurement test performed in this study (porosity = 0.48) were compared with results found in the literature (Figure 4b), and the measured permeability data is summarized in Table 2. Comparison between the permeability data was conducted with the Mallik 2L-38 sand sample and the silica sand No. 7 sample [33]. Even though the intrinsic permeability is different with each soil specimen, the permeability reduction trends with increasing hydrate saturation are similar for all samples.
As summarized in Table 1, there are both theoretical and empirical models for permeability and gas hydrate saturation that are widely used for gas productivity numerical modeling. Figure 5 compares the normalized permeability measured by the experiment with that estimated by existing models (i.e., Kleinberg and Masuda models). In contrast to experimental results, the existing models display a tendency for the water permeability to continuously decrease, even up to 70% hydrate saturation. This decrease in permeability as the hydrate saturation increases is a result of the reduction in the cross-sectional area of the pore channel, where water and gas flow, caused by the solid hydrate. The existing theoretical models assumed that the hydrates are formed along the wall (Masuda model) or within the pore center (Kleinberg model) in the capillary tube. In addition, both existing models assumed the laminar regime [21]. However, the realistic flow conditions would be closer to turbulence flow conditions. Typically, the permeability in the turbulence flow is lower than that of laminar flow at the same pore space. Moreover, silty sand has a small pore size, and low intrinsic permeability. This leads to a significant decrease in the permeability as hydrates form in the pore, as smaller pore sizes are more largely affected by changes in the pore space. As such, inconsistencies in the experimental and theoretical models may be reduced should these parameters be considered in the existing models. Moreover, the existing models assume that the hydrates are impervious (Keff = 0); however, should a realistic value of permeability be used, it is assumed that a similar converging behavior will be observed with the existing models. In UBGH2-6, the sediments consist of silty sand, which has a relatively lower intrinsic permeability. Furthermore, the impervious permeability of silt is typically considered as 1 mD [34]. However, the existing theoretical models do not take into account the impervious permeability of silty sands.
3.5. Permeability Model Derivation
As shown in Figure 5, there was a significant difference between the permeability trends derived from the existing models and those obtained from the experiment using the Ulleung Basin sample. In the case of UBGH2-6, the initial hydrate saturation is approximately 65%. Considering that water permeability is the most critical geotechnical property for gas productivity, the gas productivity can be expected to be overestimated when applying the existing models to a numerical analysis of gas productivity of hydrate-bearing sediments in the Ulleung Basin. To obtain accurate gas productivity estimations, a permeability model was derived from the experimental results as follows:
where Keff is the effective permeability [mD], Kint is the intrinsic permeability [mD] (herein, Kint is measured as 209 mD), and Sh is the hydrate saturation [-].
Figure 6 shows application of the proposed experimental model on other experimental test data (silica sand No. 7 and Mallik 2L-28). The proposed experimental model is based on the logistic function. The proposed experimental model well matched other experimental data by adjusting the model parameters. This result shows that the proposed experimental model is applicable to other hydrate-bearing sediments if the necessary permeability data are available.
4. Numerical Analysis for Gas Productivity and Stability
4.1. Numerical Simulator
The scale of the gas production mechanism of hydrate-bearing sediments is massive, making it difficult to estimate the gas productivity and stability of the sediments through an experiment. Therefore, it is essential to perform numerical analysis to analyze the gas production mechanism. In this study, a two-dimensional thermo-hydro-mechanical (THM) simulator developed by Kim et al. [35,36] was used to estimate the sediment gas productivity and stability. The simulator was developed based on FLAC2D. FLAC2D is a widely used commercial program in the geotechnical field. FLAC2D cannot perform multi-phase flow coupled with thermal analysis using its built-in constitutive models [37]. However, the program offers a user-defined code module called FISH, which can greatly expand the applicability of FLAC according to user knowledge.
4.2. Model Conditions
The analysis target area modeled the UBGH2-6 site, one of the proposed test production sites in the Ulleung Basin in South Korea. The hydrate-bearing sediments are located between the unconsolidated sand layers in the depth range of 140–153 mbsf under the seawater of 2156 m. The detailed layer geometry is illustrated in Figure 7. The permeability models used the experimentally determined model (Equation (1)) and the Kleinberg model [21] for the gas productivity comparison. The Kleinberg model was selected as the control group because a prior core analysis of the Ulleung Basin confirmed that most of the hydrates in the sand layer were distributed in the form of pore filling [38]. The intrinsic permeability of the sand sediment was designated as 209 mD. The initial hydrate saturation was set to 65%. Due to a lack of experiments on stiffness and hydrate saturation for the Ulleung Basin, the Uchida model was used to consider the stiffness change according to the hydrate saturation [39]. The gas production method was modeled using a depressurization method. Depressurization was conducted in a depth range of 140–153 mbsf, and the depressurization rate was 0.5 Mpa/h until the bottom hole pressure was 9 MPa. The effects of sand production were ignored in this study. The production period was set to 14 days. The detailed input properties used in the numerical analysis are summarized in Table 3.
4.3. Numerical Analysis Results and Discussion
4.3.1. Effects of Permeability Models on Water and Gas Productivity
The estimates of water pumped out and gas production according to the permeability models (e.g., experimental and Kleinberg models) are illustrated in Figure 8. In the Kleinberg model, the early stages of production (up to 1 day) exhibited a rapid increase in the water production rate, followed by a rapid decline. In contrast, for the experimental model, the water production rate exhibited a relatively smooth rise. The experimental model (Sh = 30% and 65%) exhibited a low initial permeability of the hydrate-bearing sediments compared to that of the Kleinberg model (Sh = 65%) (Figure 5). Initially the water and gas production rate likely increased rapidly due to high permeability and afterward rapidly decreased due to ground subsidence. In other words, the initial stage is the state in which the pore pressure continuously decreases towards the target bottom hole pressure. The pressure gradient is relatively high and causes an increase the specific water discharge. An increase in effective stress, caused by the decrease in pore water pressure, induced ground subsidence, and it caused the decrease in permeability at the end of the depressurization.
The maximum water and gas production rates in the Kleinberg model were 12.32 ton/day and 2.76 × 10³ m3/day, respectively. In the experimental model, the maximum water and gas production rates were 6.25 ton/day and 1.06 × 10³ m3/day, respectively. In the experimental model, the predicted production rates for both water and gas were estimated to be approximately 50% and 60% less than those of the Kleinberg model, respectively (Figure 8a,c). The cumulative water and gas production were 115.43 tons and 2.06 × 10⁴ m3 in the Kleinberg model and 72.67 tons and 9.68 × 10³ m3 in the experimental model, respectively. Consequently, the experimental model predicted the total water and gas production as approximately 37% and 53% less, respectively, than that of the Kleinberg model (Figure 8b,d). In regards to the numerical results, it shows that the existing model overestimates the productivity in the case of Ulleung Basin.
4.3.2. Effects of Initial Hydrate Saturation on Productivity
The experimental results confirmed that the permeability of hydrate-bearing sediments depends on the hydrate saturation. Thus, a parametric analysis was performed to investigate the effects of the initial hydrate saturation on productivity. The initial hydrate saturations were set to 30%, 55% and 65% to investigate the effects of the initial hydrate saturation on the sediment gas productivity and stability. The parametric analysis productivity predictions are displayed in Figure 9. The results for an initial hydrate saturation of 65% are the same as those of the experimental model in the previous section. The maximum water and gas production rates for an initial hydrate saturation of 30% were 75.32 ton/day and 2.37 × 10⁴ m3/day, respectively. The estimated water and gas production rates were approximately 12 times and 22 times more for an initial hydrate saturation of 30% than for that of 65%, respectively (Figure 9a,c). The cumulative water and gas production for an initial hydrate saturation of 30% were 578.34 tons and 1.72 × 10⁵ m3, respectively. When the initial hydrate saturation was decreased by about half, the total water and gas production predictions increased by 7.9 times and 17.7 times, respectively (Figure 9b,d). This significant difference is inferred to be due to the difference in the initial permeability and the tendencies of permeability change according to the hydrate saturation. The initial permeability of experimental model (Sh = 30%) exhibited a similar value with the Kleinberg model (Sh = 0.65%), but the experimental model exhibited a more rapid increase in permeability as the hydrate dissociation progressed than that of the Kleinberg model (Figure 5). This leads to the significant difference in productivity with production period.
In addition, the predicted gas production estimate was indirectly compared with the Mallik data [10]. The initial hydrate saturation in Mallik was high, ranging from 55% to 85%. For more accurate comparison, the parametric case (initial hydrate saturation = 55%) was added while applying the experimental model and the Kleinberg model. The intrinsic permeability of sediment in Mallik was 10 mD to 1000 mD. The average permeability, 500 mD, was applied to the comparative analysis. The gas production rates in Mallik 2007 and 2008 were 1000–2000 m3/day for 1.5 days and 2000–3000 m3/day for 6 days, respectively. The gas production value in Mallik were intermediate to the Kleinberg model (Sh = 0.55, Kint = 500 mD) and the experimental model (Sh = 0.55, Kint = 500 mD), as shown in Figure 10. The results of both methods differ from the actual data, but this is due to the lack of available detailed model information from the Mallik site. If accurate information on the site to be analyzed is not available, the productivity of gas and water can be indirectly estimated through the numerical analysis by applying the Kleinberg model and the proposed experimental model.
4.3.3. Stability of Hydrate-Bearing Sediments
Stability analysis of the hydrate-bearing sediments was conducted according to each permeability model and initial hydrate saturation. During hydrate production, displacement data were collected from three locations: on the sea floor and on the top and bottom of the production well (Figure 11). In all cases, ground subsidence occurred at the sea floor and the production well head (Figure 11a,b). The case of an initial hydrate saturation of 30% and the experimental model exhibited the largest vertical displacements. In contrast, the case with the lowest ground subsidence was that with the experimental model and an initial hydrate saturation of 65%. The stability analysis results (Figure 11) also relate to productivity. The decrease in the sediment stiffness is due to the dissociation of the solid hydrate in the pore, which causes the sediment subsidence. Thus, the higher the water and gas productivity, the larger the ground displacement, and the faster it progresses.
In particular, ground heave occurred at the bottom of the production well in all cases (Figure 11c). Similar to the subsidence results, the largest ground heave occurred in the case of the experimental model and an initial hydrate saturation of 30%. In this case, the maximum ground uplift was approximately 35.21 cm. In contrast, for the developed model and an initial hydrate saturation of 65%, the smallest ground heave was 3.28 cm. Based on these results, the subsidence on the sea floor and the top of the production well may differ by up to 9.5 times and 10.8 times, respectively, according to the applied permeability model and initial hydrate saturation. The ground heave at the bottom of the production well is induced by the pressure difference between the discharge pressure and pore pressure. Ground heave and subsidence during gas production can cause tensile or compressive stress on the production well. Thus, it is essential that additional analysis on the stability of production wells during gas production be conducted.
5. Limitations and Further Work
The experimental model was derived from the lab-scale permeability test. However, the effective stress cannot be increased indefinitely in laboratory tests. The permeability test was conducted at an effective stress of 600 kPa; however, the effective stress in the Ulleung Basin is 14 MPa after depressurization. Therefore, a correlation between the confining stress level and hydraulic properties of the HBS is required for accurate numerical analysis.
The Young’s modulus of hydrate-bearing sediments varies based on the hydrate saturation. During hydrate dissociation, the hydrate-bearing sediment stiffness decreases. Therefore, numerical analyses must consider the effects of hydrate saturation on the Young’s modulus of sediments. Similar to the permeability model, the stiffness model may also depend on the sediment condition. Therefore, deriving a stiffness model for the Ulleung Basin and applying it to a numerical model is necessary.
Sand production effects were not considered in this study. In the first field production test of the Mallik project in 2007, the production period was only 1.5 days due to the occurrence of sand production [10]. Sand production can lead to production well clogging, and excessive stress concentrated around the production well can cause the well to collapse [43]. Therefore, in future studies, productivity and stability analyses that consider the effects of sand production are required.
6. Conclusions
This study examined the effects of permeability and hydrate saturation on the gas productivity and stability of hydrate-bearing sediments. The permeability test simulated the hydrate production mechanism, and permeability and hydrate saturation were measured. Using the measured data, an experimental model was derived and applied to the numerical analysis to estimate the sediment water and gas productivities and stability. The key findings of this study are as follows:
- The measured permeability using the artificial specimen of the Ulleung Basin has significant differences compared to that of theoretical models. The measured permeability exhibited differences of up to 75 times in the Masuda model (N = 10) and approximately 15 times in the Kleinberg model (grain coating), at 60% hydrate saturation.
- The experimental model showed the convergence in permeability as the hydrate saturation increase, reflecting the impervious permeability of silty sand, whereas the existing theoretical models did not reflect the hydraulic characteristics of the sediments, and showed a continuous decrease in permeability as the hydrate saturation increases.
- In the numerical estimation that applied the experimental model, the maximum water and gas production were approximately 50% and 60% smaller than those of the Kleinberg model. The cumulative water and gas production for the experimental model predicted the total water and gas production as approximately 37% and 53% less, respectively, than those of the Kleinberg model.
- The initial hydrate saturation significantly affects the productivity. This is due to the initial permeability and the tendencies of permeability change due to the hydrate saturation. This means that in long-term production, the productivity might increase as the hydrate dissociates from the high initial hydrate saturation, which in certain production periods can show inverse productivity tendencies in regards to the initial hydrate saturation.
- The hydrate-bearing sediment stability was similar to the production estimates. The ground displacement tended to be proportional to the permeability and inversely proportional to the initial hydrate saturation.
- Ground heave occurs at the bottom of the production well, the interaction between the ground heave, and subsidence might induce tensile or compressive stresses on the production well.
The existing model over-estimated the water and gas productivities and stability of the hydrate-bearing sediments. This research improves the reliability of the gas productivity and stability predictions for the Ulleung Basin. However, this study also has limitations, such as the effects of sand production not being considered. This means that productivity and stability may be slightly overestimated. Further research is required to develop a numerical model that considers sand production to increase productivity and stability evaluation reliability.
Author Contributions
Conceptualization, G.-C.C., J.Y.L. and J.-T.K.; numerical analysis, J.-T.K. and A.-R.K.; experiment, C.-W.K.; analysis of data, J.-T.K. and C.-W.K.; writing—original draft preparation, J.-T.K.; writing—review and editing, C.-W.K. and G.-C.C.; supervision, G.-C.C. and J.Y.L. All authors have read and agreed to the published version of the manuscript.
Funding
This research was supported by the Ministry of Trade, Industry, and Energy (MOTIE) through the Project “Gas Hydrate Exploration and Production Study (18-1143)” under the management of the Gas Hydrate Research and Development Organization (GHDO) of South Korea and the Korea Institute of Geoscience and Mineral Resources (KIGAM).
Institutional Review Board Statement
Not applicable.
Informed Consent Statement
Not applicable.
Data Availability Statement
The data presented in this study are available on request from the corresponding author.
Conflicts of Interest
The authors declare no conflict of interest.
References
- Sloan, E.D. Fundamental principles and applications of natural gas hydrates. Nature 2003, 426, 353. [Google Scholar] [CrossRef]
- Makogon, Y.F.; Holditch, S.; Makogon, T.Y. Natural gas-hydrates—A potential energy source for the 21st Century. J. Pet. Sci. Eng. 2007, 56, 14–31. [Google Scholar] [CrossRef]
- Rossi, F.; Gambelli, A.M.; Sharma, D.K.; Castellani, B.; Nicolini, A.; Castaldi, M.J. Experiments on methane hydrates formation in seabed deposits and gas recovery adopting carbon dioxide replacement strategies. Appl. Therm. Eng. 2019, 148, 371–381. [Google Scholar] [CrossRef]
- Holder, G.; Kamath, V.; Godbole, S. The potential of natural gas hydrates as an energy resource. Annu. Rev. Energy 1984, 9, 427–445. [Google Scholar] [CrossRef]
- Collett, T.; Bahk, J.-J.; Baker, R.; Boswell, R.; Divins, D.; Frye, M.; Goldberg, D.; Husebø, J.; Koh, C.; Malone, M. Methane Hydrates in Nature Current Knowledge and Challenges. J. Chem. Eng. Data 2014, 60, 319–329. [Google Scholar] [CrossRef]
- Park, K.-P.; Bahk, J.-J.; Kwon, Y.; Kim, G.Y.; Riedel, M.; Holland, M.; Schultheiss, P.; Rose, K. Korean national Program expedition confirms rich gas hydrate deposit in the Ulleung Basin, East Sea. Fire Ice Methane Hydrate Newsl. 2008, 8, 6–9. [Google Scholar]
- Kim, G.Y.; Yi, B.Y.; Yoo, D.G.; Ryu, B.J.; Riedel, M. Evidence of gas hydrate from downhole logging data in the Ulleung Basin, East Sea. Mar. Pet. Geol. 2011, 28, 1979–1985. [Google Scholar] [CrossRef]
- Ryu, B.-J.; Collett, T.S.; Riedel, M.; Kim, G.Y.; Chun, J.-H.; Bahk, J.-J.; Lee, J.Y.; Kim, J.-H.; Yoo, D.-G. Scientific results of the second gas hydrate drilling expedition in the Ulleung basin (UBGH2). Mar. Pet. Geol. 2013, 47, 1–20. [Google Scholar] [CrossRef]
- Lee, G.H.; Bo, Y.Y.; Yoo, D.G.; Ryu, B.J.; Kim, H.J. Estimation of the gas-hydrate resource volume in a small area of the Ulleung Basin, East Sea using seismic inversion and multi-attribute transform techniques. Mar. Pet. Geol. 2013, 47, 291–302. [Google Scholar] [CrossRef]
- Kurihara, M.; Sato, A.; Funatsu, K.; Ouchi, H.; Yamamoto, K.; Numasawa, M.; Ebinuma, T.; Narita, H.; Masuda, Y.; Dallimore, S.R. Analysis of production data for 2007/2008 Mallik gas hydrate production tests in Canada. In Proceedings of the International Oil and Gas Conference and Exhibition in China, Beijing, China, 8–10 June 2010; Society of Petroleum Engineers: Richardson, TX, USA, 2010. [Google Scholar]
- Yamamoto, K.; Dallimore, S. Aurora-JOGMEC-NRCan Mallik 2006–2008 gas hydrate research project progress. Nat. Gas Oil 2008, 304, 285–4541. [Google Scholar]
- Sun, Z.; Xin, Y.; Sun, Q.; Ma, R.; Zhang, J.; Lv, S.; Cai, M.; Wang, H. Numerical simulation of the depressurization process of a natural gas hydrate reservoir: An attempt at optimization of field operational factors with multiple wells in a real 3D geological model. Energies 2016, 9, 714. [Google Scholar] [CrossRef]
- Wang, Y.; Feng, J.-C.; Li, X.-S.; Zhang, Y.; Li, G. Evaluation of gas production from marine hydrate deposits at the GMGS2-Site 8, Pearl river Mouth Basin, South China Sea. Energies 2016, 9, 222. [Google Scholar] [CrossRef] [Green Version]
- Feng, Y.; Chen, L.; Suzuki, A.; Kogawa, T.; Okajima, J.; Komiya, A.; Maruyama, S. Numerical analysis of gas production from layered methane hydrate reservoirs by depressurization. Energy 2019, 166, 1106–1119. [Google Scholar] [CrossRef]
- Li, G.; Li, C.; Li, X.; Wei, N. Permeability experiments on the methane hydrate in quartz sands and its model verification. Nat. Gas Ind. B 2018, 5, 298–305. [Google Scholar] [CrossRef]
- Corey, A.T. The interrelation between gas and oil relative permeabilities. Prod. Mon. 1954, 19, 38–41. [Google Scholar]
- Van Genuchten, M.T. A closed-form equation for predicting the hydraulic conductivity of unsaturated soils 1. Soil Sci. Soc. Am. J. 1980, 44, 892–898. [Google Scholar] [CrossRef] [Green Version]
- Brooks, R.H.; Corey, A.T. Properties of porous media affecting fluid flow. J. Irrig. Drain. Div. 1966, 92, 61–90. [Google Scholar] [CrossRef]
- Xue, K.; Yang, L.; Zhao, J.; Li, Y.; Song, Y.; Yao, S. The study of flow characteristics during the decomposition process in hydrate-bearing porous media using magnetic resonance imaging. Energies 2019, 12, 1736. [Google Scholar] [CrossRef] [Green Version]
- Spangenberg, E. Modeling of the influence of gas hydrate content on the electrical properties of porous sediments. J. Geophys. Res. Solid Earth 2001, 106, 6535–6548. [Google Scholar] [CrossRef]
- Kleinberg, R.; Flaum, C.; Griffin, D.; Brewer, P.; Malby, G.; Peltzer, E.; Yesinowski, J. Deep sea NMR: Methane hydrate growth habit in porous media and its relationship to hydraulic permeability, deposit accumulation, and submarine slope stability. J. Geophys. Res. Solid Earth 2003, 108, 2508. [Google Scholar] [CrossRef]
- Masuda, Y. Modeling and experimental studies on dissociation of methane gas hydrates in Berea sandstone cores. In Proceedings of the Third International Gas Hydrate Conference, Salt Lake City, UT, USA, 18–22 July 1999. [Google Scholar]
- Gardner, J.; Shor, A.; Jung, W. Acoustic imagery evidence for methane hydrates in the Ulleung Basin. Mar. Geophys. Res. 1998, 20, 495–503. [Google Scholar] [CrossRef]
- Bahk, J.-J.; Um, I.-K.; Holland, M. Core lithologies and their constraints on gas-hydrate occurrence in the East Sea, offshore Korea: Results from the site UBGH1-9. Mar. Pet. Geol. 2011, 28, 1943–1952. [Google Scholar] [CrossRef]
- Tak, H.; Byun, J.; Seol, S.J.; Yoo, D.G. Zero-offset vertical seismic profiling survey and estimation of gas hydrate concentration from borehole data from the Ulleung Basin, Korea. Mar. Pet. Geol. 2013, 47, 204–213. [Google Scholar] [CrossRef]
- Bahk, J.-J.; Kim, J.-H.; Kong, G.-S.; Park, Y.; Lee, H.; Park, Y.; Park, K.P. Occurrence of near-seafloor gas hydrates and associated cold vents in the Ulleung Basin, East Sea. Geosci. J. 2009, 13, 371–385. [Google Scholar] [CrossRef]
- Choi, J.; Kim, J.-H.; Bahk, J.-J.; Ryu, B.-J. Gas geochemistry for gas hydrate in the Ulleung Basin, East Sea. In Proceedings of the 7th International Conference on Gas Hydrates (ICGH2011), Edinburgh, UK, 17–21 July 2011; p. 105. [Google Scholar]
- Bahk, J.-J.; Kim, D.-H.; Chun, J.-H.; Son, B.-K.; Kim, J.-H.; Ryu, B.-J.; Torres, M.; Riedel, M.; Schultheiss, P. Gas hydrate occurrences and their relation to host sediment properties: Results from Second Ulleung Basin gas hydrate drilling expedition, East Sea. Mar. Pet. Geol. 2013, 47, 21–29. [Google Scholar] [CrossRef]
- Jung, J.; Espinoza, D.N.; Santamarina, J.C. Properties and phenomena relevant to CH4-CO2 replacement in hydrate-bearing sediments. J. Geophys. Res. Solid Earth 2010, 115, B10102. [Google Scholar] [CrossRef]
- Delli, M.L.; Grozic, J.L. Experimental determination of permeability of porous media in the presence of gas hydrates. J. Pet. Sci. Eng. 2014, 120, 1–9. [Google Scholar] [CrossRef]
- Darcy, H.P.G. Les Fontaines Publiques de la ville de Dijon. Exposition et Application des Principes à Suivre et des Formules à Employer dans les Questions de Distribution d’eau, etc; V. Dalamont: Paris, France, 1856. [Google Scholar]
- Servio, P.; Englezos, P. Effect of temperature and pressure on the solubility of carbon dioxide in water in the presence of gas hydrate. Fluid Phase Equilibria 2001, 190, 127–134. [Google Scholar] [CrossRef]
- Minagawa, H.; Ohmura, R.; Kamata, Y.; Ebinuma, T.; Narita, H.; Masuda, Y. Water permeability measurements of gas hydrate-bearing sediments. In Proceedings of the Fifth International Conference on Gas Hydrates (ICGH 5), Trondheim, Norway, 12–16 June 2005. [Google Scholar]
- Bear, J. Dynamics of Fluids in Porous Media; Courier Corporation: Chelmsford, MA, USA, 2013. [Google Scholar]
- Kim, A.-R.; Kim, J.-T.; Cho, G.-C.; Lee, J.Y. Methane Production from Marine Gas Hydrate Deposits in Korea: Thermal-Hydraulic-Mechanical Simulation on Production Wellbore Stability. J. Geophys. Res. Solid Earth 2018, 123, 9555–9569. [Google Scholar] [CrossRef]
- Kim, A. THM Coupled Numerical Analysis of Gas Production from Methane Hydrate Deposits in the Ulleung Basin in Korea. Ph.D. Thesis, Korea Advanced Institute of Science and Technology (KAIST), Daejeon, Korea, 2016. [Google Scholar]
- Manual, I.F.D. Fast Lagrangian Analysis Continua–Version 7.0 User Manual; Itasca Consulting Group: Minneapolis, MN, USA, 2015. [Google Scholar]
- Kim, H.; Cho, G.; Lee, J. Geotechnical and geophysical properties of deep oceanic sediments recovered from UBGH2 sites in the Ulleung Basin, East Sea, Offshore Korea. Mar. Pet. Geol. 2013, 47, 56–65. [Google Scholar] [CrossRef]
- Uchida, S.; Soga, K.; Yamamoto, K. Critical state soil constitutive model for methane hydrate soil. J. Geophys. Res. Solid Earth 2012, 117, B03209. [Google Scholar] [CrossRef]
- Kim, J.-T.; Kim, A.-R.; Cho, G.-C.; Kang, C.-W.; Lee, J.Y. The Effects of Coupling Stiffness and Slippage of Interface between the Wellbore and Unconsolidated Sediment on the Stability Analysis of the Wellbore Under Gas Hydrate Production. Energies 2019, 12, 4177. [Google Scholar] [CrossRef] [Green Version]
- Sloan, E. Clathrate Hydrates of Natural Gases; Marcel Decker. Inc.: New York, NY, USA, 1998. [Google Scholar]
- Klar, A.; Uchida, S.; Soga, K.; Yamamoto, K. Explicitly coupled thermal flow mechanical formulation for gas-hydrate sediments. SPE J. 2013, 18, 196–206. [Google Scholar] [CrossRef]
- Lu, J.; Li, D.; He, Y.; Shi, L.; Liang, D.; Xiong, Y. Experimental Study of Sand Production during Depressurization Exploitation in Hydrate Silty-Clay Sediments. Energies 2019, 12, 4268. [Google Scholar] [CrossRef] [Green Version]
Figure 1.
Location of the Ulleung Basin Gas Hydrate drilling expedition 2 (UBGH2-6) (modified from [8]).
Figure 1.
Location of the Ulleung Basin Gas Hydrate drilling expedition 2 (UBGH2-6) (modified from [8]).
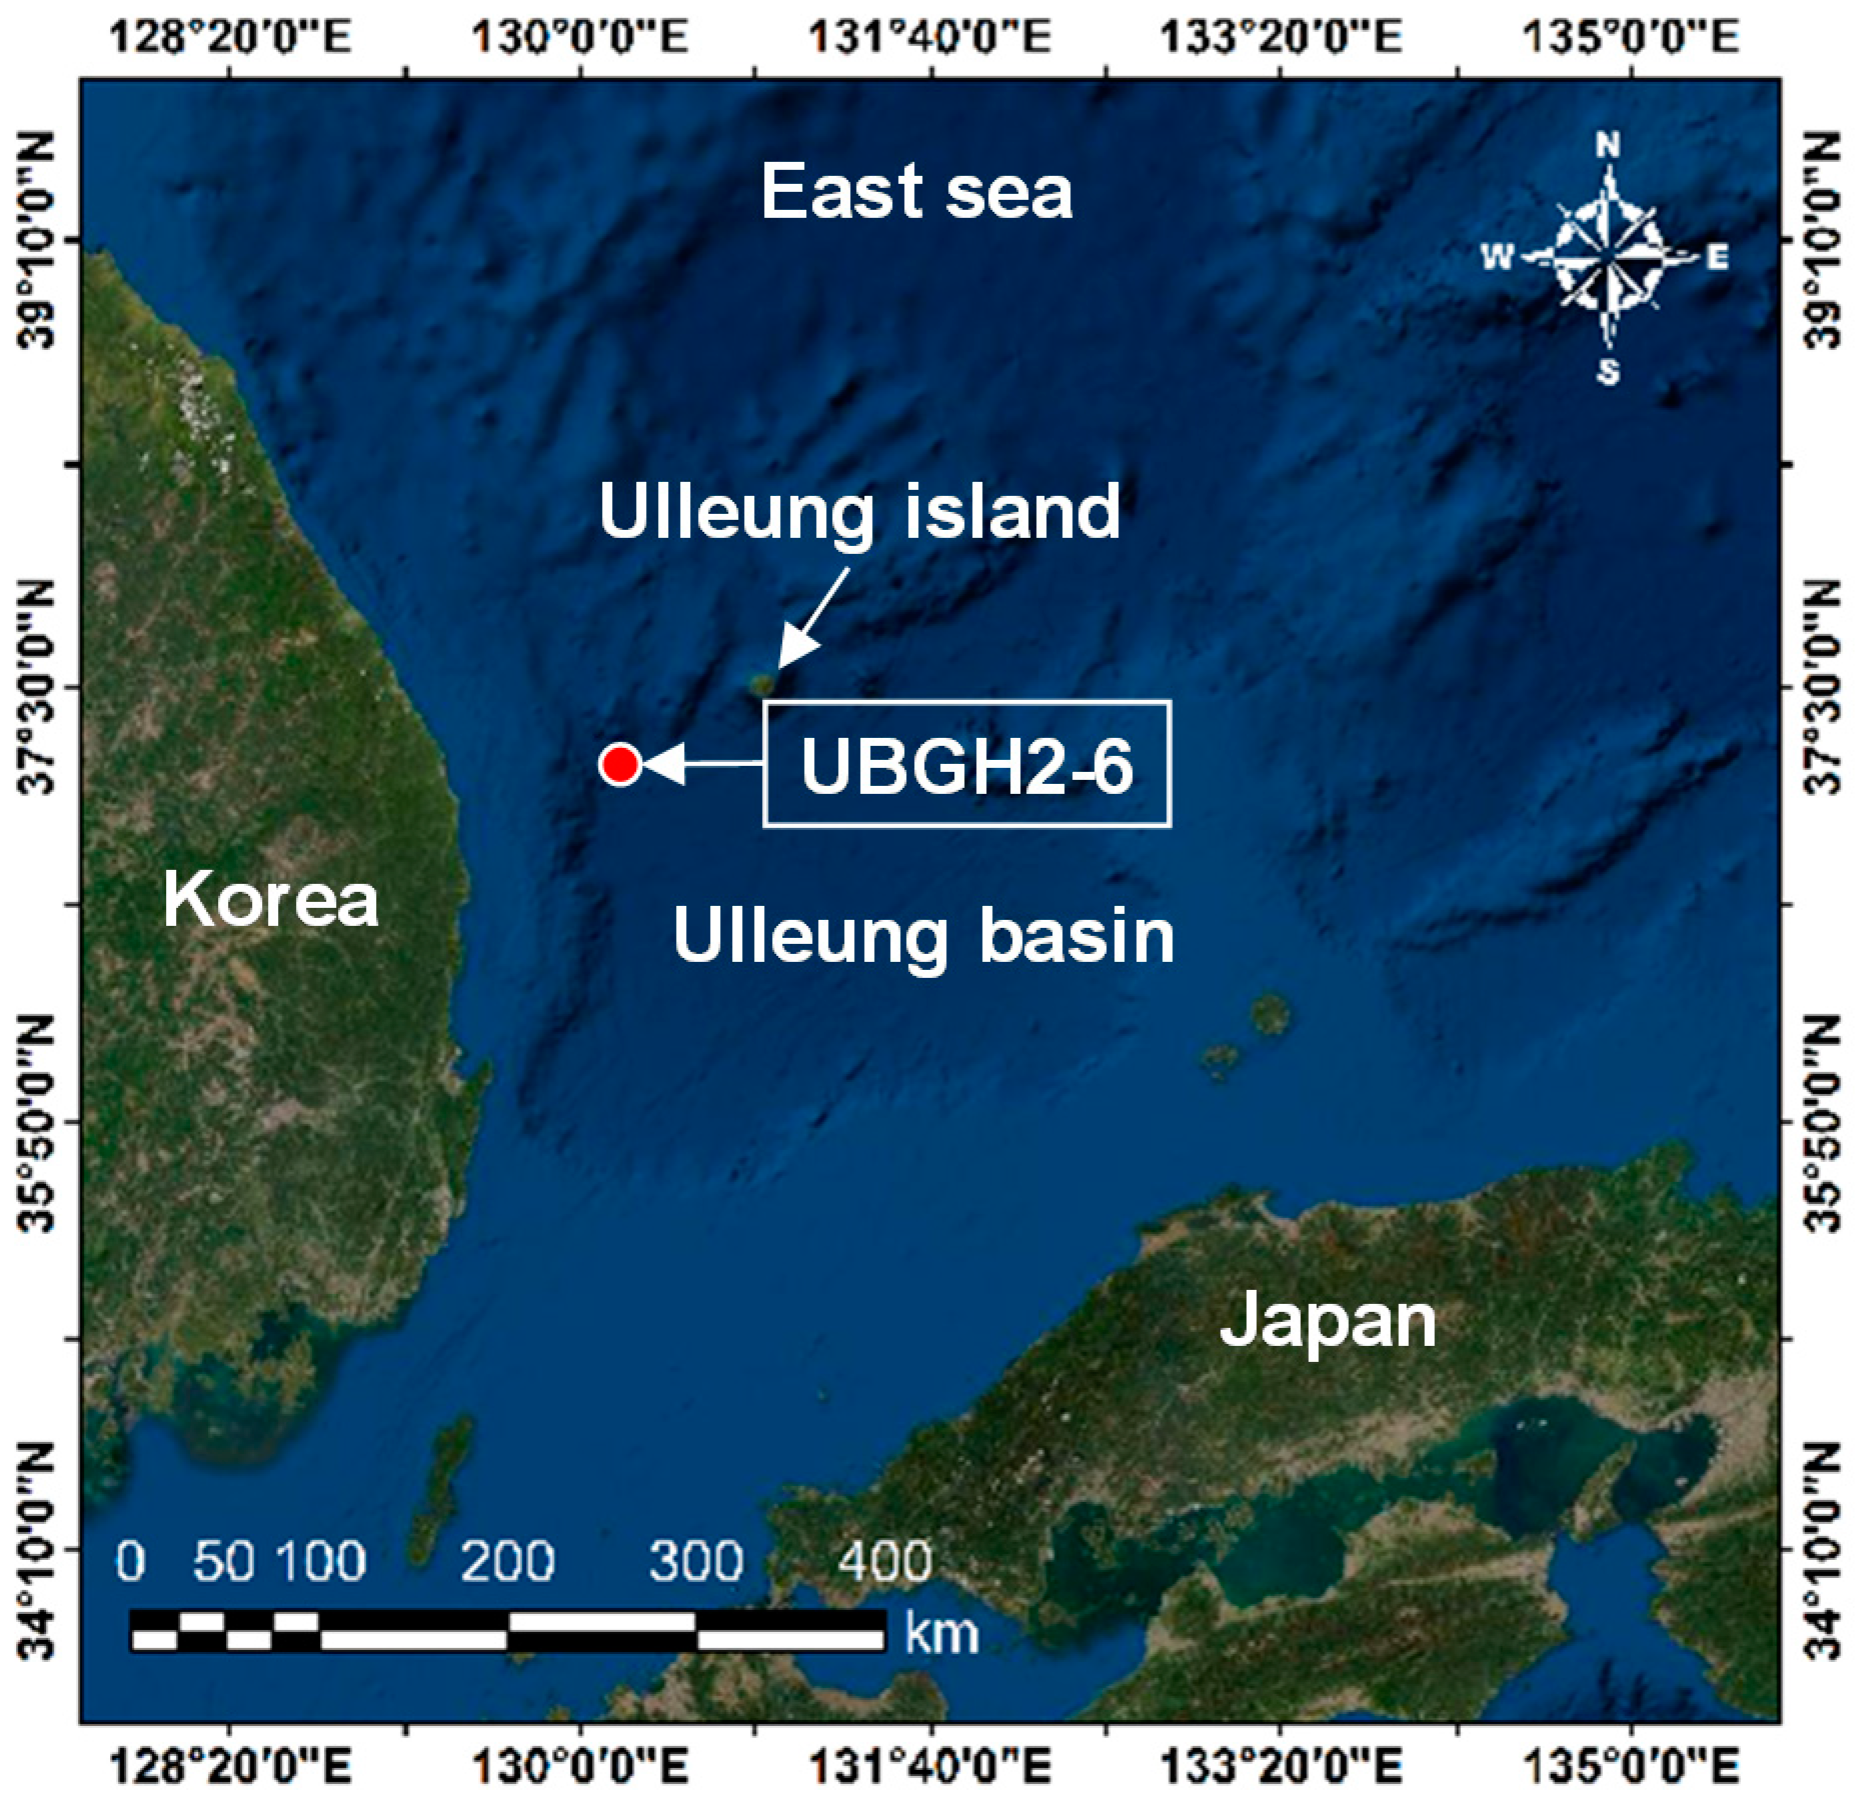
Figure 2.
Particle size distribution of the UBGH2-6 core sample and artificial specimen.
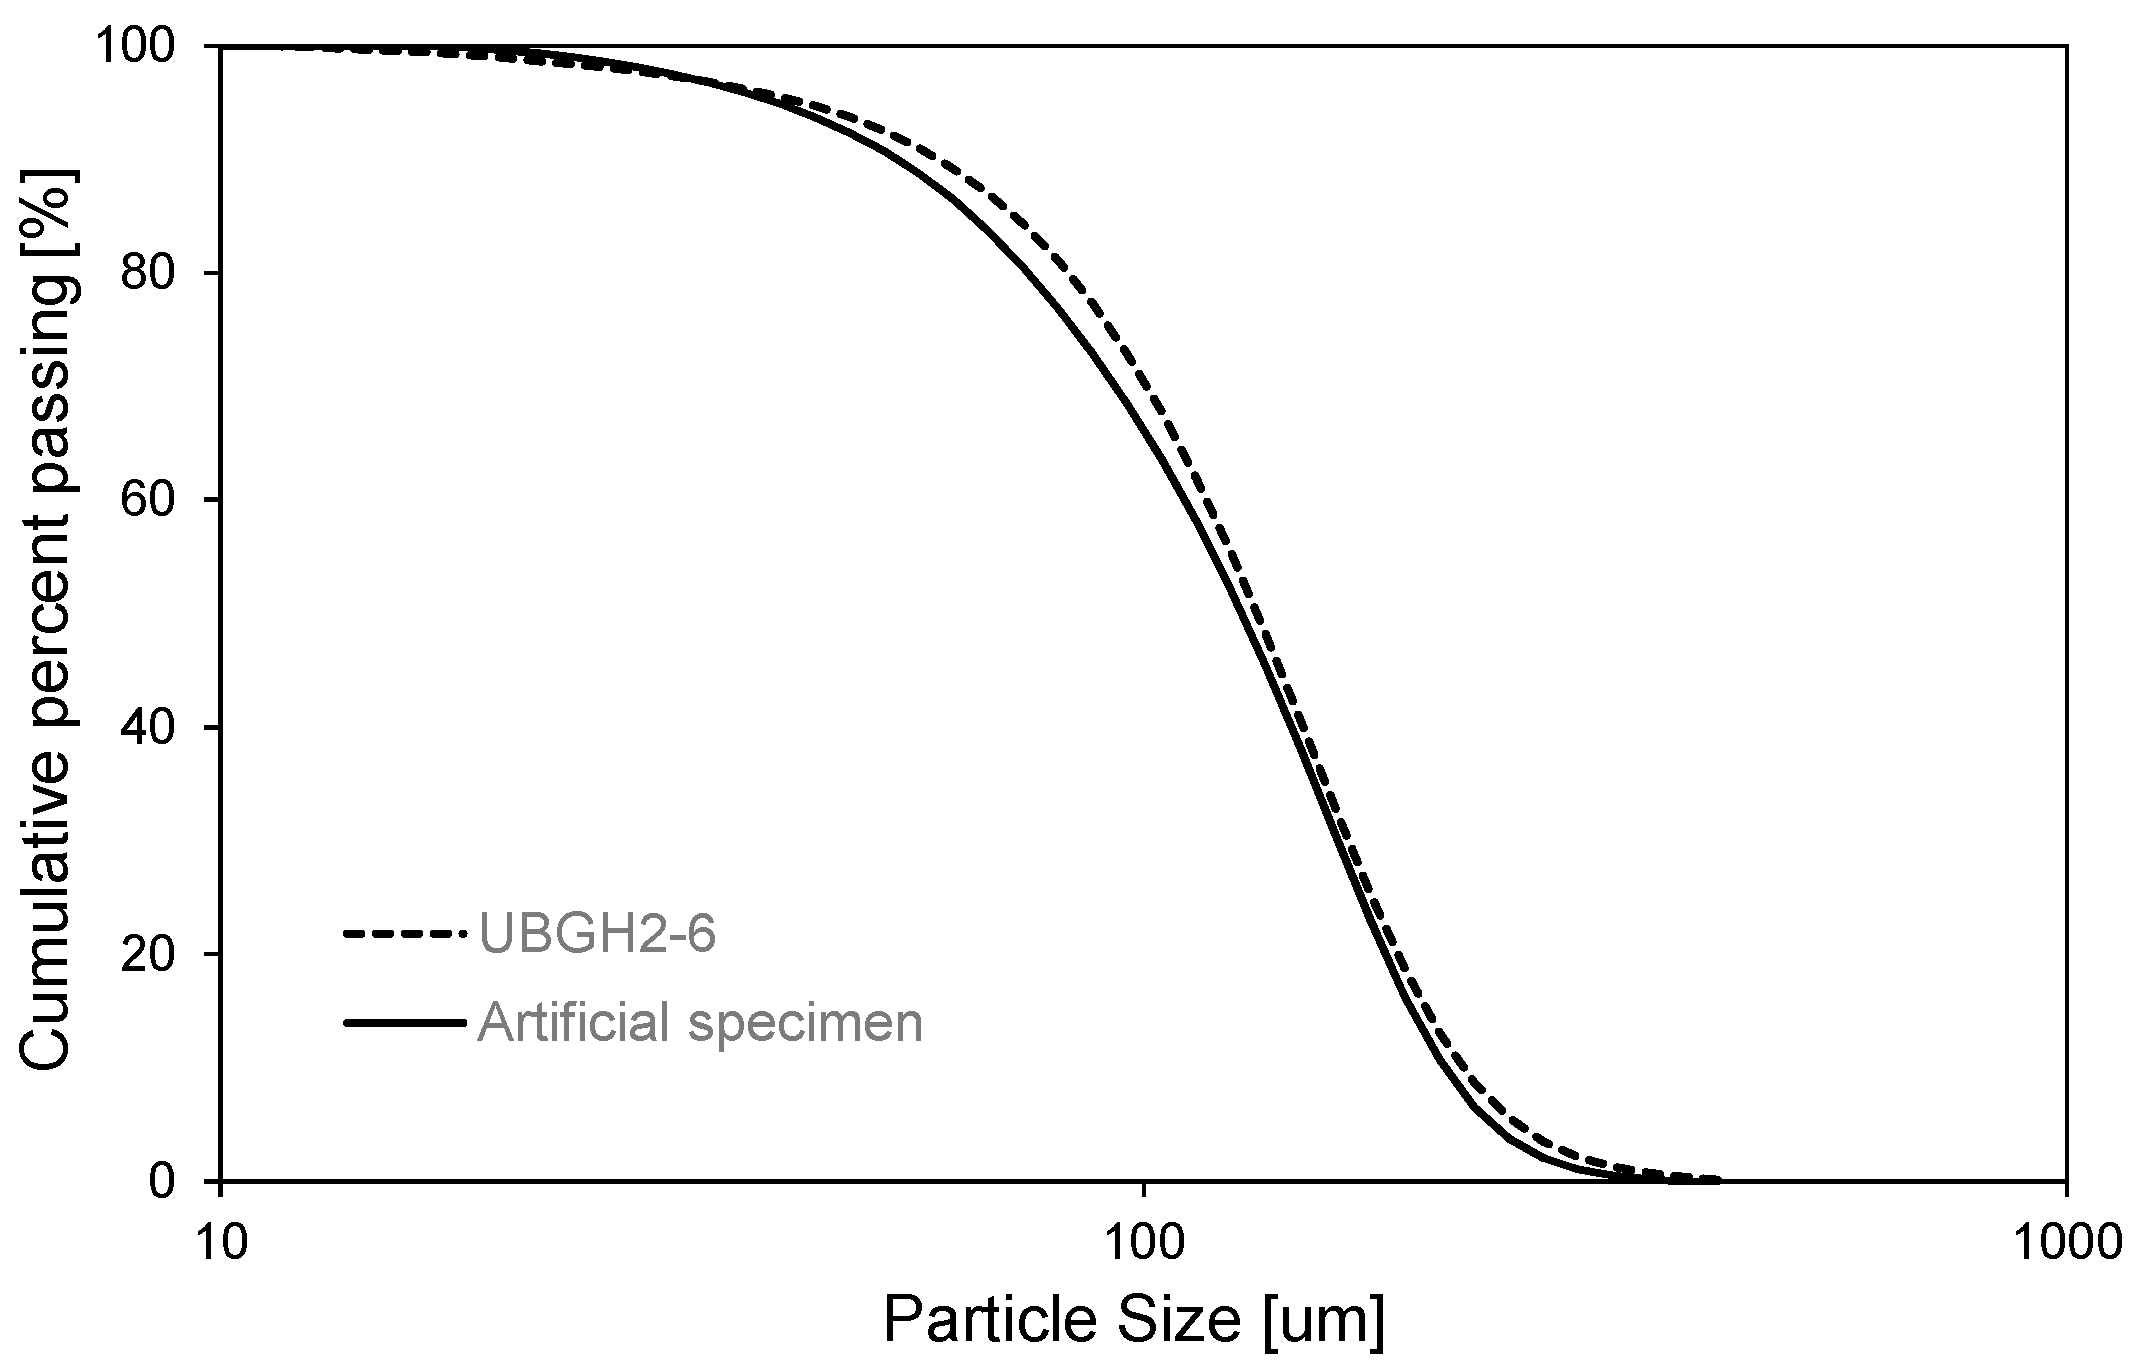
Figure 3.
Experimental setup schematic.
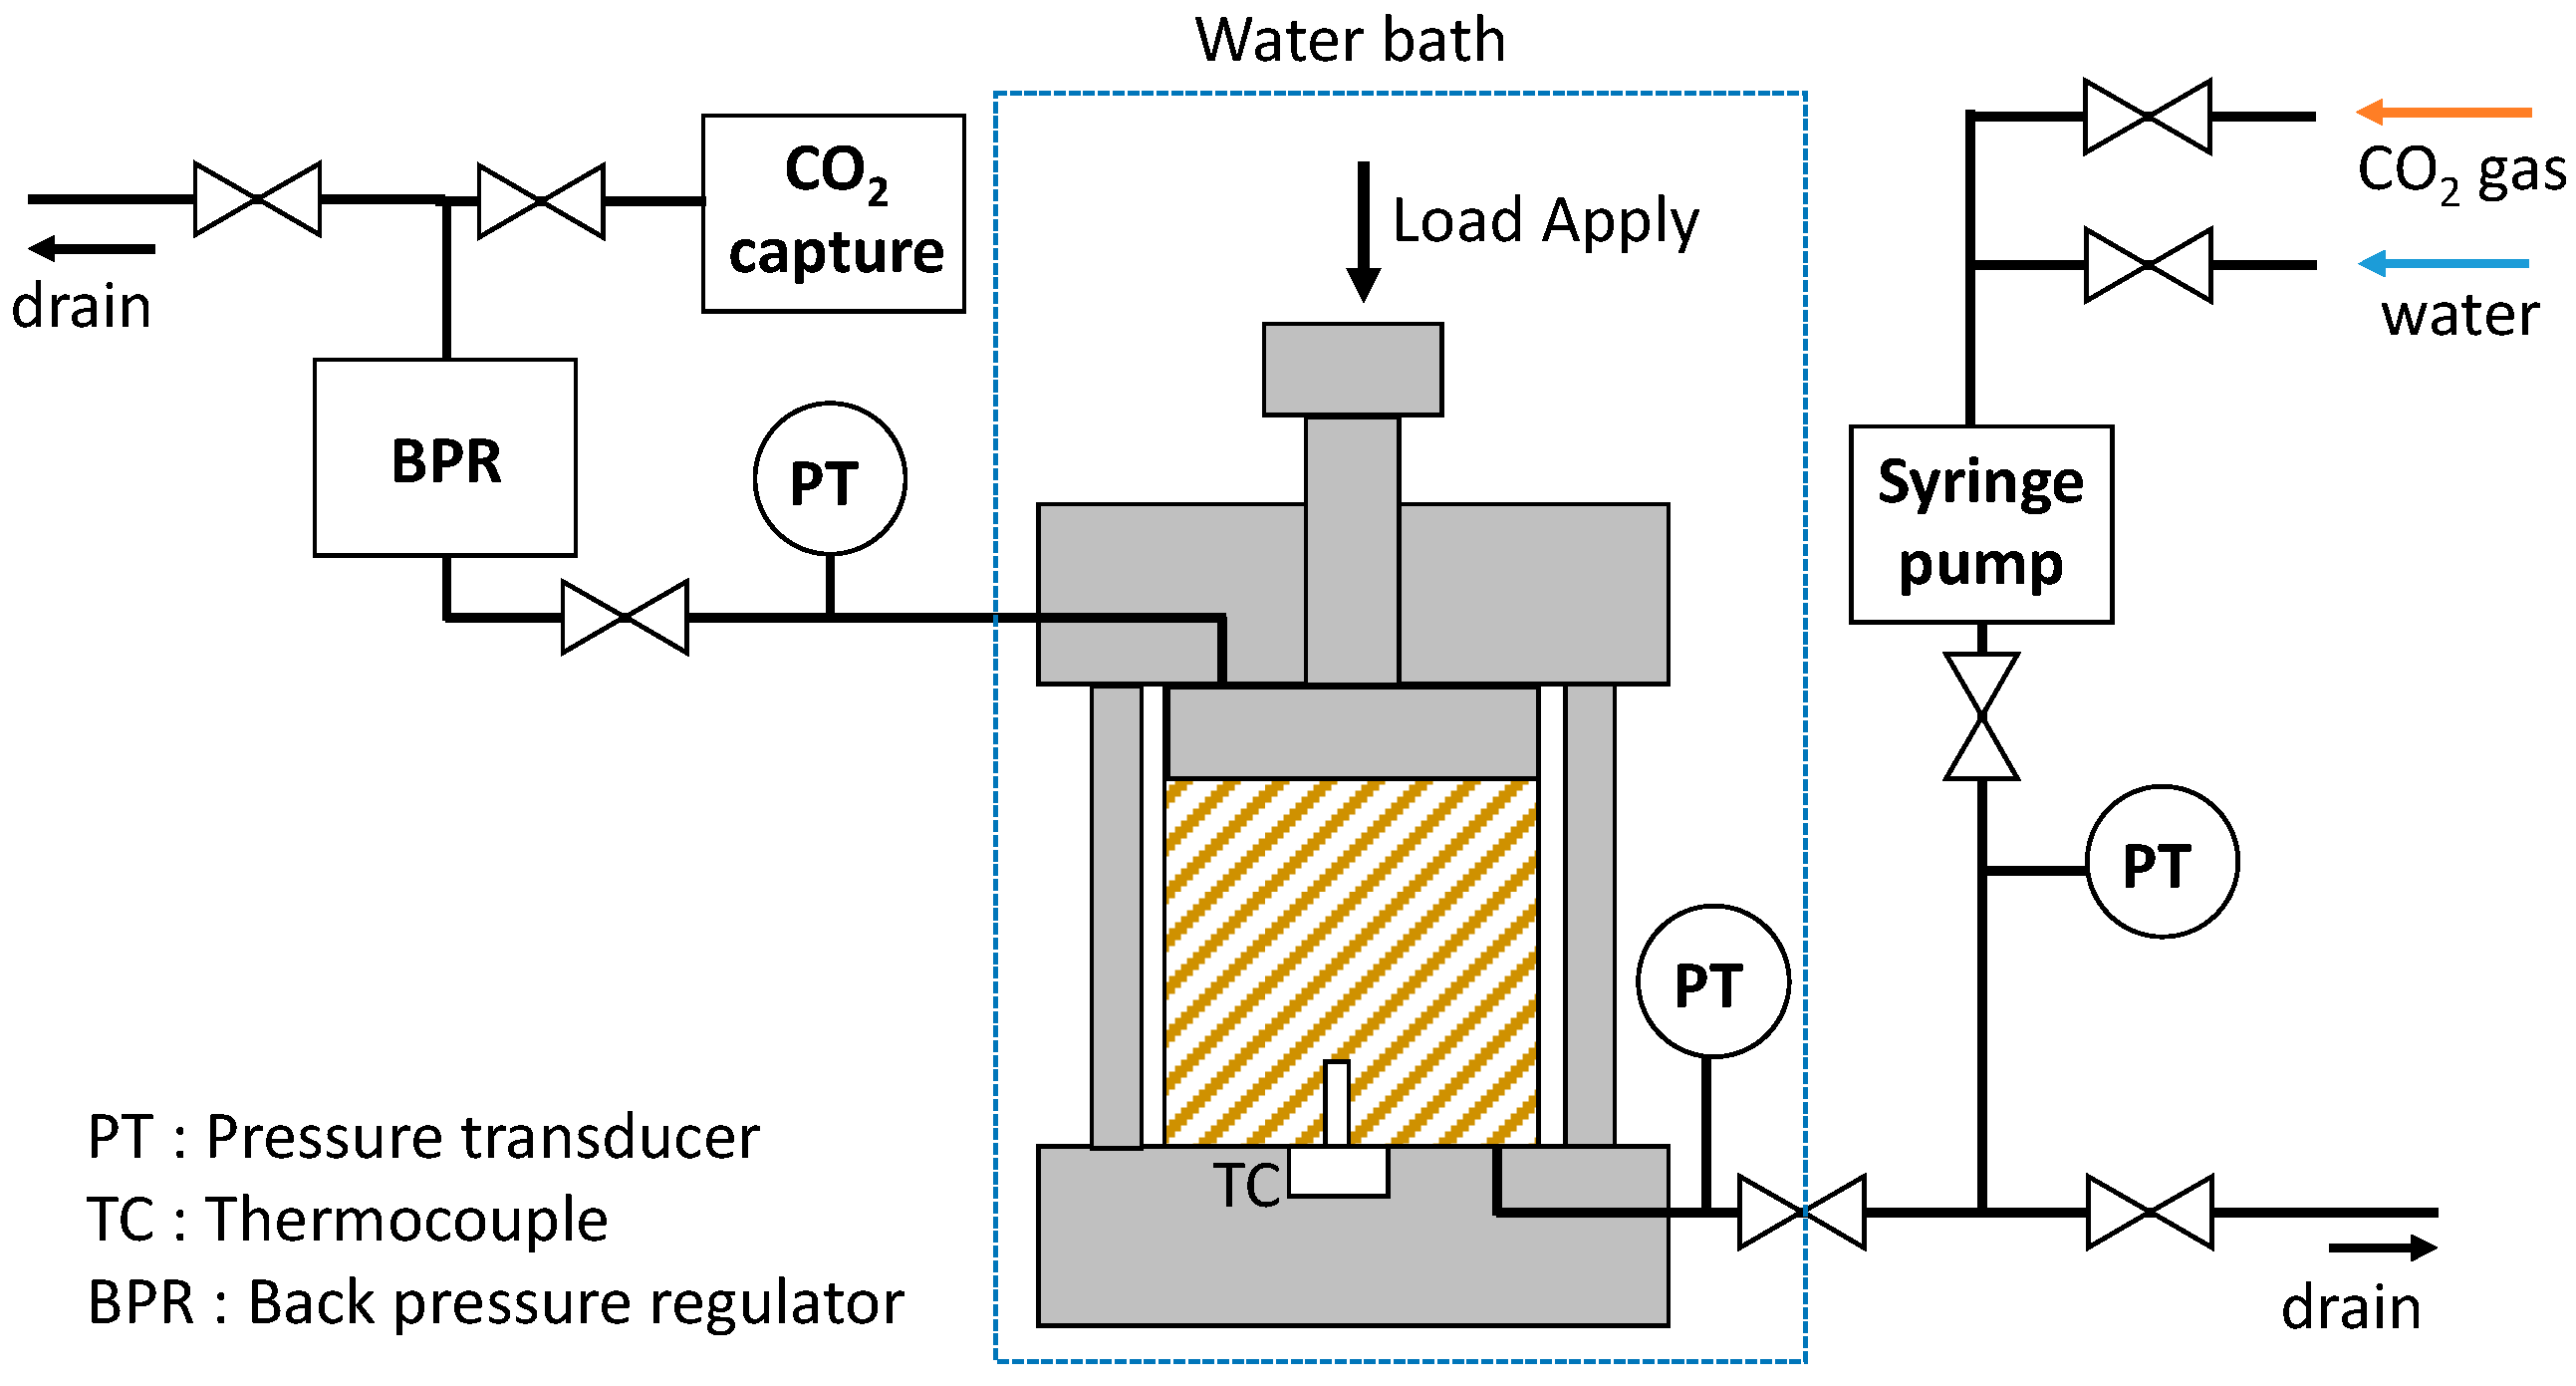
Figure 4.
Permeability change with hydrate saturation: (a) experimental results (UBGH2-6); (b) comparison with experimental results in the literature.
Figure 4.
Permeability change with hydrate saturation: (a) experimental results (UBGH2-6); (b) comparison with experimental results in the literature.

Figure 5.
Comparison between proposed model and existing permeability models.

Figure 6.
Application of proposed experimental model to the other experimental test data.

Figure 7.
UBGH2-6 geometry used for numerical simulation (modified from [35]).
Figure 7.
UBGH2-6 geometry used for numerical simulation (modified from [35]).
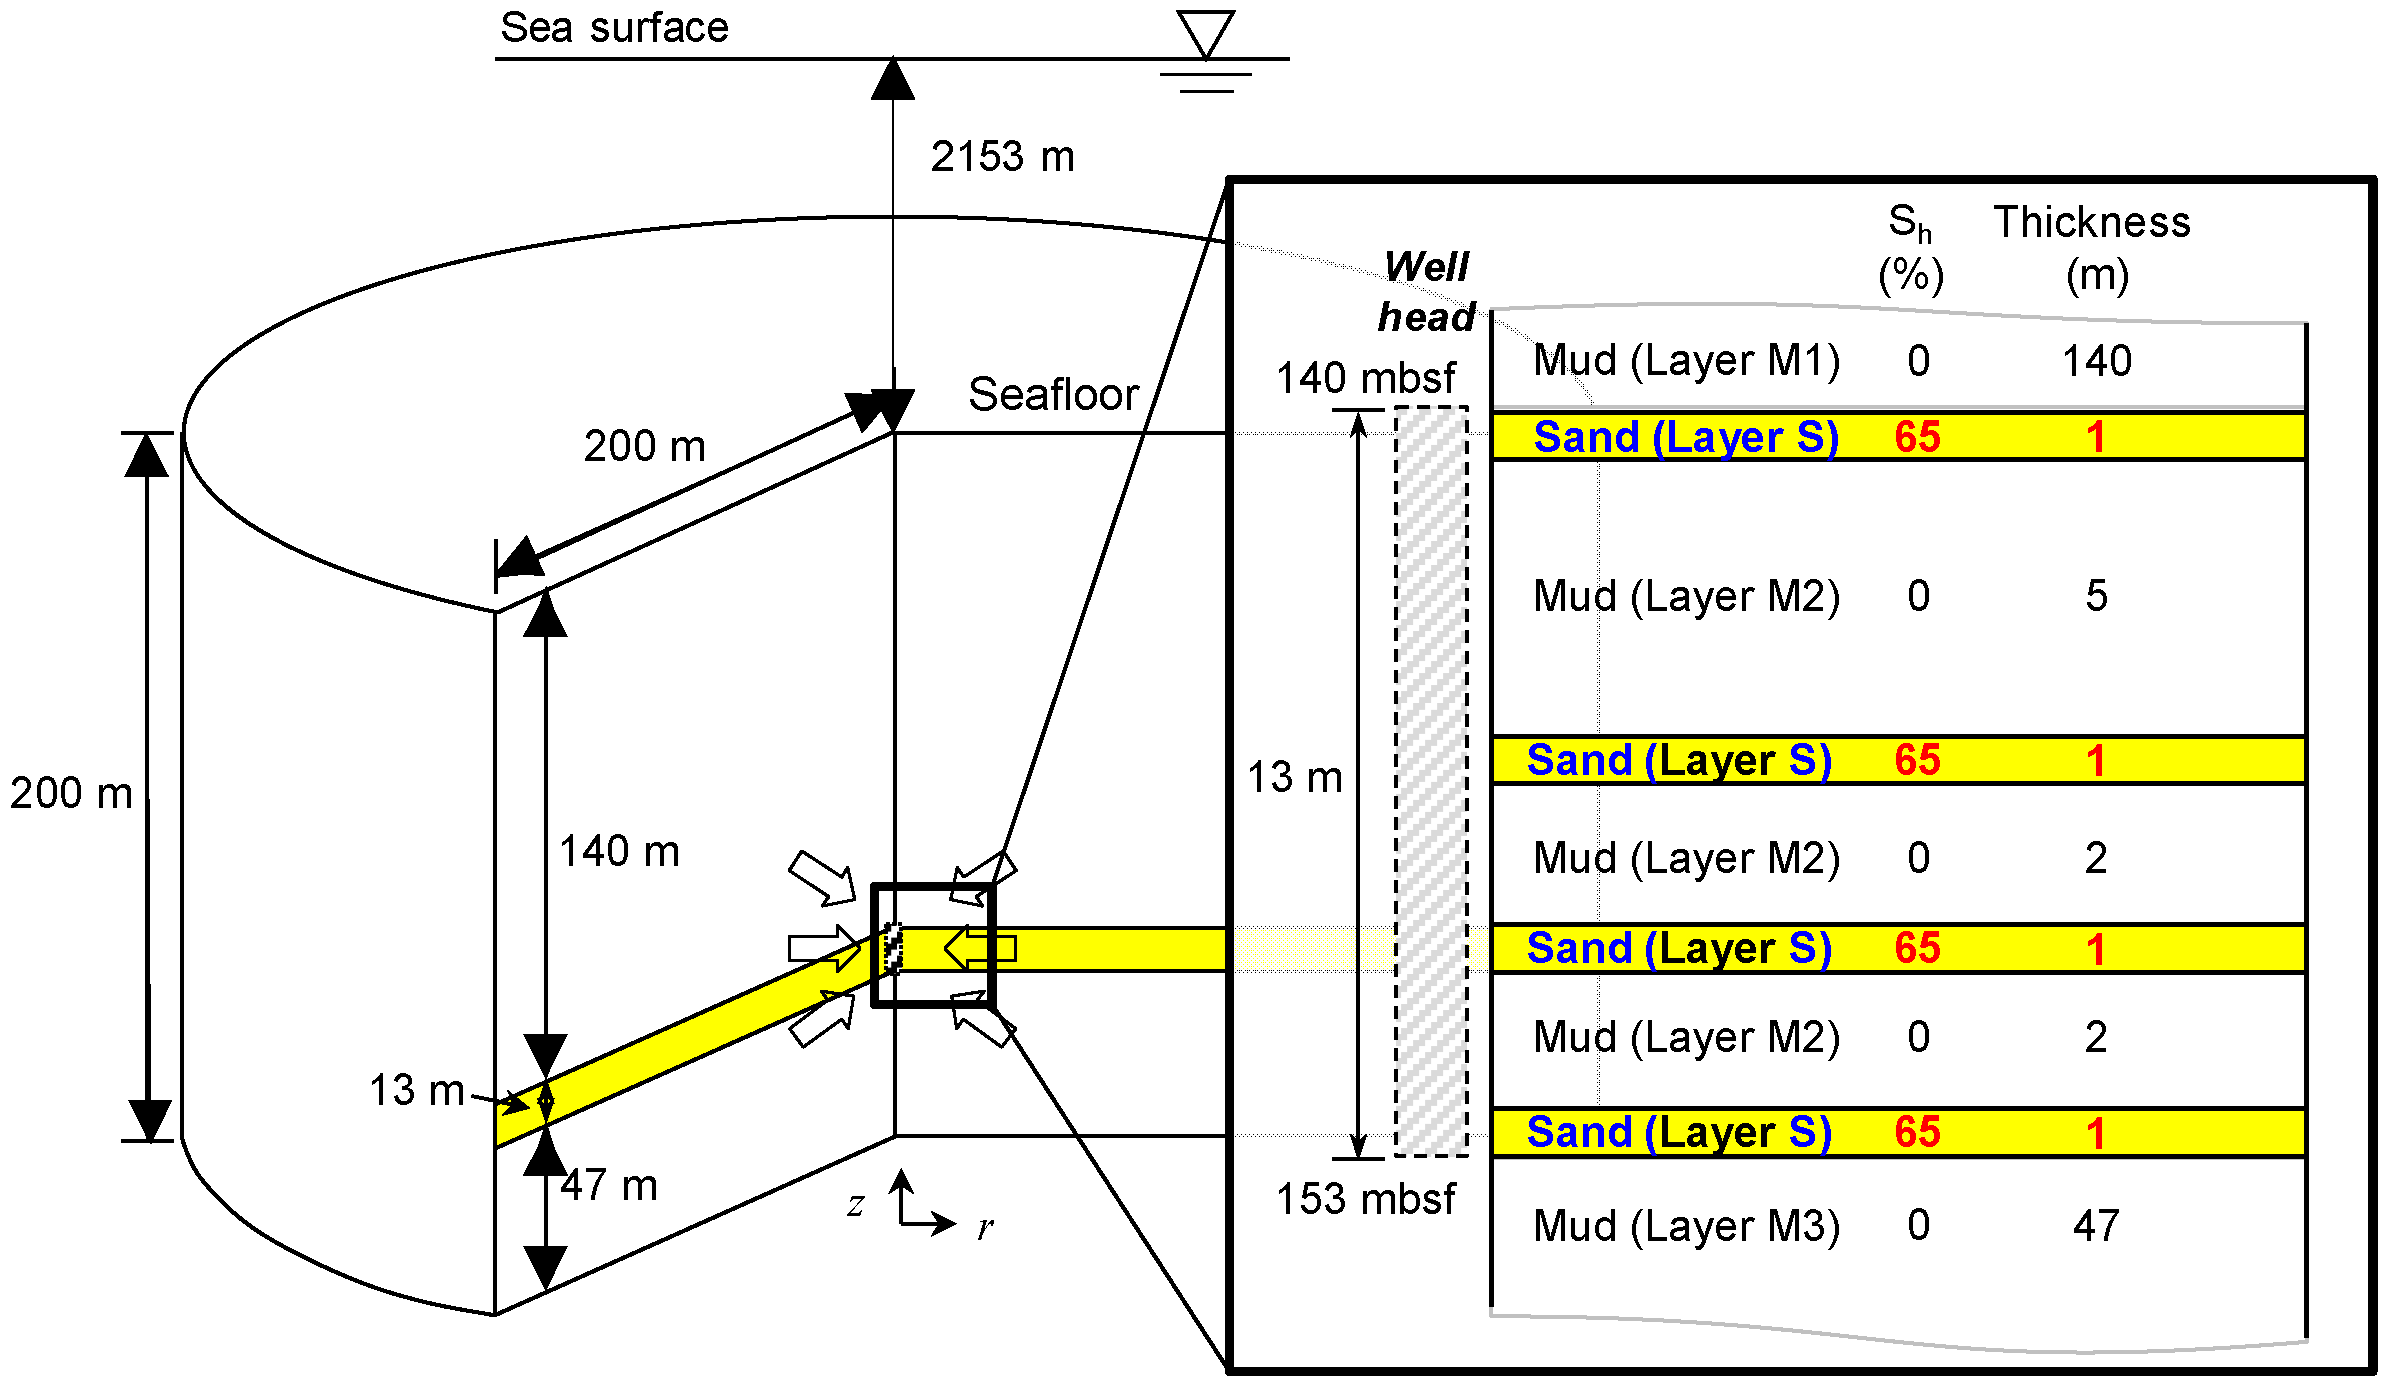
Figure 8.
Water and gas production after 14 days for studied permeability models: (a) water production rate; (b) cumulative water production; (c) gas production rate; (d) cumulative gas production.
Figure 8.
Water and gas production after 14 days for studied permeability models: (a) water production rate; (b) cumulative water production; (c) gas production rate; (d) cumulative gas production.
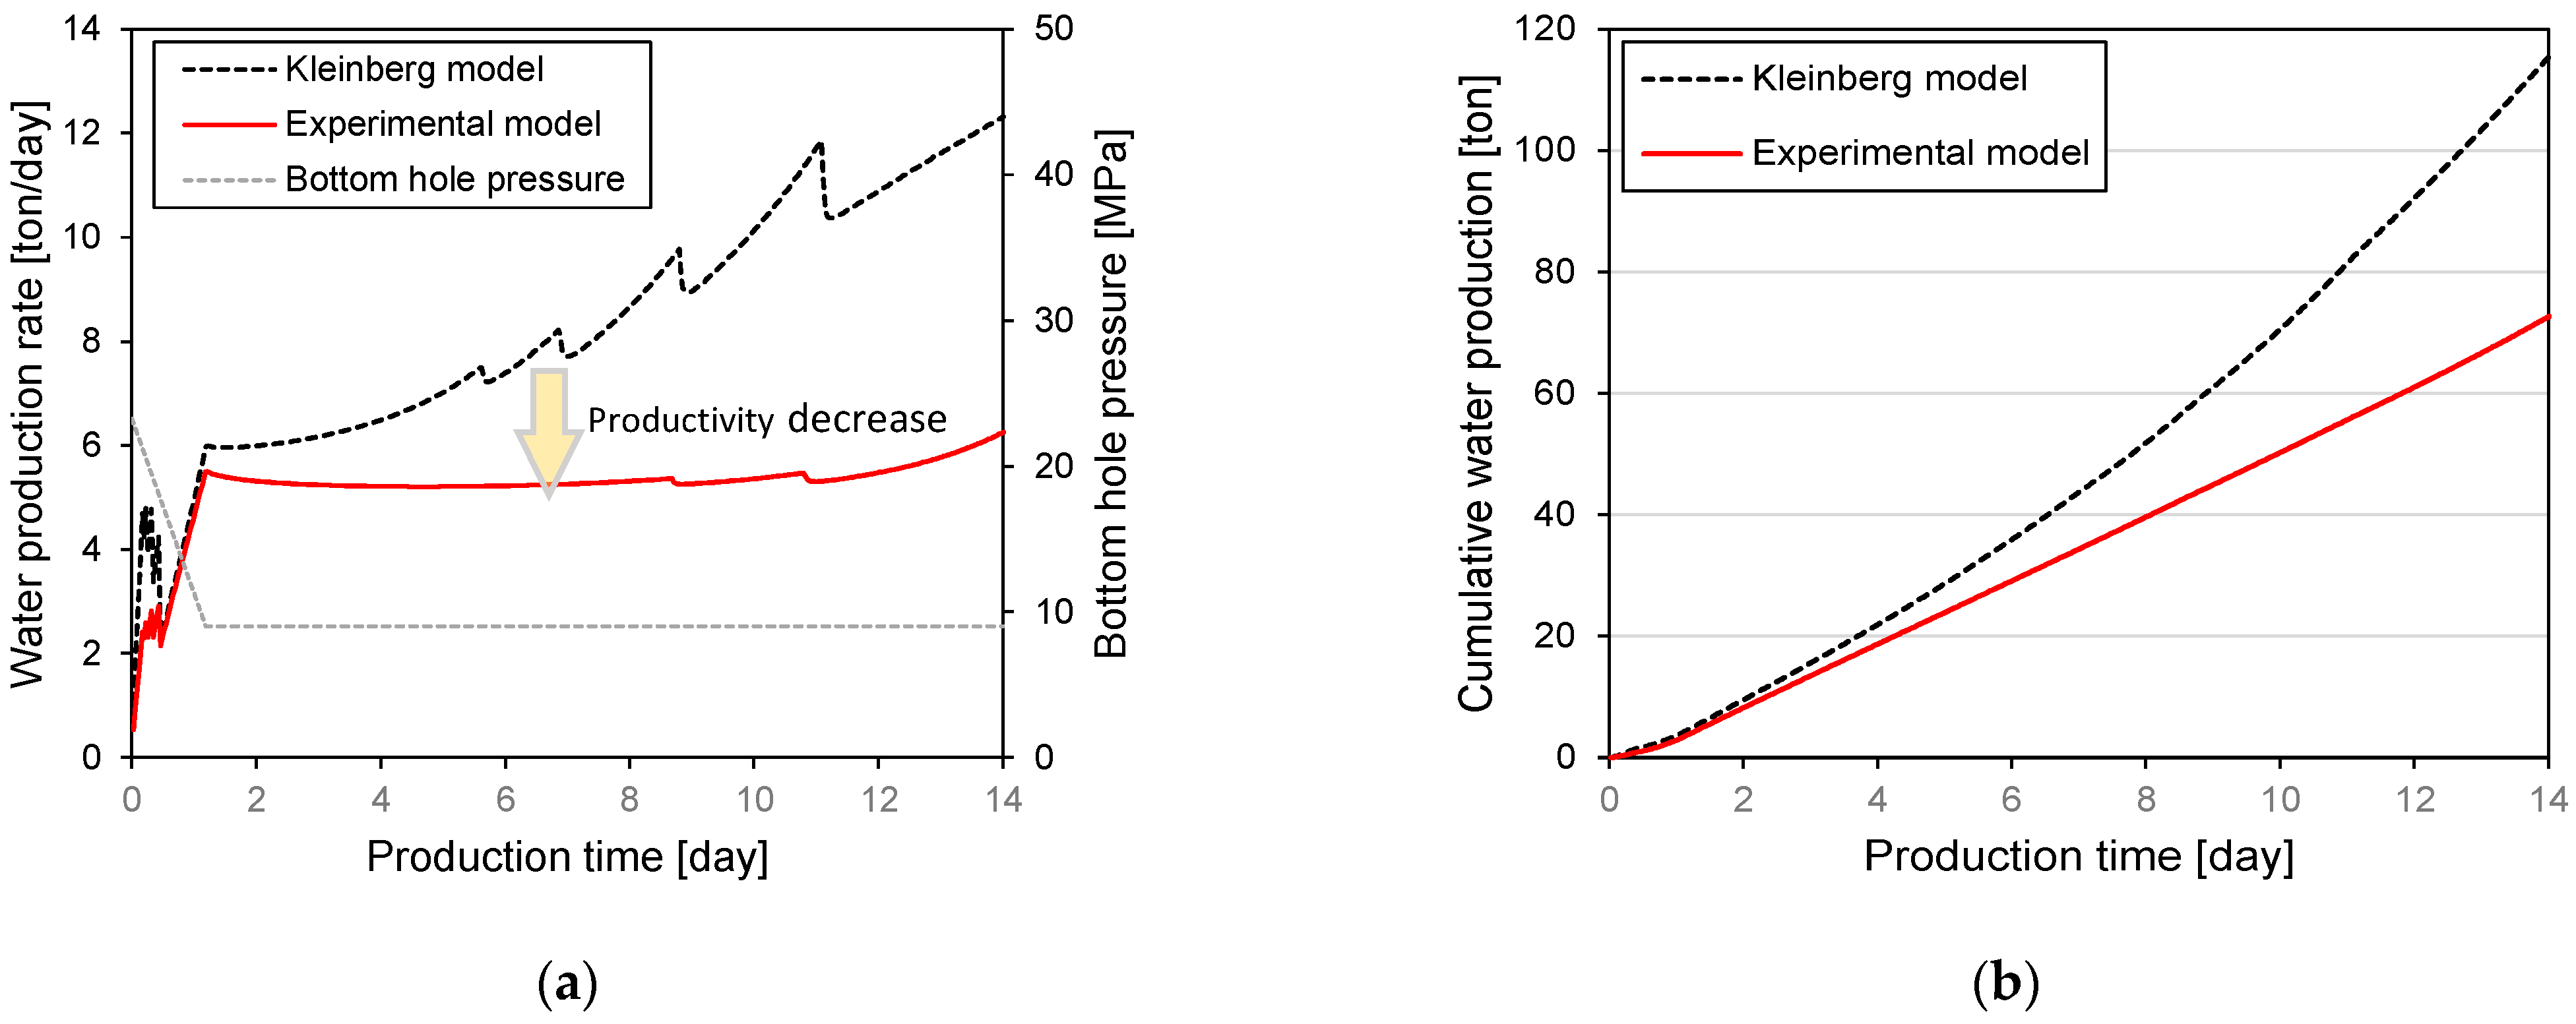
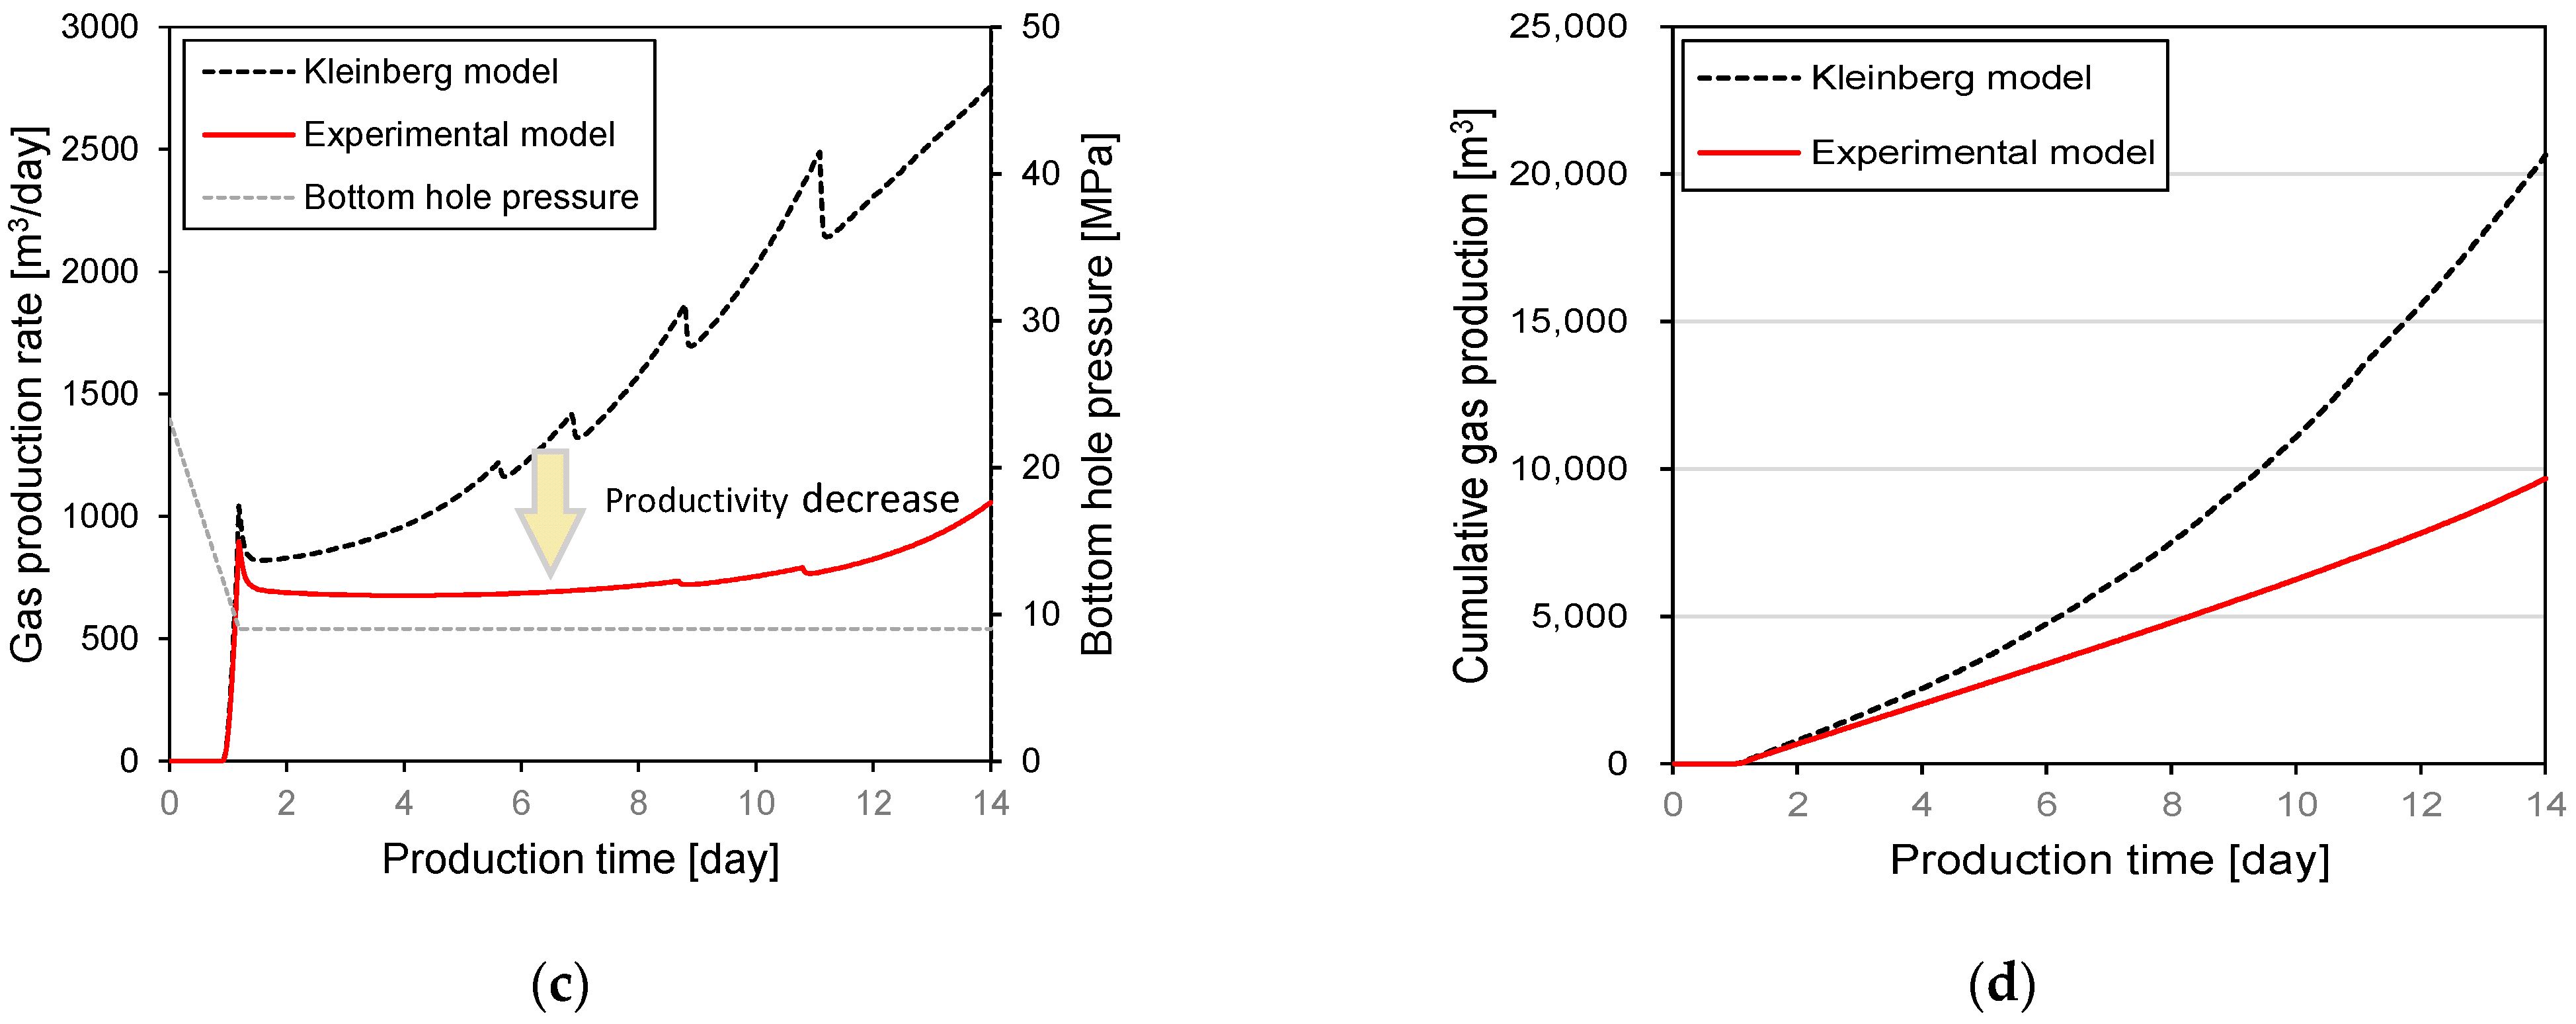
Figure 9.
Water and gas production after 14 days for different initial gas hydrate saturations where the experimentally determined permeability model was used: (a) water production rate; (b) cumulative water production; (c) gas production rate; (d) cumulative gas production.
Figure 9.
Water and gas production after 14 days for different initial gas hydrate saturations where the experimentally determined permeability model was used: (a) water production rate; (b) cumulative water production; (c) gas production rate; (d) cumulative gas production.
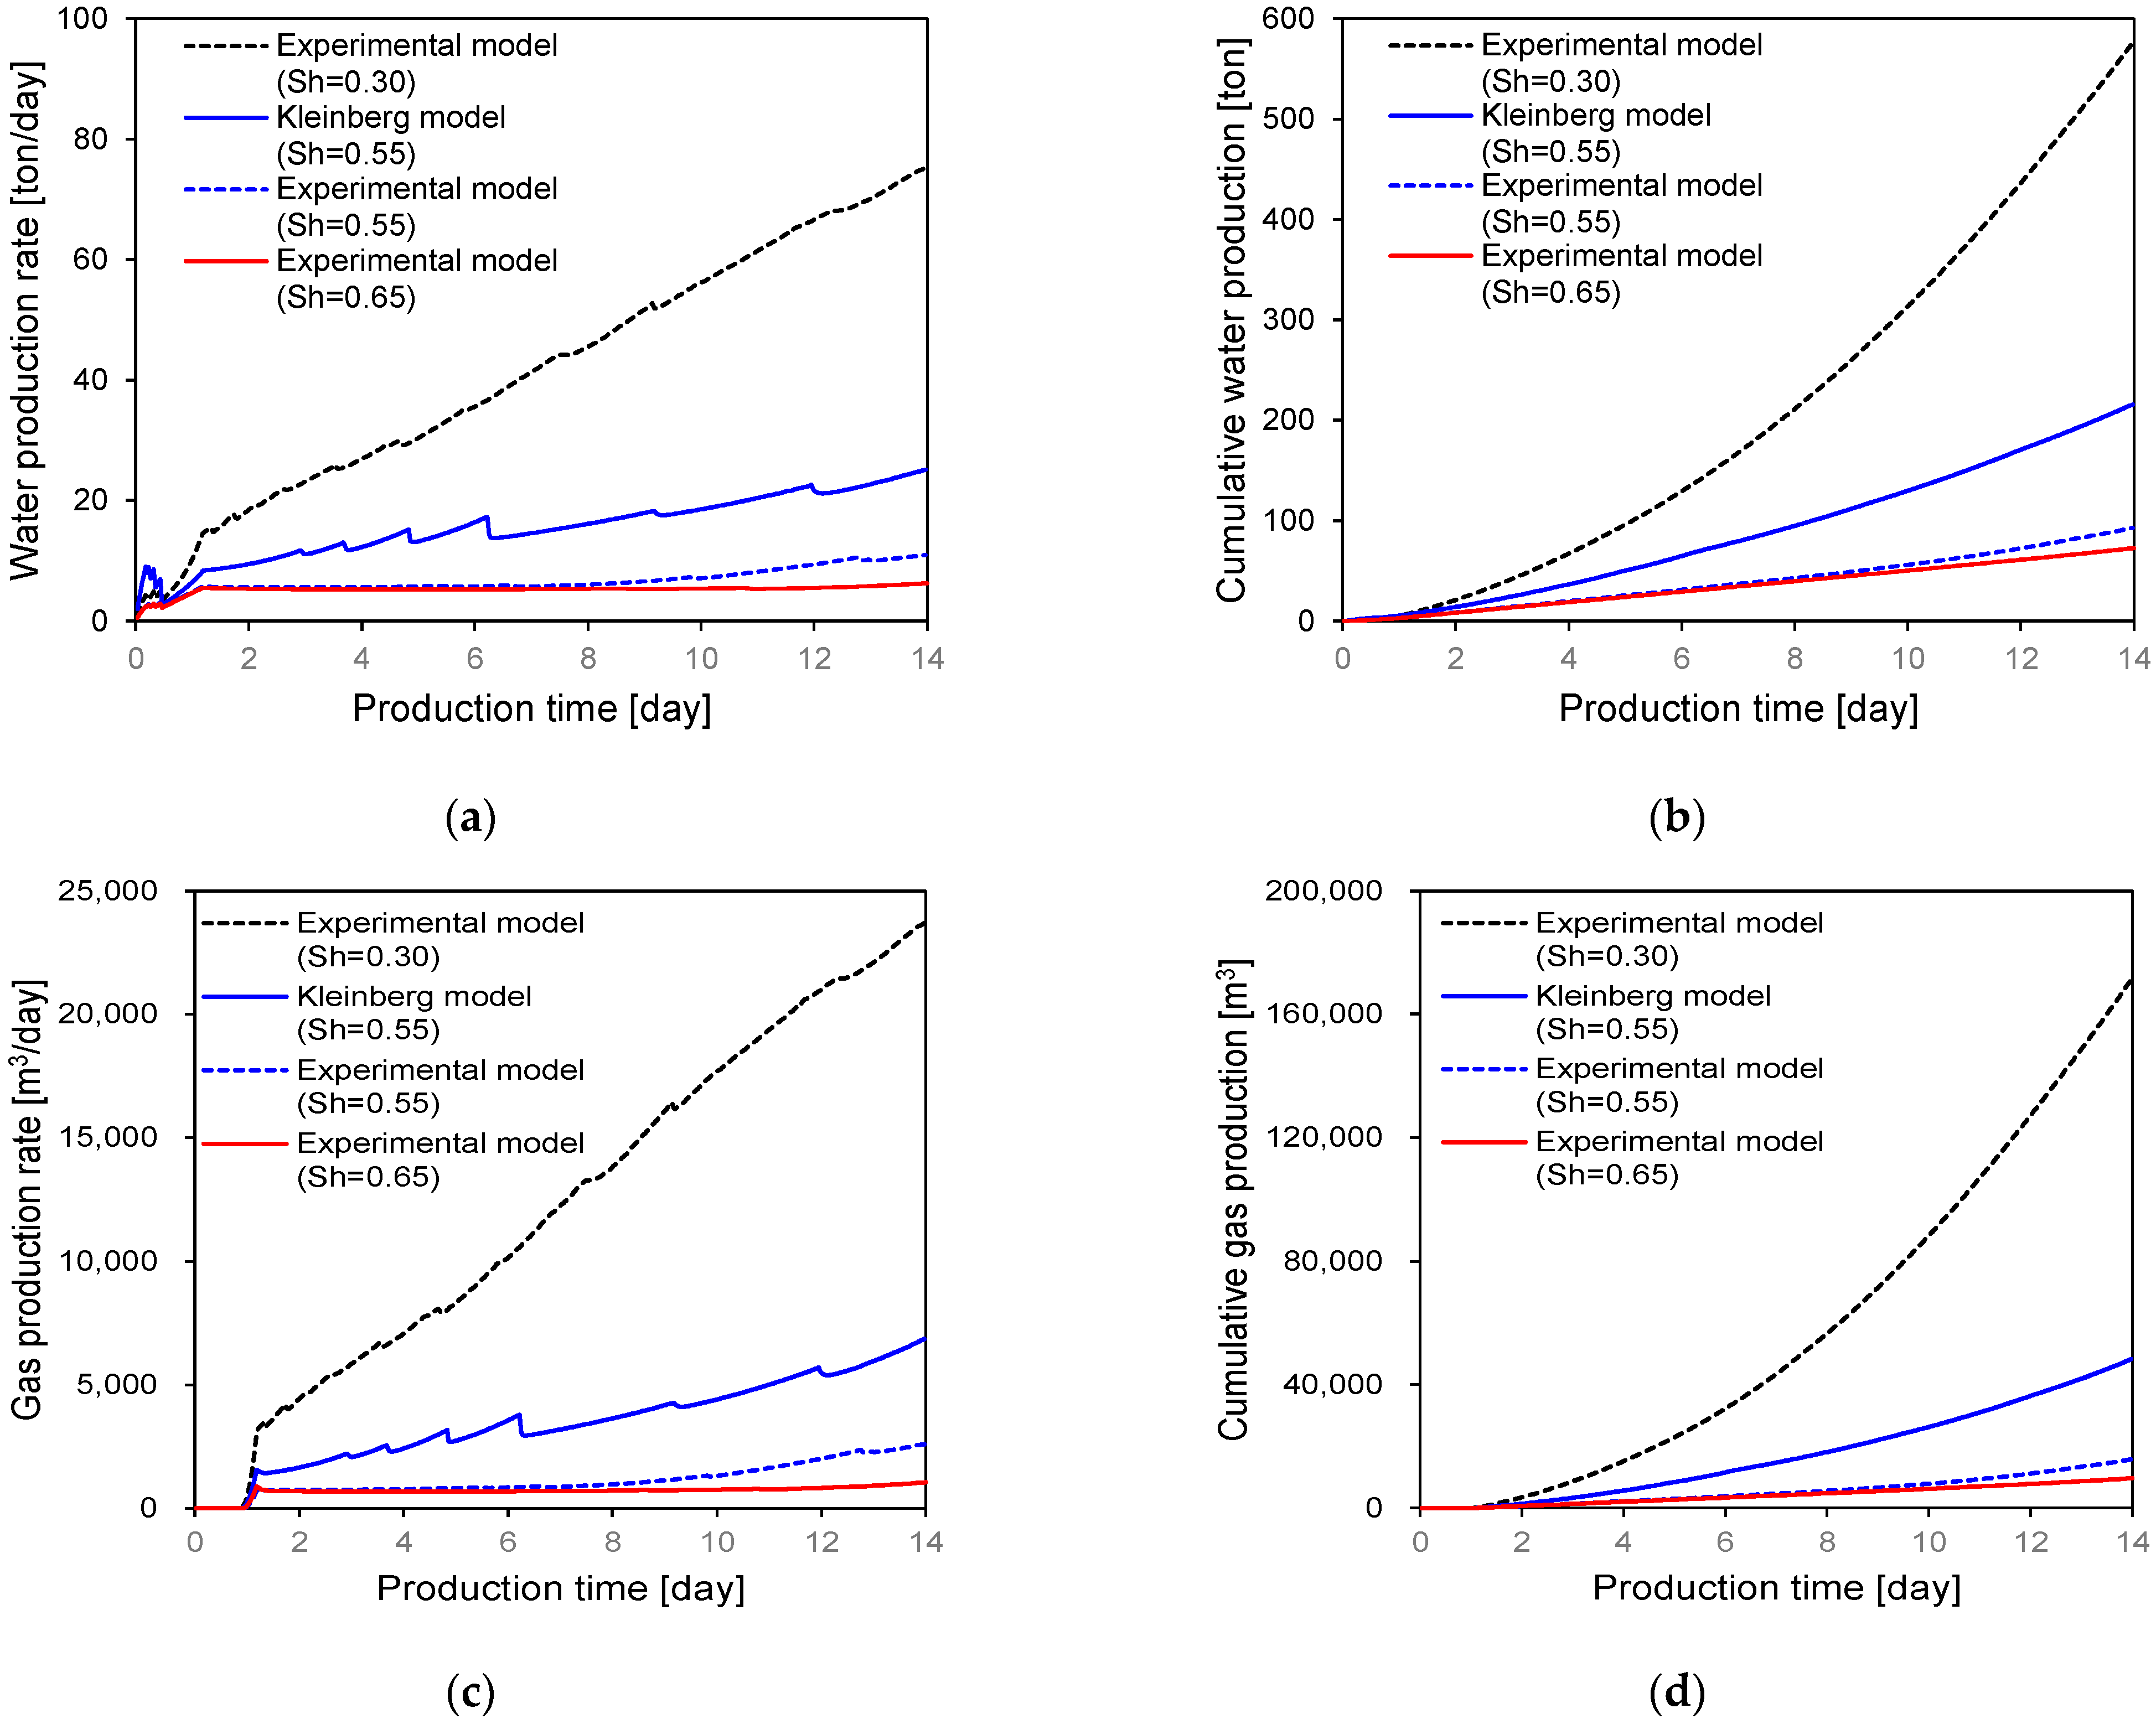
Figure 10.
Indirect comparative verification analysis between the Kleinberg model and experimental model using Mallik test data: (a) gas production rate; (b) cumulative gas production.
Figure 10.
Indirect comparative verification analysis between the Kleinberg model and experimental model using Mallik test data: (a) gas production rate; (b) cumulative gas production.

Figure 11.
Subsidence and heave of sediment near the production well: (a) subsidence on sea floor; (b) subsidence at production well head; (c) ground heave at production well bottom.
Figure 11.
Subsidence and heave of sediment near the production well: (a) subsidence on sea floor; (b) subsidence at production well head; (c) ground heave at production well bottom.

Table 1.
Effective permeability models.
| Theoretical Model | Parameter | Remark | Reference |
|---|---|---|---|
| n = 1.5 | Grain coating | Kleinberg [20,21] | |
| n = 0.7Sh + 0.3 | Pore filling | ||
| Capillary tube | Masuda [22] |
Note: Keff is the effective permeability in the presences of hydrate, Kint is the intrinsic permeability of sediment without hydrate, Sh is the hydrate saturation.
Table 2.
Measured permeability data (porosity = 0.48).
| Hydrate saturation [-] | 0.00 | 0.05 | 0.10 | 0.15 | 0.22 | 0.28 | 0.35 | 0.44 | 0.52 | 0.61 |
| Permeability [mD] | 209.92 | 134.31 | 67.65 | 33.83 | 9.95 | 5.07 | 2.39 | 1.59 | 1.49 | 1.29 |
| Uncertainty of Permeability 1 [mD] |
1 The uncertainty of the measured permeability was derived based on the accuracy of pressure transducer (0.25% BFSL).
| Parameter | Value | Parameter | Value | ||
|---|---|---|---|---|---|
| Geologic conditions | Hydrostatic pressure at sea floor (MPa) | 21.9 | Mechanical properties | Bulk density of sand (Layer S, kg/m3) | 1700 |
| Temperature at sea floor (°C) | 0.482 | Bulk density of mud (Layer M1, kg/m3) | 1500 | ||
| Geothermal gradient (°C/km) | 112 | Bulk density of mud (Layer M2, kg/m3) | 1610 | ||
| Hydrate occurrence zone (mbsf) | 140–153 | Bulk density of mud (Layer M3, kg/m3) | 1640 | ||
| Initial hydrate saturation (Sh) in sand (Layer S, %) | 65 | Methane hydrate density (kg/m3) | 910 | ||
| Initial hydrate saturation in mud (%) | 0.0 | Young modulus of sand (Layer S, MPa) | 40 | ||
| Thermal properties | Thermal conductivity of sand (W/m K) | 1.45 | Young modulus of mud (Layer M2, MPa) | 18 | |
| Thermal conductivity of mud (W/m K) | 1.00 | Young modulus of mud (Layer M3, MPa) | 20 | ||
| Hydraulic properties | Intrinsic permeability of mud (mD) | 0.21 | Poisson ratio of sand (Layer S, -) | 0.25 | |
| Intrinsic permeability of sand (mD) | 209 | Poisson ratio of mud (Layer M1, M2, and M3, -) | 0.35 | ||
| Porosity of sand (Layer S, -) | 0.48 | Friction angle of sand (Layer S, °) | 25 | ||
| Porosity of mud (Layer M1, -) | 0.69 | Friction angle of mud (Layer M1, M2, and M3, °) | 22 | ||
| Porosity of mud (Layer M2, -) | 0.67 | Cohesion of sand (Layer S, kPa) | 35 | ||
| Porosity of mud (Layer M3, -) | 0.63 | Cohesion of mud (Layer M1 and M2, kPa) | 30 | ||
| Residual water saturation ( [–]) | 0.1 | Cohesion of mud (Layer M3, kPa) | 40 | ||
| Residual gas saturation ( [–]) | 0.01 | Hydrate dissociation properties | Molecular mass of gas (Mg, g/mol) | 16.042 | |
| Permeability models | (this study) | Molecular mass of water (Mw, g/mol) | 18.016 | ||
| [21] | Molecular mass of hydrate (Mh, g/mol) | 124.133 | |||
| Van Genuchten parameters | P0 (kPa) | 2.2 | Hydration number (Nh) [41,42] | 6 | |
| α | 0.6 | Phase equilibrium model parameters (α and β) | 42.047, −9332 | ||
| n | 0.5 | Stiffness model | |||
| m | 0.5 | Ehyd is the Young’s modulus at a certain hydrate saturation, E0 is the Young’s modulus without hydrate | |||
Publisher’s Note: MDPI stays neutral with regard to jurisdictional claims in published maps and institutional affiliations. |
© 2021 by the authors. Licensee MDPI, Basel, Switzerland. This article is an open access article distributed under the terms and conditions of the Creative Commons Attribution (CC BY) license (http://creativecommons.org/licenses/by/4.0/).
Share and Cite
MDPI and ACS Style
Kim, J.-T.; Kang, C.-W.; Kim, A.-R.; Lee, J.Y.; Cho, G.-C. Effect of Permeability on Hydrate-Bearing Sediment Productivity and Stability in Ulleung Basin, East Sea, South Korea. Energies 2021, 14, 1752. https://doi.org/10.3390/en14061752
AMA Style
Kim J-T, Kang C-W, Kim A-R, Lee JY, Cho G-C. Effect of Permeability on Hydrate-Bearing Sediment Productivity and Stability in Ulleung Basin, East Sea, South Korea. Energies. 2021; 14(6):1752. https://doi.org/10.3390/en14061752
Chicago/Turabian StyleKim, Jung-Tae, Chul-Whan Kang, Ah-Ram Kim, Joo Yong Lee, and Gye-Chun Cho. 2021. "Effect of Permeability on Hydrate-Bearing Sediment Productivity and Stability in Ulleung Basin, East Sea, South Korea" Energies 14, no. 6: 1752. https://doi.org/10.3390/en14061752
Note that from the first issue of 2016, this journal uses article numbers instead of page numbers. See further details here.