1. Introduction
A rapid increase in urbanization and the world’s population has triggered a rise in global energy demand [
1]. The demand and energy supply gap create an indispensable need for the production of energy through new pathways [
2]. The utilization of fossil fuels gives rise to adverse environmental impacts that directed the world towards to utilization of renewable resources [
3]. Over the years, conversion of waste to energy has been studied from various thermochemical and biological processes. Sewage sludge (SS) is a waste product that originates from wastewater treatment plants and is composed of high water content, ash, carbohydrates, proteins, and lipids [
4]. The huge production of SS is a major issue that hinders urban development and induces many environmental implications [
5]. Over 13 million dried tons of SS are produced annually in the European Union (EU) [
6].
Among thermochemical technologies, hydrothermal liquefaction (HTL) has established great viability in the recent past for the production of high energy bio-crude from waste biomass and especially from SS [
7]. HTL works under hydrothermal conditions at moderate temperatures (280–400 °C) and high pressure (10–35 MPa) in which water promotes acid–alkali catalyzed reactions for the breakdown of organic matter [
8]. In one way, water acts as the slurry vehicle and accelerates the degradation reactions; on the other hand, the effluent water produced is a byproduct, which is commonly termed the aqueous phase.
The majority of research work has been conducted on bio-crude production and its analysis [
9,
10,
11], but the management of the aqueous phase from the HTL of SS remains an unresolved issue [
12]. This aqueous phase contains a substantial amount of organics and valuable nutrients, approximately 20–45% of the carbon and almost 40–80% of the nitrogen [
13,
14]. These organics can be extracted to optimize the efficiency of the HTL system. Therefore, the management of the aqueous phase is a major challenge for the sustainability of the HTL system [
15]. Many researchers have tried to valorize the aqueous phase via different methods, which include gasification [
16,
17], cultivation of biomass such as microalgae [
18,
19], and anaerobic digestion [
18].
Apart from that, various other strategies for the aqueous phase valorization have been adopted; for example, the separation and purification of nutrients such as struvite or chemicals such as carboxylic acids, the conversion of aqueous phase components to energy and fuels such as bioelectricity, bioethanol, or chemicals such as polyhydroxy-alkanoates (PHAs) through fermentation, microbial electrolysis cells, microbial fuel cells, and catalytic reforming [
20]. Davidson et al. optimized the aqueous phase produced from terrestrial feedstock through different techniques, like catalytic upgrading via condensed-phase ketonization reaction, steam reforming, and anaerobic digestion followed by steam reforming. Among all three strategies, techno-economic analysis revealed that condensed-phase ketonization showed the lowest fuel selling price (
$3.49/gasoline gallon equivalent) [
21]. Pipitone et al. carried out the aqueous phase reforming from lignin rich feedstock by taking its notable water soluble organic compounds, such as carboxylic and bicarboxylic acids, hydroxyacids, alcohols, with the catalyst Pt/C in subcritical temperature range to produce hydrogen gas. Results reflected that the increasing concentration of these compounds negatively affected the conversion of feed for the gas production [
22].
Since, aforementioned strategies require integration of the HTL unit with other processes. This can undermine the sustainability of HTL as stand-alone. Therefore, in the HTL perspective, currently the concept of recycling of aqueous phase back to the HTL unit for enhancing bio-crude energy recovery has attracted the attention of researchers. [
23,
24]. Ramos-Tercero et al. treated microalgae with a recirculated aqueous phase and found improved bio-crude yields from 14 to 42% with higher nitrogen content in the bio-crude after 7 successive rounds of recycling [
25]. Pedersen et al. co-processed wood and glycerol at the larger scale in the continuous plant at 400 °C and applied subsequent recycling of the aqueous phase, which led to a higher accumulation of ash and potassium in the aqueous phase. However, no increasing trend in the bio-crude yield was observed due to the complicated separation procedure [
26]. Daniel et al. also examined the effect of water recycling on the properties of the bio-crude and reported higher bio-crude yields and lower solid yields with HHVs of 33 to 35 MJ/kg from blackcurrant pomace at 310 °C [
27]. Recently, Shah et al. carried out eight recycling experiments with the diluted aqueous phase with dried SS, and found a 50% increase in the energy recovery of the bio-crude with almost 2-fold increase of nitrogen [
28]. Chen at al utilized the aqueous phase from spirulina platensis as a recirculating medium for the recirculation experiments of HTL of spirulina platensis, α-cellulose, and lignin. A positive increase of 9 and 5% was observed in bio-crude yields for spirulina platensis and α-cellulose, respectively, while a 5.5% decrease in bio-crude yield was noticed with lignin via the antagonistic effect of N-containing compounds of the aqueous phase and aromatic hetero-polymer units of lignin.
All the aforementioned studies reported the higher presence of heteroatoms via consecutive recycles of the aqueous phase. In this regard, the pre-treatment of the aqueous phase before recirculation could be a feasible option in the scenario of recycling to decrease the accumulation of heteroatoms and inorganics in the bio-crude before being upgraded via hydro-treatment. This phenomenon could save a lot of cost and energy and the life of the catalyst during hydro-treatment processing, etc. Currently, activated carbon (AC) has been proved as an excellent adsorbent material for removing organic or inorganic pollutants [
29].
There are some studies in which different pretreatment agents were used for the aqueous phase treatment. C The treated HTL aqueous phase affected both the growth and chemical composition of the microalgae [
30]. Shanmugam et al. also treated the aqueous phase from microalgae with 30% granular AC and experienced a significant reduction of 53% of chemical oxygen demand (COD) and higher CH
4 production (84% mL/g COD) [
31]. Margot et al. used powdered AC with ultrafiltration for the treatment of the micropollutants of the municipal wastewater. It was reported that 80% of micropollutants were removed by the action of powdered AC with ultrafiltration, despite the fact that high-cost powdered AC embedded ultrafiltration is a suitable option for the removal of micropollutants [
32]. Manyuchi et al. utilized biochar from the pyrolysis of municipal bio-waste of surface area 600–1000 m
2/g with a particle size of 1.5 mm, and successfully reduced the concentrations of chemical oxygen demand (COD), total nitrogen (TN), and total organic carbon (TOC) up to 90, 64, and 78%, respectively [
33].
The uniqueness of this study is the treatment of the aqueous phase with activated carbon in order to surpass the nitrogen before its direct recirculation as a solvent in HTL unit. In the available literature, no such information has been reported before. Therefore, this study investigates the effect of the activated carbon treatment on the characteristics of the aqueous phase (organic and inorganic), and its overall recycling impact on the bio-crude properties. Comprehensive information regarding the carbon and nitrogen mass balances with recirculated fractions of carbon/nitrogen of the aqueous phase is provided. The fate of inorganic elements in the HTL products is also discussed in the last section of the article.
2. Materials and Methods
2.1. Feedstock Characterization
To control the dry matter content, dried SS (bio-degassed) pellets were used. The dry SS pellets were collected from the wastewater treatment plant located in Aalborg East, Denmark. Volatile matter (VM) in SS was determined by heating the SS sample at 750 °C under the nitrogen atmosphere at 10 °C/min via using Thermogravimetric Analysis (TGA) TA instrument discovery. The ash content was determined by weight difference after burning the SS sample at 775 °C for 4 h. The crude protein (CP) was calculated by multiplying the nitrogen content with 6.25 [
34]. Soxhlet extraction was applied to extract the Crude Fat (CF) from the SS by using petroleum ether as an extraction solvent following the method [
35].
The carbohydrates were determined by the formula: Carbohydrates = [(Volatile Matter + Fixed Carbon)–(Crude Proteins + Crude Fat)] [
36]. The HHV was detected by C2000 basic Calorimeter (IKA, Germany). The elemental composition was analyzed by the elemental analyzer (Perkin Elmer, 2400 Series II CHNS/O), operated on CHN mode. Inorganic elements were quantified via Inductively Coupled Plasma Atomic Emission Spectroscopy (ICP-AES). Prior to the ICP-AES analysis, the SS sample was processed in a microwave-assisted acid digestion system by following the procedure of Conti et al. [
37]. The complete characterization of the SS is given in
Table 1 in
Section 3.1.
2.2. Pretreatment of the Aqueous Phase
The produced aqueous phase through an autoclave at subcritical conditions 350 °C was treated with powdered AC (powdered AC Extra Pure, Supelco®, Bellefonte, PA, USA) with a particle size of 149 µm and surface area of 600 m2/g. AC was added by 2% corresponding to the total 130 mL weight of the aqueous phase. The prepared mixture was mixed under a magnetic stirrer at 30 °C with 600 rpm for 4 h. The time and dosage of AC were selected after conducting several test runs, as longer mixing time and high dosage did not affect the degree of the nitrogen removal. The collected mixture was then subjected to the vacuum filtration using a filter paper of particle retention of 5–13 μm. Finally, 110 mL treated aqueous phase was recirculated back to the HTL unit.
2.3. HTL Experiments
The HTL experiments were carried out in a 400 mL autoclave. For the reference run the reactor was loaded with 80 g of the SS, and 220 mL of the deionized water corresponding to 25% dry matter content. For recycling experiments, 110 mL of the aqueous phase was added, as almost 50% of deionized water was replaced with the aqueous phase. Before the experiment, the reactor was pre-pressurized with N
2 with 15 bar. The reactor was allowed to heat up to 350 °C at the 3 °C/min with continuous stirring of 300 rpm. The temperature was selected following the previous SS studies [
28,
38]. After attaining the desired temperature, the reactor was maintained at a retention time of 15 min.
The reactor was cooled down, and products were separated. The separation procedure of the product phases was quite complex; the systematic approach of the HTL methodology and product separation procedure is demonstrated in
Figure 1.
First, the gas-phase was vented off. A distinct layer of the aqueous phase was collected through the syringe. Along with the aqueous phase, some fine layers of solid particles were intermingled with the aqueous phase, which was then filtered via vacuum filtration. It was found that only 60 to 70% of the pure aqueous phase was collected easily, while the remaining amount was amalgamated with a bio-crude mixture, which was recovered later. After this, the reactor was washed with acetone to collect the bio-crude and solids products. The solid phase was filtered via vacuum filtration method by using filter paper of particle retention: 5–13 μm, and after that acetone was allowed to evaporate at 60 °C, with vacuum suction pressure of 0.56 bar or 56 KPa under the rotary evaporation system.
Finally, the Dichloromethane, Sigma-Aldrich, 99% pure (DCM) was added to collect the remaining 30 to 40% of the residual aqueous phase by using a gravity separation flask. To get the weight of bio-crude yield, DCM was allowed to evaporate at 40 °C, and a flask containing bio-crude was weighted to report the yield. All the experiments were performed in duplicate to reduce the risk of separation losses.
2.4. Analysis of HTL Products
The elemental analysis of the bio-crude and solid residue was carried out by 2400 Series II CHNS/O (PerkinElmer, Waltham, MA, U.S.). The thermogravimetric behavior of the bio-crude was analyzed by heating the bio-crude at 750 °C under a nitrogen atmosphere via TGA (QTA Instruments Discovery, New Castle, DE, USA). The Gas Chromatograph (Trace 1300, Thermo Fisher Scientific, Waltham, MA, USA) coupled with a Mass Spectrometer (ISQ-QD) GCMS was used to analyze the organic composition of the bio-crude and aqueous phase. The GC oven, fixed with a capillary column (HP-5MS, Agilent Technologies, I.D.: 0.25 mm, length: 30 m, film thickness: 0.25 mm), was set from 30 °C to 300 °C with 10 K/min. The samples were mixed with DEE and filtered (0.45 µm) before the injection. Before the analysis of the aqueous phase, the water phase was allowed to evaporate at 60 °C overnight, and then DCM was added as a solvent to dissolve the dried organic contents. Later, the prepared sample was derivatized by using the derivatization method of Pedersen et al. [
39]. The water content in the bio-crude was analyzed by the Karl Fischer titration method via a TitroLine 7500 basic unit (Schott) with micro-double platinum electrode KF 1100. Before the analysis, all the bio-crude samples were diluted 5 times with distilled water and then a reading was recorded. The HHV of the bio-crude was calculated by using Channiwala and Parikh’s correlation [
40].
From the aqueous phase, the concentrations of the total nitrogen (TN) and total organic carbon (TOC) were quantified by a spectrophotometer unit (Hach and Lange, DE3900) using the reagent vials, namely: LCK:138, 386, respectively. The pH of the aqueous phase was detected with a WTW pH meter 3210. The inorganic elements in the bio-crude, solids, and aqueous phase were quantitatively analyzed by (ICP-AES) by following microwave-assisted acid digestion using nitric acid (HNO3). The microwave digestion system was an Anton Paar Multiwave 7000 equipped with PTFE digestion tubes. For the ICP-AES analysis, a total of 13 elements were measured at 2–4 wavelengths each. The spectrometer was a Thermo Fisher Scientific iCap 6300 operated in axial view mode. Yttrium was used as an internal standard. For quality control, certified reference material based on dried SS (EnviroMAT BE-1, SCP-Science, Canada) was included in the sample preparation and analysis.
The bio-crude and solid yields are reported on a dried ash-free (daf) basis. The Energy recovery (ER) of the bio-crude and carbon recovery (CR) from the HTL products was calculated by using the following equations. Here, Wp, Wss, Cp, and Css are represented as the weight of the products, the weight of the SS, carbon % in the products, and carbon % in the SS, respectively. Cap indicates the recirculated amount of carbon % from the aqueous phase.
3. Results
3.1. Feedstock Characterization
SS characterization showed that almost one-third of the total mass of the SS was composed of ash (34%). A significant amount of carbohydrates was calculated due to the presence of 52% of VM, as shown in
Figure 2. From the elemental analysis, higher nitrogen content was detected primarily due to a substantial amount of crude proteins.
The inorganic elements were also detected in the SS via the ICP-AES technique. Phosphorous and calcium were found in significant amounts of 24 and 39% respectively. It was noticed that the sum of the concentration of the total detected elements accounted for 112,865 mg/kg, which represents about one-third of the total ash present in the SS. The remaining mass of the ash could be occupied by oxygenated ions in the form of sulfates, oxides, and carbonates of their associated inorganic elements, or other elements which were not detected in the present study. The relative weight (%) of each element was estimated as a ratio of the concentration of each inorganic element to the sum of the total concentrations of all detected inorganic elements, as shown in
Table 2.
3.2. Effect of the AC Treatment on TN and TOC
The AC treatment reduced the concentrations of the both TN and TOC as 38–43% and 33 to 38% respectively (see
Figure 3a,b). The simultaneous decrease in TN and TOC indicates that the organic nitrogen attached to the organic compounds removed from the aqueous phase via contacting with AC. By the adsorption properties of AC, the organic contents accumulated at the surface pores of the AC due to the polarity of functional groups such as O–H, C=O, C–O, –CO
3, etc. However, the exact mechanism of the adsorption action of AC with organic compounds remains ambiguous. Previously, Erkelens et al. utilized the aqueous phase for the cultivation of the microalgae after the treatment with AC and experienced a drastic reduction in TN and TOC, from 52 g/L to 5 g/L and from 19 g/L to 13 g/L, respectively [
30]. The comparison of present findings with the results of Erkelens et al. [
30] can not be justified, because there are many factors that can contribute in improving the adsorbability of the AC onto organics, such as surface area, pore-size distribution, pore-volume, and presence of surface functional groups. Smaller particle size increases the surface area and expands the pore volume of AC, as of these features provide a higher degree of adsorbability [
41]. The lower removal of nitrogen from the aqueous phase in the present study might be due to the smaller surface area. The same scenario was seen by Zoppi et al., who treated the aqueous phase with activated carbon before the aqueous phase reforming for hydrogen production. The authors found a decrease in the concentration of organics in the aqueous phase, especially guaiacol and phenol derivatives by the effect of hydrophobic bonding between hydrophobic molecules (aromatics) with a surface area of activated carbon [
42].
3.3. Bio-Crude Yield and Quality via Recycling of Treated Aqueous Phase
Five HTL experiments were carried out, one as a baseline experiment (R0), one with the recycling of the aqueous phase without treatment (R0-without-AC), and three with treated aqueous phase via AC, namely: R1-AC, R2-AC, and R3-AC (
Figure 4). By applying aqueous phase recycling, the bio-crude yield increased from 36 to 39% after one round of recycling with an untreated aqueous phase, whereas recycling of the treated aqueous phase increased the bio-crude yield from 36 to 43.2%. The increase in bio-crude yield is particularly due to the concentrated light polar organics in the aqueous phase.
During recycling experiments, the reactive substances of water-soluble organics undergo different chemical reactions such as cyclization and repolymerization, which form heavier fragments and become part of the bio-crude. This can also be validated by the higher nitrogen content in the bio-crude with successive recycling. After the second recycle, only 2% of bio-crude yield was increased with a small error bars, this shows that yield would be stable for the higher recycles due to the equilibrium of dissolved organics in the aqueous phase. However, the variation in the bio-crude yield was found to be directly correlated with TOC values (20–27 g/L), as lower TOC values were observed in the treated aqueous phase, which influenced the bio-crude yield. The solid yield was measured at 13 to 15% and inversely correlated with a bio-crude yield.
The elemental composition of the bio-crude is shown in
Table 3. In all bio-crudes, about 71–72% carbon was detected; hydrogen content was almost consistent in the range of 8 to ~9%. The elemental composition of the bio-crude was affected in terms of nitrogen content as an increasing trend of nitrogen was observed in bio-crudes obtained by recycling experiments. This is predominantly caused by the continuous injection and accumulation of the N-containing compounds from the aqueous phase. Slightly lower nitrogen was detected from the bio-crude obtained from the recycling of the treated aqueous phase R1-AC as compared to the bio-crude obtained from the non-treated aqueous phase R1-without-AC. This is understandable from the baseline run R0, as almost 4.8% of nitrogen was expected from the feedstock part in each run and the plus ~50%% of the nitrogen from the aqueous phase.
The overall HHVs were calculated in the range of (31–33 MJ/kg). The total energy recovery was increased from 50.82 to 61.25%. The higher values for H/C than O/C ratio indicating the conversion and transformation of the SS into the bio-crude, water soluble organics (WSO), and gas phase. The moderate temperature and higher pressure in the subcritical range remove the oxygen content by accelerating the deoxygenation reactions such as decarboxylation and dehydration, whereas lower values for O/C are favorable for the stability and viscosity of the bio-crude. The highest value for the degree of deoxygenation (65%) was estimated from the bio-crude R3-AC. Nevertheless, the HHV of the petroleum-crude is still quite high [
43,
44], thus the upgrading of the bio-crude via hydro-treatment will be indispensably needed to elevate the HHVs of the bio-crude.
Water content in the bio-crude was determined by the Karl Fischer titration method. Since HTL is a hydrothermal process, the water emerges at every stage during the separation process. At the best possible level of the separation process, the negligible fractions of water always reside within the bio-crude. This water in the bio-crude existed in the form of hydrogen and oxygen bonded atoms. The water content in the bio-crude is in the range of 0.95–1.24. For the characterization of the bio-crude, the proportion of the water was subtracted from all the reported values.
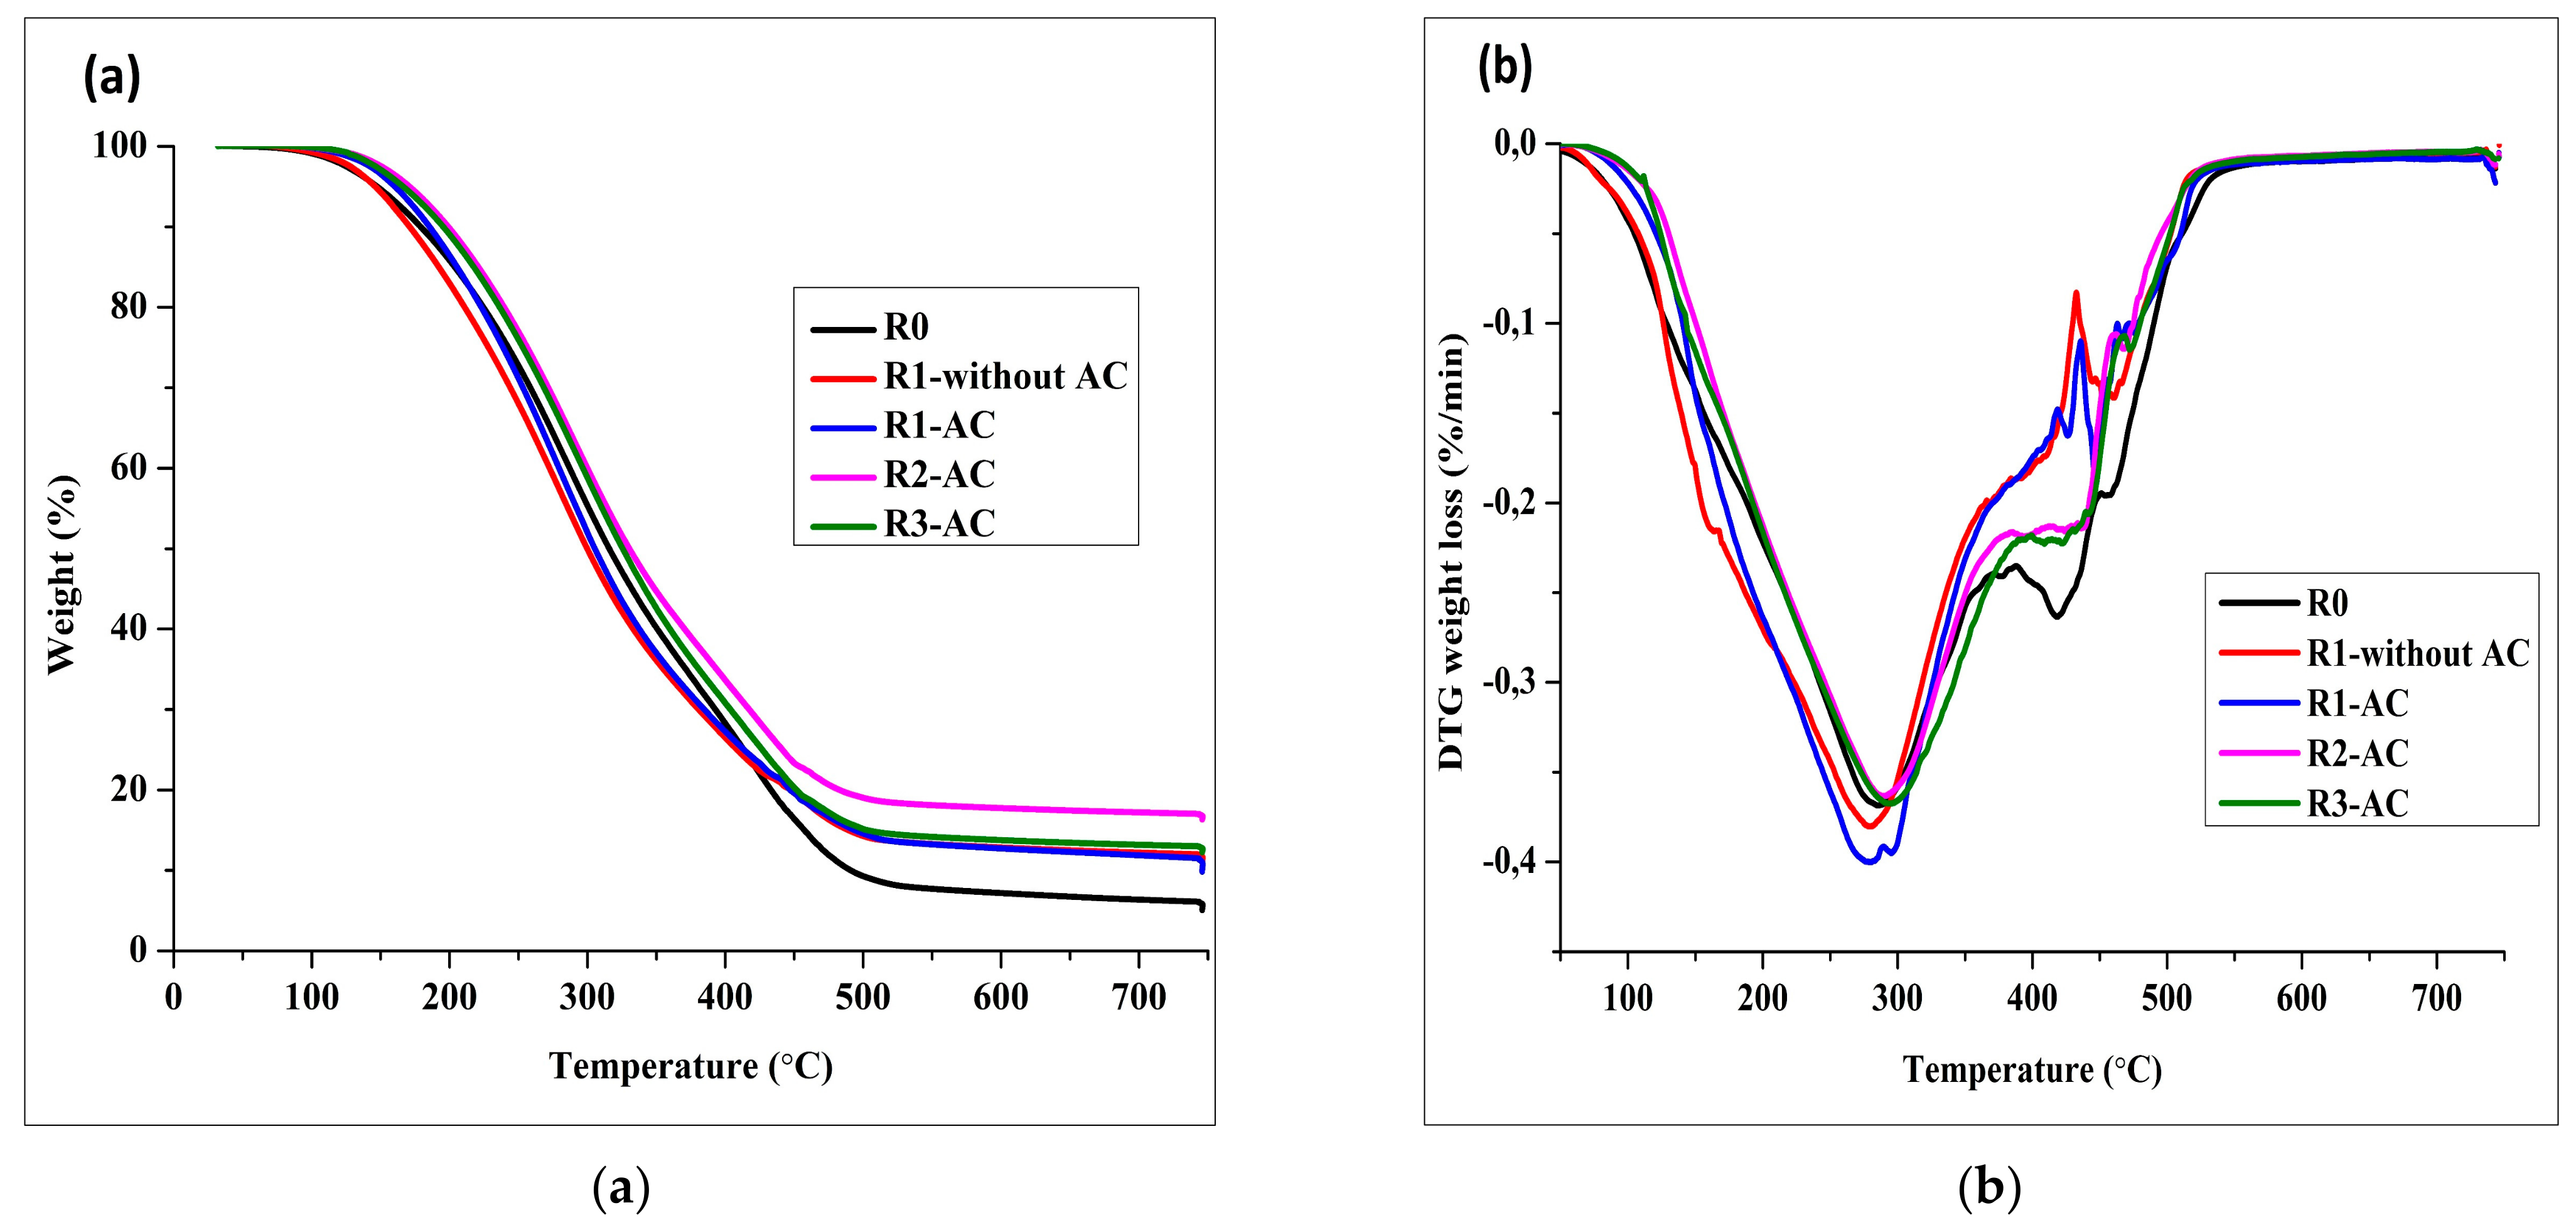
3.4. Volatility of the Bio-Crude
The volatility of bio-crudes was assessed by TGA.
Figure 5a demonstrates the similar thermal behavior from all the bio-crudes. In the temperature range (≤350 °C), more than 50% weight of all bio-crudes was composed of volatile fragments. These components designate the fractions of petroleum distillates as gasoline, diesel, and jet fuel. The Differential Thermogravimetric curves (DTG) were also drawn to validate the volatility curves as the highest peaks of the weight loss were noticed in between 250 to 300 °C, as illustrated in
Figure 5b. At the extreme temperature (750 °C), 7 to 18% of the heavy residue was detected. A higher amount of heavy residue was noticed in the bio-crude from the recycling experiments.
3.5. Characterization of the Solid Residue
HTL aims to transform the maximum portion of the organics, specifically the carbon into the bio-crude, yet the substantial amount of carbon ends up in the solid phase in the form of char. Here, for the solid residue, all the values for the elemental analysis are reported as dry ash-free by excluding the amount of ash (75–82%) as listed in
Table 4. All the ashes in the solids were determined through the furnace method by heating the solid samples at 120 °C for 24 h. Aqueous phase recycling decreased the carbon contents in the solids phase. The lower H/C values for the solids than the bio-crude representing that major part of carbon from SS was shifted to the bio-crude phase. Higher nitrogen content was observed in the solid residue from recycling experiments due to the repolymerization of the nitrogen-containing aromatic reactive substances.
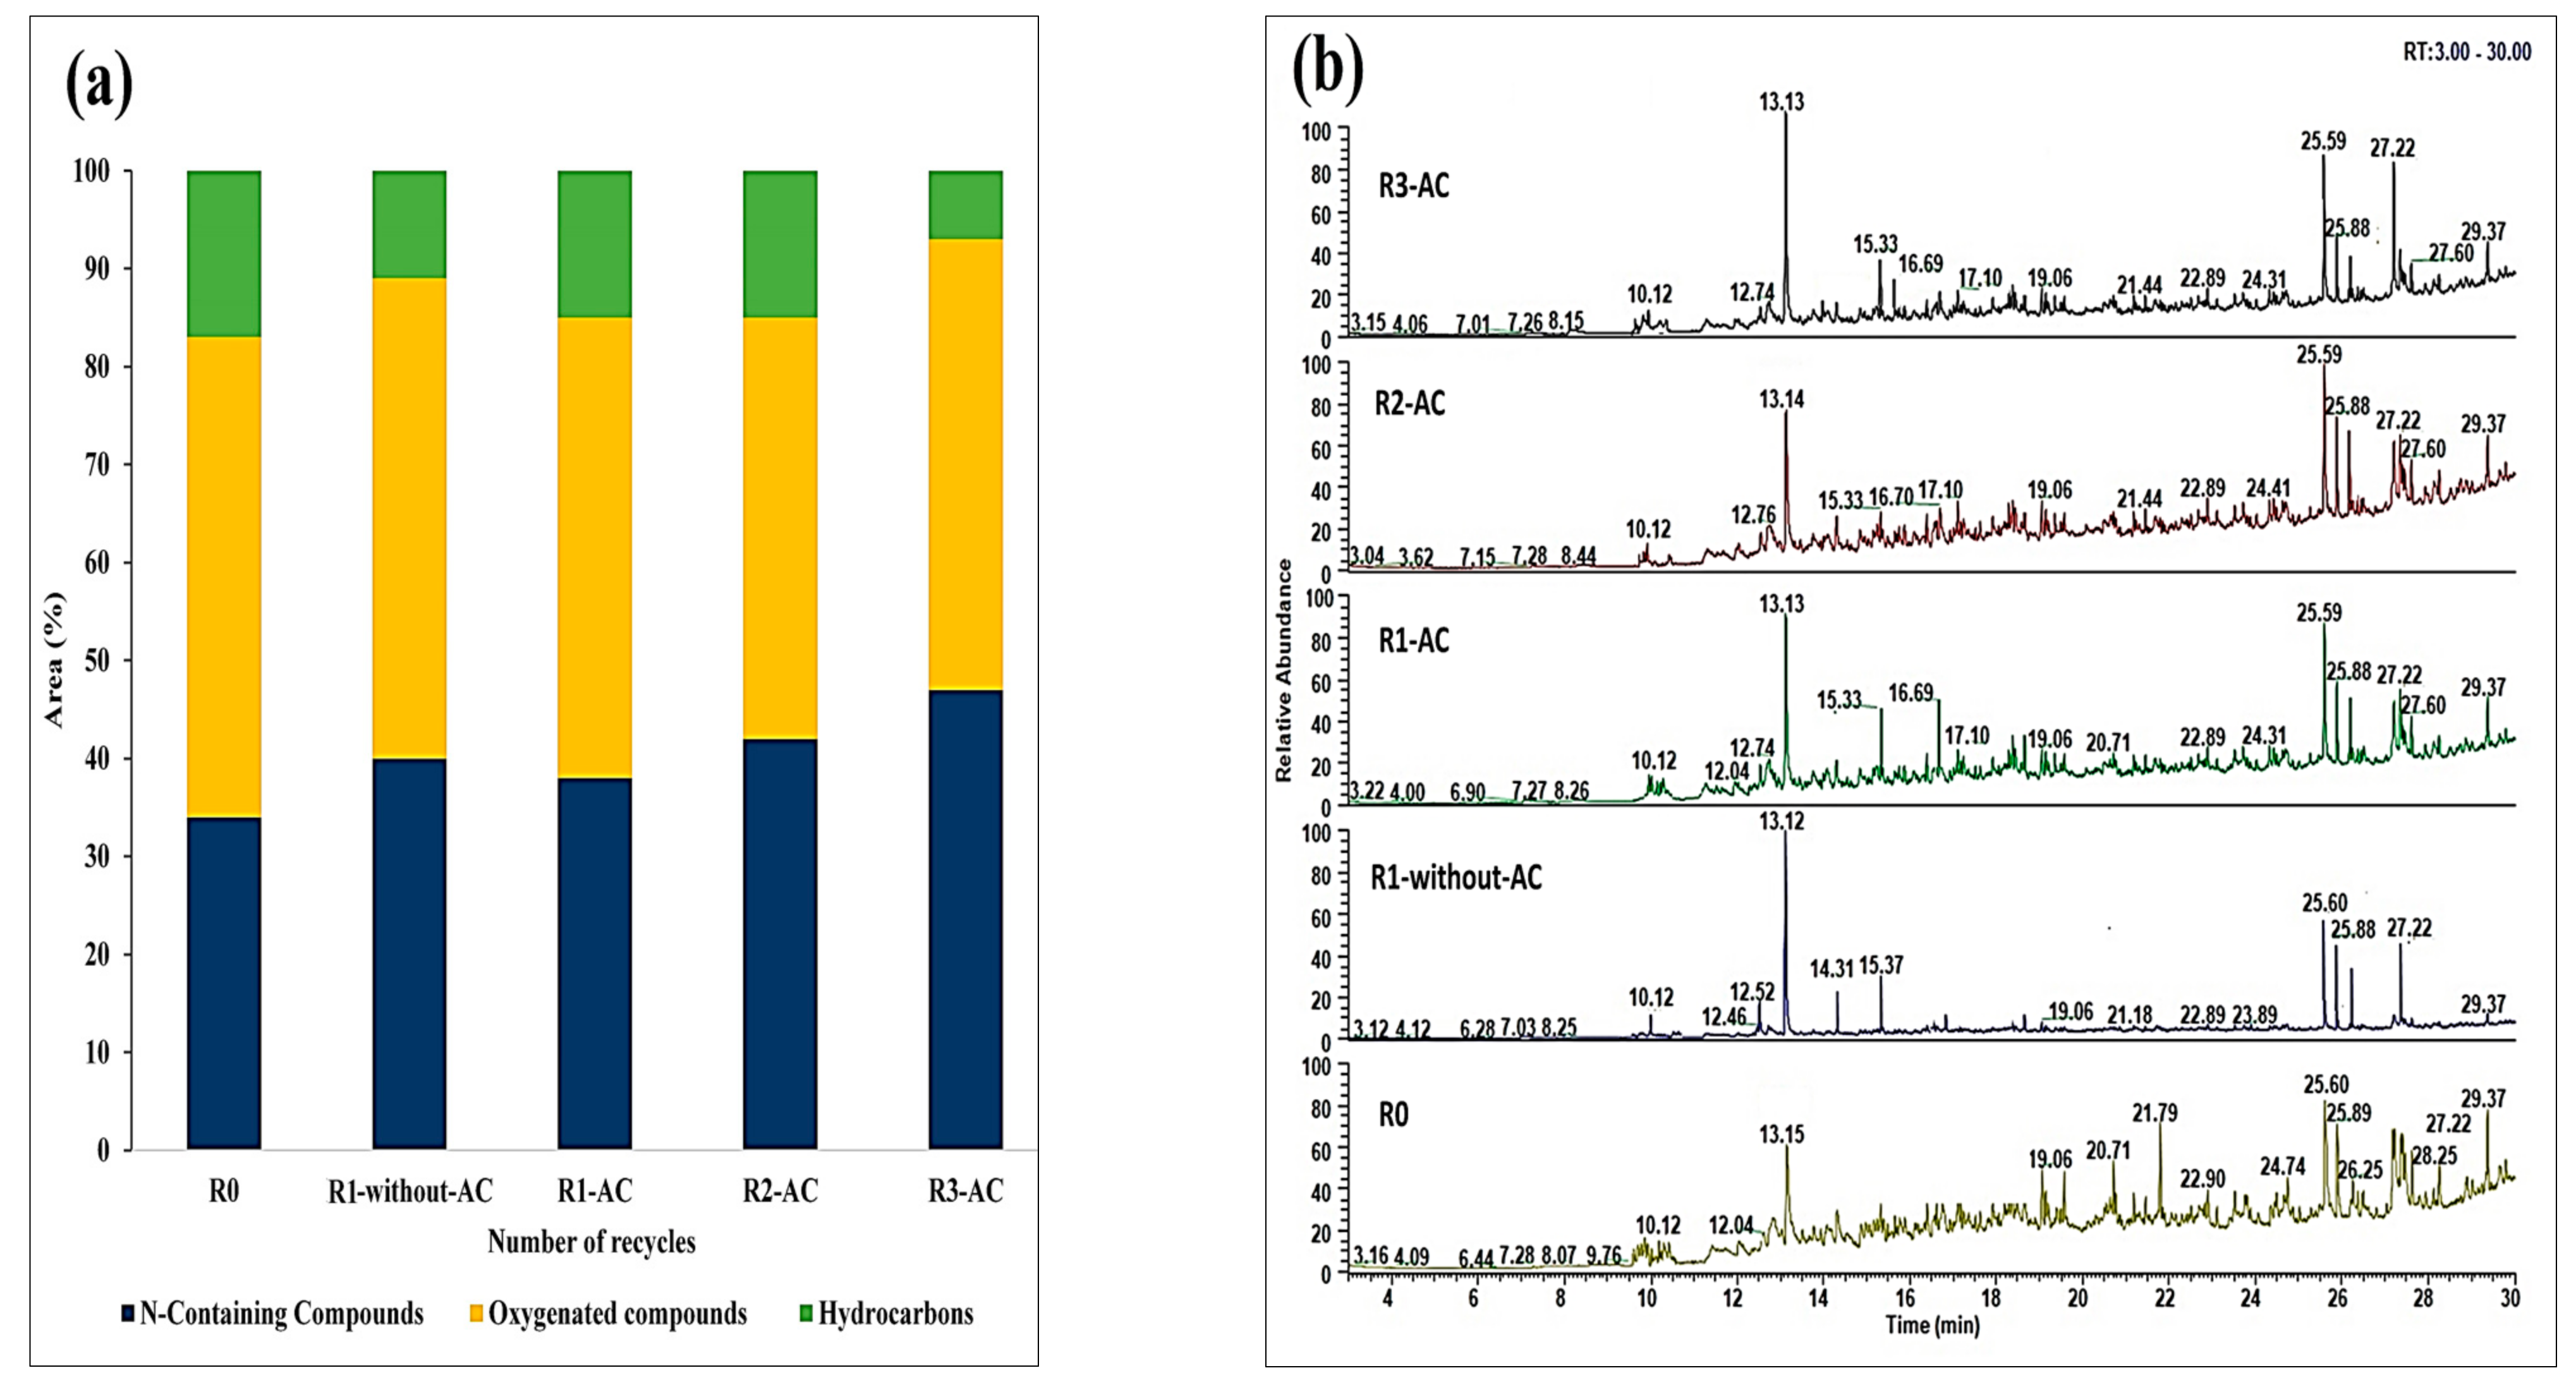
3.6. Organic Composition of the Bio-Crude
The organic composition of the bio-crude was analyzed through GCMS. Due to temperature limitations, GCMS could reveal only the limited information of the TGA. The chromatograms of the bio-crude were quite complex to understand due to the lower probabilities of the numerous organic compounds. Nevertheless, more than 50% of the area of the bio-crude was successfully analyzed. Here, the bio-crude composition is classified into three groups as Nitrogenated compounds (N&O heterocyclic compounds and amides), O-containing compounds (acids, alcohols, ketones, and esters, etc.), and Hydrocarbons.
The organic composition of the SS is composed of three main constituents as carbohydrates, proteins, and fat. During the liquefaction process, these constituents break into their primary monomers such as sugars, amino acids, and fatty acids through hydrolysis reaction [
45]. Then, secondary products are formed by the cleavage of C-C bond, dehydration, and decarboxylation reactions. Finally, these secondary products react with each other via different reactions such as Maillard reaction, deamination, acylation, esterification, cyclization, and repolymerization to form the final products of the bio-crude. The proposed reaction pathways for the organic compounds are given in
Figure 6.
N-containing compounds increased from 33 to 47% for R0 and R3-AC, respectively (
Figure 7a). This increase is especially due to the formation of the N&O heterocyclic compounds, as higher peaks of 4-Piperidinone-2,2,6,6-tetramethyl were observed in
Figure 7b. This is due to the continuous feeding of proteins from the feedstock and surplus recirculated nitrogen from the aqueous phase, which could accelerate the Maillard reaction (a reaction of amino acids with reducing sugars) [
46]. This Maillard reaction inhibits the degradation of the bio-crude and suppresses the formation of the char [
27]. The percentage of amides varied from 4 to 8%. These amides, especially Dodecanamide, 9-Octadecenamide, (Z), etc., were derived from the acylation reaction of amines with fatty acids [
47].
An interesting finding was that a few new compounds were formed at retention times: [RT: 14.31 N-Nitro-N-N-Pentamethyleneguandine] and [15.33 1-Penten-4-one, 2-acetyl-1-dimethylamino- ((Z)-]. This depicts the clear recycling effect of saturation of the polar organics of the aqueous phase. Oxygenated compounds accounted for 43 to 49%, whereas 7 to 18% of hydrocarbons were detected. These hydrocarbons with long chains, such as hexadecane, originated from the decarboxylation of saturated fatty acids [
48]. Phenolic compounds were found in smaller numbers, which were probably derived from the dehydration and cyclization of sugars [
28]. It is concluded from the above observations that aqueous phase recirculation not only improves the energy recovery of the bio-crude but also increases the nitrogen content in the bio-crude that requires further upgrading via hydro-treatment to get in line with the quality of the fossil crude. Some main compounds detected via GCMS in bio-crude are mentioned in
Table 5.
3.7. Characterization of the Aqueous Phase
The aqueous phase was characterized by the GCMS. It should be noted that the light components might be evaporated during the evaporation of the water. Here, the baseline (R0) aqueous phase was selected for the GCMS analysis with and without treatment of AC. The numerous compounds were detected, from which major compounds that covered more than 50% of the area are reported in
Table 6. The organic compounds of the aqueous phase were significantly affected by the AC treatment. This is primarily due to the reduction of N&O-heterocyclic compounds such as Pyrimidine-2-methyl, Acetamide- N-methyl, 2-Piperidinonem, etc., via chemisorption action between the organics and functional groups such as carboxyl, carbonyl on the surface of the AC.
The acetic acid originates from the dehydration of the cellulose (carbohydrates), and these water-soluble small chain acids could act as a precursor for the formation of the bio-crude and later on dissolved in the aqueous phase. Madsen et al. performed the liquefaction of the modal components of carbohydrates, proteins, and lipids, and reported the higher concentration of acetic acid in the aqueous phase generated from the hydrolysis of proteins than the carbohydrates [
49]. Thus, speculating on the exact reaction pathway for the acetic is a challenging task. Acetamide is derived from the acylation reaction between acetic acid and ammonia from amino acids [
50]. These results confirm that the extraction of TOC and TN from the aqueous phase occurred due to the removal of the aforementioned compounds as discussed in the previous
Section 3.2. Earlier, Ramos-Tercero et al. carried out the recirculation of the aqueous phase from high protein-containing microalgae at 240 °C and reported the majority of the N&O- heterocyclic compounds in the aqueous phase [
25].
Figure 8 shows the relative effect of the AC treatment on the organic compounds of the aqueous phase before and after treatment. For further validation, chromatograms of both aqueous phases before and after the treatment are illustrated in
Figures S1 and S2, respectively, in the additional part of the manuscript (
Supplementary Material).
The impact of the AC treatment on the inorganic elements of the aqueous phase was also investigated.
Figure 9 shows the negligible adsorbent effect of AC onto the removal of inorganic elements. This may be because of the unreactive nature of the AC with the metals at lower mixing temperatures 60 °C, as the lower temperature does not allow the cleavage of metal bonds associated with carbonates, sulfates, or phosphates, etc. The concentration of the inorganic elements is given in
Table S1 enclosed in the additional part of the manuscript (Supplementary Material).
3.8. Carbon and Nitrogen Balance (CR and NR)
The carbon and nitrogen recoveries in the products were determined by Equations (3) and (4), as the ratio of carbon or nitrogen in the product to the carbon or nitrogen in the SS, times the yield of the product. For the aqueous phase, the CR and NR were determined by the TOC and TN values by assuming an equal amount of input water and output water, whereas the CR in the gas phase was calculated by the difference. In recycling experiments, the additional amount of carbon and nitrogen was also considered as the input carbon/nitrogen along with the carbon in the feedstock. Almost 40–50% of the obtained carbon/nitrogen in the aqueous phase was recirculated back to the HTL unit, as given in Equation (5). The carbon was partitioned 50 to 58% in the bio-crude phase, whereas 16 to 19% of the carbon was transferred in the aqueous phase. In solids, 14 to 18% of the carbon was recovered as depicted in
Figure 10a. A small amount of 7 to 13% carbon was lost in the form of the gas, which might be due to the decarboxylation and decarbonylation reactions.
In the nitrogen recovery perspective, the majority of the nitrogen, ~60%, was accumulated in the aqueous phase. This is particularly due to the deamination of the amino acids that liberates ammonium and later dissolved into the aqueous phase. Qian et al. observed approximately 63% of the nitrogen in the aqueous phase while treating SS in subcritical water, which further supports the higher amount of nitrogen in the aqueous phase. Nitrogen contributed 20 to 30% in the bio-crude. No significant decrease in the NR of the bio-crude was observed after the treatment of the aqueous phase, as NR is a function of the bio-crude yield, and higher yield with the consecutive recycling of the aqueous phase induces higher NR in the bio-crude. The NR in the HTL products can be shown in
Figure 10b.
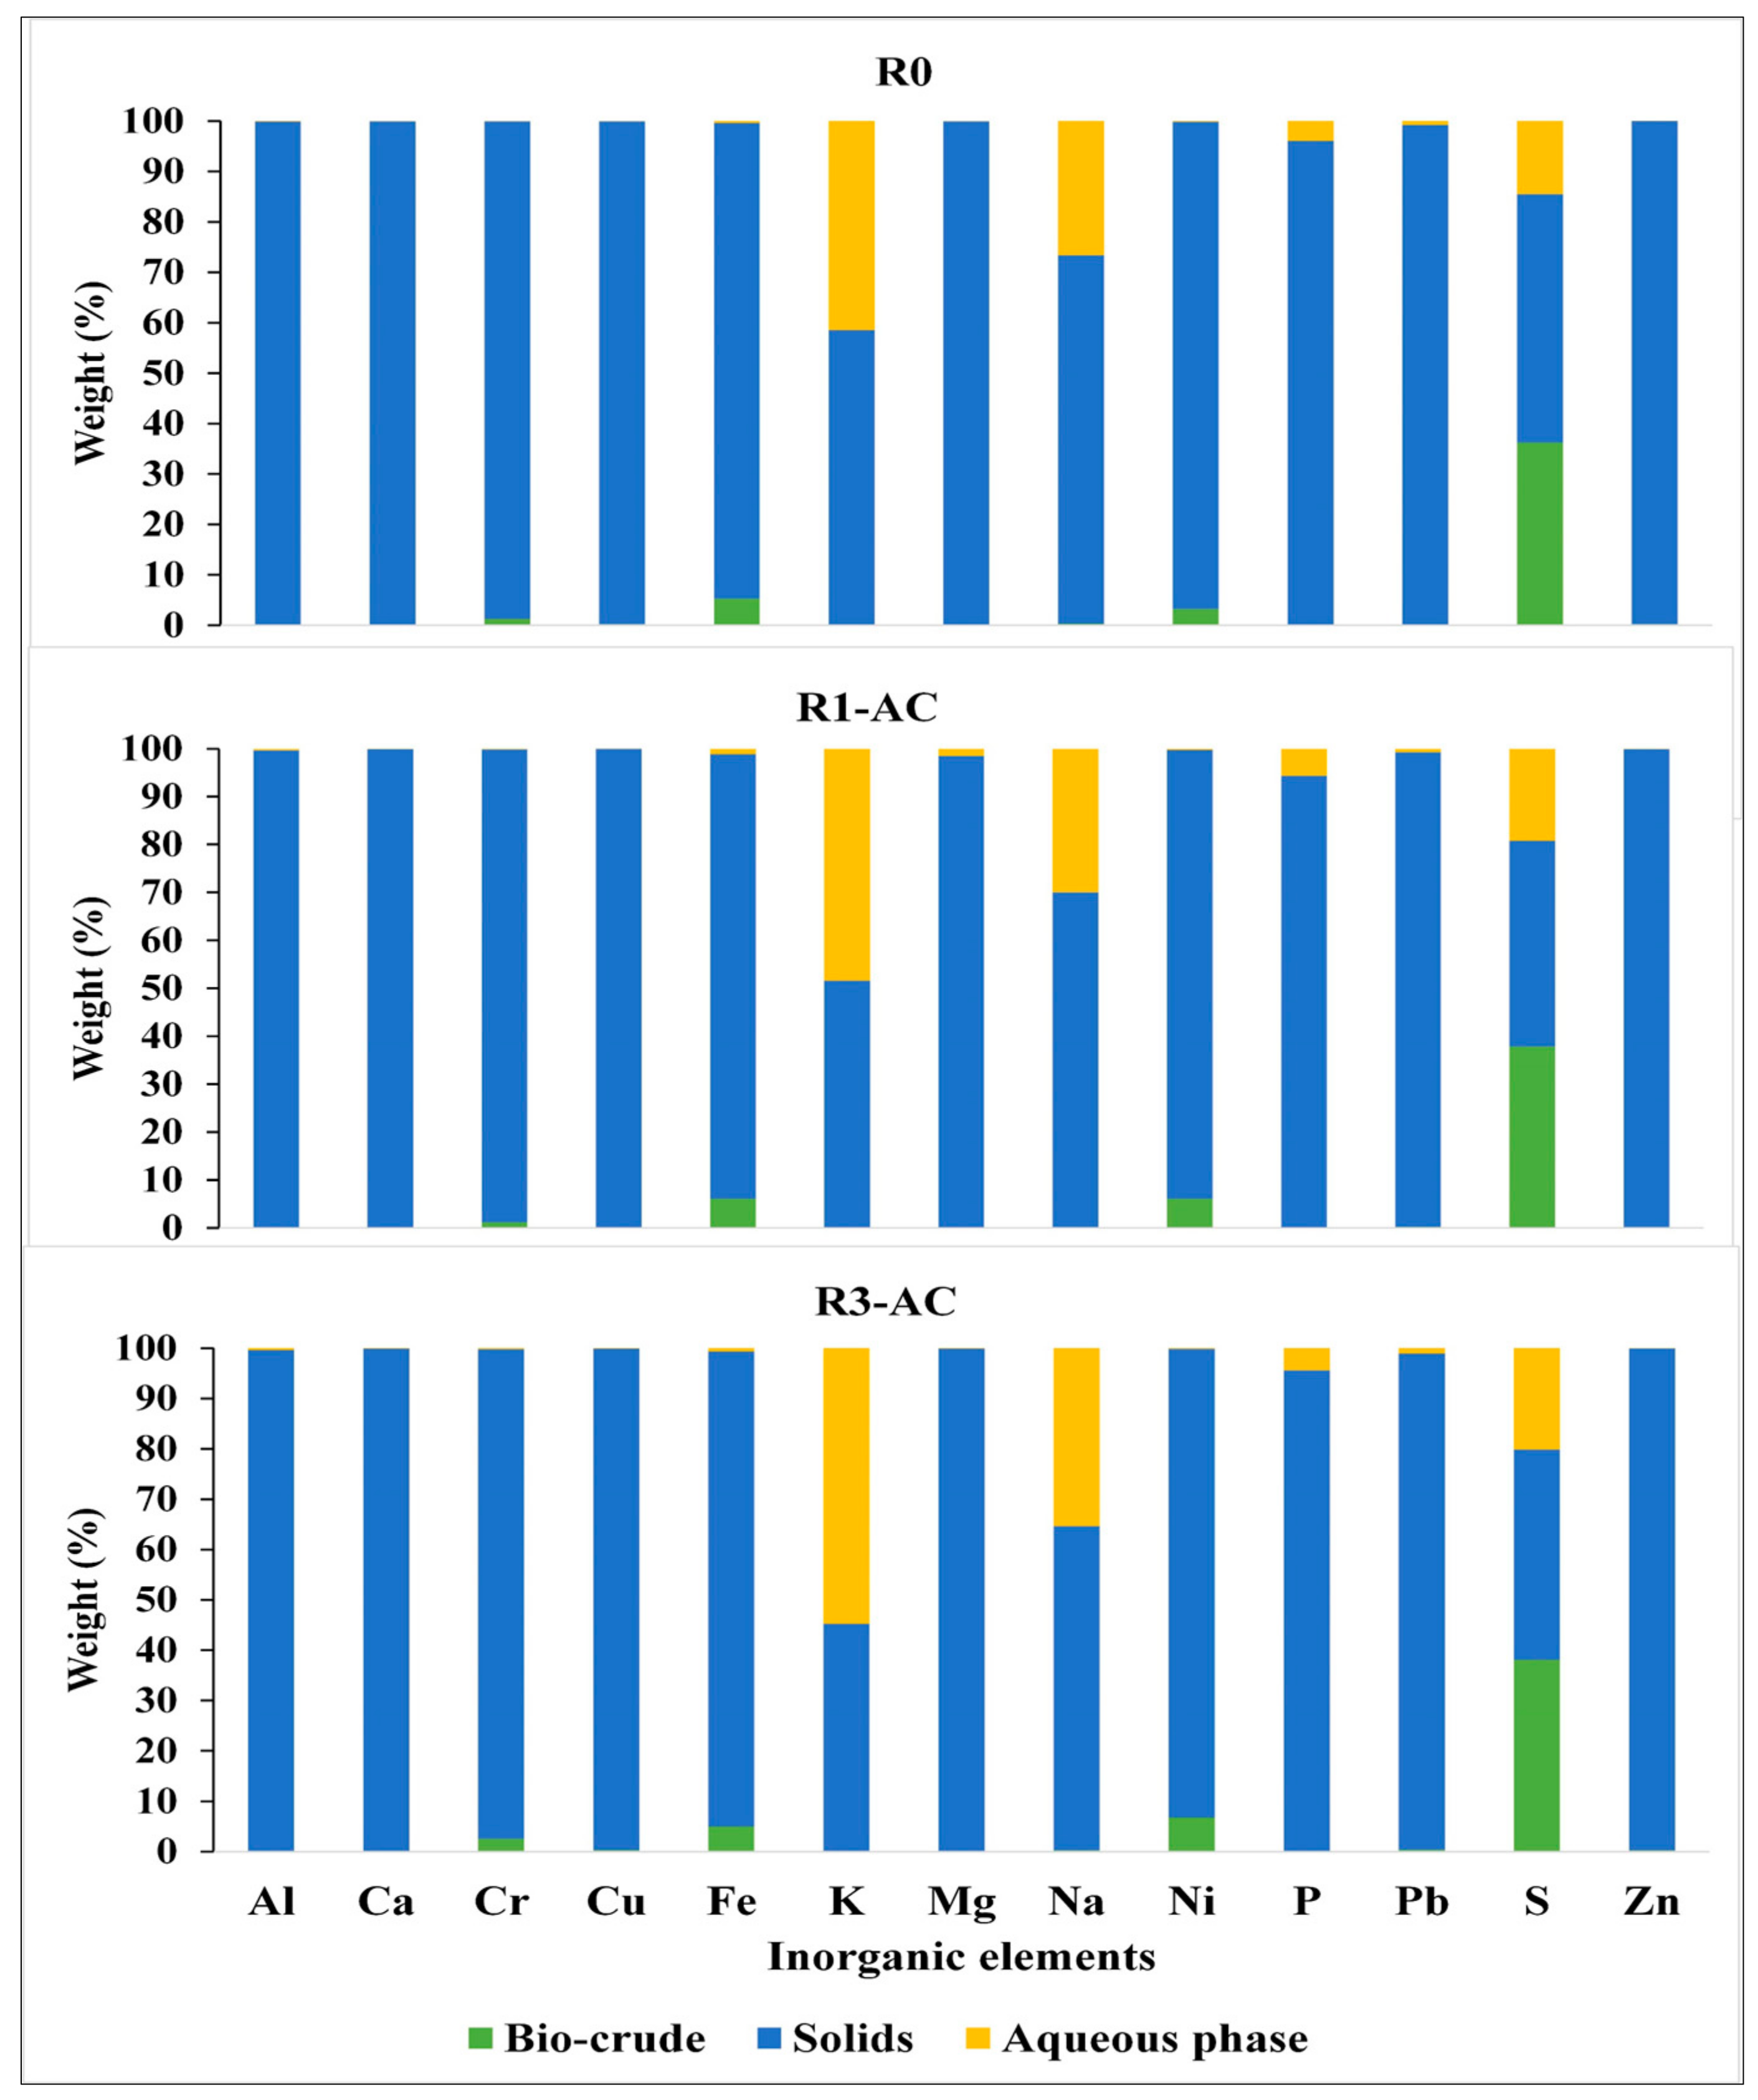
3.9. Distribution of the Inorganic Elements via ICP-AES Analysis
The effect of recycling on the distribution of the inorganic elements was evaluated from ICP-AES analysis. The weight percentage of an individual element was estimated by multiplying the concentration of the element (mg/kg), with the obtained weight of each product in (kg), whereas the relative distribution of the weight percentage for each element was standardized with regard to the total amount of selected inorganic element obtained in all phases. The maximum value of the quantification is 0.01 mg/kg for all the inorganic elements.
Figure 11 demonstrates that in all the experimental conditions, the vast majority of the inorganic elements, particularly Al, Ca, Cu, Pb, and Zn, were migrated to the solid phase. Huang et al. concluded in his review article that regardless of the temperature conditions, the majority of the inorganic elements resided in the solid phase [
51]. The potassium and sodium were two alkaline elements found in the aqueous phase in a substantial amount of 41 and 26%, respectively, for R0. However, higher concentrations of potassium and sodium were noticed in the aqueous phase via recycling experiments, both around 30–55%. It is very reasonable because successive recycling induces more transference of the alkali metals from the disintegration of the feedstock. Earlier, Pedersen et al. also found a higher percentage of ash content and potassium with continuous recycling of the aqueous phase from pinewood and glycerol in a continuous HTL process [
26]. The sulfur was distributed in all phases as 41–49% in the bio-crude; this is because of the cleavage of sulfur atoms from the cyclic organic compounds in the presence of subcritical water. Earlier, Conti et al. utilized four feedstocks including SS, and reported 30–60% of the sulfur in the bio-crude phase [
52].
An interesting observation was that the distribution of the phosphorus was not impacted via the recycling of the treated aqueous phase. This implies that the solid phase has a rich potential of phosphorus-containing compounds, which opens a new route for the utilization of the solid phase as a fertilizer for the cultivation of the biomass.
4. Conclusions
This study investigated the impact of the activated carbon as an adsorbent material for the treatment of the aqueous phase produced from HTL of SS and its recycling effect on the bio-crude properties. The results revealed that activated carbon has a significant effect on the removal of the organics, whereas inorganics of the aqueous phase remained unaffected. Almost 38–43% of the total nitrogen extracted from the aqueous phase and its subsequent recycling increased the bio-crude energy recovery from 50 to 61%. GCMS data indicated that almost 80% of the bio-crude contained heteroatoms, which required hydro-treatment. ICP-AES analysis revealed that the majority of inorganics were concentrated in the solid phase, while two alkaline elements, potassium and sodium were dissolved 30 to 55% in the aqueous phase. Despite the treatment of the activated carbon, the consecutive accumulation of nitrogen in the bio-crude was noticed. Therefore, in future studies, it is strongly suggested that the impregnation or doping of activated carbon could be a better option to decrease the concentration of nitrogen at a significant level to establish the sustainability of the HTL processing in a more applicable way.
Since the above experiments were based on dried SS at laboratory scale. The continuous plant application requires a huge amount of sludge, and it would be very difficult to dry the bulk amount of SS owing to the loss of energy and cost. Therefore, it is strongly suggested for continuous processing that only concentrated organics of the aqueous phase can be recirculated with wet SS. This could enhance the bio-crude productivity under controlled dry matter conditions. However, the evaporation of water from the aqueous phase to obtain the concentrated organics can also require some cost, and simultaneously may lose some light organic fractions. Thus, the Techno economic analysis (TEA) study would be carried out to have the cost estimation comparison between these two strategies to make the aqueous phase recycling more economically viable for HTL.


 ,
, 


