
Study on the Design and Operation of an Outdoor Air-Cooling System for a Computer Room

Abstract
:1. Introduction
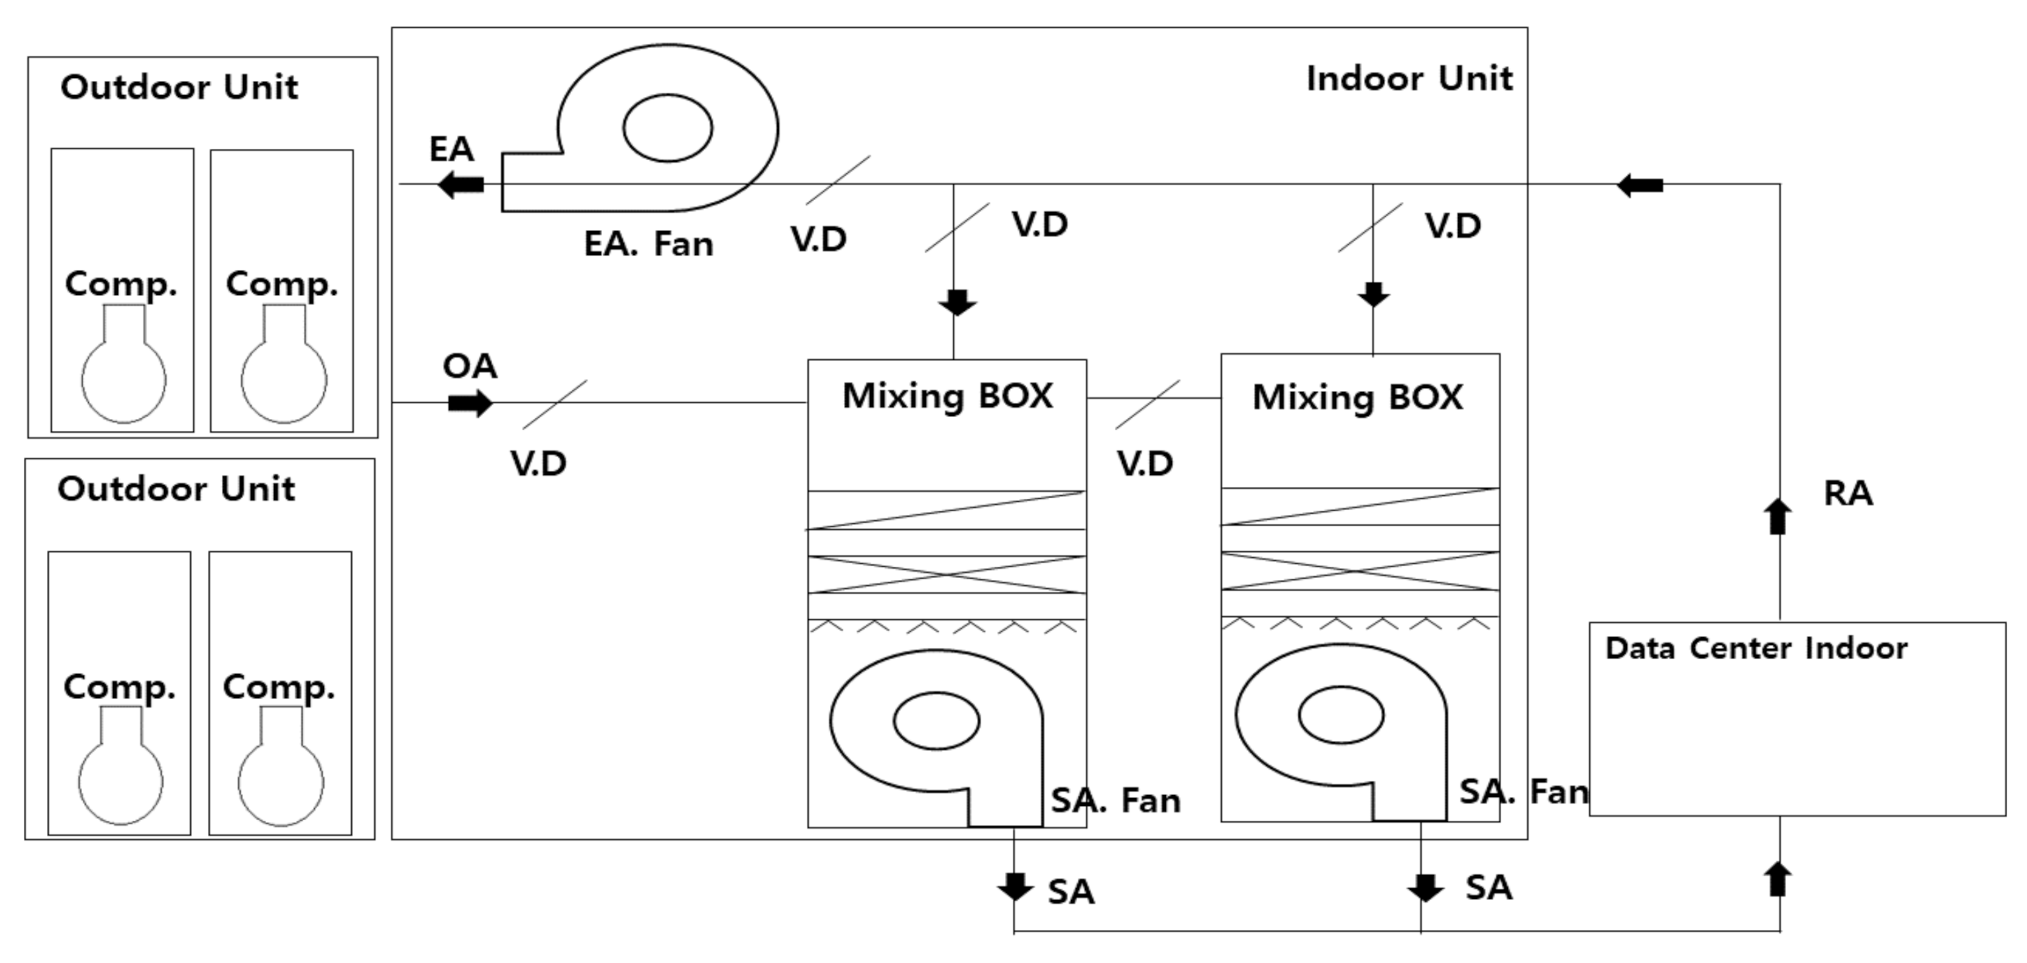
2. Analysis Models and Methods
2.1. Analysis Model
2.1.1. Cooling Load Model
- Heat exchange occurs only through the wall and window in contact with the outdoor air, excluding all other parts.
- Heat transmission occurs one-dimensionally.
- The indoor temperature and humidity are maintained at the values set by the thermo-hygrostat throughout the year.
- The heat release rate of the ICT equipment is a constant given value throughout the year.
- The indoor heat release is included in the heat release of the ICT equipment because the former is negligible compared with the latter.
2.1.2. Fan Model
2.2. Analysis Methods
3. Results and Discussion
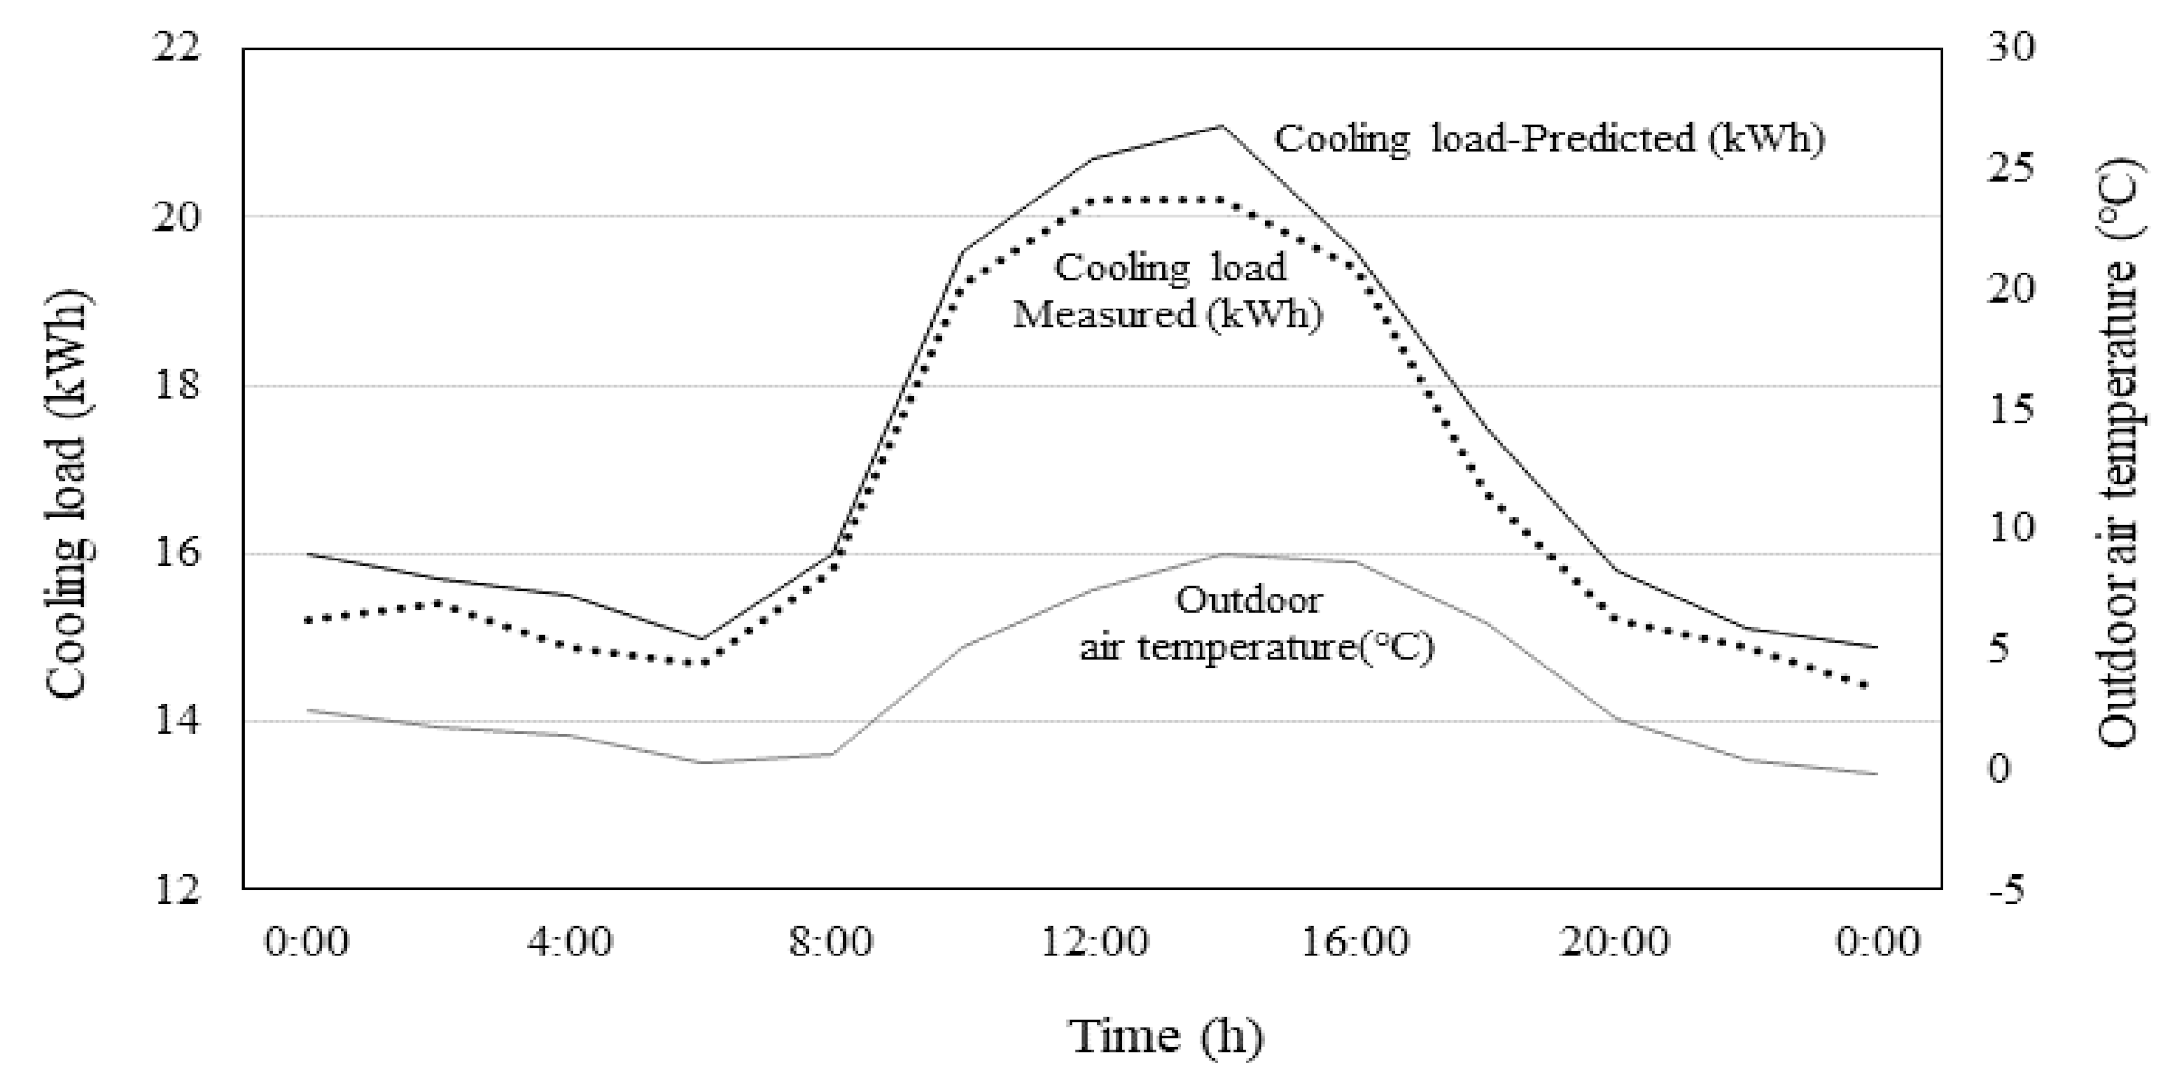
3.1. Verification of the Calculation Results
3.2. Changing Characteristics of Cooling Load
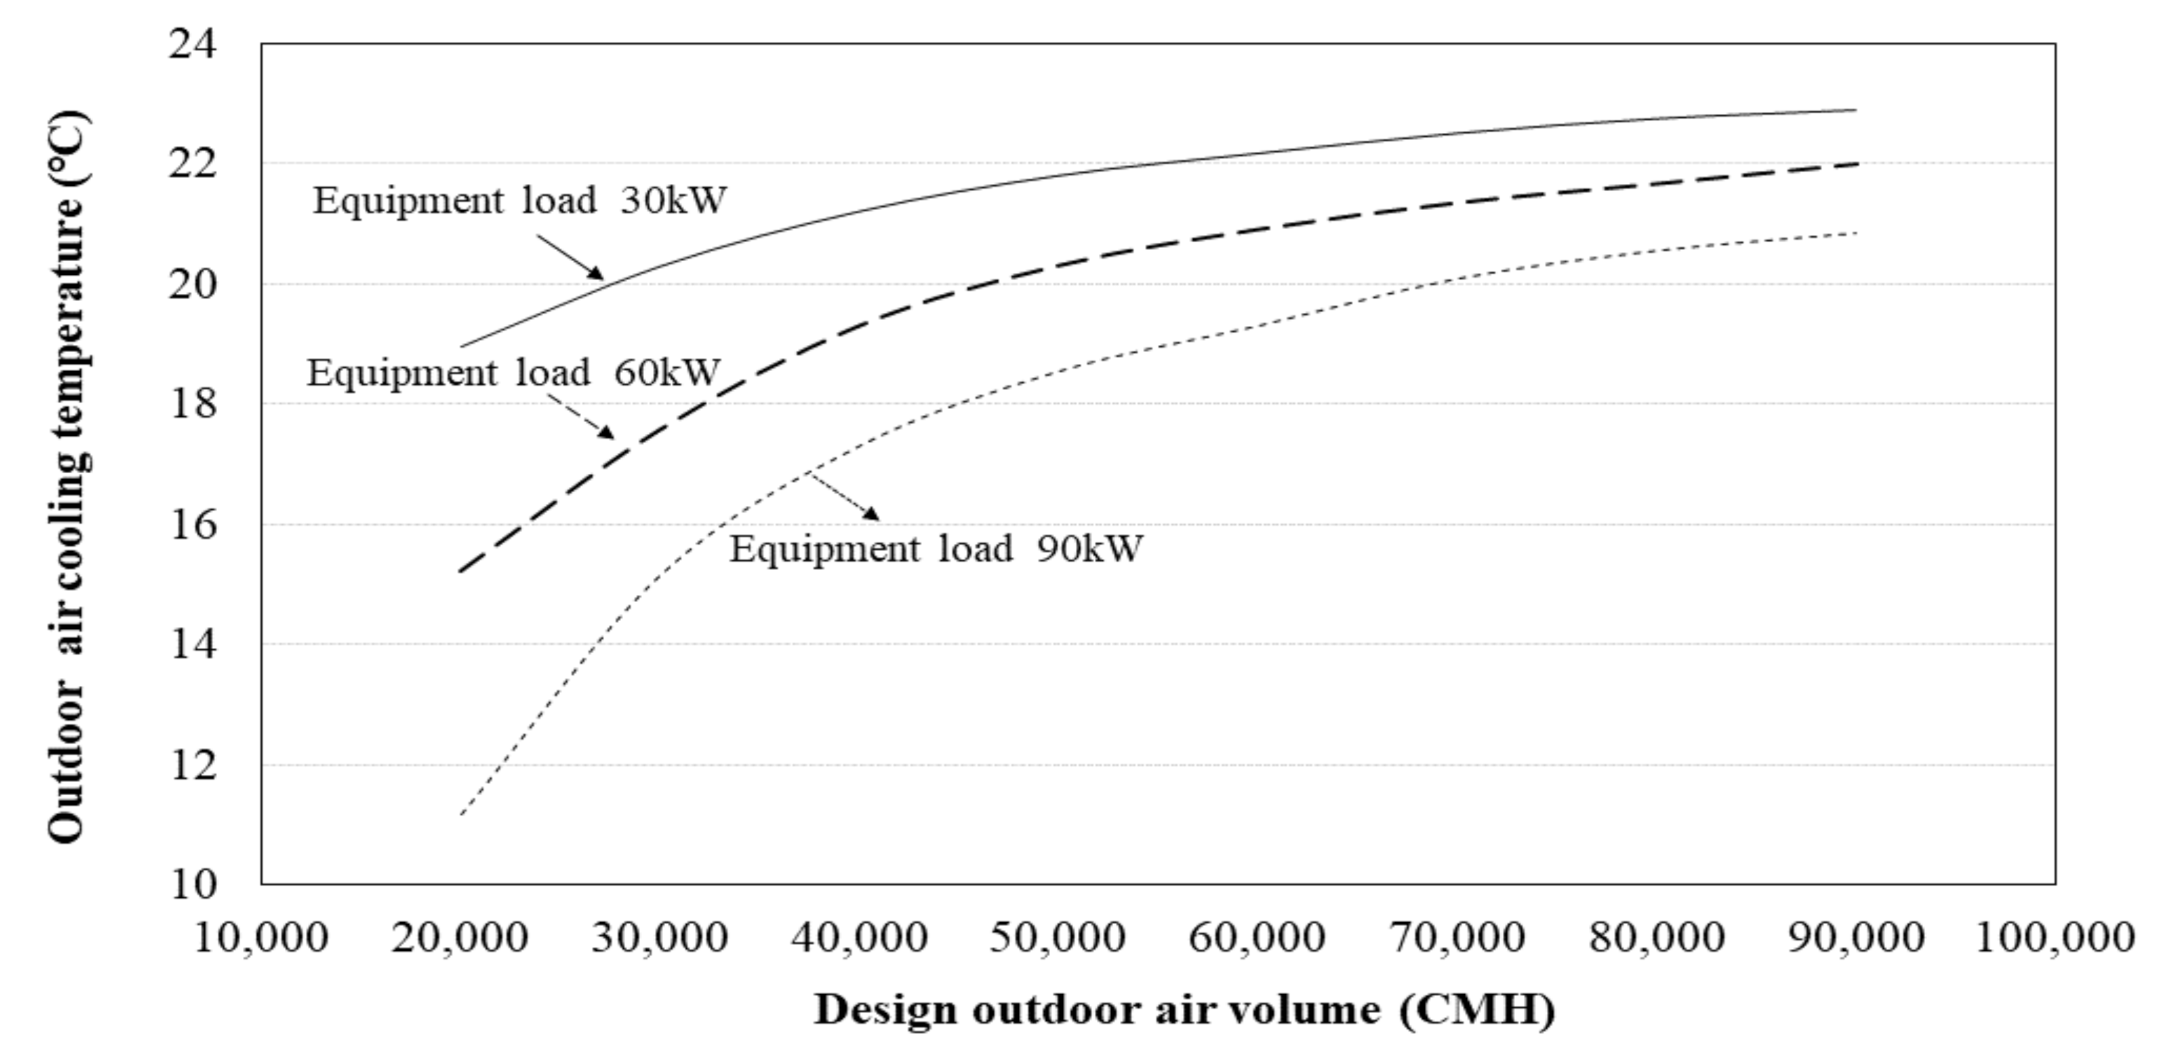
3.3. Effects of Design Parameters
3.4. Effects of Operating Parameters
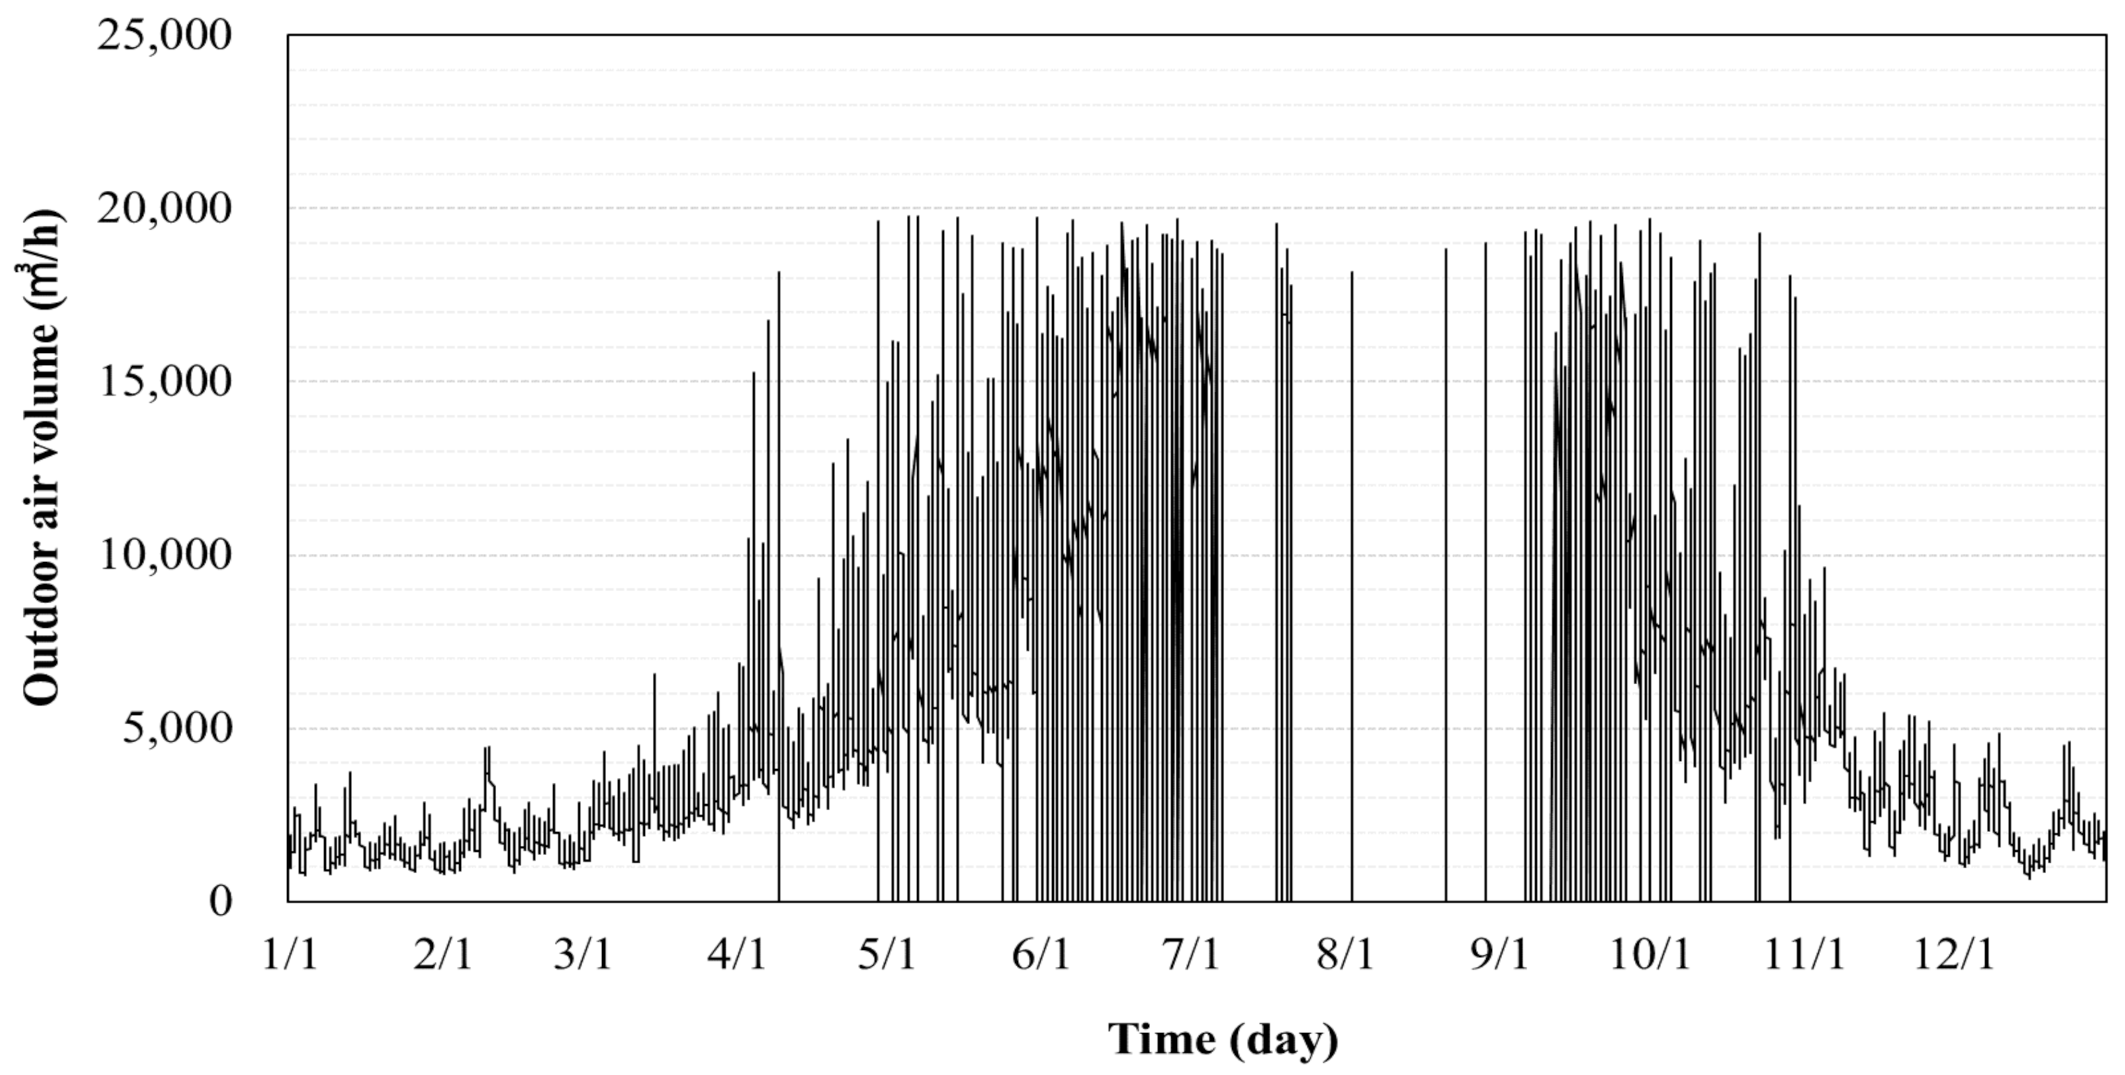
3.5. Outdoor Air-Cooling Operation Time
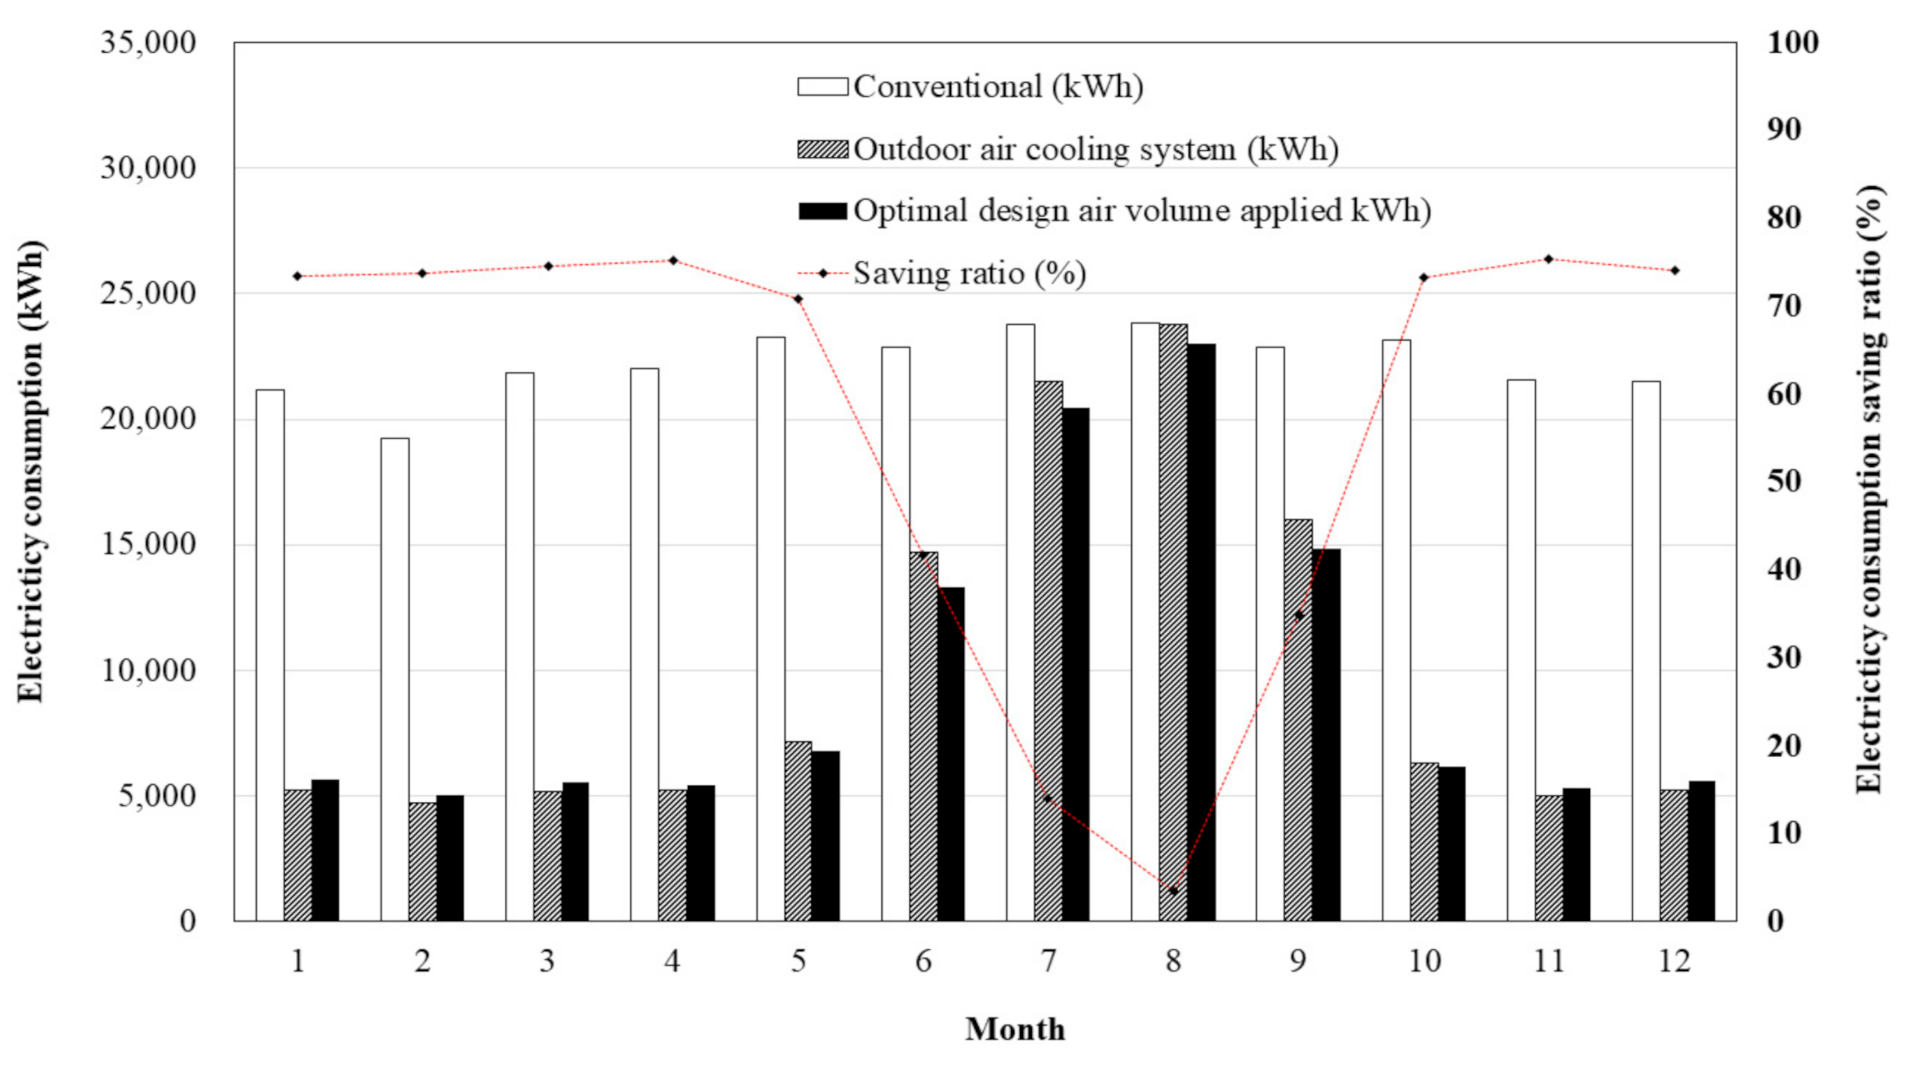
3.6. Analysis of the Effects of Outdoor Air Cooling
4. Conclusions
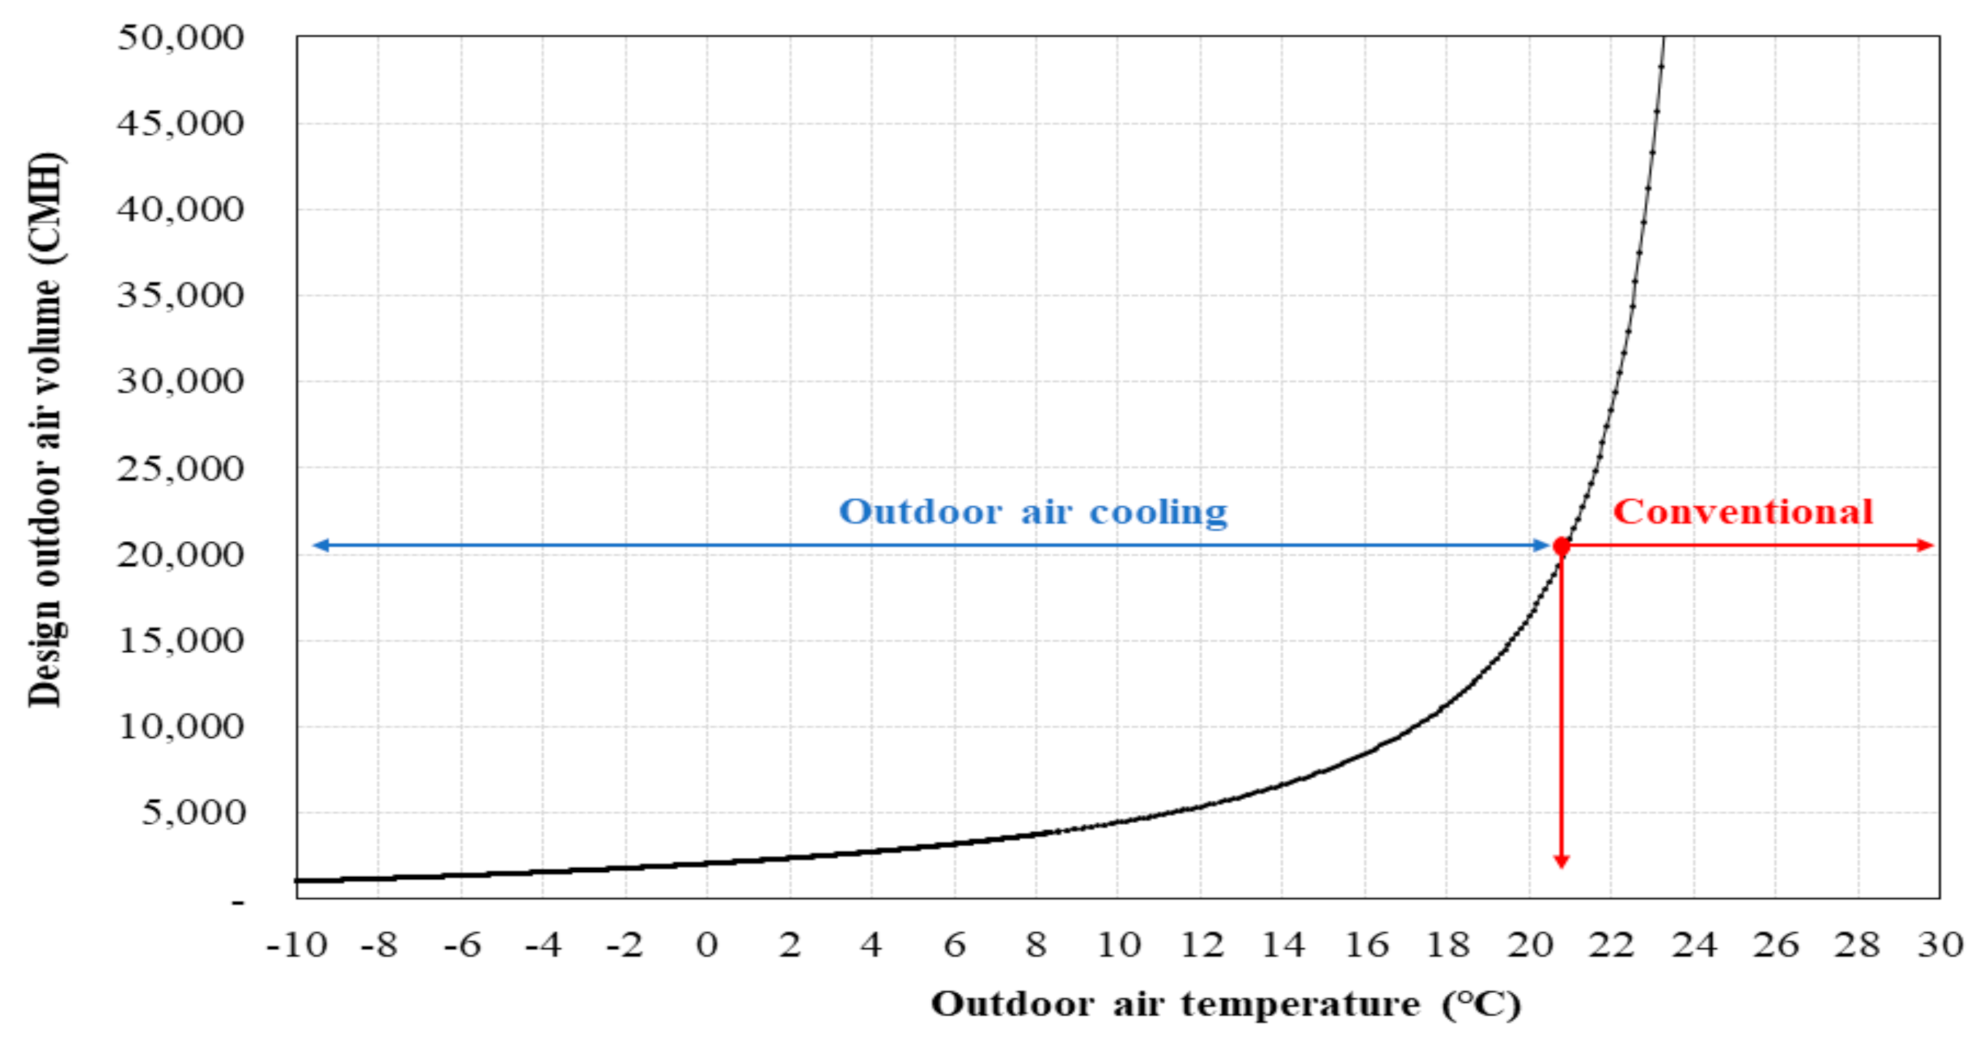
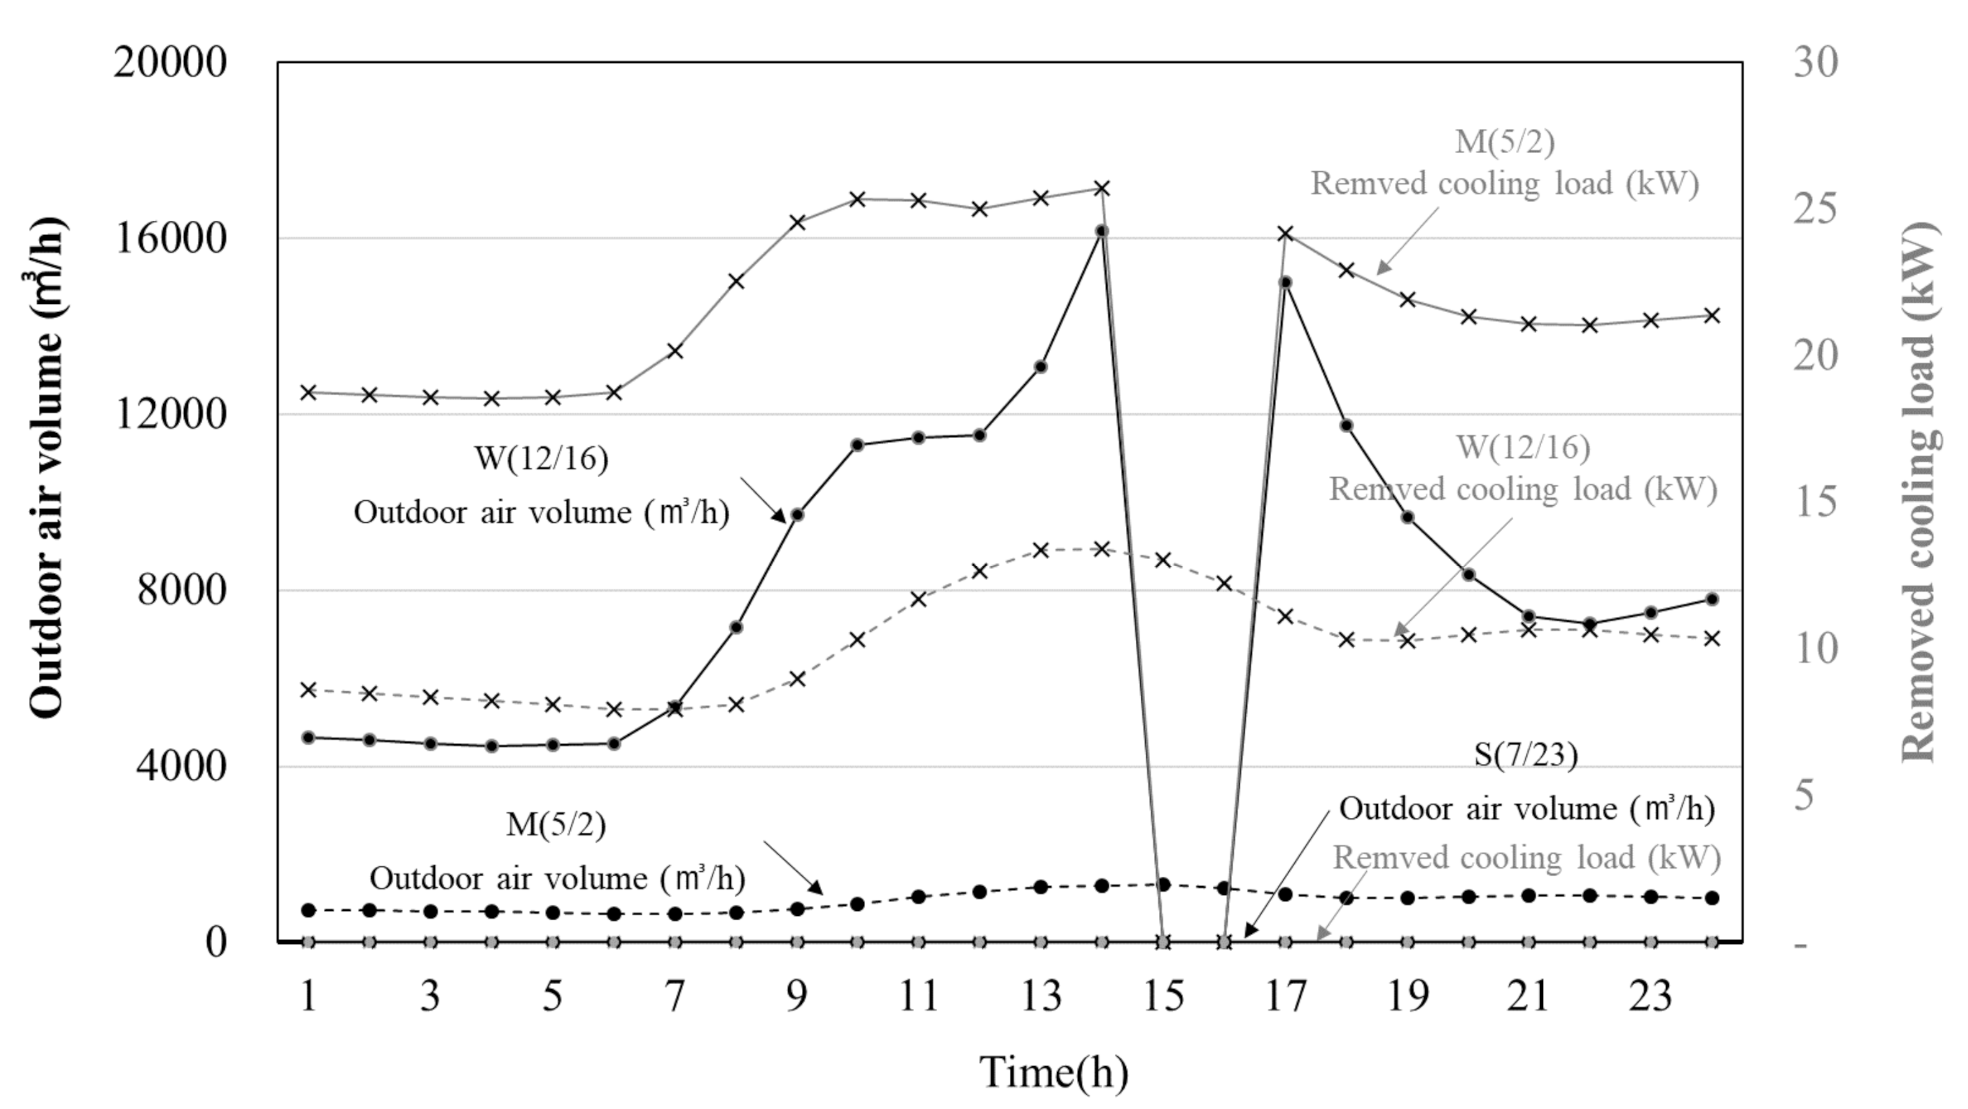
- A computer room has high cooling load throughout the year because of high equipment load. When an air volume of 20,000 m3/h was applied, which is the rated capacity of the fan used for the analysis model of outdoor air cooling, outdoor air cooling could be allowed only up to the outdoor air temperature limit of 20.4 °C. An analysis of the fan air volume required for cooling and the heat removed by the fan on the representative days of three seasons (summer, winter, and midseason) indicated that, the lower the outdoor air temperature, the greater is the efficiency of outdoor air cooling because indoor heat could be removed with smaller air volume.
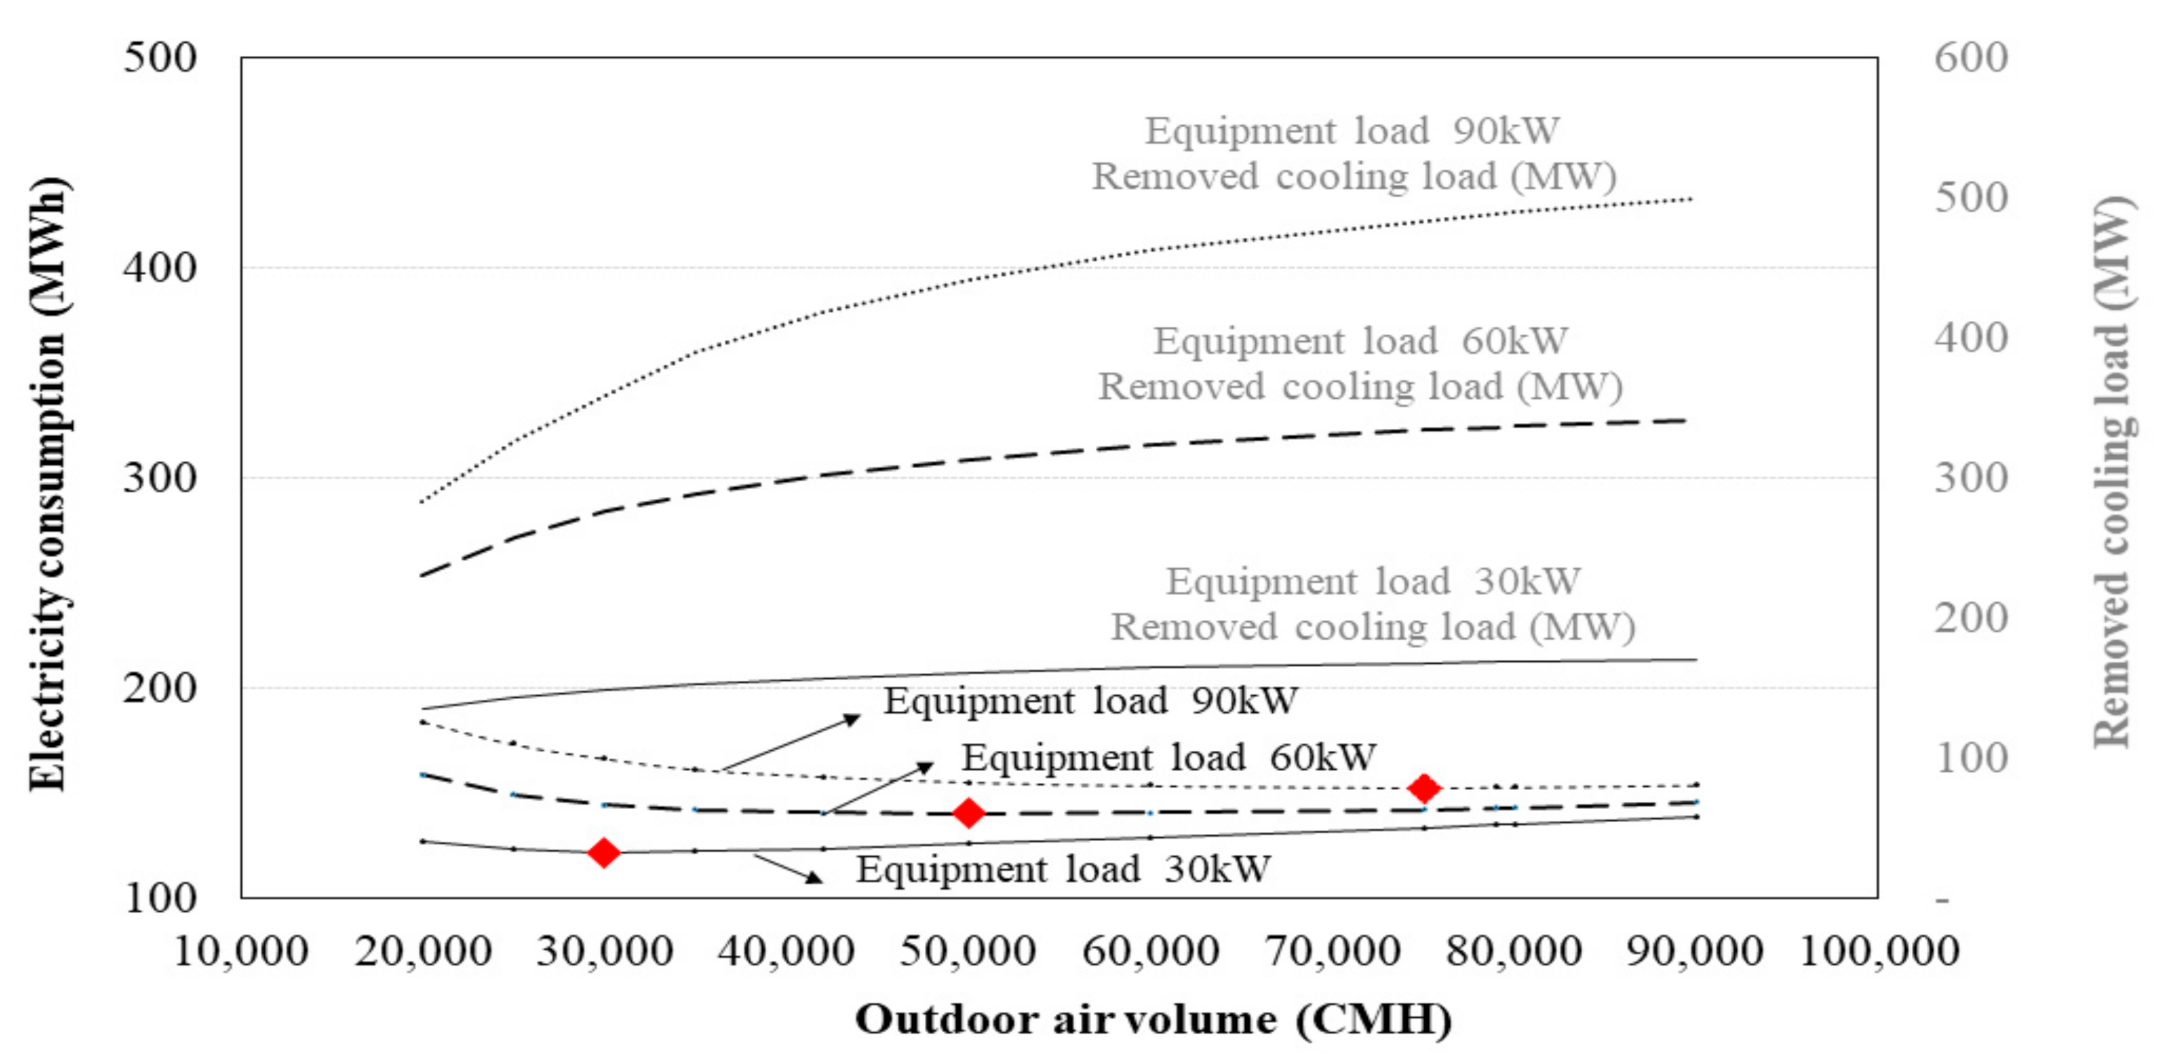
- While an increase in air volume can prolong the operation period of outdoor air cooling, it also results in an increase in the power consumption of the fan. Therefore, at the system design stage, it is recommended to select the optimal air volume by considering the theoretically possible maximum air volume along with the equipment load, the efficiency of the fan, and the performance of the thermo-hygrostat. We performed numerical analysis and identified the design air volume when the annual power consumption reached the minimum value with respect to the capacity and load of the ICT equipment, i.e., when the highest cost-saving effect was achieved.
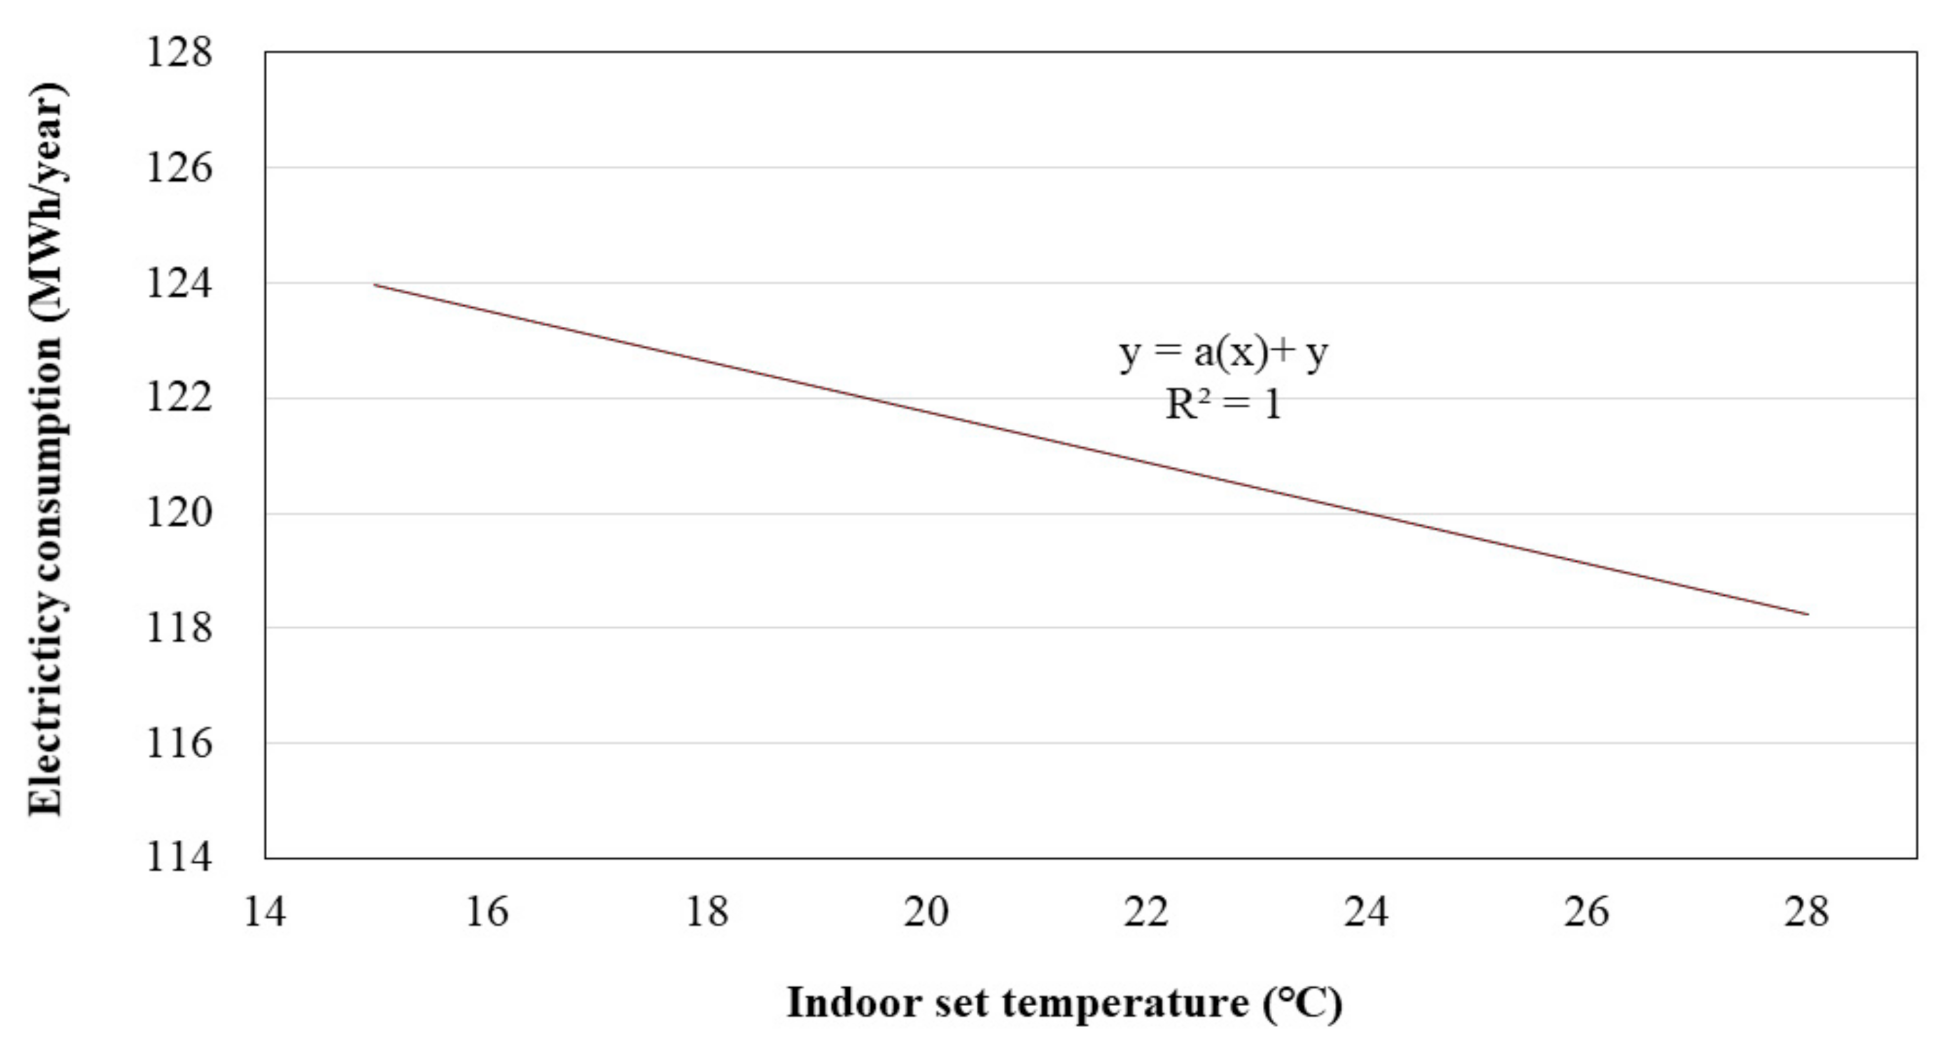
- Once the outdoor air-cooling system is installed, the indoor temperature and the design outdoor air temperature switching to outdoor air cooling are considered crucial operating parameters. Our analysis revealed that each increase of 1 °C in the indoor set temperature results in a power-saving effect amounting to 441 kWh per year, which is tantamount to 0.4% less power consumed every year.
- The results of the analysis of the time periods during which the application of outdoor air cooling was allowed under the conditions of design air volume and optimal design air volume are as follows. The total durations for application of outdoor air cooling were estimated to be 5545 h and 6739 h, respectively, out of 8760 h for the design air volume (20,000 m3/h) and optimal design air volume (26,200 m3/h).
- The optimal design air volume was calculated according to the equipment load. Consequently, the optimal design air volume of the modeled computer system was obtained as 26,200 m3/h. Application of this optimal design air volume is expected to yield an annual energy-saving effect of 56.1% compared with power consumption in the air-conditioning period during which application of outdoor air cooling is impossible.
Author Contributions
Funding
Informed Consent Statement
Data Availability Statement
Conflicts of Interest
Nomenclature
| A | Area of the space (m2) |
| C | Specific heat of air (kcal/kg·°C) |
| ICT | Information and Communications Technology |
| K | Heat transmission rate (W/m2·K) |
| N | Ventilation rate (m3/h) |
| P_f | Fan power consumption (kW) |
| P_s | Fan static pressure (mmAq) |
| P_R | Power consumption of thermo-hygrostat (kW) |
| Airflow ratio (m3/h) | |
| HVAC load (kal/h) | |
| ICT equipment heat load (kal/h) | |
| Transmission load (kal/h) | |
| (Sensible heat) infiltration load (kal/h) | |
| (Latent heat) infiltration load (kal/h) | |
| Solar radiation load (kal/h) | |
| SHGC | Solar heat gain coefficient |
| T_o | Outdoor air temperature (°C) |
| ΔT | Difference between the indoor and outdoor temperatures (°C) |
| V | Volume of the space (m3) |
| η | Fan efficiency (%) |
| φ | Absolute humidity (kg/kg) |
| Subscript | |
| equip | ICT equipment |
| f | Fan |
| inf | Infiltration |
| LH | Latent heat load |
| o | Outdoor air |
| R | Thermo-hygrostat |
| s | Static pressure |
| SH | Sensible heat load |
| sol | Solar radiation load |
| th | Heat transmission rate |
References
- Nam, D.Y. Data Center Is Growing at ‘Hyperscale’ Scale in 5G Era. 2019. Available online: https://www.techm.kr/news/articleView.html?idxno=72449 (accessed on 10 June 2020).
- LG CNS Infraservice Group. Data Centers Joins the Energy-saving Movement with Sustainable Technology. LG CNS Infraservice Group. Available online: https://blog.lgcns.com/881 (accessed on 24 August 2015).
- Lee, K.B. Cool Wind on Mount Gubong; Naver Dater Center: Chuncheon, Korea, 2019. [Google Scholar]
- Lee, J.Y.; Kim, J.H.; Yoen, C.K.; Jung, C.S. Action plan for the outdoor air cooling system in a data center. In Proceedings of the 2014 Winter Symposium of the Korea Institute of Civil Engineering and Building Technology, Seoul, Korea, 22 November 2014; pp. 214–218. [Google Scholar]
- Cho, J.K.; Shin, S.H. Power and heat load of IT equipment projections for new data centerʼs hvac system design. Korean J. Air Cond. Refrig. Eng. 2012, 24, 212–217. [Google Scholar]
- Cho, J.K. Energy Efficiency Technology in Data Centers. Korean J. Air Cond. Refrig. Eng. 2012, 41, 60–67. [Google Scholar]
- Cho, J.K.; Shin, S.H.; Lee, J.Y. Case study and energy impact analysis of cooling technologies as applied to green data centers. J. Archit. Inst. Korea Plan. Des. 2013, 29, 327–334. [Google Scholar]
- Park, S.; Seo, J.; Jung, Y.H.; Chang, H.J.; Hwang, S.H. Energy Consumption analysis based on filter differential pressure when adopting an air-side economizer system for a data center. Korean J. Air Cond. Refrig. Eng. 2013, 25, 371–376. [Google Scholar]
- Jung, Y.H.; Jang, H.J.; Joe, J.H.; Park, B.Y. Cooling energy saving effects by hybrid economizer cycle in data center. Korean Inst. Archit. Sustain. Environ. Build. Syst. 2013, 11, 311–314. [Google Scholar]
- Park, S.H.; Seo, J. Economic Evaluation of Air-side Economizer System for Data Center. Korean J. Air Cond. Refrig. Eng. 2014, 26, 145–150. [Google Scholar]
- Kim, J.Y.; Chang, H.J.; Jung, Y.H. Study on the development of energy conservation system for data center by utilizing multi-staged outdoor air cooling. Archit. Inst. Korea 2014, 34, 267–268. [Google Scholar]
- Kim, S.H.; Yeon, J.Y.; Choi, Y.K.; Lee, E.K. A study on free cooling system for the energy saving in the data center. Korean J. Air Cond. Refrig. Eng. 2011, 7, 810–814. [Google Scholar]
- Lee, J.Y.; Kim, J.H.; Yoen, C.K.; Jung, C.S. Green data design examples. Mag. Soc. Air Cond. Refrig. Eng. Korea 2013, 42, 40–46. [Google Scholar]
- Lee, J.Y.; Kim, J.H.; Yoen, C.K.; Jung, C.S. Air-side economizer strategies for data centers. Mag. Soc. Air Cond. Refrig. Eng. Korea 2014, 11, 214–218. [Google Scholar]
- Ham, S.W.; Kim, M.H.; Jeong, J.W. Energy saving potentials of various air-side economizers in a modular center for supply air conditions and geological locations. J. Archit. Inst. Korea Plan. Des. 2014, 30, 263–270. [Google Scholar] [CrossRef]
- Bae, J.K. A case study on the building of green internet data center for green IT. Glob. Bus. Assoc. 2011, 12, 329–348. [Google Scholar]
- Jo, H.; Kim, S.H.; Lee, S.K. A strategic design of green data center: The case of data center in the domestic public sector. J. Korean Inst. Inf. Technol. 2012, 10, 143–152. [Google Scholar]
- Jon, F. Dell’s Next Generation Servers: Pushing the Limits of Data Center Cooling Cost Savings. 2012. Available online: http://dell.postclickmarketing.com/Global/FileLib/12g-vs-hp/12g-data-center-fresh-air.pdf (accessed on 28 February 2021).
- Masanet, E.; Shehabi, A.; Lei, N.; Smith, S.; Koomey, J. Recalibrating global data center energy-use estimates. Science 2020, 367, 984–986. Available online: https://science.sciencemag.org/content/367/6481/984 (accessed on 28 February 2020). [CrossRef] [PubMed]
- Jaume, S. Cost-Effective Renewable Cooling on Green Data Centres; Catalonia Institute for Energy Research: Barcelona, Spain, 2014; Available online: http://citeseerx.ist.psu.edu/viewdoc/download?doi=10.1.1.708.6831&rep=rep1&type=pdf (accessed on 10 December 2014).
- Seo, J.H.; Park, S. A study on the application of air-side economizer system for the data center. Korean Sol. Energy Soc. 2013, 33, 150–153. [Google Scholar]
- Ham, S.W.; Kim, M.H.; Choi, B.N.; Jeong, J.W. A study of direct air-side economizer control strategies for a modular data center. Archit. Inst. Korea 2014, 34, 243–244. [Google Scholar]
- Mahdi, D.D.; Namanlo, S.V. Potentiometric and economic analysis of using air and water-side economizers for data center cooling based on various weather conditions. Int. J. Refrig. 2019, 99, 213–225. [Google Scholar]
- Kim, J.H.; Aum, T.Y.; Jeong, C.S. Energy performance of air-side economizer system for data center considering supply temperature and design airflow rate of CRAH. Archit. Inst. Korea 2019, 35, 181–188. [Google Scholar]
- Hwang, J.H.; Lee, T.W. Outdoor air-cooling system for a computer room and its corresponding energy-saving effect. Energies 2020, 13, 5719. [Google Scholar] [CrossRef]


| Site modeling | Site: Koyang, Gyeonggi Floor area: 156.48 m2 Height: 2.97 m Heat transmission rate of the wall: 0.64 W/m2K Heat transmission rate of the window: 4.1 W/m2K Heat transmission rate of the floor: 0.61W /m2K Infiltration: 276 m3/h SHGC (solar heat gain): 0.67 |
| Servers | Number of racks: 32 (600 × 1000 × 2000) Heat release rate from the servers: 22,560 W (Estimated) |
| Equipment | Air Volume (m3/h) | Electricity Consumption (kW) |
|---|---|---|
| SA Fan | 10,000 × 1 EA | 3.2 × 2 EA |
| Thermo-hygrostat Compressor | - | 7.2 × 4 EA |
| Outdoor air cooling EA Fan, Inverter | 20,000 × 1 EA | 4.7 × 1 EA |
| Types of Weather Conditions | Averaged Temperature (°C) |
|---|---|
| S (summer) | 32.6 |
| M (middle season) | 11.9 |
| W (winter) | −11.7 |
| Design Parameters | Operating Parameters | |
|---|---|---|
| Outdoor Air-Cooling Air Volume (m3/h) | Equipment Heat Load (kW) | Indoor Temperature (°C) |
| 20,000 | 20 | 15 |
| 30,000 | 30 | 17 |
| 40,000 | 40 | 19 |
| 50,000 | 50 | 21 |
| 60,000 | 60 | 23 |
| 70,000 | 70 | 26 |
| 80,000 | 80 | 28 |
| 90,000 | 90 | |
| 100 | ||
| 110 | ||
| Time (h) | Outdoor Air Temperature (°C) | Cooling Load (kWh) | (Y1 − Y2)2 | |
|---|---|---|---|---|
| Y1-Predicted | Y2-Measured | |||
| 0:00 | 2.5 | 16.0 | 15.2 | 0.64 |
| 2:00 | 1.8 | 15.7 | 15.4 | 0.09 |
| 4:00 | 1.5 | 15.5 | 14.9 | 0.36 |
| 6:00 | 0.3 | 15.0 | 14.7 | 0.09 |
| 8:00 | 0.7 | 16.0 | 15.8 | 0.04 |
| 10:00 | 5.1 | 19.6 | 19.2 | 0.16 |
| 12:00 | 7.5 | 20.7 | 20.2 | 0.25 |
| 14:00 | 9 | 21.1 | 20.2 | 0.81 |
| 16:00 | 8.6 | 19.6 | 19.4 | 0.04 |
| 18:00 | 6.1 | 17.5 | 16.7 | 0.64 |
| 20:00 | 2.1 | 15.8 | 15.2 | 0.36 |
| 22:00 | 0.4 | 15.1 | 14.9 | 0.04 |
| 24:00 | −0.1 | 14.9 | 14.4 | 0.25 |
| Total | 3.77 | |||
| Equipment Load (kW) | Design Outdoor Air Volume (m3/h) | Electricity Consumption (MWh) |
|---|---|---|
| 20 | 25,000 | 115 |
| 30 | 30,000 | 122 |
| 40 | 35,000 | 129 |
| 50 | 42,000 | 135 |
| 60 | 50,000 | 141 |
| 70 | 60,000 | 145 |
| 80 | 69,000 | 149 |
| 90 | 75,000 | 153 |
| 100 | 79,000 | 157 |
| 110 | 80,000 | 158 |
| Month | Conventional (kWh) | Outdoor Air-Cooling System (kWh) | Saving Ratio (%) | Optimal Design Air Volume Applied (kWh) | Saving Ratio (%) |
|---|---|---|---|---|---|
| 1 | 21,193 | 5240 | 75.3 | 5639 | 73.4 |
| 2 | 19,254 | 4718 | 75.5 | 5067 | 73.7 |
| 3 | 21,828 | 5180 | 76.3 | 5535 | 74.6 |
| 4 | 22,030 | 5264 | 76.1 | 5447 | 75.3 |
| 5 | 23,281 | 7144 | 69.3 | 6772 | 70.9 |
| 6 | 22,847 | 14,699 | 35.7 | 13,339 | 41.6 |
| 7 | 23,783 | 21,509 | 9.6 | 20,446 | 14.0 |
| 8 | 23,857 | 23,749 | 0.5 | 23,030 | 3.5 |
| 9 | 22,859 | 15,995 | 30.0 | 14,871 | 34.9 |
| 10 | 23,136 | 6321 | 72.7 | 6164 | 73.4 |
| 11 | 21,591 | 5012 | 76.8 | 5326 | 75.3 |
| 12 | 21,515 | 5213 | 75.8 | 5592 | 74.0 |
| Total | 267,174 | 120,044 | 55.1 | 117,228 | 56.1 |
| Month | 1 | 2 | 3 | 4 | 5 | 6 | 7 | 8 | 9 | 10 | 11 | 12 | Total |
|---|---|---|---|---|---|---|---|---|---|---|---|---|---|
| Outdoor air-cooling system operating time (h) | 743 | 672 | 744 | 676 | 492 | 82 | 0 | 0 | 95 | 576 | 720 | 745 | 5545 |
| Optimal design air volume applied operating time (h) | 743 | 672 | 744 | 716 | 704 | 422 | 155 | 42 | 351 | 725 | 720 | 745 | 6739 |
Publisher’s Note: MDPI stays neutral with regard to jurisdictional claims in published maps and institutional affiliations. |
© 2021 by the authors. Licensee MDPI, Basel, Switzerland. This article is an open access article distributed under the terms and conditions of the Creative Commons Attribution (CC BY) license (http://creativecommons.org/licenses/by/4.0/).
Share and Cite
Hwang, J.; Lee, T. Study on the Design and Operation of an Outdoor Air-Cooling System for a Computer Room. Energies 2021, 14, 1670. https://doi.org/10.3390/en14061670
Hwang J, Lee T. Study on the Design and Operation of an Outdoor Air-Cooling System for a Computer Room. Energies. 2021; 14(6):1670. https://doi.org/10.3390/en14061670
Chicago/Turabian StyleHwang, JiHyun, and Taewon Lee. 2021. "Study on the Design and Operation of an Outdoor Air-Cooling System for a Computer Room" Energies 14, no. 6: 1670. https://doi.org/10.3390/en14061670
APA StyleHwang, J., & Lee, T. (2021). Study on the Design and Operation of an Outdoor Air-Cooling System for a Computer Room. Energies, 14(6), 1670. https://doi.org/10.3390/en14061670