1. Introduction
In recent decades, the diffusion of photovoltaic (PV) systems has grown rapidly, thanks to their increasing competitiveness compared to other power plant technologies, low maintenance costs, and limited environmental impact.
In a PV module, the amount of solar radiation not converted into electricity leads to an increase in the operating temperature of the PV cells, which in turn causes a loss of electrical efficiency [
1]. Hybrid photovoltaic/thermal collectors (PV/T) can be considered as the most recognized technology for actively cooling the PV modules and improving their performance [
2]. The heat wasted from the PV cell is conveyed through heat transfer fluids (HTF), such as air and water, and it can be used for satisfying several kinds of energy needs.
This technology makes it possible to simultaneously exploit the two forms of energy, electrical and thermal; in this way, a cogeneration system is created [
3,
4]. PV/T systems can be used in multiple applications, like residential rooftop solar PV [
5], electricity generation in small-scale solar PV, desalination processes for supplying drinkable water in coastal regions, PV in agriculture, and so on [
6]. PV/T collectors can be classified as a function of the cooling fluid, such as water or air-based PV/T collectors [
7,
8], or bi-fluid PV/T when more than one fluid is used [
9]. Air-based PV/T collectors represent a simple and economical solution for cooling the PV cells. However, the use of air as an HTF has disadvantages due to its low thermal conductivity, density, and specific heat [
10]. PV/T air collectors can present different configurations of the airflow, above or below the absorber, on both sides of the absorber, with a single or double passage. The experiments show that the overall efficiency of a PVT with a single fluid flowing for both above or below the PV cell is the best, with total efficiency as high as 61.4% [
11].
A theoretical study on a PV/T air collector coupled with a compound parabolic concentrator (CPC) under steady-state energy transfer was investigated by Garg et al. [
12]. The results indicate that high-cost cells may be replaced by low-cost reflectors.
Garg et al. [
13] have evaluated the transient performance of a single and double glass PV/T air collector through the fourth- and fifth-order Runge–Kutta method.
A theoretical and experimental study on a double passage PV/T solar air collector for steady-state conditions was proposed by Sopian et al. [
14]. The performance of double pass PV/T air collectors with fins fixed in the bottom of the absorber under steady-state conditions was analyzed by Othman et al. [
15]. The designs were proven to have high potential in improving the power production of the solar collector, as the combined efficiencies obtained are from 39% to 70% at a mass flow rate ranging from 0.015–0.16 kg/s.
To take into account the effects of the changes of the ambient air temperature, the inlet temperature of the air, airflow, and solar radiation under real operating conditions, it is necessary to adopt a dynamic model to simulate the thermal behavior of a PV/T system [
16].
Water-based PV/T collectors take advantage of the thermal properties of the water as an HTF, such as its high specific heat value [
17] and heat conduction, for achieving high thermal and electrical efficiency.
In literature, the performances of water-based PV/T collectors have been evaluated using finite-difference mathematical models, [
18], ANSYS Computational Fluid Dynamic software [
19], and TRNSYS simulation software by Kalogirou et al. [
20,
21].
Fudholi et al. [
22] developed a laboratory study on three different types of absorber, namely a web-flow, a direct flow, and a spiral flow. It was pointed out that the spiral shape gave rise to the highest PV/T efficiency, which ranged from 79% to 91% at a mass flow rate of 0.011–0.041 kg/s.
A novel serpentine pipe flow-based PV/T collector, which has a maximum thermal efficiency of 76.58%, was presented by Hossain et al. [
23]. Aneli et al. [
24] have evaluated the effects of the uses of nanofluids on the overall performance of WISC PV/T collectors, observing that the use of nanofluids allows an increase in the thermal level without compromising the electrical yields. Rejeb et al. [
25] and Tina et al. [
26] presented studies for the improvement and monitoring of the performance of PV/T collectors.
Bi-fluid PV/T collectors aim to extract more heat and increase the total efficiency per unit area in comparison to conventional PV/T solar collectors.
Tripanagnostopoulos [
27] and Assoa et al. [
28] proposed studies on bi-fluid PV/T collectors. The use of air and water as a heat exchanger has been proposed by Othman et al. [
29]. In their analysis, a double pass PV/T solar collector combined with an expensive transparent PV panel was used. According to the indoor tests, and due to its high mass flow rates (air mass flow rate of 0.05 kg/s and water mass flow rate of 0.02 kg/s), the total thermal efficiency reaches 76%. Despite high efficiency, the average outlet temperature of working fluids when used simultaneously is only 27.4 °C.
D. Su et al. [
30] presented four configurations of dual channels system PV/T collectors with different fluids, whose electrical and thermal performances were analyzed under local Chinese weather conditions. Their analysis pointed out that the water/water-cooled PV/T collector had the highest electrical and thermal performance. Jarimi et al. [
31] presented a numerical and experimental study that analyzed the independent and simultaneous mode of operation of the different fluids. The optimal mass flow rate of each of the fluids was evaluated. Experimental results indicate that the electrical and thermal efficiencies of the system are considered satisfactory under the simultaneous cooling mode.
Roonak [
32] proposes a study on bi-fluid PV/T operating with an air and water flow rate of 0.01 kg/s and 0.003 kg/s, respectively, under the meteorological conditions of Sanandaj, Iran. Maximum overall efficiency of 49.0% and 69.0%, respectively, for the air and water modes was pointed out. The PV/T water mode performed well in both summer and transition seasons, with an average thermal efficiency of 55.1% and 51.5%, while the PV/T air mode achieved a thermal efficiency of 23.9% in winter.
The research on the energy performance of a bi-fluid PV/T system is very limited, and among them, only sheet and tube PV/T collectors have been analyzed [
27,
29,
31,
32].
To our knowledge, there are no studies on bi-fluid PV/T collectors equipped with a roll-bond absorber. The novelty of this study concerns precisely the analysis of the performance of an unglazed PV/T roll bond collector available on the market, which is transformed into a bi-fluid PV/T collector through the addition of an air channel and aluminum absorber equipped with fins. Moreover, in comparison to the other literature studies, a novel arrangement of the layers that constitute the bi-fluid collector is proposed.
This research is in a preliminary phase, so only the energetic analysis devoted to evaluating the performance and the potential field of applications of the bi-fluid PV/T collectors is presented.
The performances of the bi-fluid PV/T collector are investigated through a numerical model developed in the MATLAB environment, which takes into account the energy balance equations, and geometrical and optical features of the different layers that constitute the PV/T collector.
The influence of the flow rate of the two HTFs (air and water) on the thermal behavior of the bi-fluid collector is presented. Finally, a comparative analysis between the conventional water-based PV/T collector, namely PV/T, and the bi-fluid (water/air-based) WISC PVT, named PV/Tb, is presented for both winter and summer days.
2. Materials and Methods
This study aims to study the performances of a novel bi-fluid PV/thermal panel (PVTb) obtained by adding an air channel with the aluminum absorber equipped with fins to a commercial WISC PV/T collector. A layer of thermal insulation has also been added.
2.1. System Description
The reference PV/T module consists of a commercially uncovered and uninsulated PV/T panel (Wave model by Dual Sun) with a roll-bond absorber constituted by two aluminum sheets, joined through a lamination process, where a thin layer of heat transfer fluid is embedded.
The reference PV/T panel is schematized in the following layers: front glass, mono-crystalline (c-Si) PV cells, EVA encapsulating film, Tedlar, two aluminum sheets (roll-bond absorber), and the coolant fluid.
Figure 1 (left side) shows the cross-section. Instead, the novel PVTb presents the addition of a secondary aluminum plate with fins, thermal insulation, an external finishing metal layer, and a ventilated chamber where the second fluid (air) flows (see the cross-section shown in
Figure 1, right side).
The fins have a thickness of 1.0 mm and a height of 25.4 mm, and they are posed with a wheelbase of 25.0 mm, while the air channel has a thickness of 50.0 mm.
The proposed PVTb panel can be easily made by placing the uninsulated PVT panel on the building structure (roof or facade), simultaneously producing electrical energy and thermal energy in the forms of both heated liquid and heated air. Furthermore, the use of aluminum fins has been proposed to increase the transfer of energy to the air.
2.2. Numerical Model
This study was conducted using the numerical model developed in MATLAB, which was widely described and validated on the pilot PV/T plant installed on the Campus of the University of Catania (Italy) [
33].
This numerical model is based on the energy balance equations under non-stationary conditions. For each layer (
ith) of the PV/T panel, the following energy balance is defined:
where the first member indicates the stored energy in the
ith layer, and
and
indicate, respectively, the incoming and the outgoing energy fluxes.
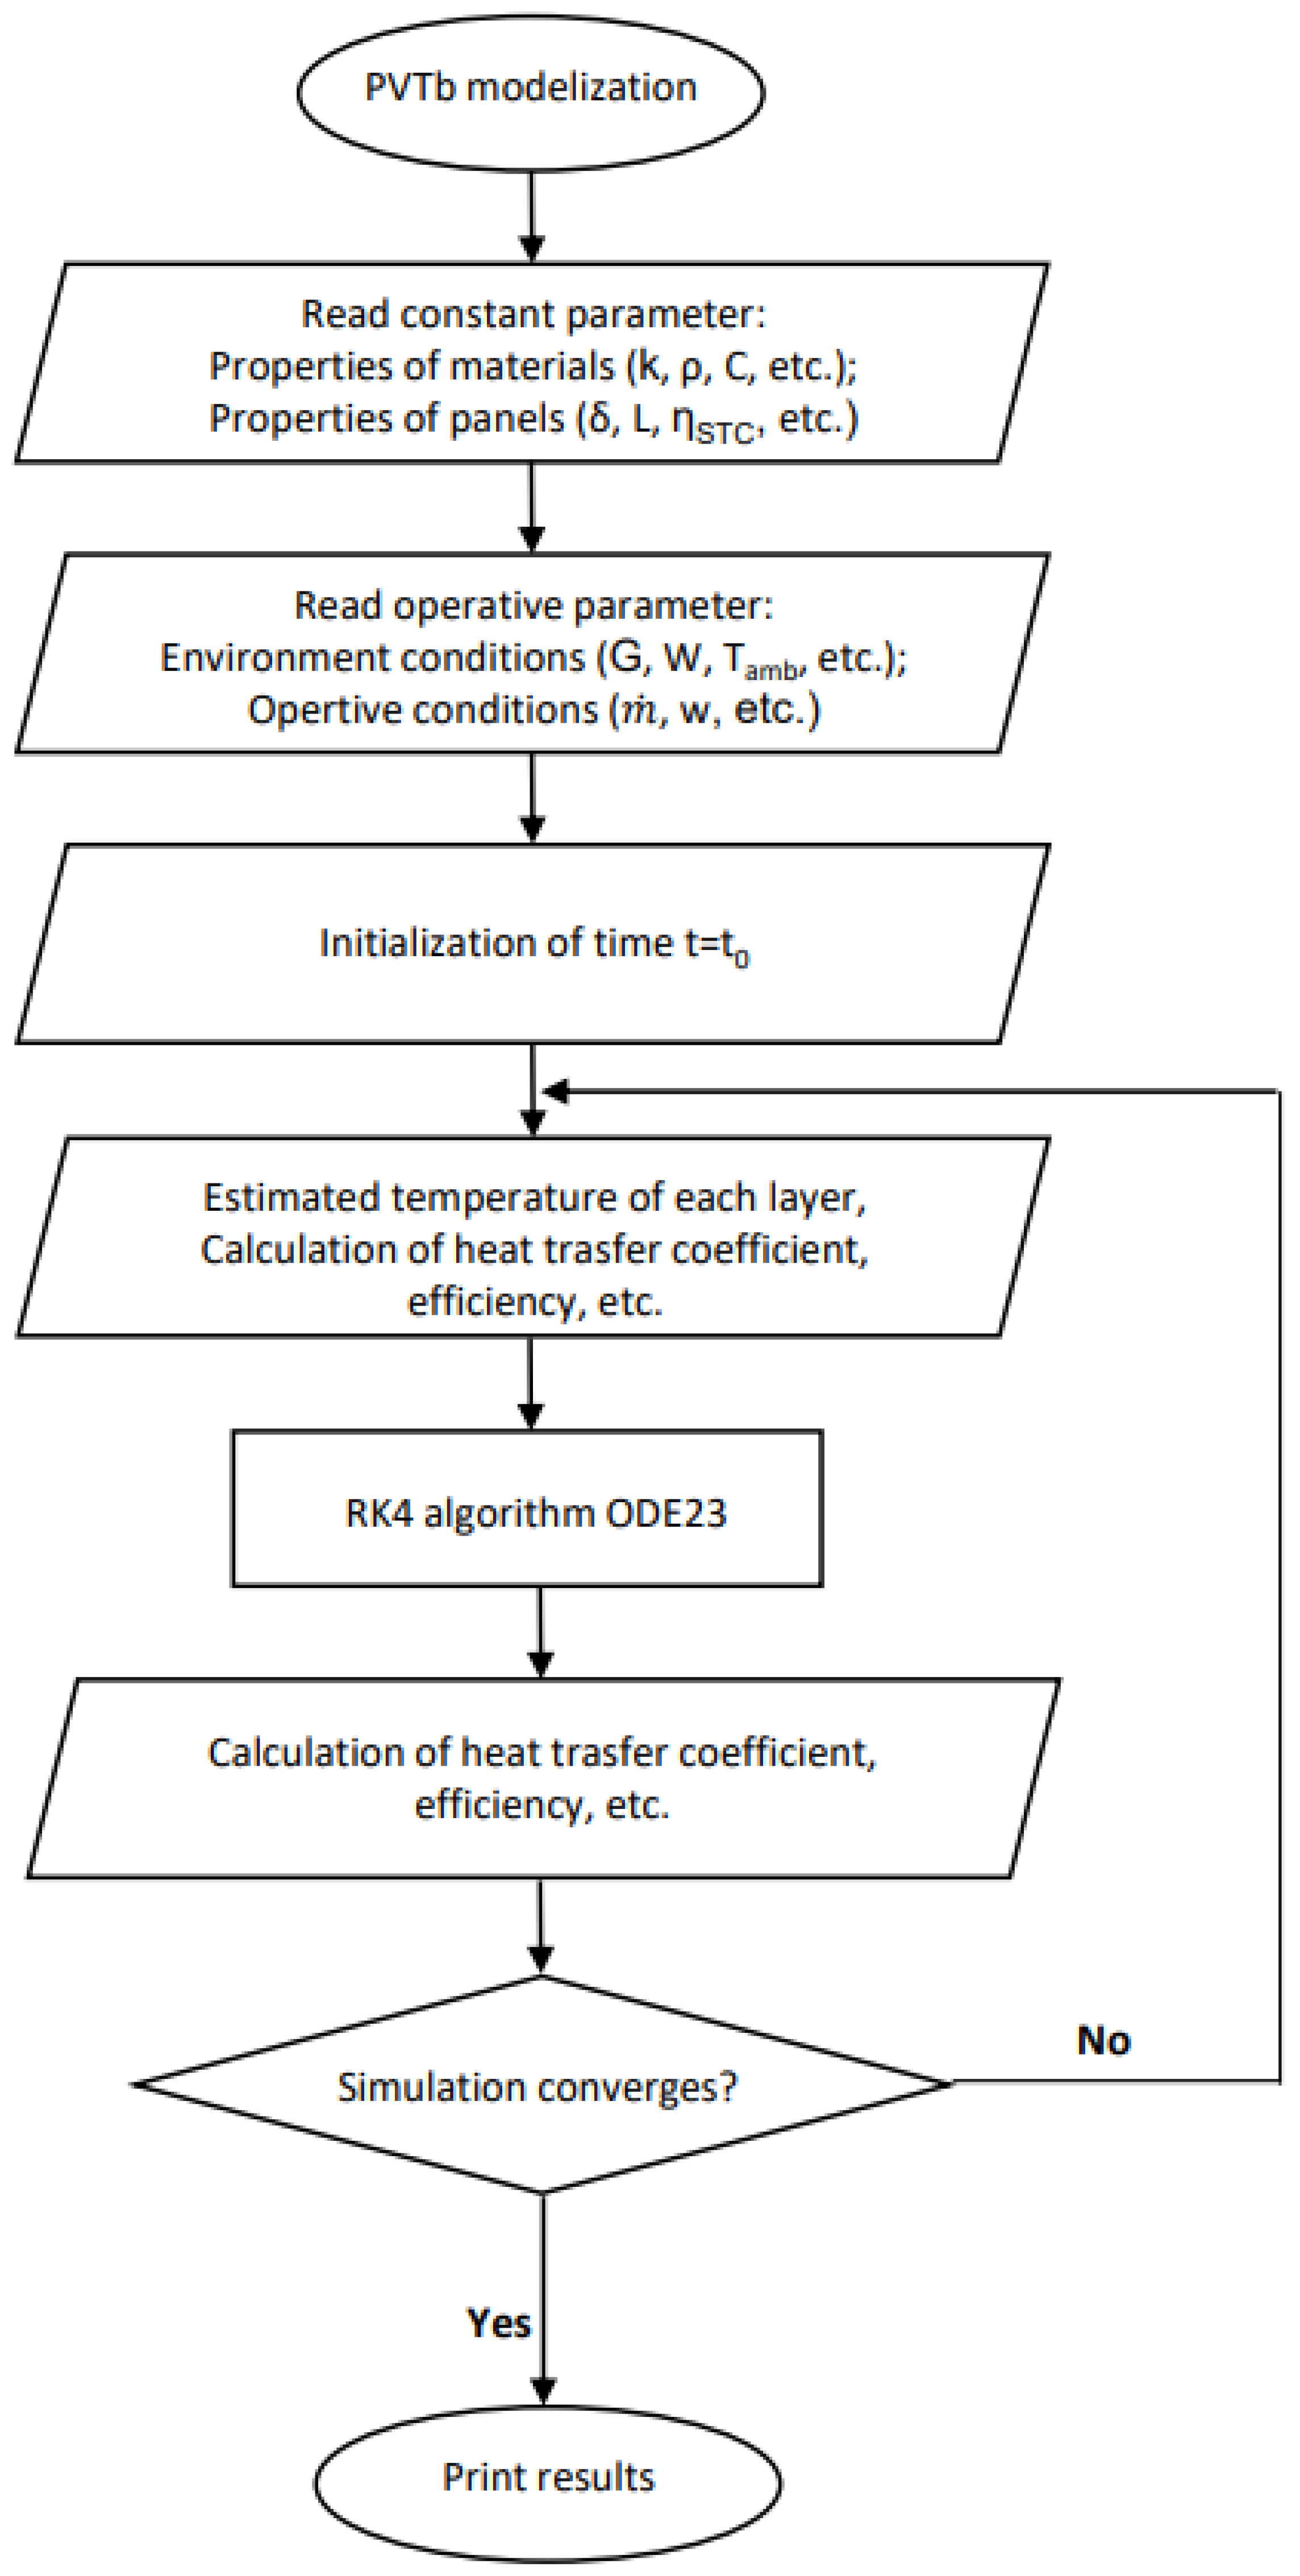
The energy balance equations are simultaneously solved using the ode45 function in MATLAB, modified via the fourth-order Runge–Kutta method. The simulations were conducted using 1440 daily time steps (time step equals 1 min).
The climate parameters included in the model are the air temperature, the wind speed, and the solar irradiance on the PV/T panel.
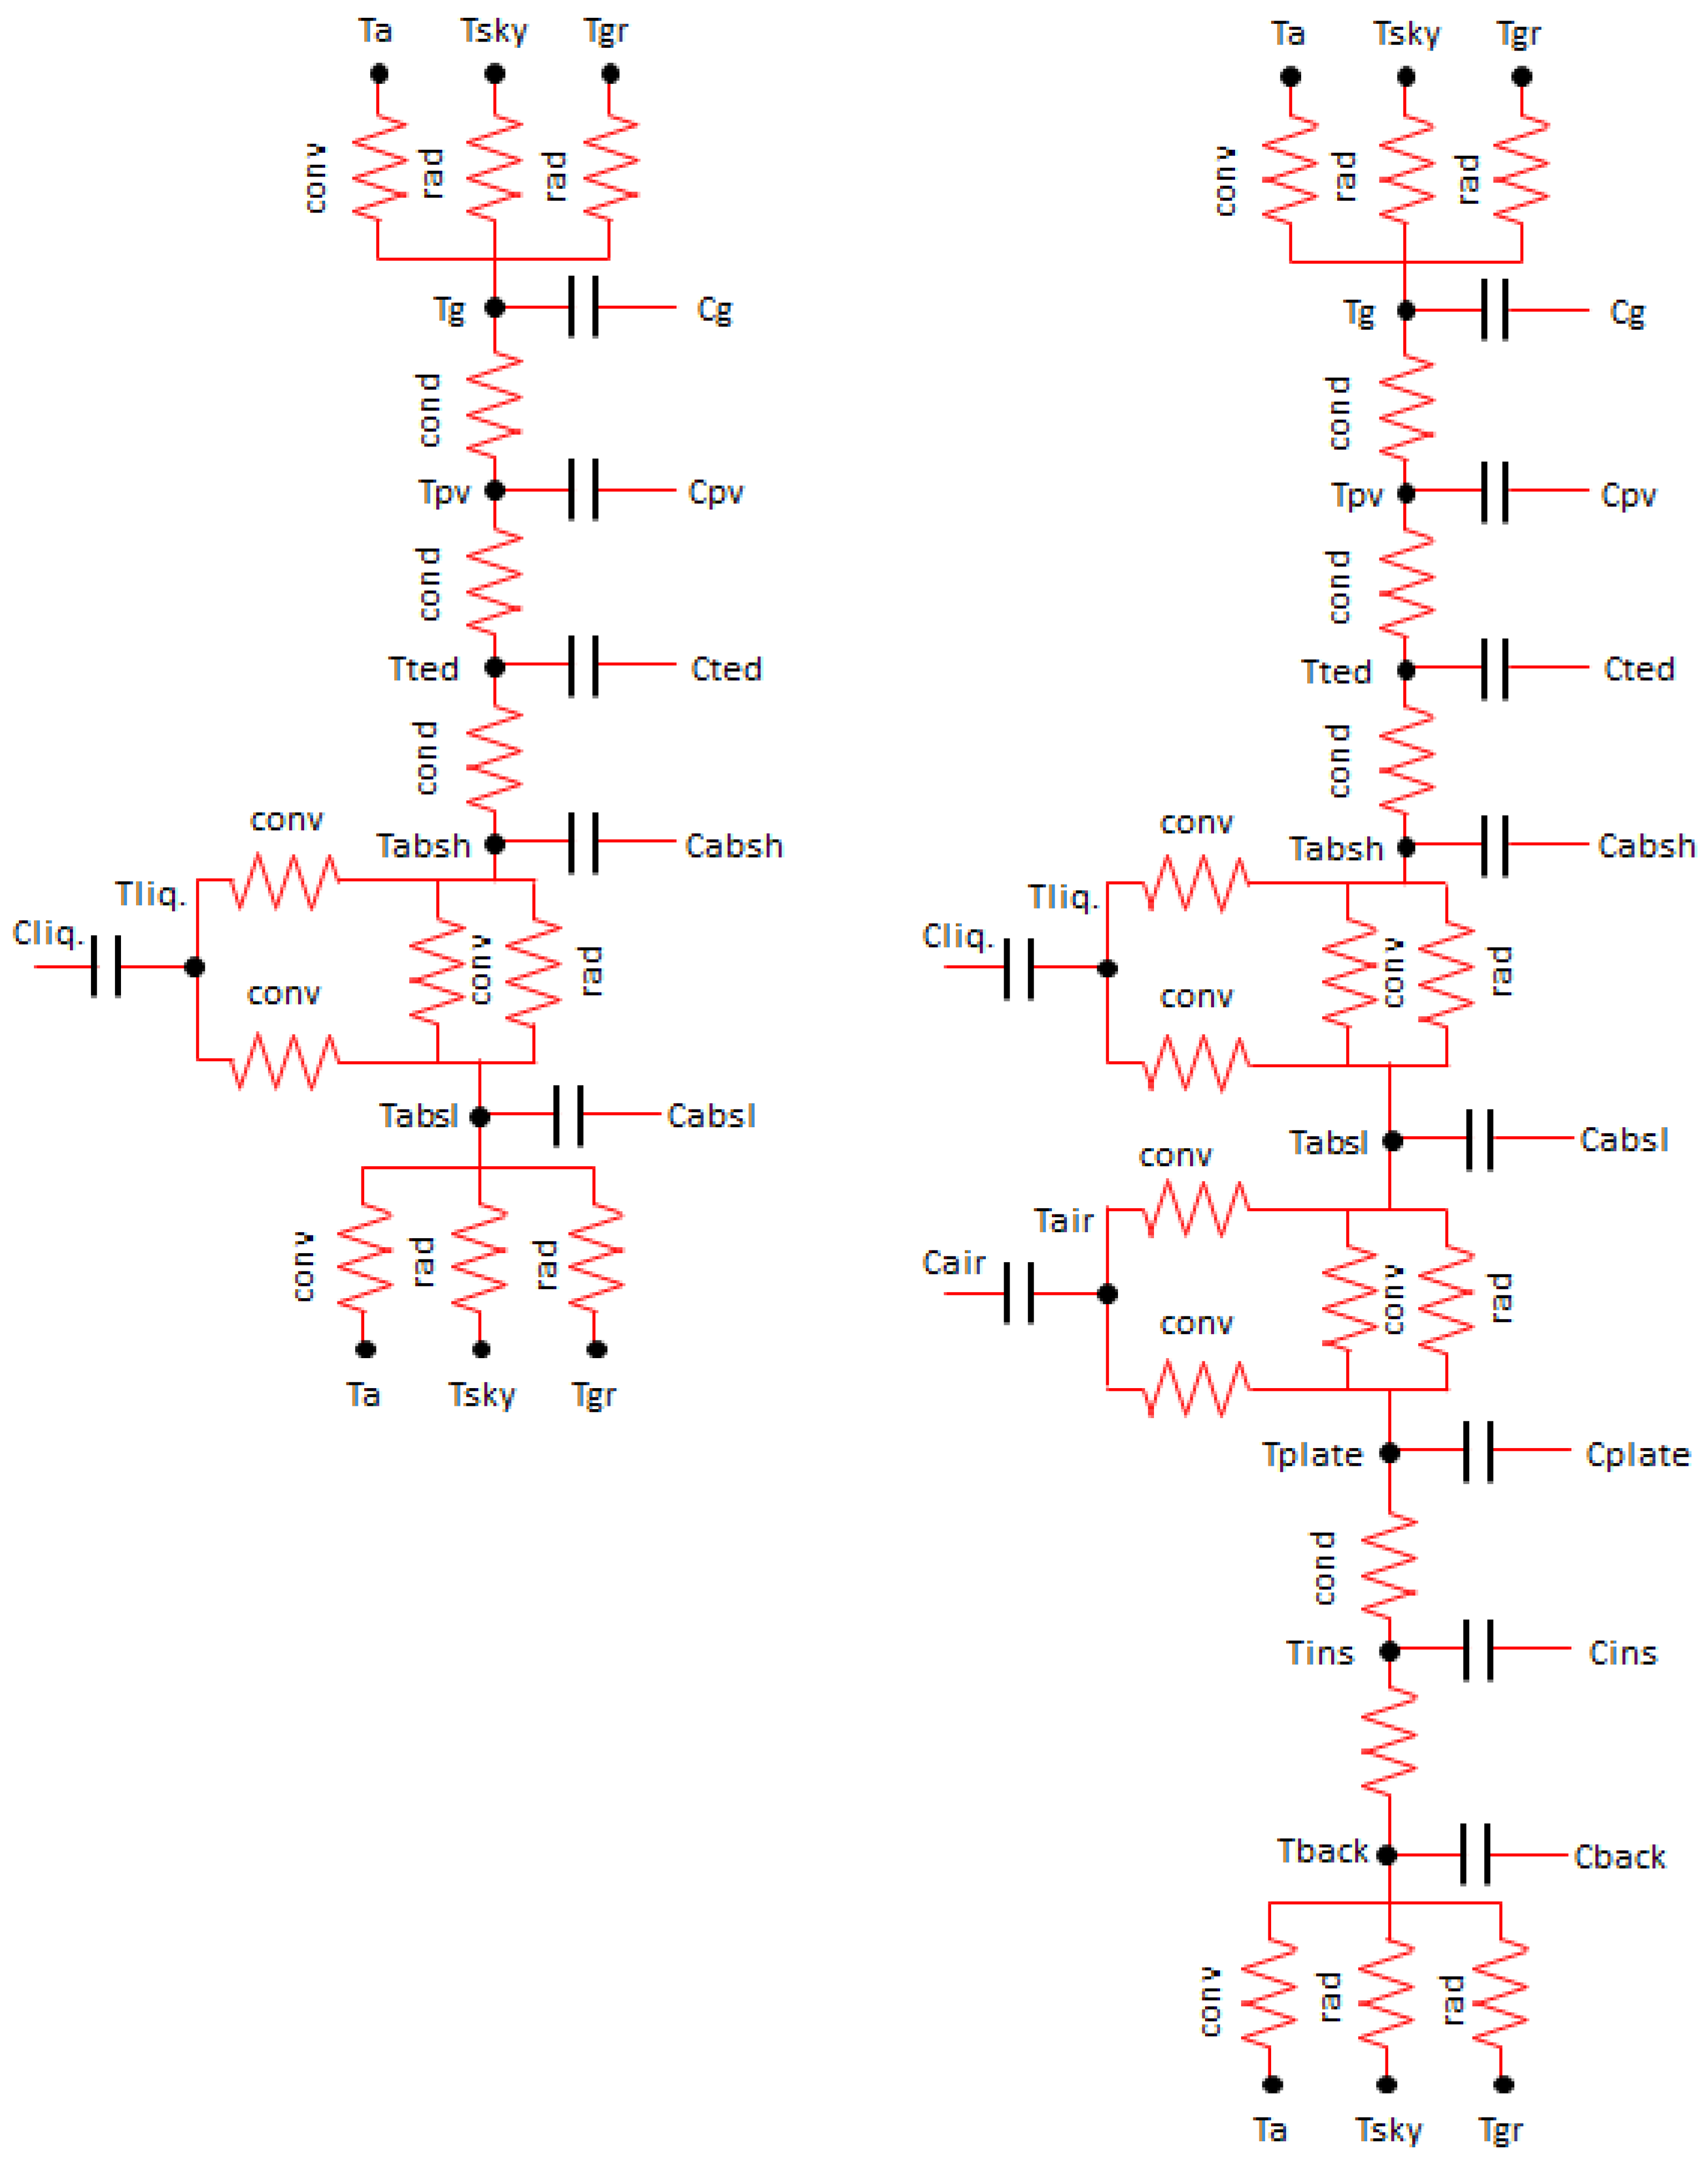
Figure 2 shows, for both PV/T and PV/Tb, the thermal resistances and heat capacities of all layers under the equivalent electrical circuit form.
The heat fluxes among the collector’s layers and with the outdoor environment are governed by the three heat transfer mechanisms: radiation, convection, and conduction. Thus, the following heat fluxes are determined:
- -
convection and thermal radiation between the glass cover “g” of the panel and the outdoor environment;
- -
radiation through the glass;
- -
conduction through the different layers that compose the panel (glass, PV cell “PV”, EVA, Tedlar “ted”, upper absorber plate “absh”, and lower absorber plate “absl”, a plate with fins, thermal insulation “ins”, back-plate);
- -
convection between the absorber plate and the liquid “l” in the channel, between lower absorber and air, and between the plate with fins and air;
- -
radiation between the two absorber plates, and radiation between lower absorber and plate with fins;
- -
convection and thermal radiation between the rear part of the PV/T module (lower absorber plate) and the outdoor environment.
The conductive heat fluxes are taken into account using Fourier’s formulation (Equation (2)).
where
k,
δ, and
A are the thermal conductivity, layer thickness, and surface of the considered layer, and Δ
T indicates the temperature gradient.
The radiative exchanges have been calculated using the Stefan–Boltzmann law (Equation (3)).
where “
i” represents the external layer of the panel (glass or lower absorber plate),
j represents the sky-dome or the ground,
σ0 is the Stefan–Boltzmann constant,
ε represents the emissivity of the layer, and
F is the view factor, calculated using Equation (4) in the case of heat transmission between glass and sky or absorber and ground, or calculated by Equation (5) in the case of heat transmission between glass and ground and absorber and glass.
The radiative fluxes between the two plates that are facing the liquid channel (absh and absl) and the fluxes of the two plate that facing the air channel are calculated using the view factor for flat and parallel surfaces (Equation (6)), where
i and
j indicate the surfaces facing the channel.
The convective exchanges are calculated using the Newton formula (Equation (7)), where (
h) is the convective coefficient,
Tsup is the surface in contact with the fluid, and
T∞ is the temperature of the fluid.
The convection coefficient with the outdoor environment, “
h”, is calculated using the expressions reported in [
34]. As regards the convective heat fluxes between the air inside the channel and the absorber plates, only forced convection flows are taken into account, and the convection coefficient is calculated with Equation (8).
where
Dh is the hydraulic diameter, and
Nu the Nusselt number calculated as a function of flow regimes.
As regards the airflow inside the channel, only the forced flow regime is taken into account.
For laminar flow, since the channel is rectangular and with a base/height ratio equal to 20,
Nu is calculated by Equation (9).
For turbulent flow conditions, the Dittus–Boelter formulation (Equation (10)) is used, where
Re and
Pr are, respectively, the Reynolds and Prandtl number. The coefficient
n takes a value of 0.4 or 0.3 for heating or cooling, respectively.
with
where
w indicates the velocity of air inside the channel,
is the kinematic viscosity of air, and the hydraulic diameter
Dh is equal to twice that of the width, as channel width
channel height.
The coefficient of heat convection between the plate-fins’ surface and the flowing air is calculated by Equation (12).
where
hno-fins is the heat transfer coefficient without fins. The fins and the overall surface efficiency of fins are calculated by the following equations [
35]:
with:
where
Acfin,
kfin,
L, and
H are the cross-sectional area of each fin, the thermal conductivity, the length, and the height of the fins.
Finally, the heat transfer coefficient between the roll-bond absorber plate and the fluid is fixed equal to 65.1 W/(m
2∙K), as proposed by [
36].
Table 1 shows all the equations used in the numerical model. There are equations related to only the conventional collector (PV/T) and the bi-fluid collector (PV/Tb), and equations common for both models.
2.3. Theoretical Solution Procedure and Expected Accuracy
The proposed numerical model is composed of a set of equations that govern heat fluxes through the various layers. This model consists of an extension of the model presented in [
33], which was validated through the experimental data observed in the PV/T plant installed at the University of Catania [
21]. This validation procedure highlighted a maximum root mean square error “CV (RMSE%)” less than 7.0%.
The non-linear system’s equations are implemented in a MATLAB code and solved by the Runge–Kutta method. The logic for solving these equations is shown in
Figure 3.
2.4. Thermo-Physical Properties of the Layers That Make Up the Panel
The thermo-physical properties of all layers are reported in
Table 2. The following correlations, proposed by Yaws and Richmond [
37] for low temperature ranges, are used to compute the thermo-physical properties for air and water.
2.5. Performance Estimation
2.5.1. Electrical Yields
The electrical power (
Pe) produced by the PV/T panels is calculated from the irradiance on the collector plane
G, the total surface of the PV cells, and the electrical efficiency:
where the electrical efficiency is calculated by the following equation:
where
ηref is the efficiency at STC condition and is set equal to 0.154,
β is a characteristic of the PV cell and is fixed equal to 0.0044 C
−1, and
TPV is calculated by Equation (17). Thus, the electric energy yield is evaluated as
2.5.2. Thermal Yields
The thermal power (
Pth) can be estimated by applying the thermal balance equations to the fluid (liquid or air) passing through the panels:
where ”
i” is referring to the two HTFs (i.e., air or liquid fluid).
Thermal efficiency is defined as the ratio between the thermal energy transferred to the working fluid and the solar irradiance. In a PV/T system, it is important to note that the solar irradiance available for the thermal circuit has to be reduced by the generated electricity, thus the thermal efficiency evaluated considering the heating of the liquid fluid (common to both systems) is calculated using the following equation:
Likewise, in a bi-fluid PV/T system, the solar irradiance available for the second fluid (in this model, air) is in turn reduced by the thermal energy transferred to the first fluid, therefore the efficiency is calculated as follows:
The thermal energy yield is evaluated as:
2.5.3. Overall Yields
The overall performance of PV/T systems can be obtained as a direct summation of electrical and thermal power as given by the flowing equation:
2.6. Experimental Validation
The model proposed in this study is an extension of the model presented and validated in [
33], to which the air layer, the plate with the fins, the thermal insulation, and the aluminum finishing layer in the back are added. The novel balance equations were modelled following the methodology proposed by El Manssouri et al. in [
38], in which results were tested with the experimental values proposed by Jarimi [
31].
3. Performance Evaluation for the Proposed Bi-fluid PV/Thermal Collector While Varying the Operative Conditions
This section analyses the effect of the flow rate variation for both the heat transfer fluids, air and liquid, on the performance of the bi-fluid PV/T collectors. Currently, this study investigates only forced convection flows.
For a PV/T system, the operating parameters (i.e., flow rate of the HTFs, inlet temperature, and so on) affect both thermal and electrical energy yields. Even more in a bi-fluid system, the variation of the working conditions of one cooling fluid affect also the performance of the other fluid, as well as the electrical performance of the PV/T collector.
The first analysis presented has been carried out taking into account the fixed airflow rate of 0.0288 (kg/s), which gives rise to an average velocity of 0.5 m/s, and a specific flow rate per unit of collector’s surface of 0.018 kg/(s∙m2).
Figure 4 shows the difference between the outlet and the inlet temperature and the thermal efficiencies of two fluids as a function of the liquid flow rate, under a constant incident solar irradiation of 800 W/m
2 and environmental air temperature of 25 °C.
The liquid fluid rate is expressed as kg/(s∙m2); in such a way, results that can be compared with different surfaces of PV/T collectors are obtained.
The variation of the liquid flow rates, starting from stagnation conditions to 0.010 kg/(s∙m2), causes a remarkable decrease in the thermal jumps of the liquid and, conversely a remarkable increase in the thermal efficiencies. Further increase of the flow rates behind 0.020 kg/(s∙m2) gives rise to a more moderate decrease of the thermal jumps (and increase of the thermal efficiencies), moving towards asymptotic values.
The thermal jump of the airflow rate is 6.7 °C in stagnation, and it drops to about 2.1 °C for a liquid flow rate of 0.025 kg/(s∙m2). Likewise, air thermal efficiencies show a huge reduction, moving from 15.3% to 2.1%. This result indicates that the majority of the heat is removed by the liquid flow if the liquid flow rate increases. Thus, a sort of energy cascade of the available energy is produced.
The electrical efficiency shows a rather modest variation; it increases from about 14.0% to 15.0% as the flow rate of the liquid grows. This result is coherent with the decrease of the fluid temperatures, which in turns determines the decrease of the temperatures of the PV cells.
The liquid-specific flow rate of 0.008 kg/(s∙m2), which provides a good compromise between the overall efficiency, about 61.1%, and the thermal jump, about 10 °C, is chosen for analyzing the effects of the variation of the airflow rate on the bi-fluid PV/T performances.
For the fixed liquid flow rate of 0.008 (kg/s m
2), constant incident solar irradiation of 800 W/m
2, and environmental air temperature of 25 °C,
Figure 5 shows the temperature difference between the outlet and the inlet temperature and the thermal efficiencies of two fluids as a function of the airflow rate.
The increase of the airflow rate, from stagnant conditions to 0.04 (kg/s m2), causes a remarkable decrease for both the efficiency, which drops from 39.1% to 4.6%, and the temperature difference, which decreases from 17 °C to 2 °C, of the air.
Otherwise, the variation of the airflow rate generates a modest effect on the liquid thermal efficiency, which varies from 45% to 39%, and on the temperature difference, which decreases from 10.8 °C to 9.3 °C. The electrical efficiency also shows little variation.
A specific airflow rate of 0.0075 kg/(s∙m2), which give rise to a thermal jump of 5 °C and an efficiency of 11.2%, was therefore chosen as a reference for a further analysis that will be presented in the next section. It is worth underlining that such a small airflow rate, which corresponds to an air velocity of about 0.20 m/s, could be obtained taking advantage of natural convection, thereby avoiding the need for auxiliary energy for a blower.
Finally, using the optimal operating conditions (liquid flow rate equal to 0.025 kg/(s∙m2) and air mass flow rate of 0.008 kg/(s∙m2)), some simulations were performed by varying the environmental conditions to determine the thermal efficiency curve of the proposed PVTb panel.
The thermal efficiency curve was determined using the steady-state testing (SST) method defined by the European Standards (ISO 9806: 2017) [
39].
The SST method determines the efficiency using Equation (36), which is very similar to that of Hottel–Whillier–Bliss, where the difference of temperature (Δ
T*) is the difference between the average temperature of the fluid in the panel and the ambient temperature, and PV/T that works under the MPPT conditions is considered.
The terms η0, a1, and a2 are, respectively, the zero-loss collector efficiency, the linear thermal heat losses coefficients, and the quadratic losses coefficient.
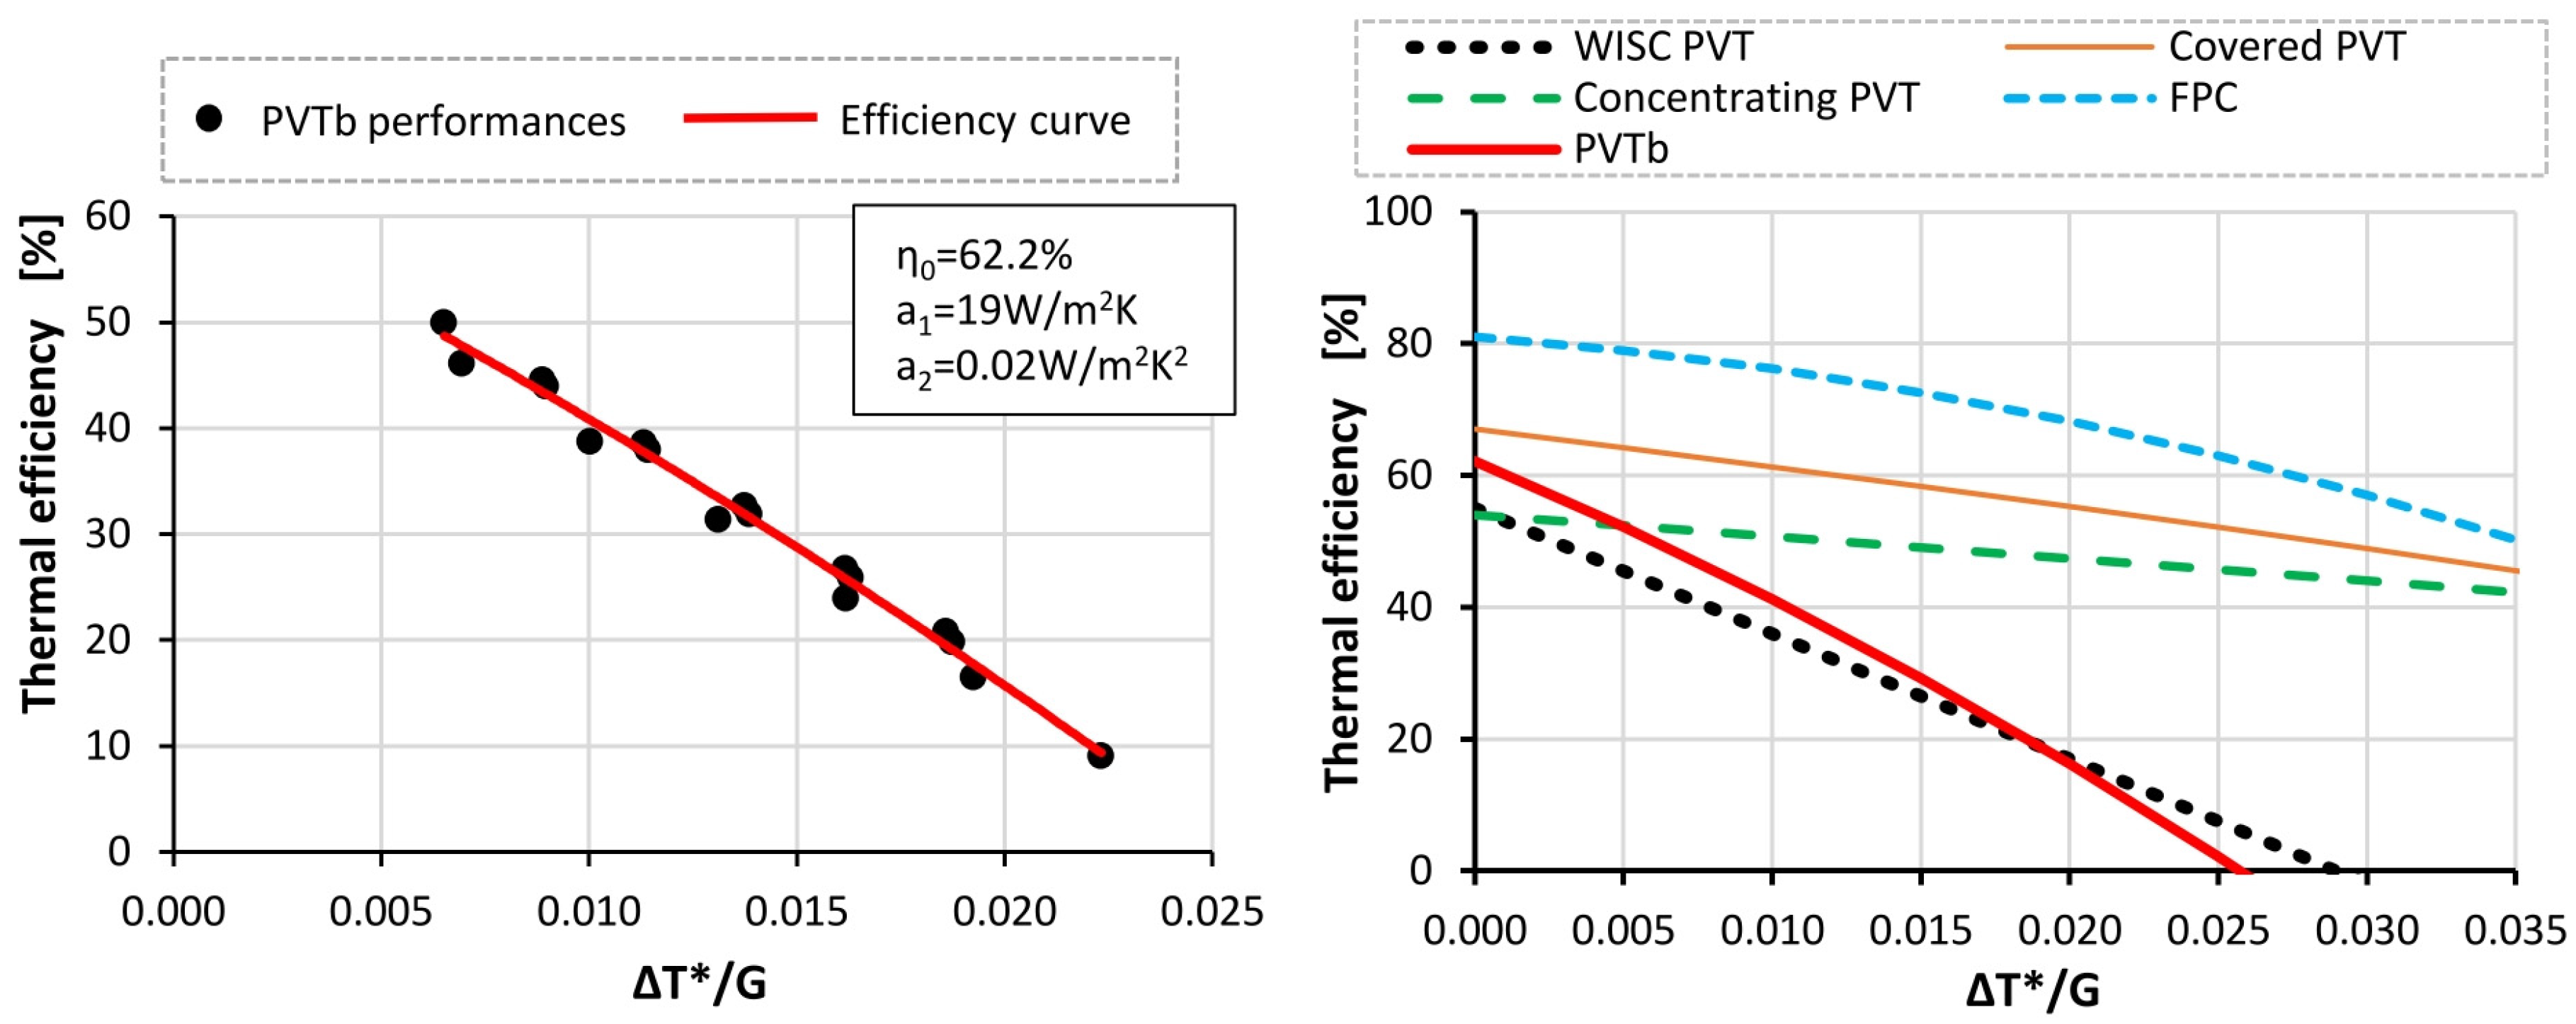
Figure 6 shows, on the left, the simulation results, the interpolated thermal efficiency curve, and the thermal coefficients found; while on the right, the efficiency curve of the studied PVTb is compared with the thermal efficiency curves of other types of PVT panels and of a conventional solar thermal panel (FPC).
From the comparison between the thermal efficiency curve of the proposed PVTb system (red line) and that of the other panel technologies, it can be seen that for small ΔT*/G, the bi-fluid system has high thermal efficiencies, exceeded only by the covered PVT panel or by the conventional solar thermal panel. Otherwise, as the ΔT*/G value increases, the thermal efficiency of the PVTb decreases rapidly.
4. Simulation of the Performance of Conventional and Bi-fluid PV/T Collectors
This section compares the performance of the conventional PV/T and the proposed bi-fluid PV/thermal panel. The simulations are carried out considering PV/T collectors located in the Mediterranean climate, specifically in the city of Catania (IT) (37°30′0″ N–15°6′0″ E). It is assumed that the modules are facing south, with a tilt angle of 30 degrees. The weather data, solar irradiation, and air temperature used for the simulations were taken from the PV-GIS database [
40].
Figure 7 shows the outdoor temperature (continuous line) and the incident solar irradiation (dashed line) at winter and summer solstice for clear sky conditions.
A constant wind speed of 1.0 m/s is used for all the investigated scenarios.
Following the outcomes of the previous section, the numerical simulation is carried out adopting a specific airflow rate of 0.0075 kg/(s∙m2), and 0.008 kg/(s∙m2) for the liquid flow rate.
The performances of these PV/T collectors have been investigated, varying the inlet temperature of the liquid flow. The air inlet temperature is assumed to be equal to the outdoor temperature.
4.1. Winter Season
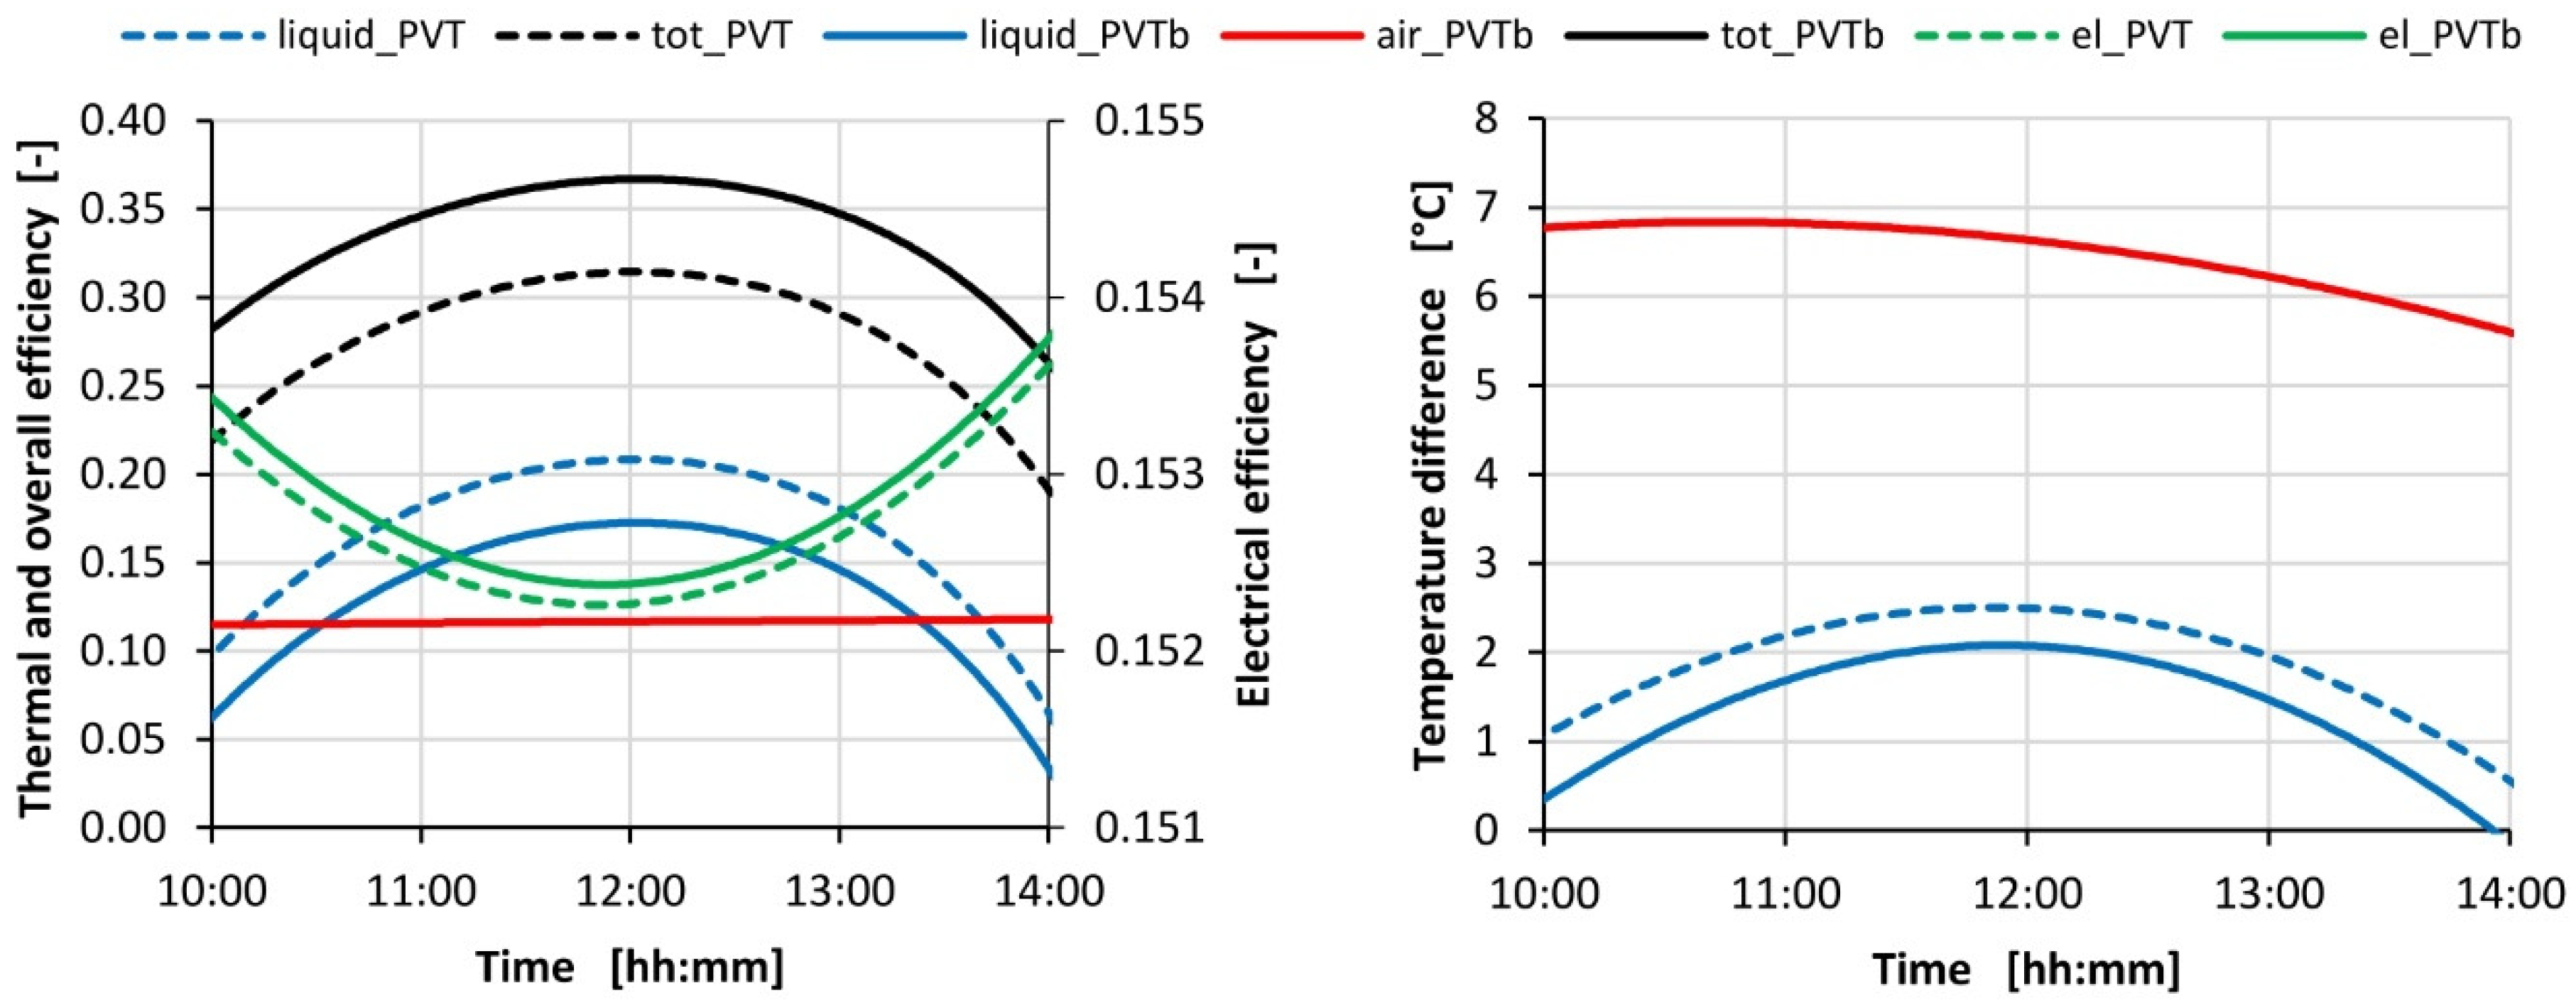
Figure 8 shows the performances of the conventional PV/T (dashed lines) and the bi-fluid PV/T (continuous lines), for an inlet liquid temperature of 25 °C.
The electrical, thermal, and overall efficiencies are depicted on the left side; the difference between the inlet and outlet temperatures at the air side (only for PVTb) and the liquid side is depicted on the right side.
The PVT bi-fluid configuration has a total efficiency almost 5% higher than water-based PVT. This result can be attributed in part to the use of the two fluids and in part to the thermal insulation layer added in the PVTb configuration, which allows for the reduction of the back-side heat losses.
The comparison of the temperature difference on the liquid side highlights that the bi-fluid configuration attains a thermal jump 0.5 °C lower than the WISC PV/T.
Such lowest temperatures allow the achievement of a very small higher electrical efficiency for the bi-fluid in comparison with the basic PV/T.
The air-side thermal jump, greater than 6 °C during the whole day, highlights the possibility of taking advantage of this heat for air preheating for building ventilation.
Furthermore, it is possible to further increase this thermal jump by increasing the surface of the PVTb panel or placing the panel vertically during the winter season [
41].
Table 3 shows the daily energy yields for the two studied PV/T configurations.
The overall increase in the energy produced achieved by the bi-fluid PV/T is 33.2%. This result is obtained thanks to the thermal energy carried on the air side of 0.342 kWh/m2; however, a decrease of about 0.076 kWh/m2 carried on the liquid side emerges. Therefore, an insightful analysis that evaluates the effectiveness of the energy carried by the two carrier fluids is necessary.
Furthermore, the PVTb allows an increase of 0.2% of the produced power.
Figure 8, on the left side, shows the daily energy produced by the conventional and the bi-fluid PV/T as a function of the liquid inlet temperatures (i.e., 20, 25, 30, and 35 °C).
The thermal jump of the HTFs for the conventional collector (PVT,l) and the bi-fluid collector (PVTb,l and PVTb,air) are depicted on the right side of
Figure 9.
As a general rule, the bi-fluid configuration achieves the highest energy yields whatever the inlet temperature is. An increase of the inlet temperatures causes a decrease of the thermal energy carried by the liquid carrier for both PV/T configurations. An inverse behavior is indeed observed for the thermal energy carried by the air carrier, which increases with the rise of the liquid temperatures.
It is possible to observe that for an inlet temperature of 35 °C, neither configuration is able to produce thermal energy at the liquid side due to the high thermal losses.
The thermal energy produced by the conventional PV/T is always greater than the thermal energy produced by the bi-fluid PV/T on the liquid side.
The electricity produced is almost constant for all the investigated configurations, with a very modest decrement as the inlet temperature of the liquid increases.
4.2. Summer Season
Figure 10 shows the performance of the conventional PV/T (dashed lines) and the bi-fluid PV/T (continuous lines) for an inlet liquid temperature of 35 °C.
The electrical, thermal, and overall efficiencies are depicted on the left side; the difference between the inlet and outlet temperatures at the air side (only for PVTb) and the liquid side is depicted at the right side.
The overall performances of the PVTb configuration are better than the water-based PV/T, with an increase in the overall efficiency of almost 2%.
The comparison of the temperature difference on the liquid side highlights that the bi-fluid configuration attains a thermal jump 0.4 °C lower than the WISC PV/T. A similar outcome was found at the winter solstice. Although the liquid-based PV/T collector attains the highest operating temperature, it also has electrical efficiency higher than the bi-fluid PV/T configuration.
This outcome is determined by the additional cooling effect determined by the air carrier fluid, which attains a maximum thermal jump of about 8.0 °C.
During the summer season, an effective use for the heated air could not be found, therefore it will be thrown away into the external environment.
Therefore, the only useful effect of airflow could be the reduction of the operating temperature of the PV cell, which, consequently, gives rise to an increase in power production.
Table 4 shows the daily energy yields for the two studied PV/T configurations for an inlet fluid temperature of 35 °C.
The overall increase in the energy produced achieved by bi-fluid PV/T is 7.8%. This result is obtained thanks to the thermal energy carried on the air side, of 0.487 kWh/m2; however, a decrease of about 0.250 kWh/m2 carried on the liquid side emerges. No differences emerge between the electricity produced.
Thus, if the heat carried by the air carrier fluid does not have a useful application, the thermal energy produced by the bi-fluid will be lesser than the single fluid PV/T.
Figure 11 shows the daily energy produced by the conventional and the bi-fluid PV/T as a function of the liquid side inlet temperatures (i.e., 30, 35, and 40 °C).
The thermal jumps of the HTFs for the conventional collector (PVT,l) and the bi-fluid collector (PVTb,l and PVTb,air) are depicted on the right side of
Figure 10.
It is possible to point out that the electrical and thermal energy are very similar for the two PV/T configurations. The small amount of additional thermal energy produced by the bi-fluid PVT collector is obtained to the detriment of the thermal energy produced at the liquid side.
As general rules, the use of a bi-fluid PV/T collector during the hot seasons is justified only if the airflow is generated through natural convection, thus avoiding the need for auxiliary energy for a blower.
5. Conclusions
In this paper, the performances of novel bi-fluid PV/T WISC solar collectors have been evaluated through a numerical model developed in MATLAB.
Following a preliminary investigation on the effects of the variation of the performances as a function of the flow rate of the two carrier fluids (air and water), the flow rates of the two carrier fluids were chosen, being 0.0075 kg/(s∙m2) and 0.008 kg/(s∙m2) at the liquid and air side, respectively. Thus, a comparative study between the two configurations of PV/T hybrid collectors—water-based PV/T (PVT) and water/air-based PV/T (PVTb)—has been presented.
The analysis highlights that the bi-fluid PV/T increases the thermal energy production in comparison to the water-based PV/T collector.
As regards the electrical performances, the differences between the two PV/T configurations are negligible. The increase of the thermal energy produced by the bi-fluid PV/T collectors is derived by the heat transferred to the air at a detriment to the heat transferred to the liquid.
Thus, the potentially better performances of the bi-fluid PV/T must be accurately evaluated, and can be taken into account only if there are useful applications for the heat carried out by the airflow rate. This condition is certainly met during the winter season, when the heated air could be used for the air ventilation of indoor spaces, considering that an increase of about 7.0 °C was observed at the winter solstice.
On the contrary, during the summer period, the bi-fluid PV/T collectors can be used just to avoid cells overheating.
The optimization of the bi-fluid PV/T has to limit the auxiliary energy needed for a fan, taking advantage of as much of the natural flow convection as possible.
Further studies could optimize the proposed bi-fluid PV/T collector by investigating the extra-economic and environmental costs for realizing such kinds of equipment, and whether they have potential uses in the real market.


 ,
, 


