1. Introduction
Coal-fired power generation faces great pressure in energy saving and greenhouse gas mitigation [
1]. In recent years, solar-aided power generation (SAPG) systems have been attracting more attention [
2]. Meanwhile, the SAPG system is environmental friendly and can reduce carbon emissions compared with coal-fired power plants [
3]. So, SAPG technology is an effective way to achieve carbon neutrality.
SAPG is a technology in which a solar collector and fossil fuel power plant are combined. Zoscha first proposed the concept of an SAPG system. Zoscha et al. [
4] proposed seven possible methods to deliver solar energy as direct heat to an 800 MW power plant. Using the steam generated by the solar heat collection system to replace the extraction steam of the steam turbine has proved to be an effective coupling method for the SAPG system. Most of the current research has focused on the combination of parabolic trough and tower solar field with a fossil power plant. Omar Behar et al. [
5] reviewed the integrated solar combined cycle system with a parabolic trough technology and different hybridizations of solar energy with natural gas, coal, and other renewable energy sources are included. Warrick Pierce et al. [
6] proposed a SAPG system that utilizes parabolic trough collectors (PTCs) and compared it with independent concentrated solar energy power (CSP) generation systems. The results show that SAPG generates 25% more solar power generation than CSP. Hou Hongjuan et al. [
7,
8,
9,
10] analyze the varying working conditions and annual performance of heating feed water in an SAPG system assisted by the PTC. The results show that the performance of the hybrid system is better than that of the coal-fired unit. Wu et al. [
11] conducted an SAPG system that uses two parabolic trough solar fields to heat feed water and reheat steam. Through the case study of a 600 MW supercritical SAPG power plant in fuel-saving mode, the results showed that, with the addition of a second solar field, solar-to-electricity efficiency increased to 29.58%. Chang Huang et al. [
12,
13,
14] have studied the impact of the introduction of solar energy on coal-fired units and the SAPG system is coupled with PTC. Under the two modes of fuel-saving and power-boosting, the influence of solar energy input on SAPG system, boiler, fuel consumption, and boiler efficiency is explored. The results show that solar energy continuous preheating feed water has better technical and economic performance [
12]. The solar assisted direct air cooling thermal power unit is studied and optimized to reveal the influence of solar heat input on turbine outlet pressure and power plant performance. The correlation between the optimal outlet exit pressure (OEP), solar heat input, and environmental temperature is obtained [
13]. In the fuel-saving mode, a mechanism to adjust the burners’ tilt and attemperation flows in the boiler is proposed. The simulation results show that reheat/overheat steam temperature can revert back to the expected temperature using the above method [
14]. Ruilin Wang et al. [
15] compared the solar direct steam generation (DSG) system and heat transfer fluid (HTF) solar thermal transfer system. The results show that the aperture area of the DSG solar field can save 12.18% compared with the HTF solar field under the same generating capacity. Yong Shuai et al. [
16] use the PTC solar field to preheat feed water. The numerical simulation is performed using IPSE pro software in the design and off-design mode. The simulated results show that the operating performance of the hybrid system achieved as a design-point value in the summer season.
Yongping Yang’s team [
17,
18,
19], designed an SAPG system formed by tower solar collectors. The annual performance analysis and the optimization of the design condition of the hybrid system are carried out. Li Chao et al. [
20] design an SAPG system in which solar towers are used to reheat exhaust steam from an immediate turbine to improve the operation performance. The effects of reheat temperature and system load on system performance under fuel-saving and power-boosting modes are studied. Junjie Wu et al. [
21] proposed an SAPG system that uses parabolic trough to preheat feed water and solar tower to reheat steam. The system performance under three different loads (100%, 75%, and 50%) and the typical hourly performance over four typical days were analyzed.
Other studies involve economic research, system structure design, and optimization. Chen Haiping et al. [
22] proposed a novel SAPG system with concentration-photovoltaic/thermal (C-PV/T) module to replace the No.8 low pressure heater. Based on a 600 MW coal-fired unit, the performance of the system was analyzed. The results show that the total efficiency increased by 1.3%, the coal fuel consumption is lowered by 11 g/(kWh), and the investment recovery period is approximately 7 years. Jiyun Qin et al. [
23] presented four possible configurations of solar preheater, and simulated the instantaneous and annual performances of an SAPG plant with 12 combinations. Moreblessing Chitakure et al. [
24] mainly researched on three methods of solar heat utilization in solar–coal hybrid systems including feed preheating and the generation of saturated and superheated steam. M.S. Jamel et al. [
25] carried out a review of integrating solar thermal energy with conventional and non-conventional power plants. Kody M. Powell et al. [
26] provided a review of CSP hybridization strategies with coal, natural gas, bio-fuels, geothermal, photovoltaic (PV), and wind. Rongrong Zhai et al. [
27] analyzed coal-fired power system, as well as a solar-aided coal-fired power system with thermal storage and without thermal storage. The result show that based on the grey relation analysis, the system with thermal storage is better than that of the other two systems.
This paper proposed a model of the annular Fresnel solar concentrator (AFSC) coupled with a 600 MW coal-fired unit. Liang Kai et al. [
28,
29] designed the annular Fresnel concentrator and carried out experimental tests on it, and it is simulated to study the radiation distribution and performance of the annular Fresnel reflector under different deviations. The results show this new AFSC has excellent application prospects of concentrated solar energy (CSP). AFSC has a high concentration ratio, so it is used to improve the efficiency of the solar collector field and save the floor space. The thermo-economic performance of the SAPG system is studied and the small disturbance caused by the introduction of solar steam is analyzed.
In this paper, a novel model of SAPG is proposed, which verifies the feasibility of the coupling between AFSC and coal-fired units. The disturbance analysis of the introduction of AFSC is carried out, the analysis of the small disturbance may play a certain role in the regulation of the SAPG system. Because the experimental conditions are difficult to achieve, the coupling between AFSC and coal-fired units is still in the theoretical analysis stage. Owing to the limited level of knowledge, the existing research is carried out under the condition of constant irradiation. Variable irradiation can be studied in the future.
2. System Description
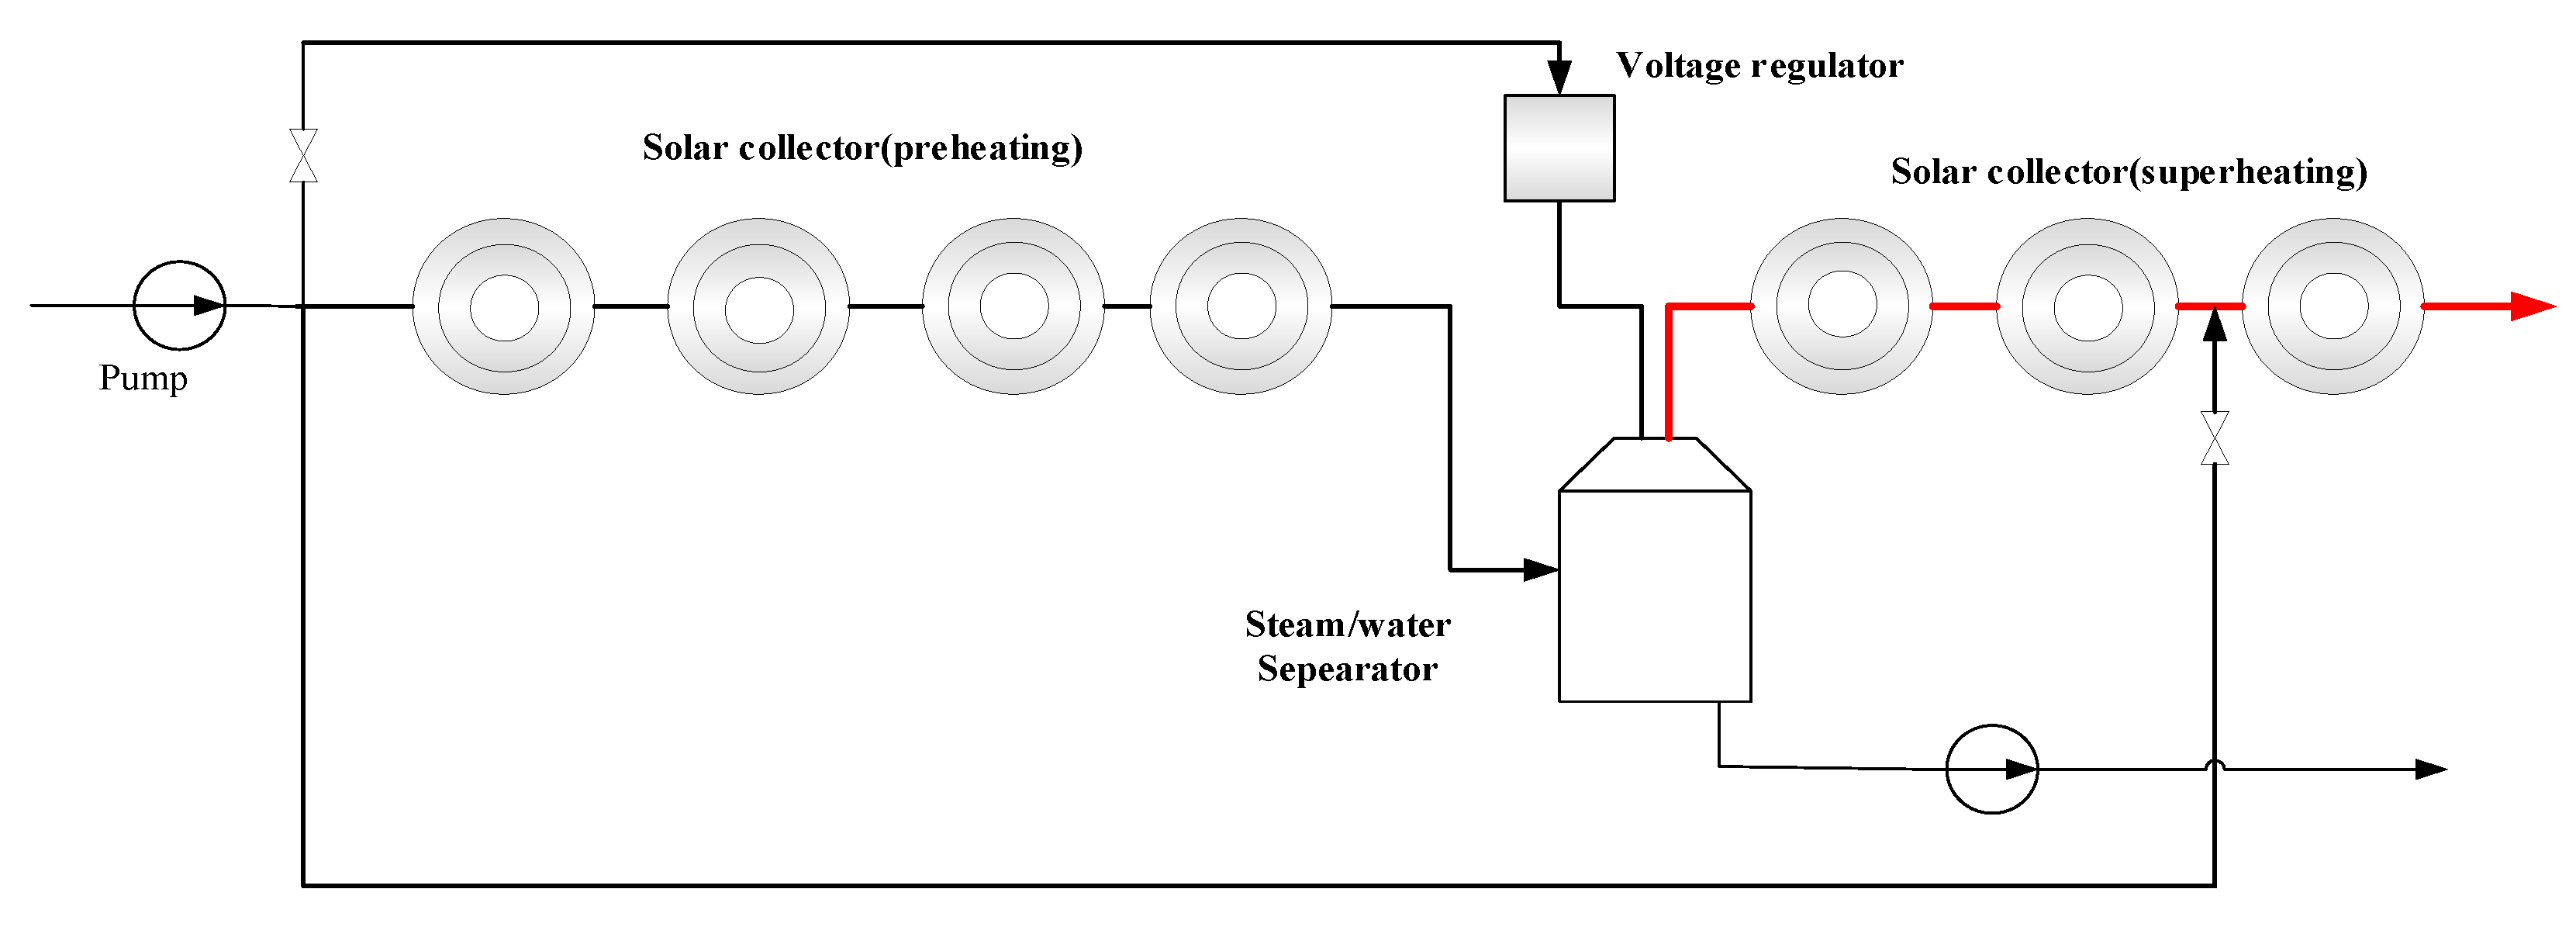
The discussed SAPG system consists of a solar field and a typical 600 MW coal-fired subsystem. The SAPG system that replaces the first stage is shown in
Figure 1. The solar field consists of the AFSC, a flash tank (expansion evaporator), non-dynamic regulator, booster pump, and control valve, among others. AFSCs are used to form the preheating section and the overheating section. The purpose of the flash tank is to avoid the influence of two-phase flow on the collector tube in the process of water heating. The booster pump is used to pressurize the water to make up for the pressure loss in the solar field. The typical 600 MW coal-fired generation system is made up of boiler, turbine, condenser, condensate pump, three high-pressure heaters (H1, H2, H3), four low-pressure heaters (H5, H6, H7, H8), and a deaerator (H4). The unsaturated feed-water from the condenser is preheated by regenerative heaters. Then, the feed water enters the boiler to absorb heat and become overheated steam. The overheated steam is transported to the turbine to produce power. Finally, the exhaust steam is condensed in the condenser. In the SAPG system, part of the outlet water of condensate pump is introduced into the solar field. The water is heated to saturated state by the preheating section and vaporized in a flash tank to obtain saturated steam. Then, the saturated steam is heated by the overheating section to become overheated steam to replace the extraction steam of the turbine.
The detailed flow of the working fluid is as follows: the outlet water of the condensate pump is pressurized by the pump so that the pressure of the water is kept under the design pressure of the inlet of the preheating section; then, after heating in the preheating field, the outlet water temperature is maintained to be equal or slightly less than the saturation temperature under the outlet pressure, and then flows through the flash tank. As the working pressure of the flash tank is lower than the outlet pressure of the preheating field, the inlet water temperature is higher than the saturation temperature under the working pressure of the flash tank, so the water will vaporize. The steam generated is sent to the overheating field, and the drain water is pressurized by the drain pump and transferred to the heat regenerative system or drainage system of the coal fire unit. It should be noted that the outlet water pressure of the preheating section is maintained at 10 Mpa in this paper. The structure diagram of the solar field is shown in
Figure 2.
3. Establishment of the Model
The mathematical model of the AFSC, flash tank, solar field, and the entire SAPG system are respectively introduced in this section, with the purpose of providing a calculation basis for the subsequent economic analysis.
3.1. AFSC
AFSC is a novel concentrator proposed by Liang Kai et al. [
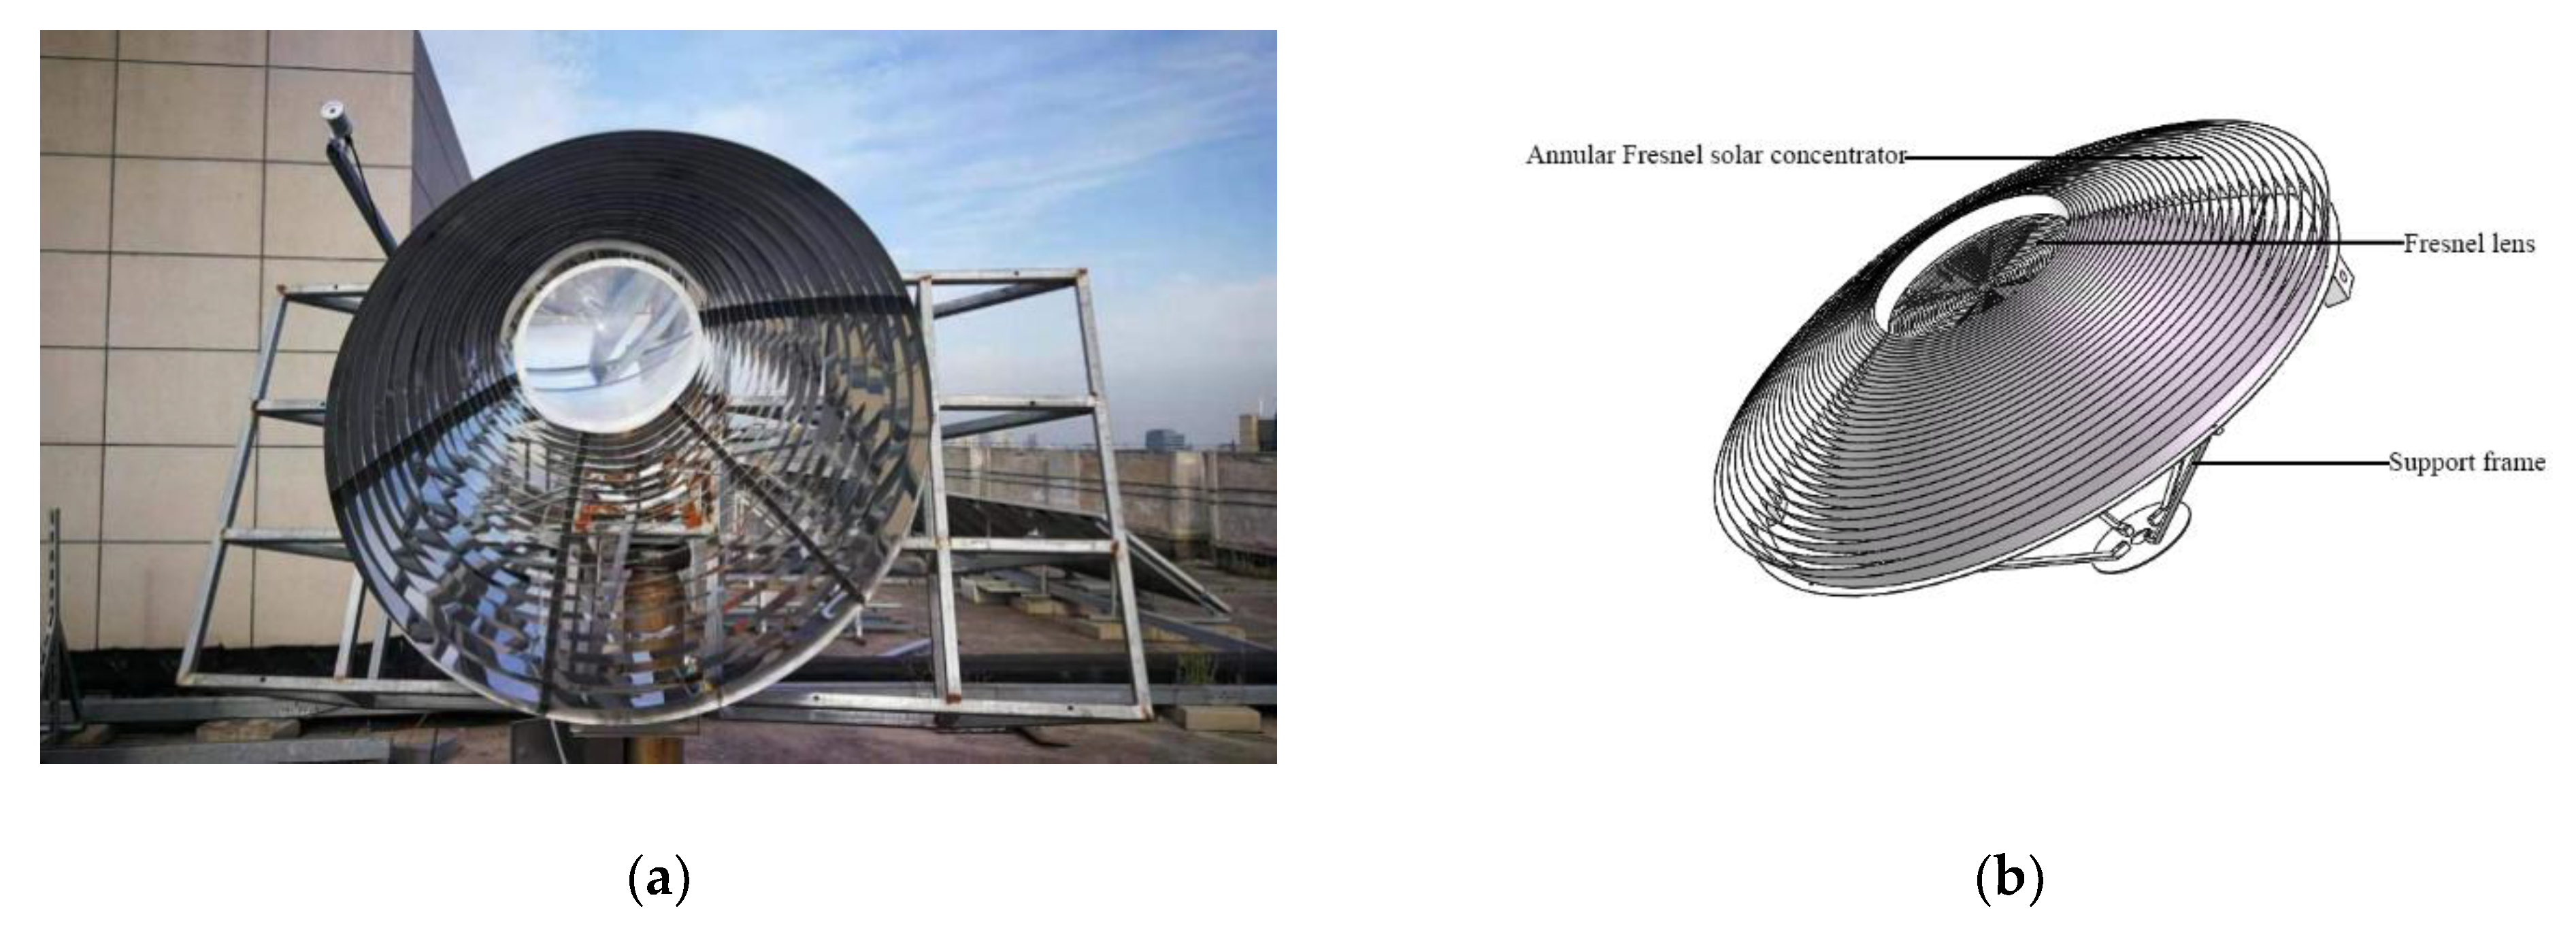
28], whose concentrating ratio reaches over 300. Theoretically, the steam generated by AFSC can reach the corresponding parameters of steam extraction at all stages of the turbine. The structure of the AFSC is shown in
Figure 3a,b [
28]. The AFSC is made up of an annular Fresnel reflector and support structure. In AFSC, it is required that each ring-shaped concentrator should not be shielded. The edge ray method [
30] is used to specifically design the specular parameters. The structure of the mirror is shown in
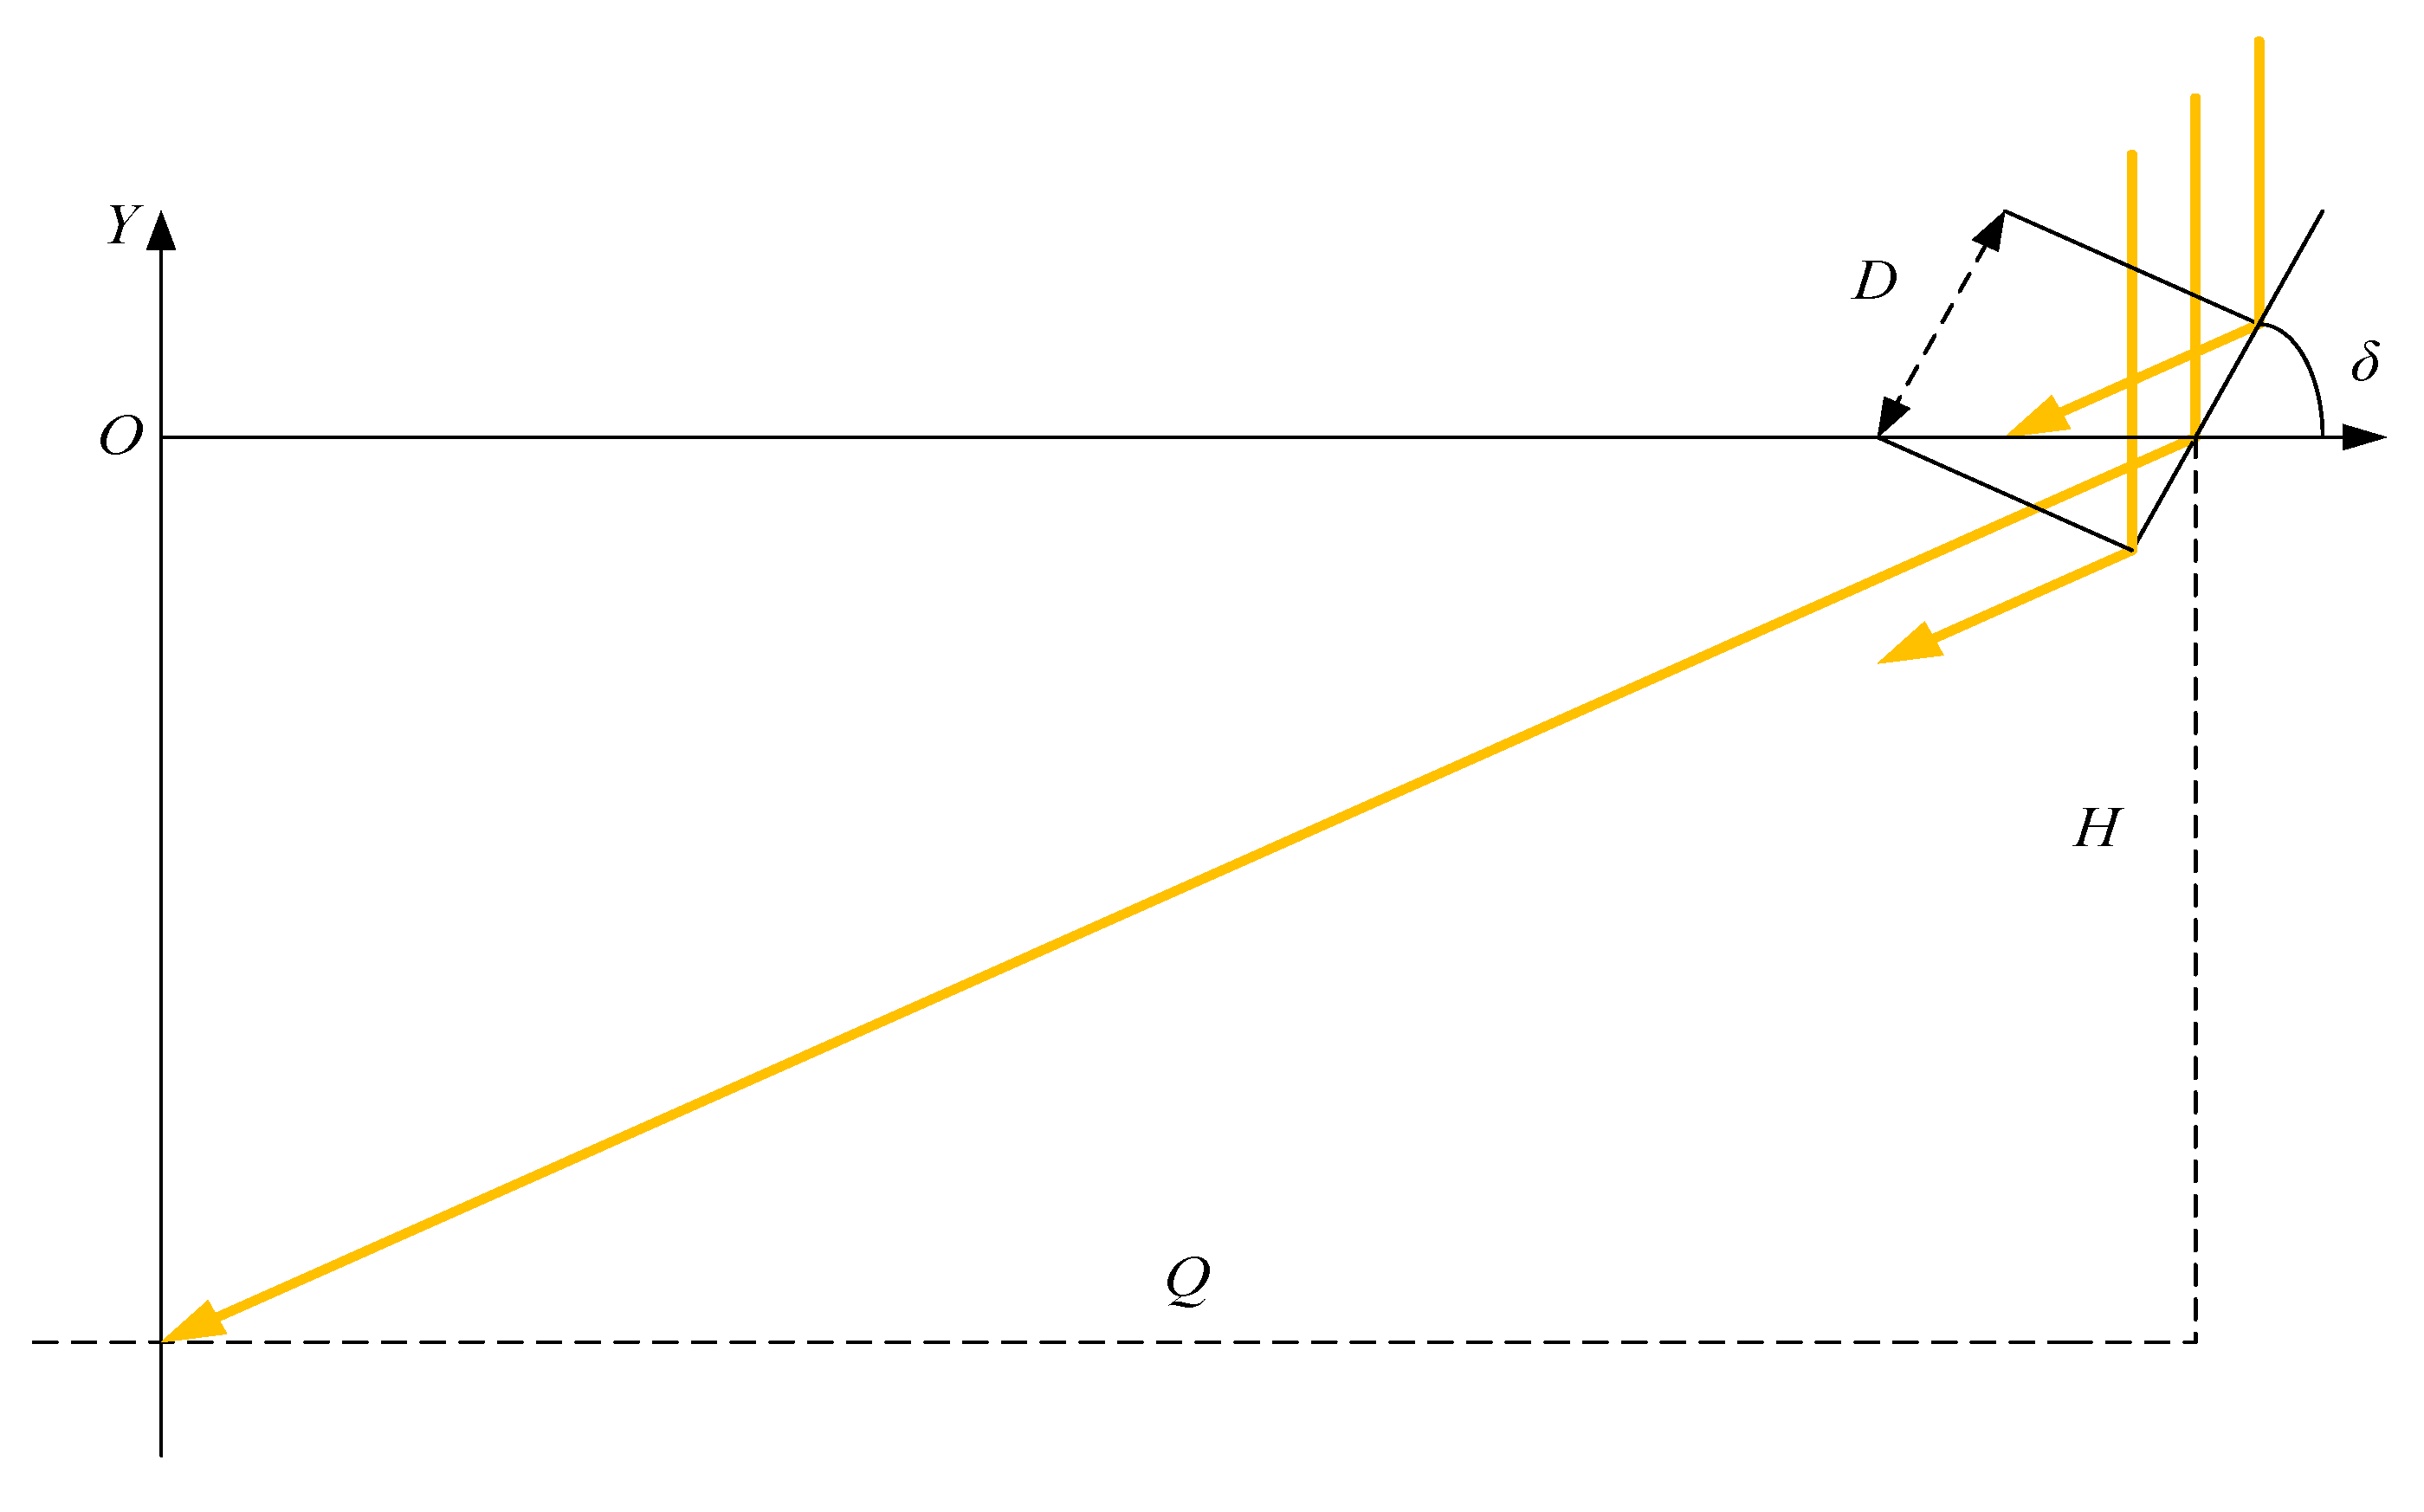
Figure 4.
As shown in
Figure 4,
is the angle of the mirror,
is the height from the center line of the mirror to the horizontal ground,
is the horizontal distance from the center of the mirror, and
is the width of the mirror. The detailed modeling method is shown in [
28]. The main parameters of mirror are
and
, and the relationship between these three parameters is as follows:
In Equations (1)–(3), is the mirror, and the mirror with the smallest radius is the first mirror. When the parameters of the first mirror are known, the structural parameters of the whole mirror can be obtained according to the above equations.
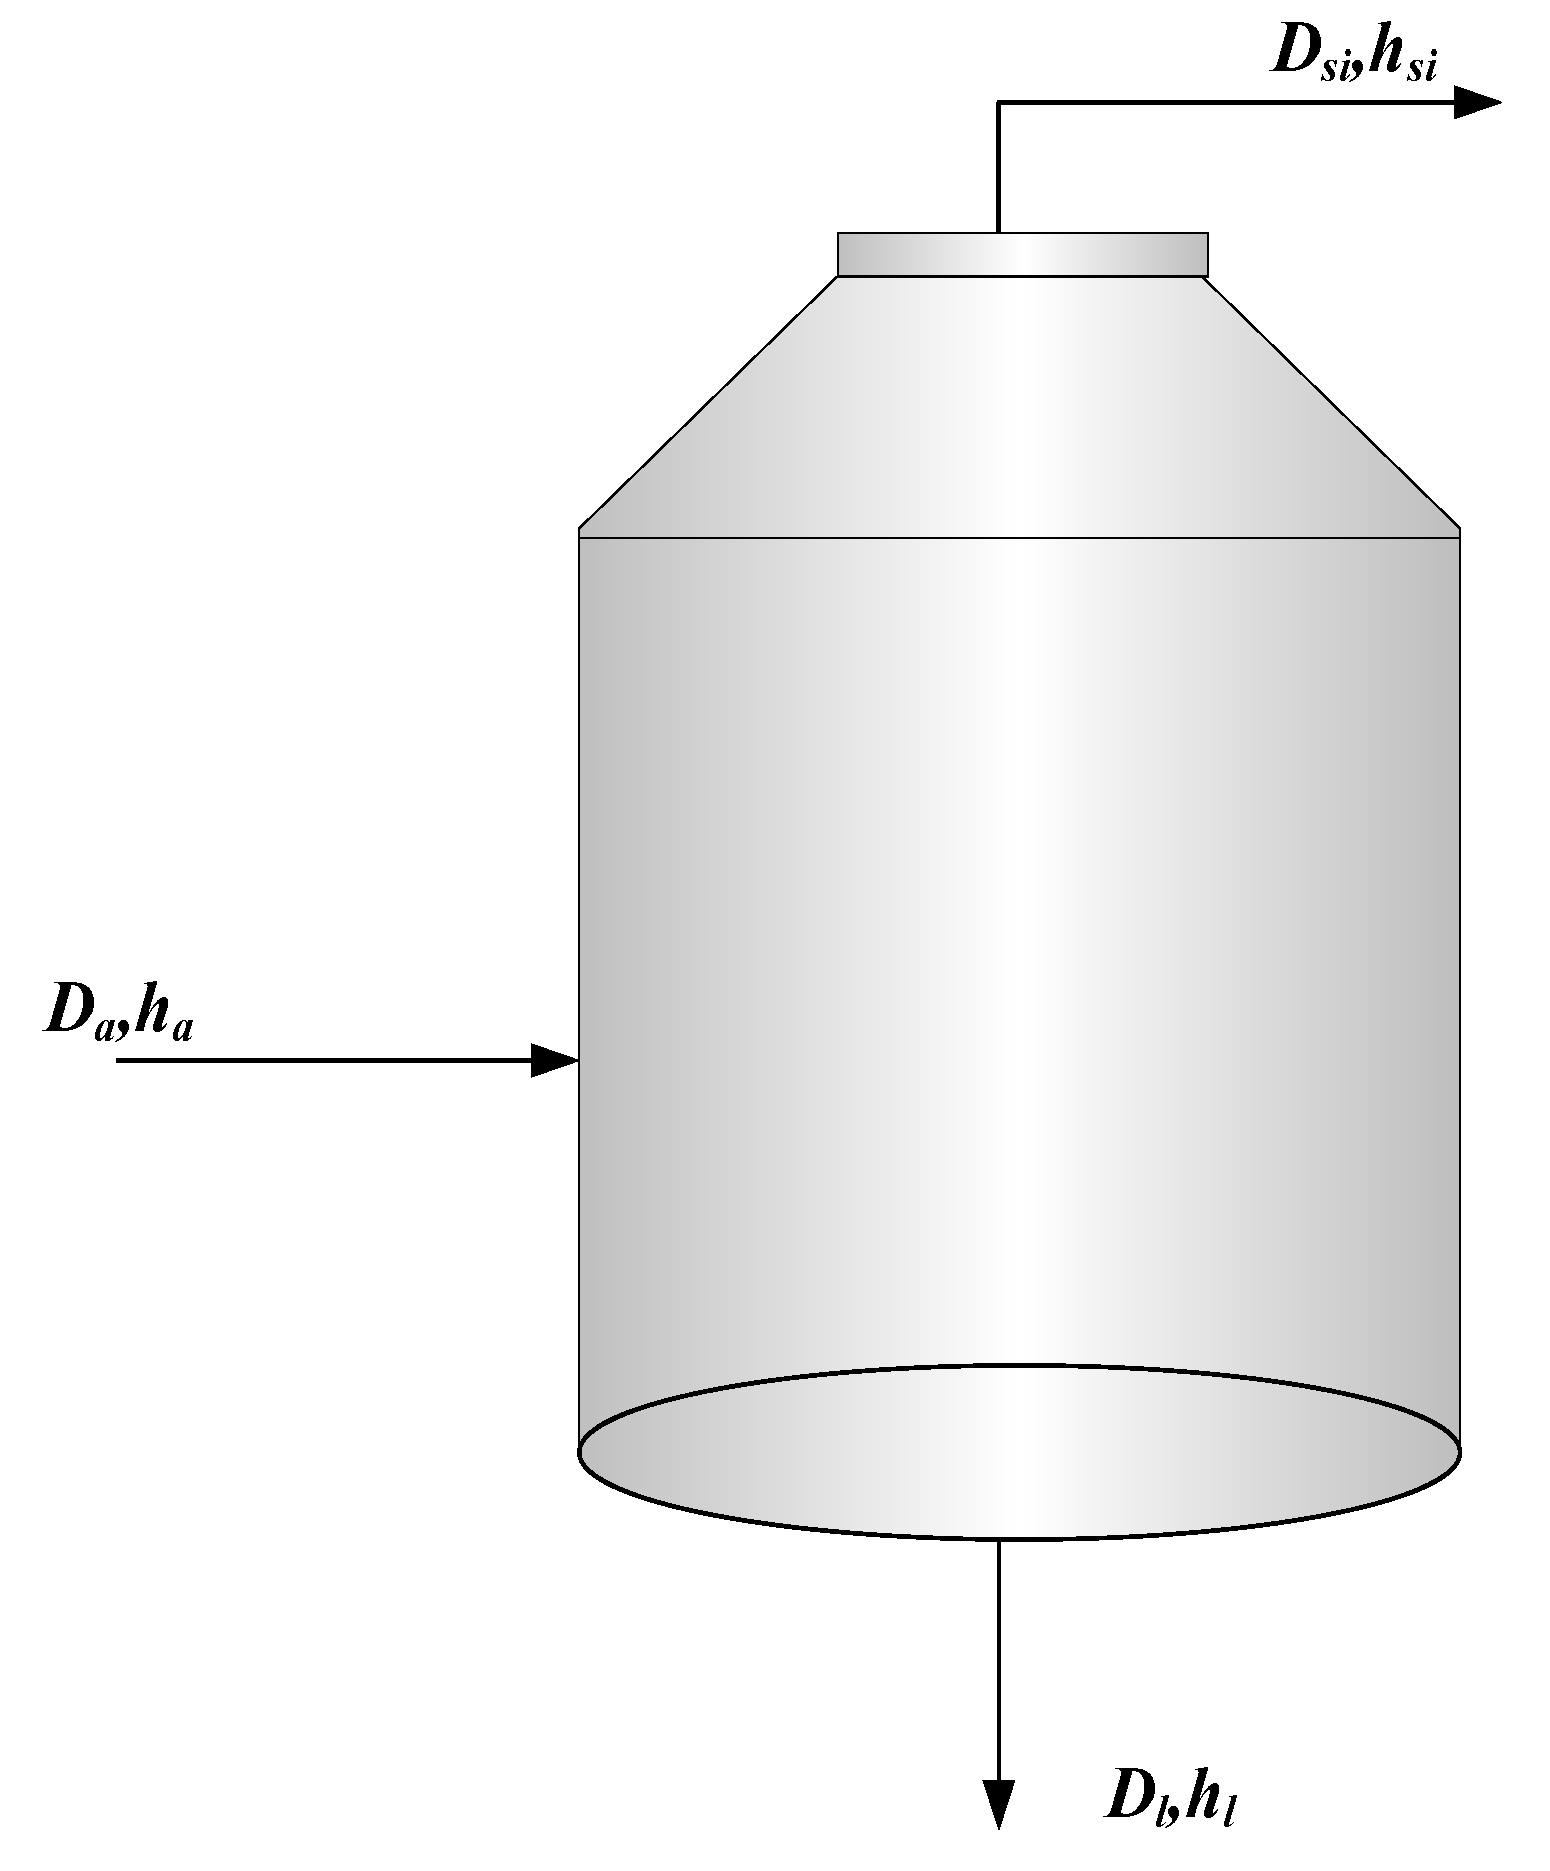
3.2. Flash Tank
Figure 5 is the structure of the flash tank. The mass balance and energy balance of the flash tank are as follows [
4]:
As shown in
Figure 5,
is the mass flow rate of inlet water (kg/h),
is the specific enthalpy value of inlet water (kJ/kg),
is the mass flow rate of saturated steam at the outlet (kg/h),
is the specific enthalpy value of saturated steam at the outlet (kJ/kg),
is the mass flow rate at the outlet drain water (kg/h), and
is the specific enthalpy value of the outlet drain water (kJ/kg).
The evaporation rate of the flash evaporator [
31] is calculated as follows:
In Equation (6), is the efficiency of the flash tank, (); is the steam dryness (); and is the latent heat of vaporization (kJ/kg).
The volume of the flash tank is calculated as follows:
In Equation (7),
is the allowable ultimate strength per unit volume of steam [
32]; in this paper,
(m
3/(m
3·h)).
3.3. Efficiency of Solar Field
When the AFSC works in the solar collection system, the heat transfer of the absorbing pipe includes radiation, conduction, and convection, which is a composite heat transfer process. Based on the following hypothesis, the heat transfer process of the endothermic pipeline can be considered as a one-dimensional steady-state heat transfer problem.
- (1)
The non-uniform temperature distribution around the endothermic tube is ignored;
- (2)
The AFSC can well track the movement of the sun, and it can be assumed that the sun’s rays are all coming in vertically;
- (3)
The heat dissipation of the collector supporting structure is ignored;
- (4)
The performance of all parts of the system is stable;
- (5)
The performance of the heat transfer working medium is stable, and the physical parameters are averaged.
According to the steady heat transfer in one dimension, the following energy balance equation can be obtained:
In the above equations, is the solar energy received by the collector, ; is the solar energy received by the collector; is the heat absorbed by the working medium in the collector tube; is the total heat exchange between the surface of the endothermic tube and the environment in convection and radiation, where is the radiation scattering of the endothermic tube to the environment; and is the convection heat transfer between the endothermic tube and the environment.
In the above formulas, is the convection heat transfer coefficient between the endothermic tube and the environment, ; is the effective area of the collector field, ; is the horizontal projection area of the mirror surface and is the area unit of the collector tube, m2; is the emissivity of the outer wall of the endothermic tube; is the Stephen Boltzmann constant, and is 5.67 × 10⁻⁸; is the average temperature of the endothermic tube wall; is the ambient temperature; is the equivalent sky temperature, where the unit of the three temperatures is K; and, according to the most common model of convective heat transfer caused by wind in the literature, the convective heat transfer coefficient , where is the environmental wind speed (m/s).
The heat collecting efficiency of collector can be calculated as follows:
Because
is far less than
and
,
.
3.4. Pressure Loss of Solar Field
The working fluid in the preheated heat field is liquid water and in the overheated heat field is steam, both of which are single-phase flows. The pressure loss formulas are shown below, respectively.
In the above equations, is the preheating field pressure loss, is the overheating field pressure loss, (Pa); are the length of the preheating field collecting heat pipe and the length of the overheating field collecting heat pipe, respectively (m); are the Reynolds number of working medium in the preheating field and the overheating field, respectively; are the density of working medium in the preheating field and the overheating field, respectively (kg/m3); and is the flow rate of the working medium (m/s).
3.5. State Matrix Equation for the SAPG System
According to the mass and energy balance equations of each regenerative heater, Equation (18) is derived. Equation (18) is the state matrix equation of the SAPG system.
Equation (18) can be shorthand for
As shown in Equation (18), is the ith extraction steam heat release in feed water heater (FWH) (kJ/kg); is solar steam heat release in feed water heater (kJ/kg); is the ith hydrophobic heat release (kJ/kg); is the ith feed water enthalpy rise (kJ/kg); is the ith extraction steam flow (kg/h); is the ith solar heating system working medium flow (kg/h); is feed water enthalpy increase for pump (kJ/kg); is main steam mass flow (kg/h); is boiler continuous blowdown mass flow (kg/h); is steam loss in the main steam pipeline (kg/h); is superheater spray cooling water quantity (kg/h); is feed water mass flow (kg/h); and is mass flow of solar field inlet water (kg/h). Meanwhile, , , depending on the type of FWH. In closed FWHs, , , ; for open FWHs,, , .
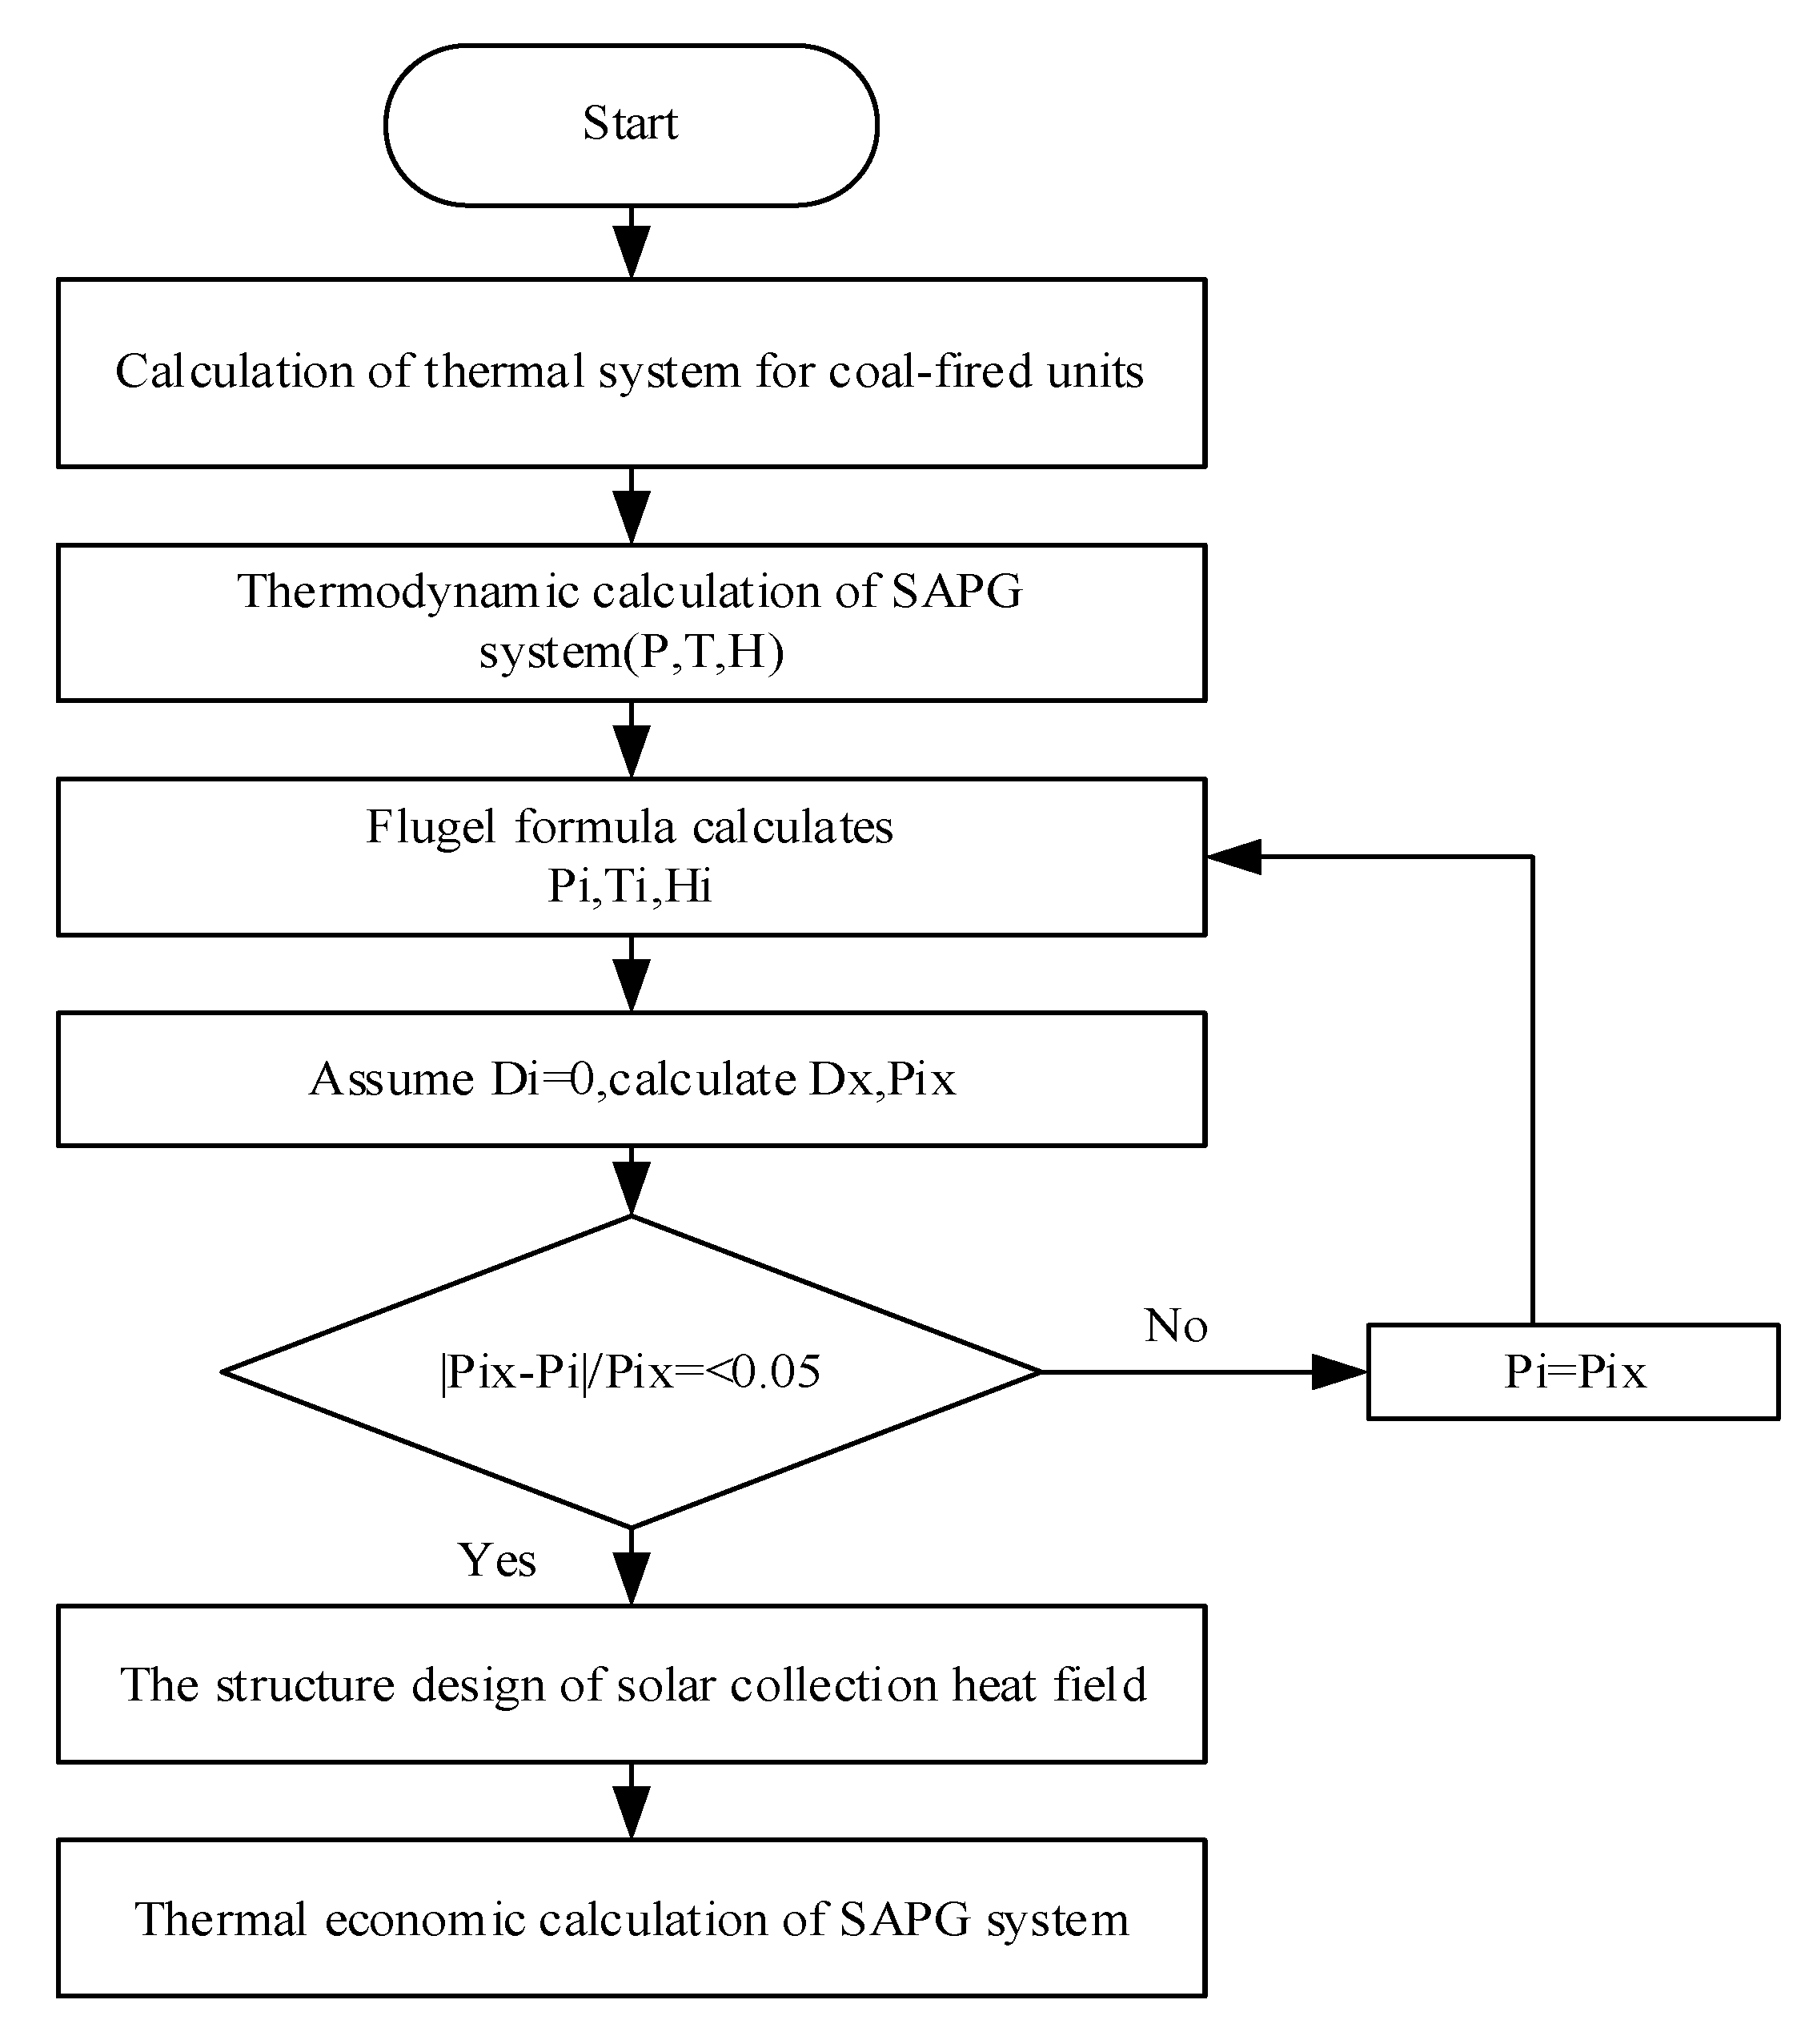
Owing to the introduction of solar steam, the above calculation and the subsequent disturbance analysis will involve the calculation of variable working conditions. The variable condition calculation here is based on the improved Flugel formula shown in Equation (20). It is assumed that the exhaust pressure and temperature of the steam turbine are constant here. According to the extraction port of the steam turbine, the stage group is divided by the reverse sequence method.
In Equation (20), j stands for the jth stage group; are the pressure and flow rate of the jth stage group in cole-fired units; and are the pressure and flow rate of the jth stage group of the composite system.
3.6. System Evaluation Model
The thermal economy index of the SAPG system consists of the cycle thermal efficiency of working fluid; the heat consumption rate of power generation; and the standard coal consumption rate of power generation, which is called the standard coal consumption rate.
The cycle thermal efficiency of working fluid
is given by Equation (21), where
is the internal shaft work of the turbine and
represents the difference between the work done by 1 kg of exhaust steam in the turbine and the work done by 1 kg of extraction steam on the turbine. When extraction steam is high-pressure extraction steam,
, otherwise,
, where
is the less work done by 1 kg of auxiliary steam leaving the cylinder. When auxiliary steam leaves in the high-pressure cylinder,
, otherwise,
, and
is the circulating heat absorption of the working fluid of the hybrid power generation system in the boiler. Here, the solar energy is seen as waste heat, and does not appear in Equation (21).
The heat consumption rate of power generation is given by Equation (22) and
calculated by Equation (21).
is the boiler efficiency. In order to make the boiler efficiency change as little as possible, the temperature of feed water and the temperature of cold and hot reheated steam are kept constant during the calculation,
, where
is the pipeline efficiency
;
is the mechanical efficiency
; and
is the generator efficiency
.
The standard coal consumption rate of power generation is given by Equation (23).
5. Disturbance Analysis
In this section, non-variable conditions and two calculation methods of variable conditions are proposed in order to explore the influence of solar system on the thermal performance of coal-fired power plants and whether the calculation process can be further simplified. This section compares the calculation of two kinds of variable conditions and the calculation of non-variable conditions, in order to determine what kind of replacement conditions can be regarded as a small disturbance.
5.1. Analysis Method
In this section, Matlab is used to calculate the thermal economic index of the SAPG system. The general range of small disturbance is obtained, which can be used as a reference for the simple calculation of the SAPG system. This section adopts the following two calculation methods of variable working conditions. From the results, the paper analyzes whether or not the simplified variable condition calculation can be carried out.
Calculation method for total variable conditions:
- (1)
The new extraction pressure, flow rate, and enthalpy were calculated using the improved Flugel formula;
- (2)
Keep the difference at the end of the heater unchanged to obtain the hydrophobic and feedwater enthalpy values. From the above values, obtain the feedwater enthalpy rise, the hydrophobic heat release, and the extraction steam heat release;
- (3)
Get the new extraction amount and the flow rate, and calculate the extraction pressure again;
- (4)
Compare whether the change of two extraction pressure is less than a certain range;
- (5)
If yes, output the result, or return to step 1 for recalculation.
Calculation method of partial variable conditions:
- (1)
The new extraction pressure, flow rate, and enthalpy can be calculated using the Flugel formula;
- (2)
Keep feed water and the hydrophobic enthalpy constant;
- (3)
Calculate the new steam extraction quantity and flow rate, and calculate the steam extraction pressure again;
- (4)
Compare whether the change of two extraction pressures is less than a certain range;
- (5)
If yes, output the result, if not, return to step 1 for recalculation.
From the above two methods, the total variable condition is the most accurate variable condition calculation, but the variable condition parameters include extraction enthalpy value, feed and drain water temperature, and enthalpy value, so the calculation process is complex. Partial variable conditions are relatively simple, the partial variable conditions parameter only involves the extraction enthalpy value, and the calculation process is relatively simple. If the variable condition calculation is not carried out, the variable condition parameter is not involved. The enthalpy of extraction as well as the temperature and enthalpy of feed water and drain water are unchanged. The calculation process is the simplest, but the accuracy is the lowest.
5.2. Comparison of Total Variable Conditions and Non-Variable Conditions
Table 2 shows the thermal economy of the SAPG system at all stages under the non-variable condition; the thermal economy results of the total variable condition are shown in
Table 1.
Table 3 shows the economic efficiency errors of the total variable condition, and
Table 4 shows the pressure errors of the total variable condition. By comparing
Table 3 and
Table 4, each error value is defined as Equation (24), where
is the value of the non-variable working condition and
is the value of the variable working condition.
The thermal economy of the SAPG system when it is under non-variable operating conditions can be seen from
Table 2. Compared with the original coal-fired units, the steam consumption rate and heat consumption rate are reduced. The effect is most significant when it replaces the first stage. The trend of this result is the same as that of the SAPG system when it is under total variable conditions.
However, the cycle thermal efficiency in the SAPG system is slightly higher than that under the non-variable condition.
Table 3 and
Table 4 are calculated according to Equation (24) for thermal economy and steam extraction pressure in both total and non-variable conditions.
In
Table 3, the maximum thermal economy error is 4.78%, so the thermal economy error is within the 5% allowed in the project. Therefore, from the perspective of thermal economy, the results obtained from the calculation under the non-variable working condition also meet the requirements in the project.
Table 4 has shown that, the higher the substituted extraction pressure, the greater the steam extraction pressure variation. It is also known that, except for the substitution of the 6th stage and the 8th stage, the pressure changes of the other stages are all greater than 5%. Strictly speaking, the steam expansion line of the unit under these substitutions is obviously moved, leading to great changes in thermodynamic parameters. From the perspective of stable operation of the system, the variable operating conditions must be calculated. From the perspective of simplified calculation, the calculation can be carried out under non-variable conditions when the 6th and 8th stages are replaced.
5.3. Comparison of Partial Variable Conditions and Non-Variable Conditions
Table 5 shows the thermal economy of the SAPG system at all stages under partial variable conditions, and the results of thermal economy under non-variable conditions are shown in
Table 2.
Table 6 and
Table 7 show the economic errors and pressure errors in partial variable conditions. The errors are also calculated by Equation (24).
Table 5 shows the thermal economy of the composite system at all stages under partial variable conditions. It can be seen from
Table 5 that the cycle thermal efficiency at the 8th stage in partial variable conditions is greater than that under total variable conditions. This is because the steam extraction pressure increases under partial variable conditions, the feed water and drain water enthalpy rise remains unchanged, and the steam extraction quantity at all stages is less than that under total variable conditions, so the efficiency is high. The results of replacing the 8th stage show that the cycle thermal efficiency is lower than that of coal-fired units, and the heat consumption rate is higher than that of coal-fired units. This is because the extraction steam enthalpy value increases, but the feed and drain water enthalpy rise remains unchanged, meaning the extraction steam quantity is reduced and the overall amount of extraction steam power is reduced. However, the condensing steam quantity is only slightly changed compared with that of the original coal-fired unit, which leads to steam power being less than the original unit. Besides, keeping feed water enthalpy values unchanged, but with reheat steam absorbing more heat, causes more circulating heat absorption of the working fluid, so the overall result of cycle thermal efficiency decreases. Therefore, the partial variable condition calculation is not advisable to replace the 8th stage calculation.
Table 6 and
Table 7 show the partial variable conditions of economic errors and pressure errors of the SAPG system. We can know from
Table 6 that the maximum thermal economy error is 2.84%, so the errors are all within 5%. Therefore, from the perspective of thermal economy, it is not applicable to the partial variable condition calculation in the case of replacing the 8th stage, while other stages are applicable within the allowable scope of the project. It can be seen from
Table 7 that, except for replacing the 8th stage, the pressure error of replacing the 6th stage is within 5%. Considering the stable operation of the system, replacing the 6th stage can be carried out under the partial variable calculation.
5.4. Comparison of Total Variable Conditions and Partial Variable Conditions
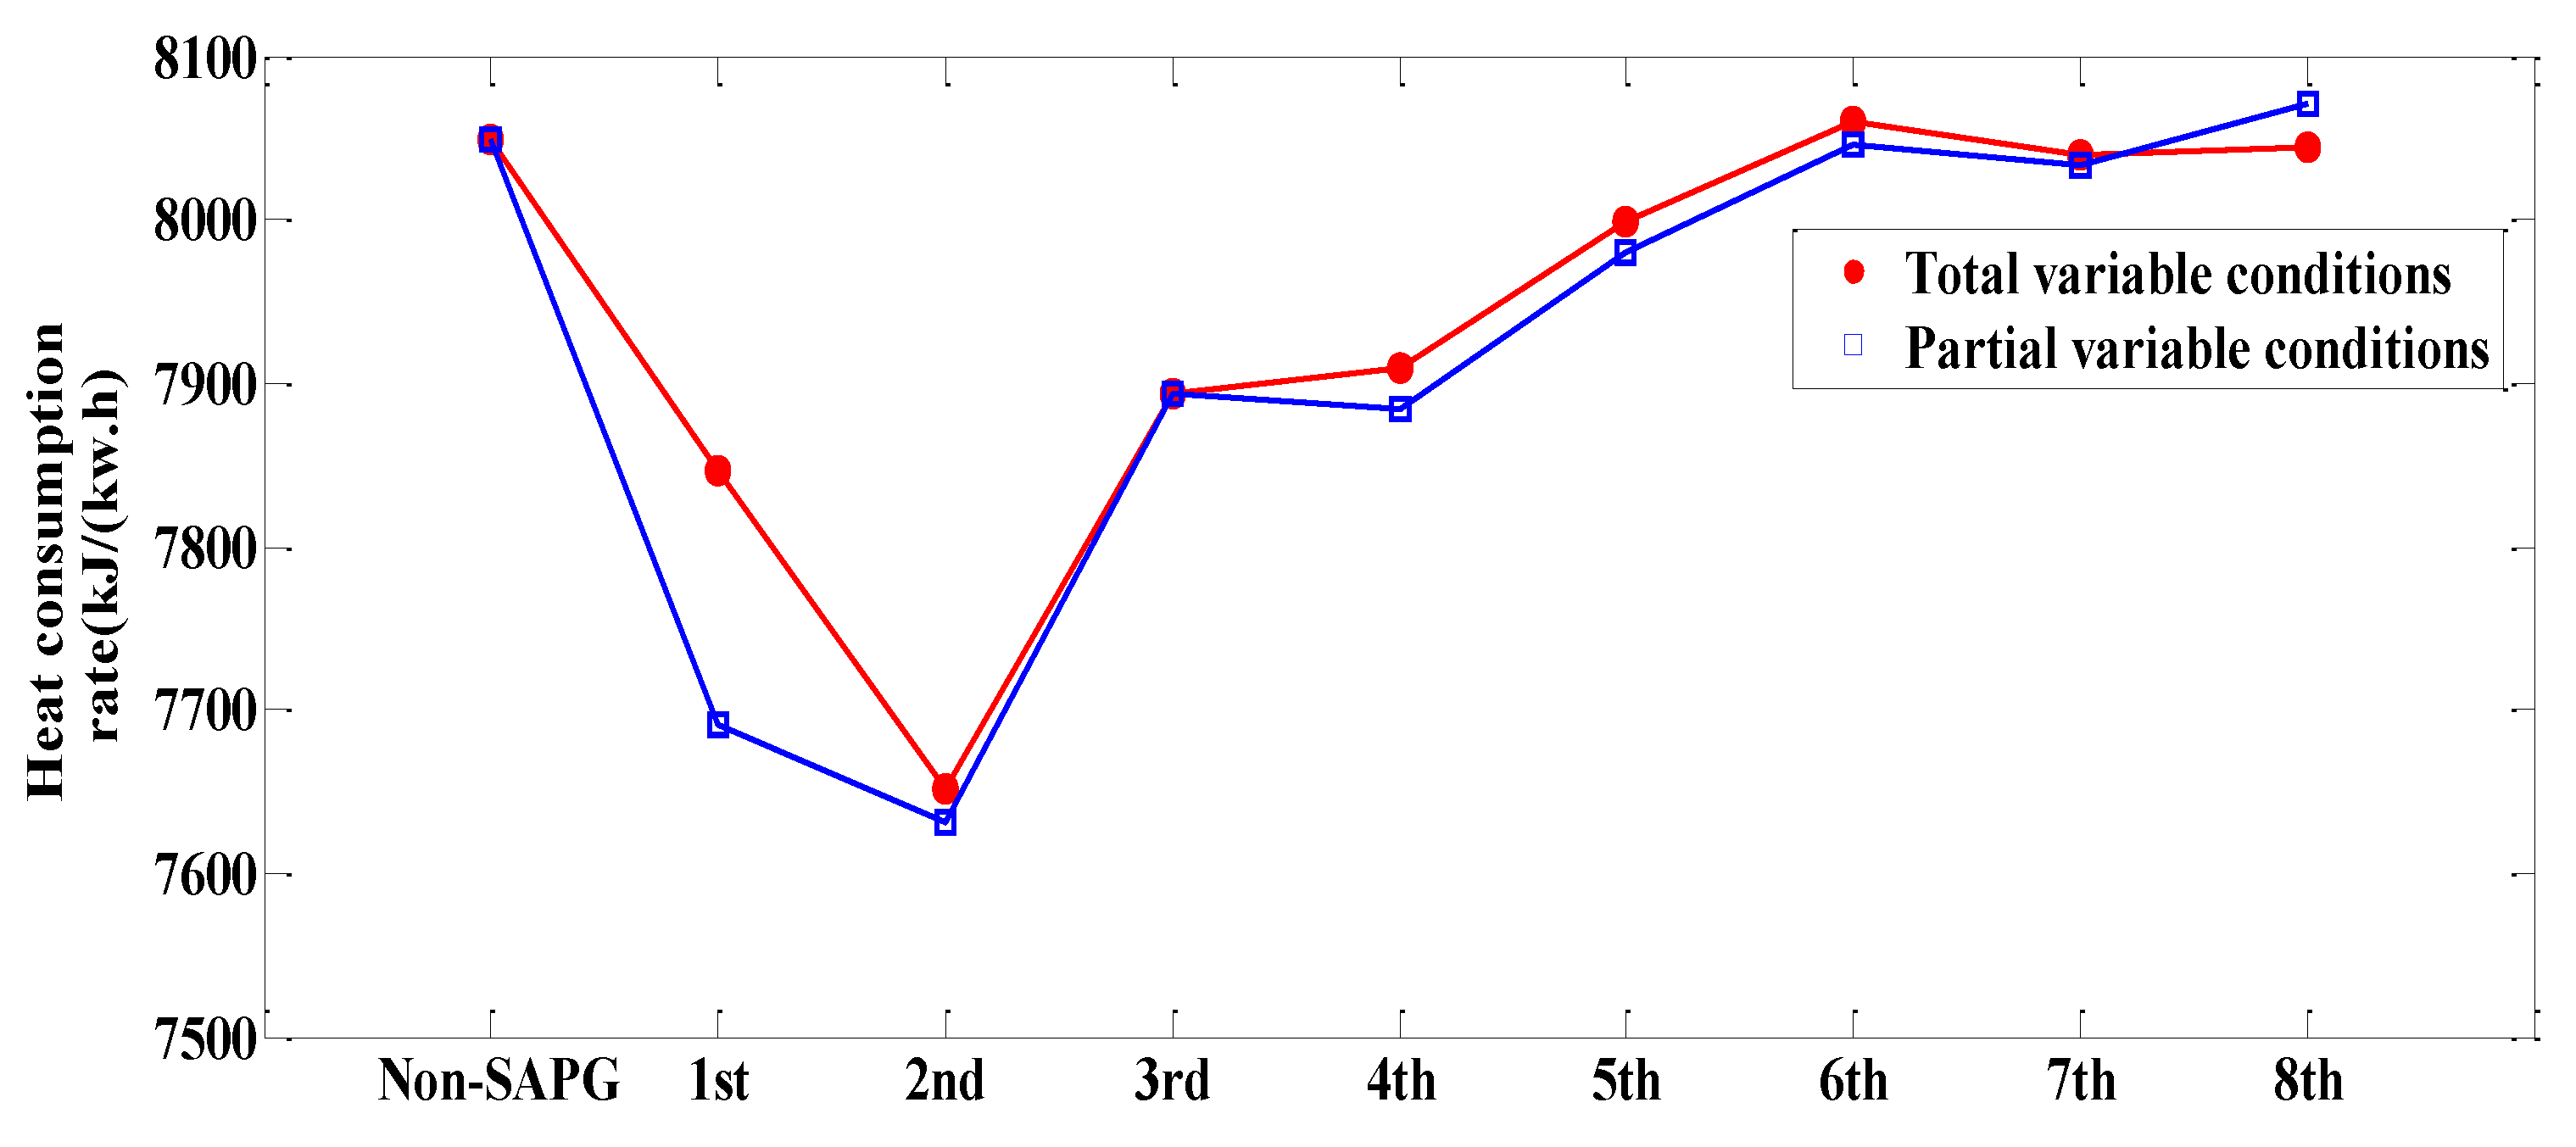
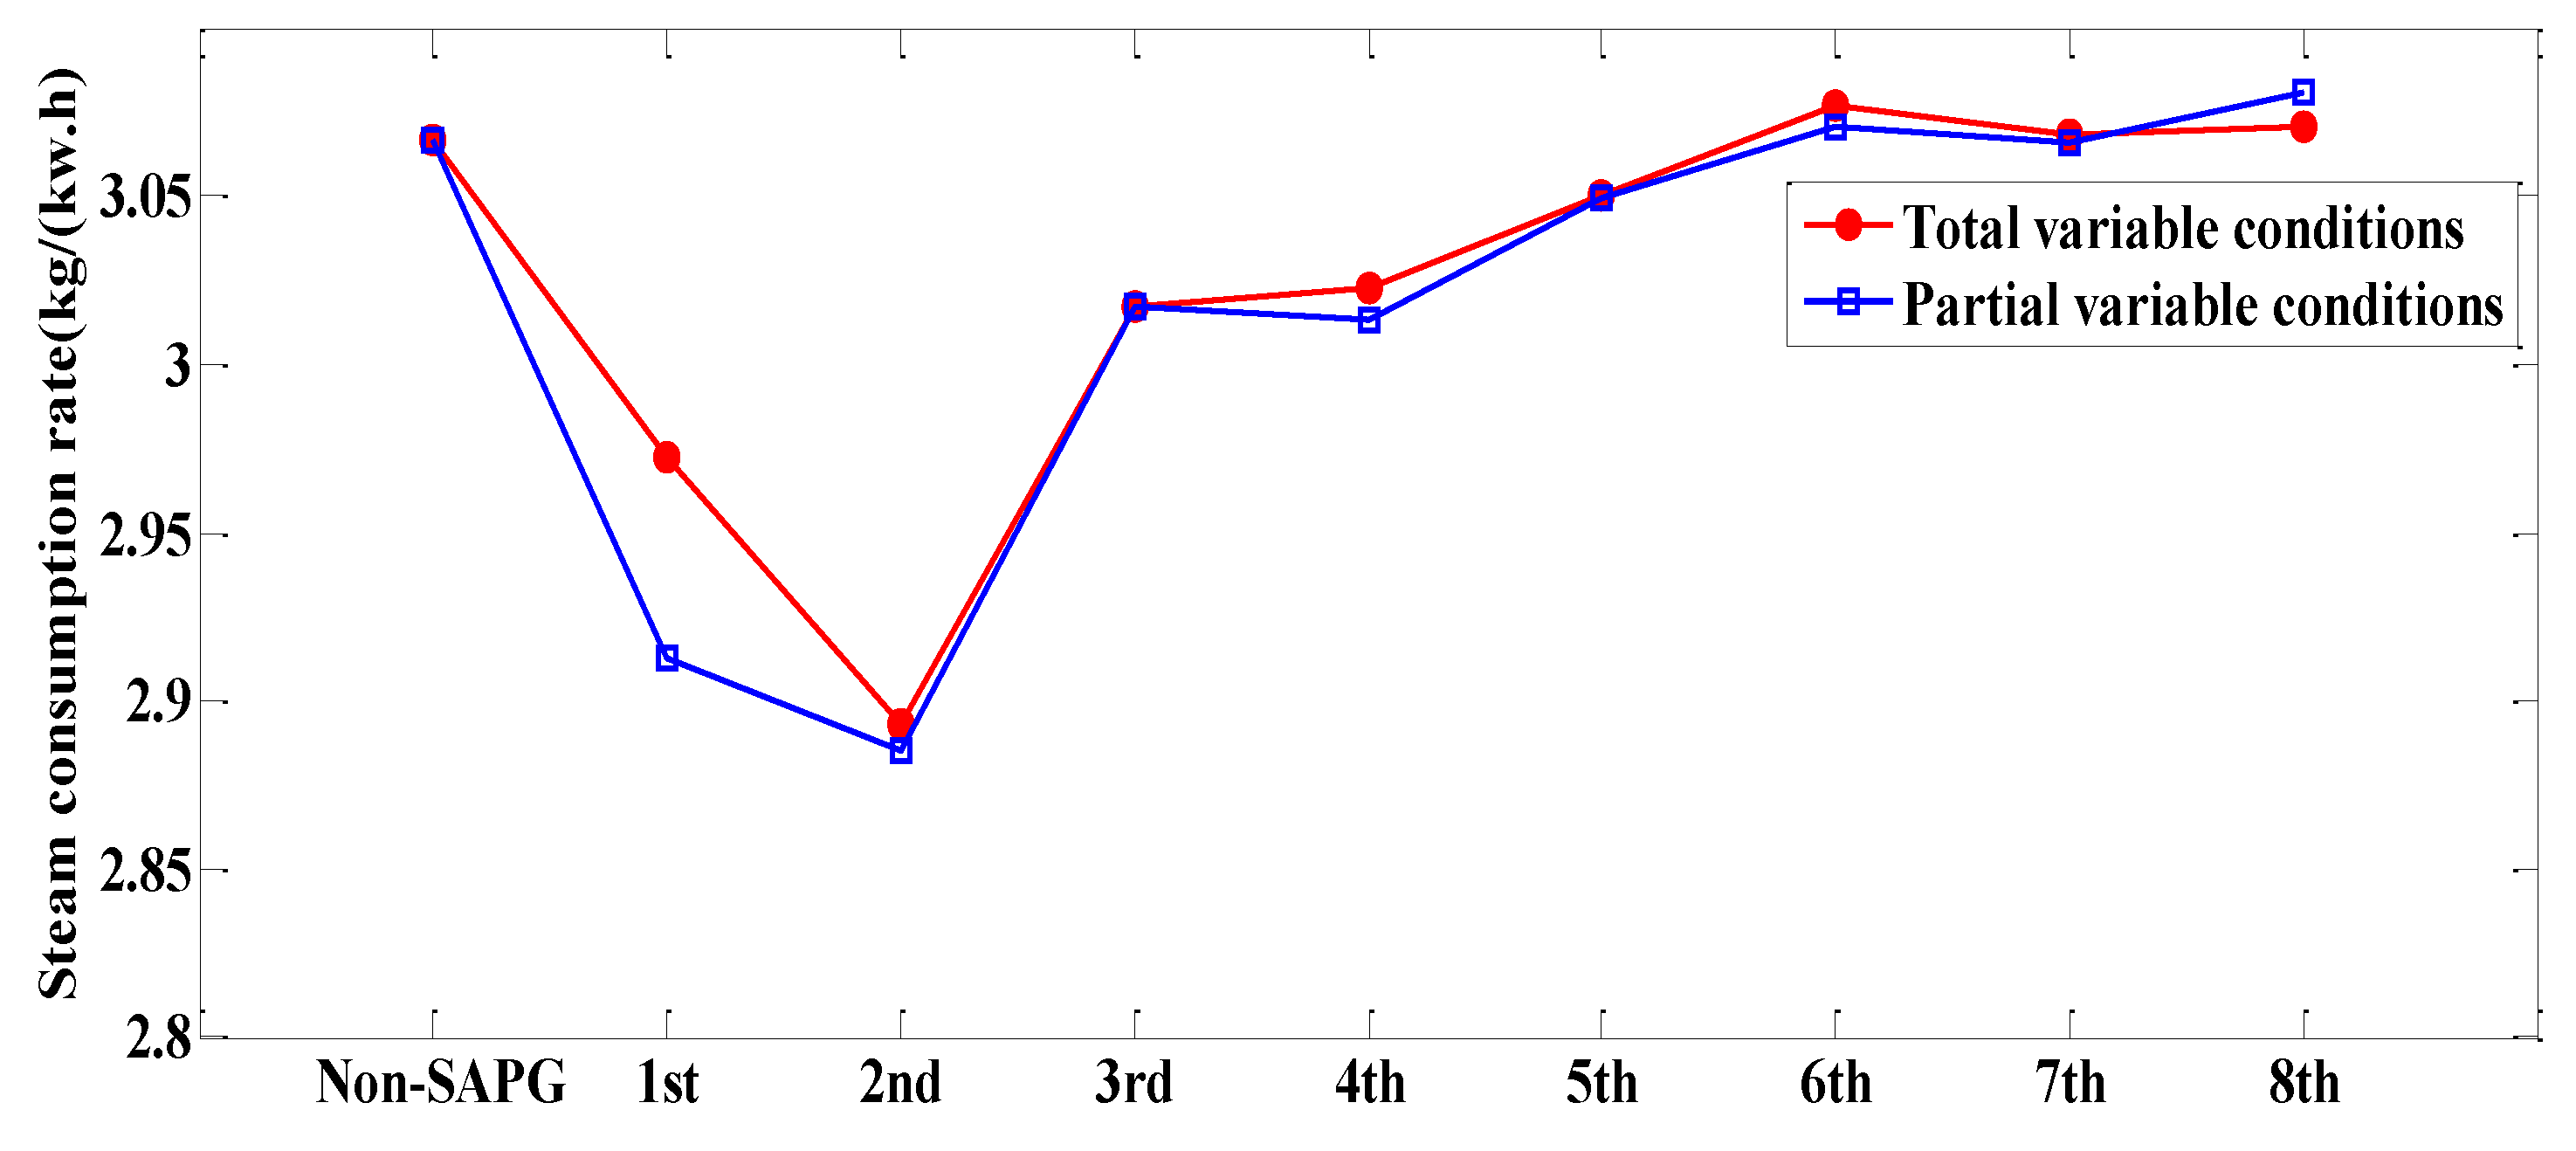
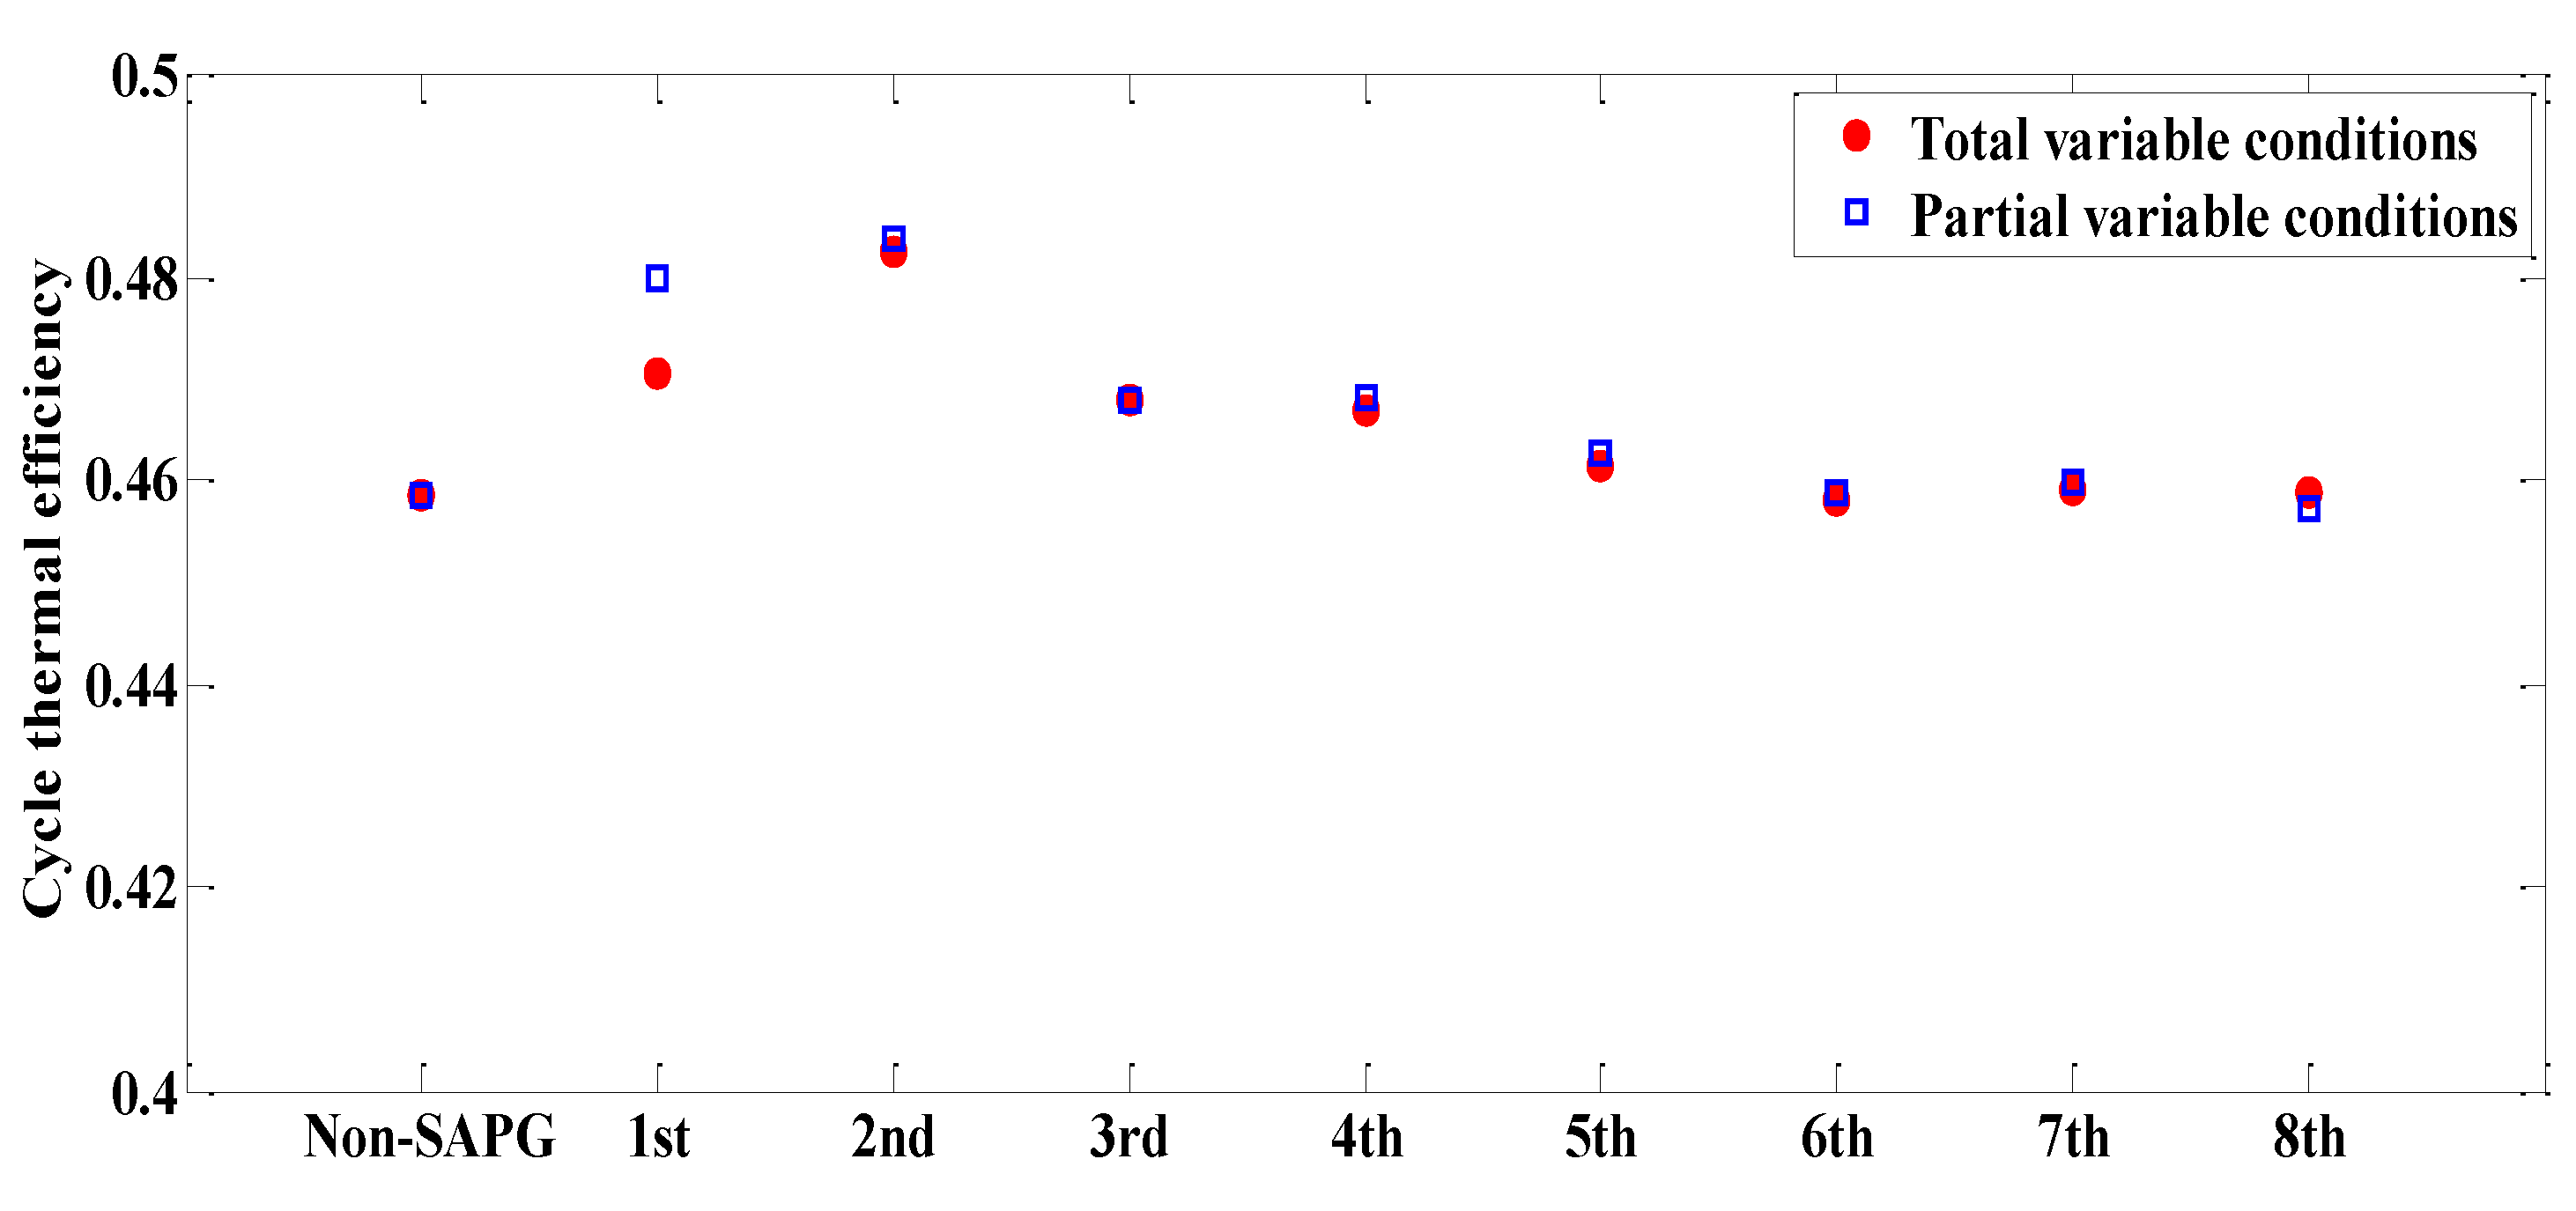
Figure 7,
Figure 8 and
Figure 9 show the heat consumption rate, steam consumption rate, and cycle thermal efficiency, respectively, under partial and total variable conditions. The values in the picture come from
Table 1 and
Table 2.
Figure 7,
Figure 8 and
Figure 9 show that the heat consumption rate, steam consumption rate, and cycle thermal efficiency have little change under total variable conditions and partial variable conditions. The maximum error of the heat consumption rate is 0.4%, which occurs when the 1st stage is replaced. The maximum error of the steam consumption rate is 2.2%, which also occurs when the 1st stage is replaced. As shown in
Figure 8, the cycle thermal efficiency of the two variable conditions is very similar with a very small error. Therefore, within the allowable range of 5% of the project, it is applicable to all of the variable conditions, except for the substitution of the 8th stage.
5.5. Disturbance Analysis under Partial Variable Conditions
According to the above analysis, the thermal economy calculation of the 1st–7th stages and the error of variable condition are within the allowable range. Therefore, in order to simplify the calculation process of the variable condition, the partial variable condition calculation is used to analyze the extraction conditions of the partially substituted 1st to 7th stages, and the comparison is made with the non-variable condition calculation.
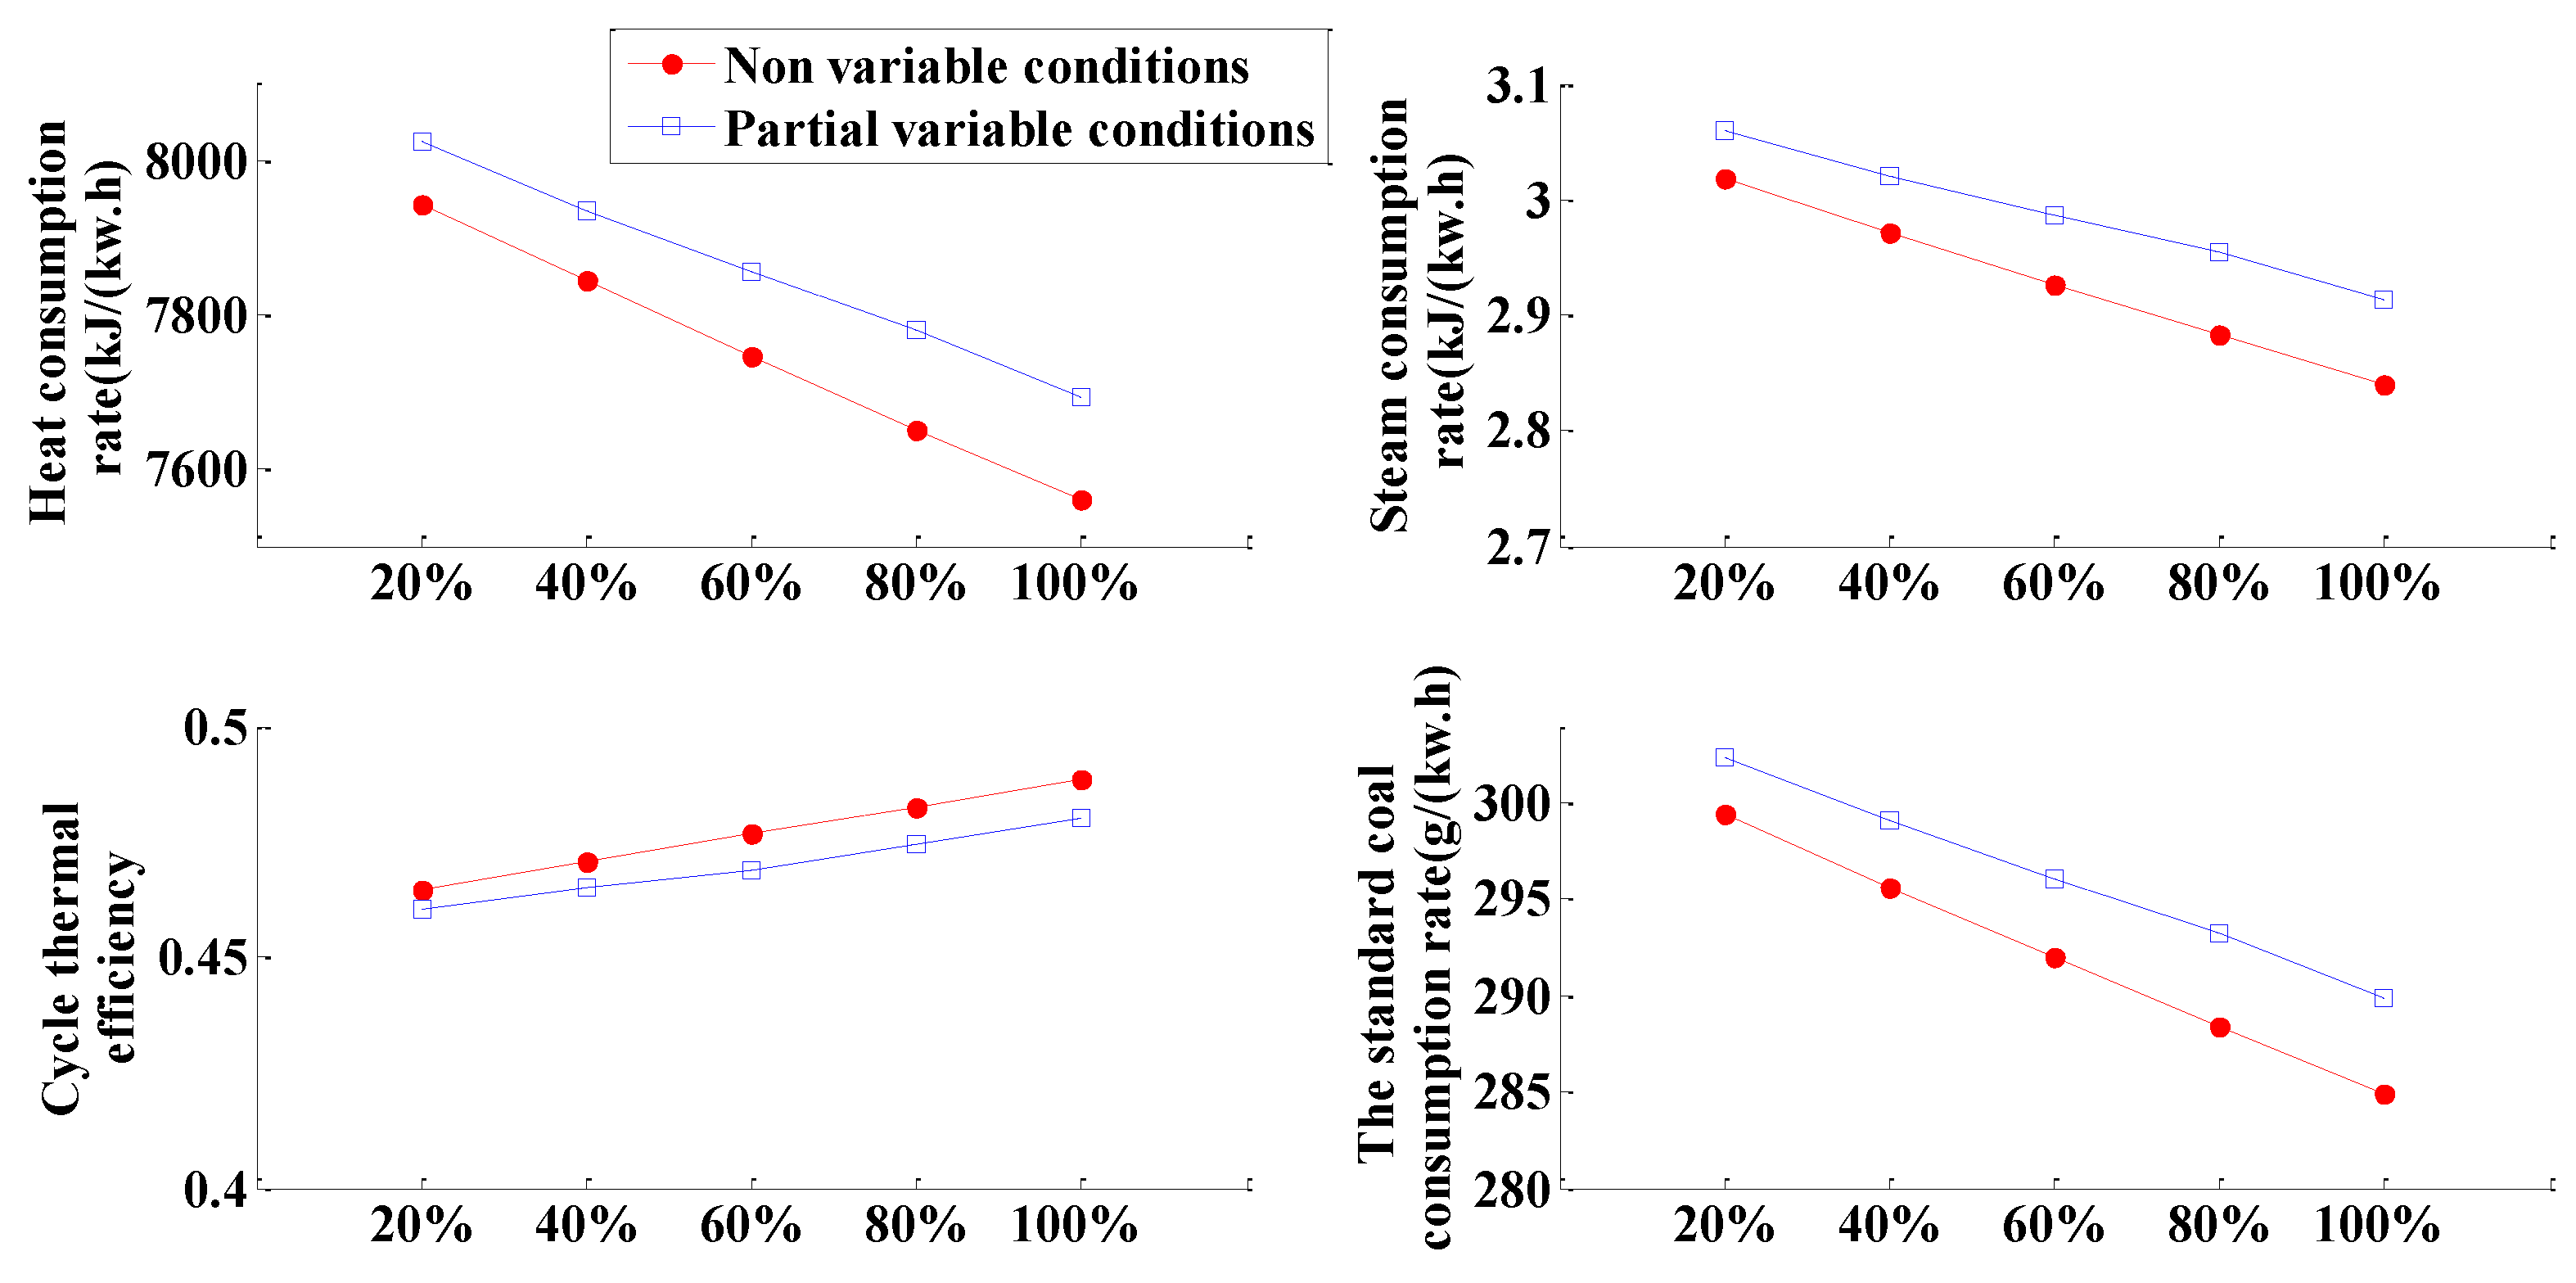
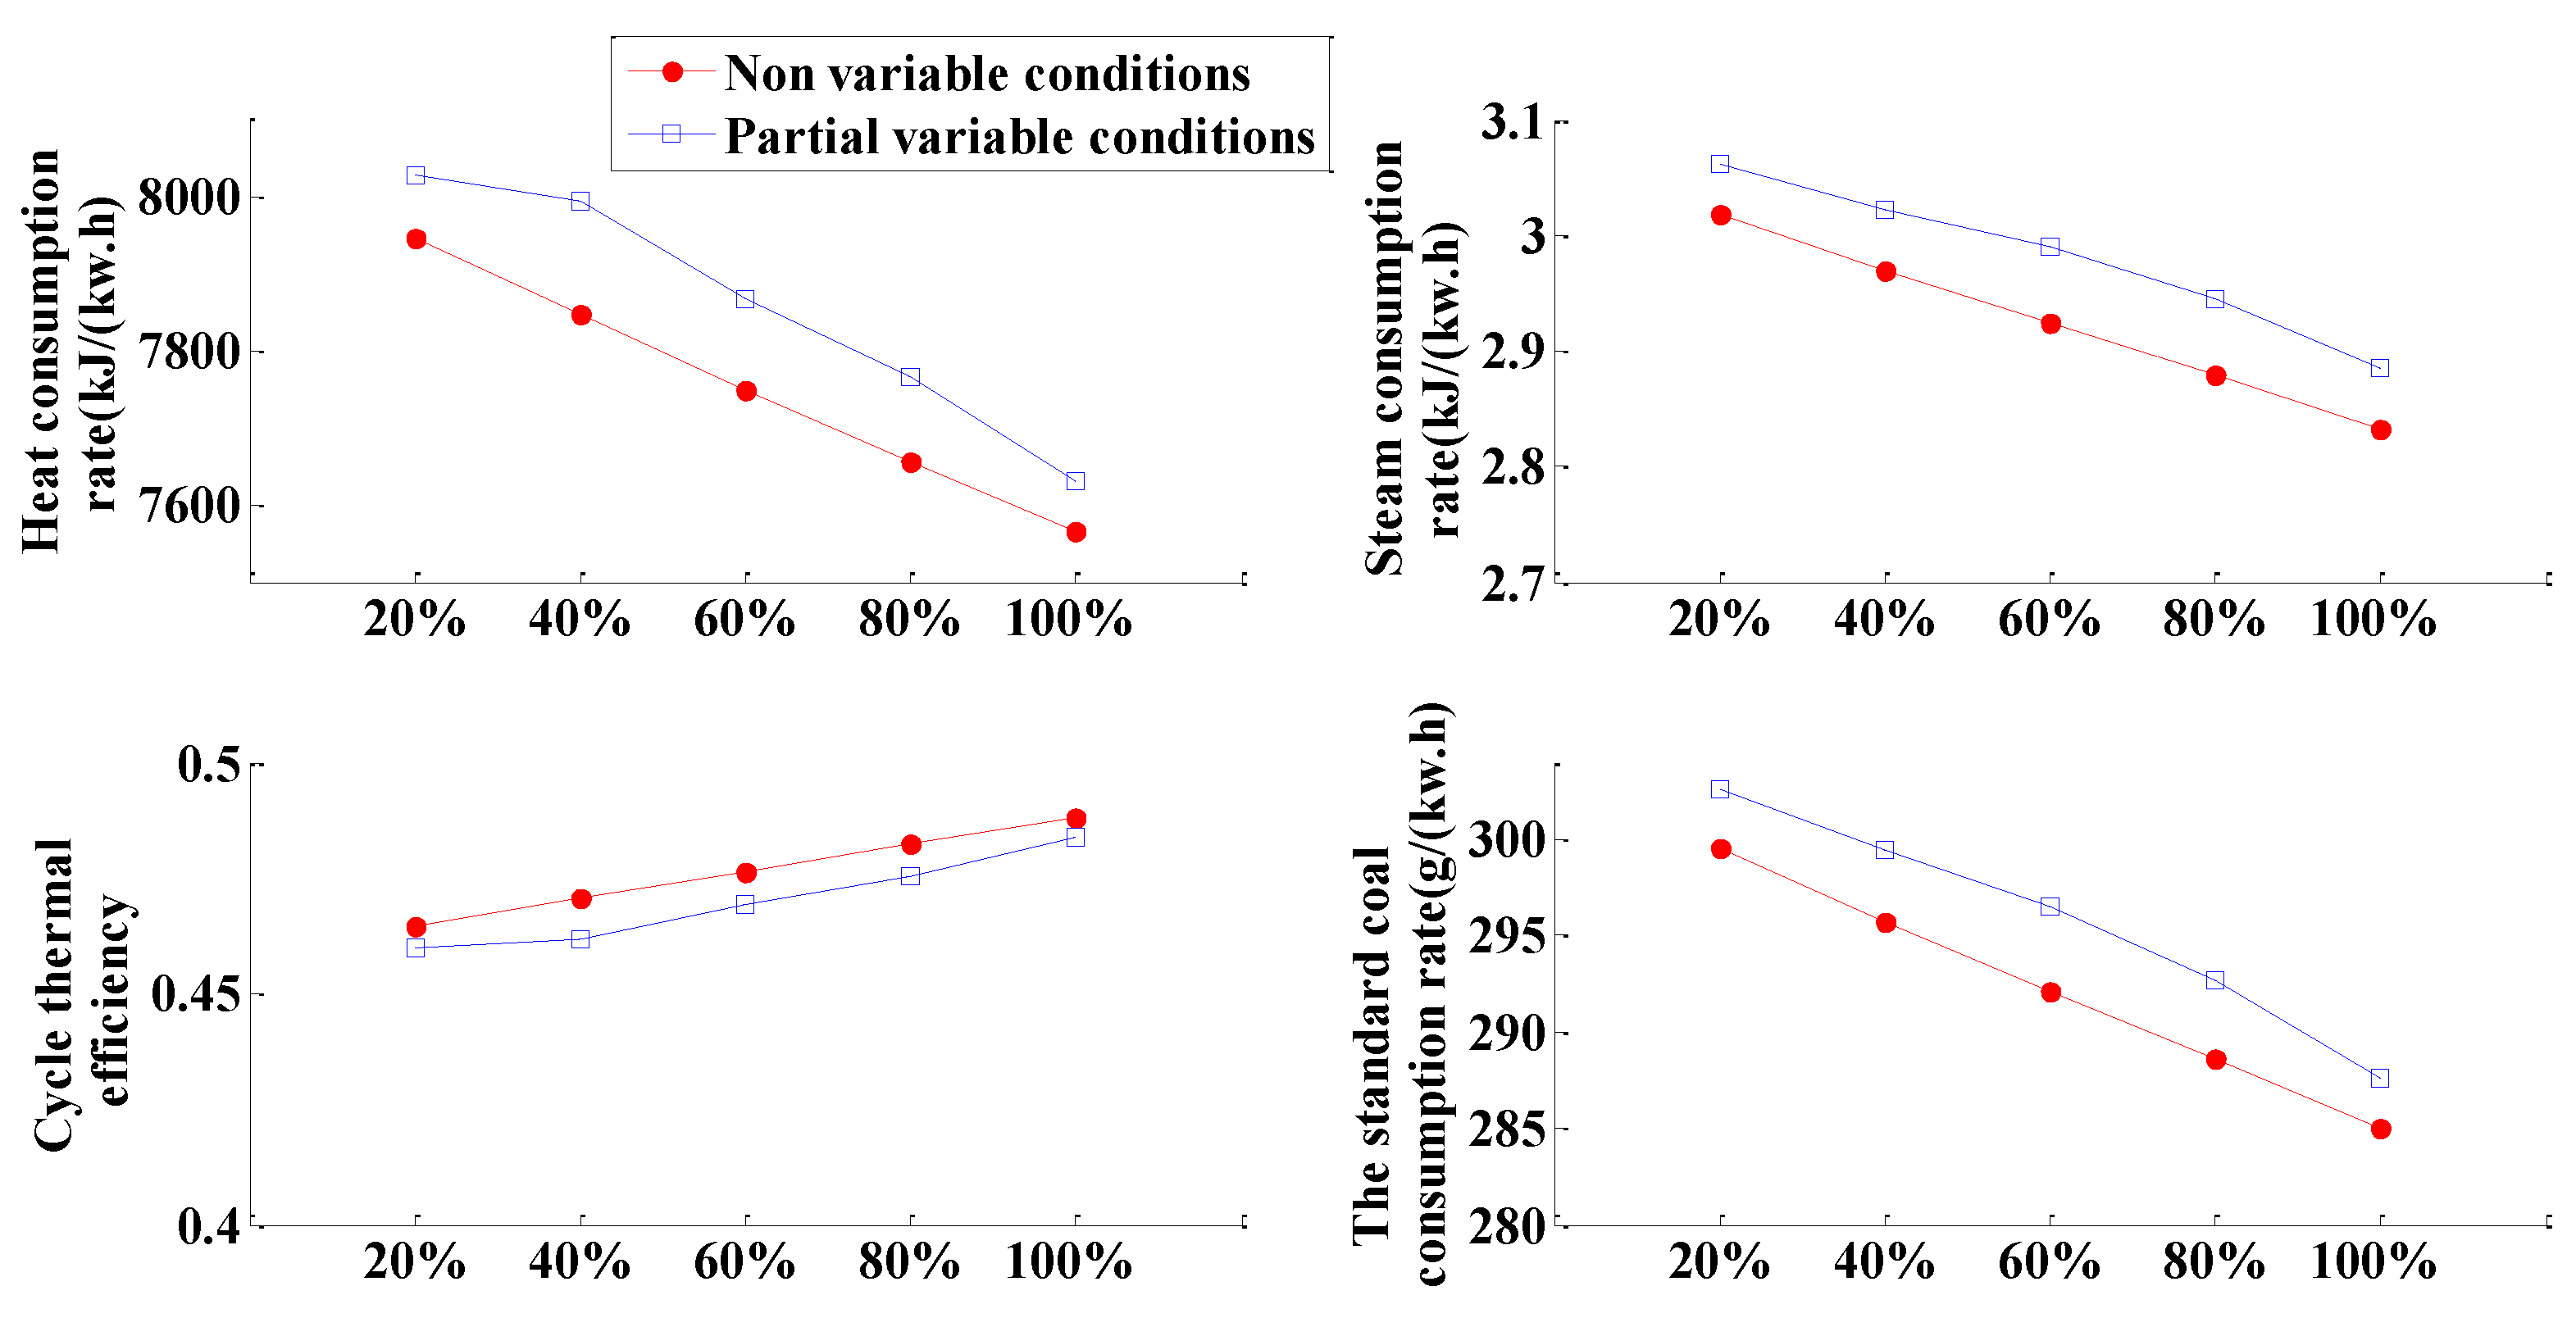
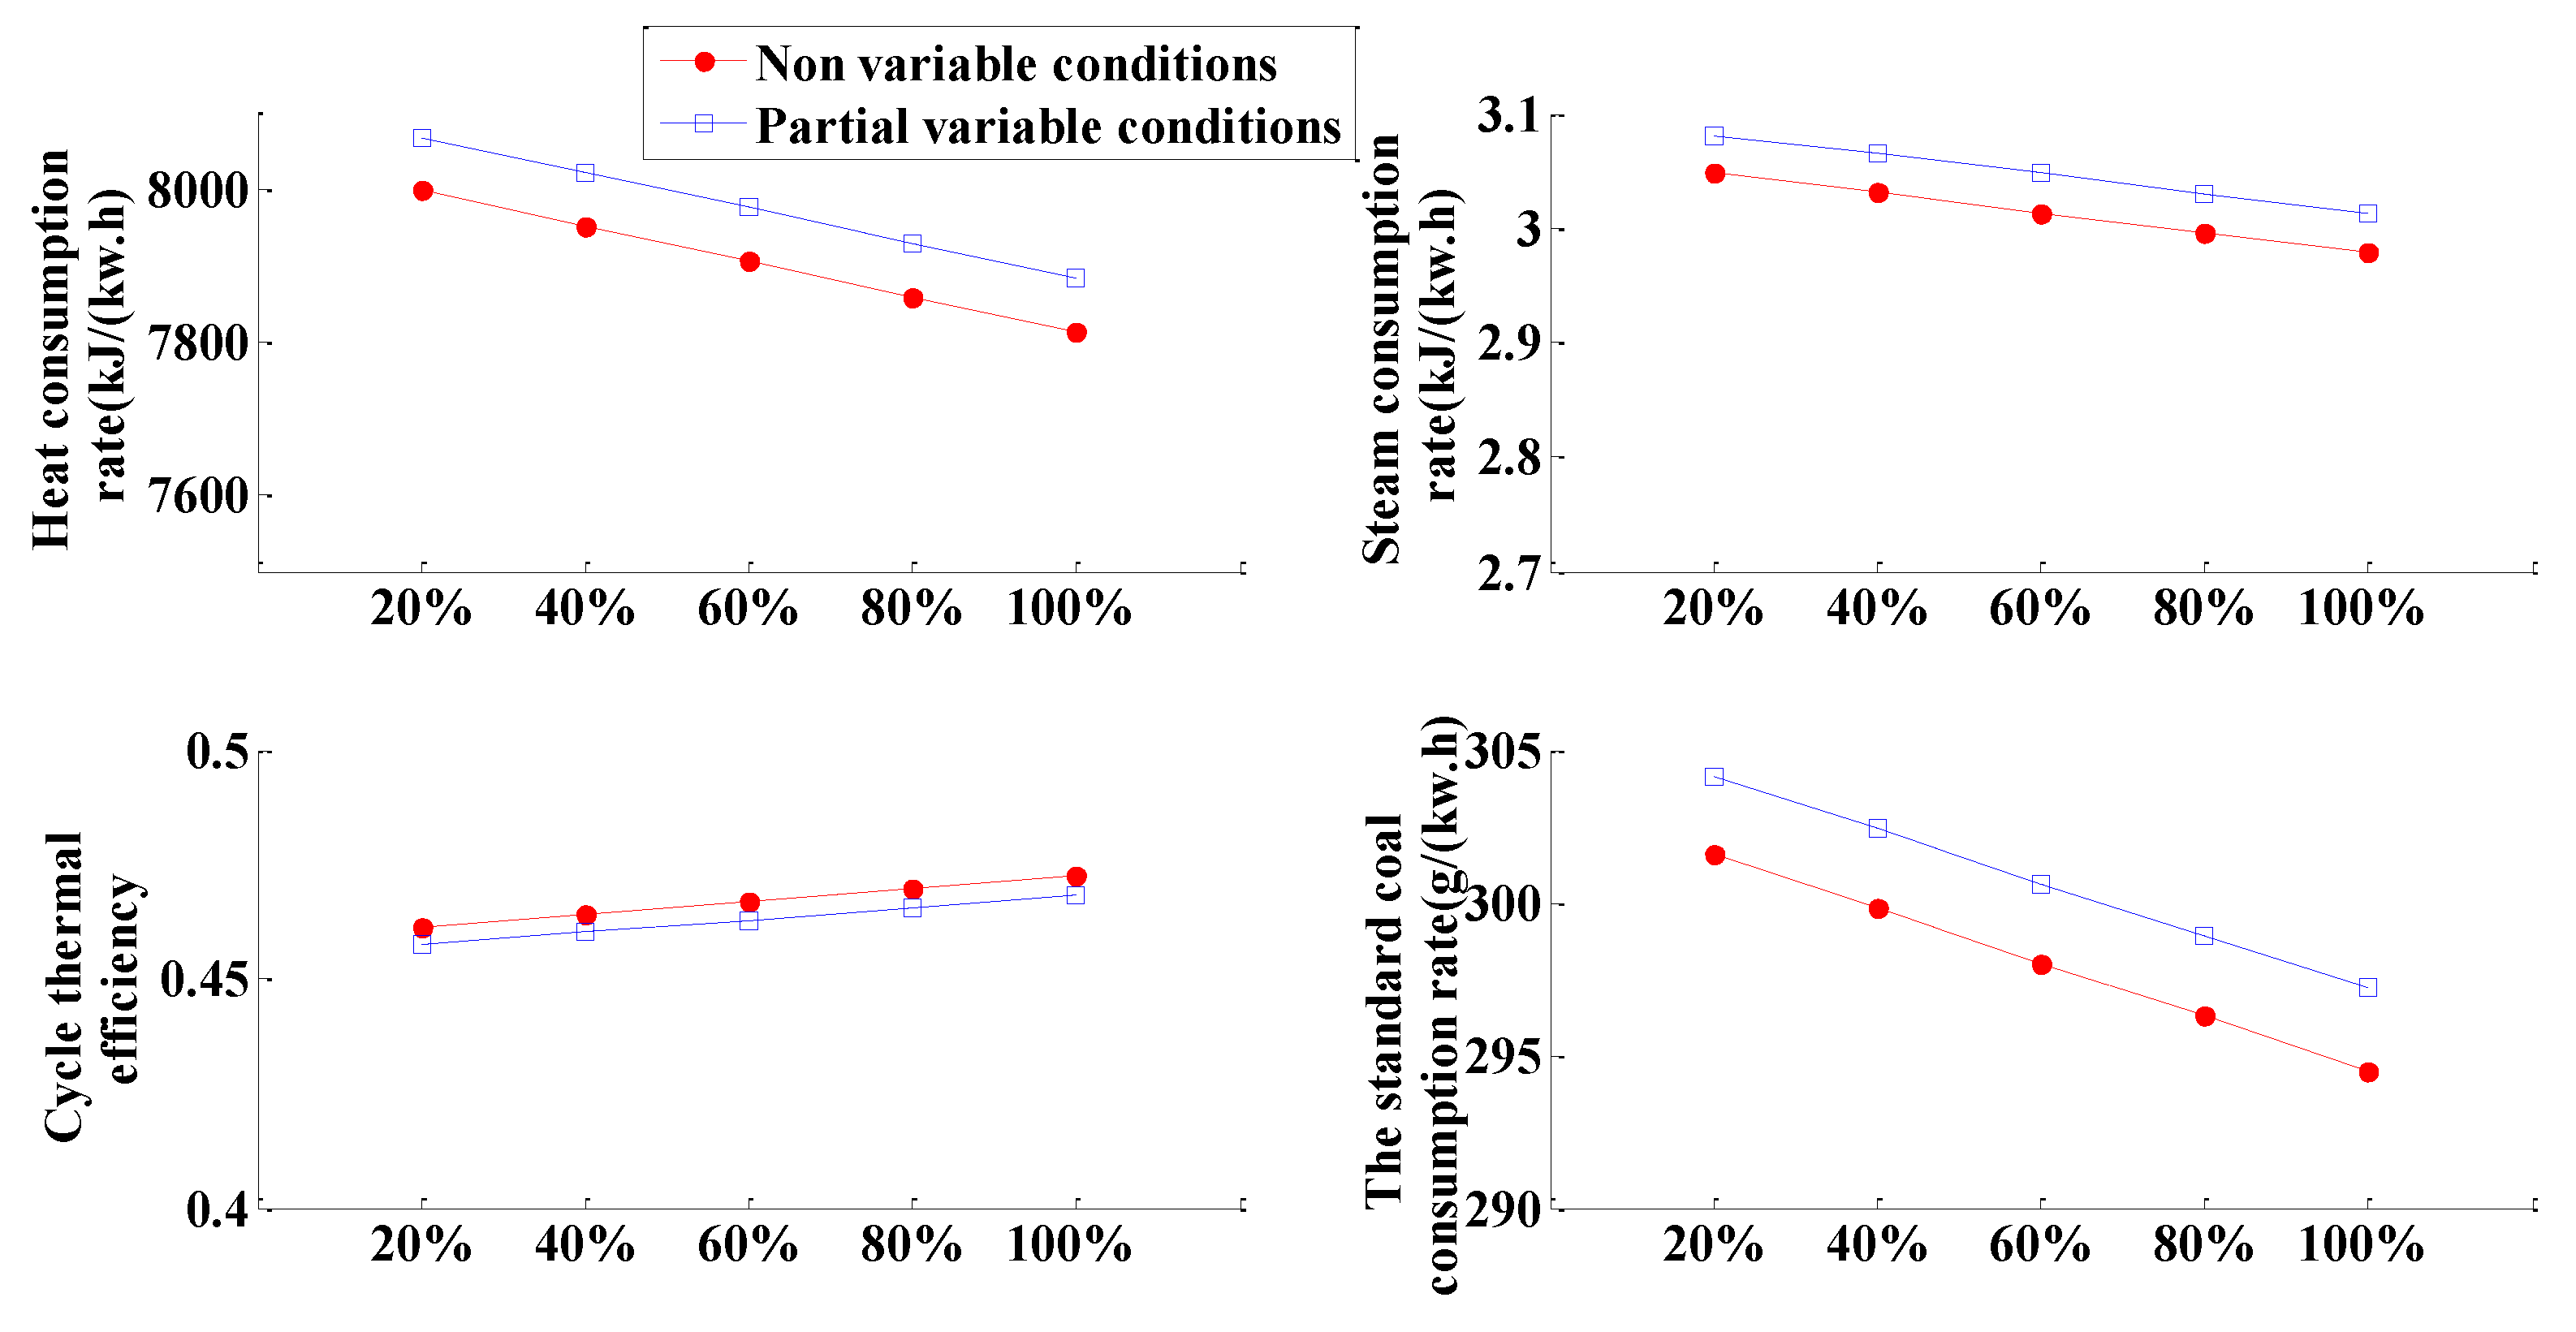
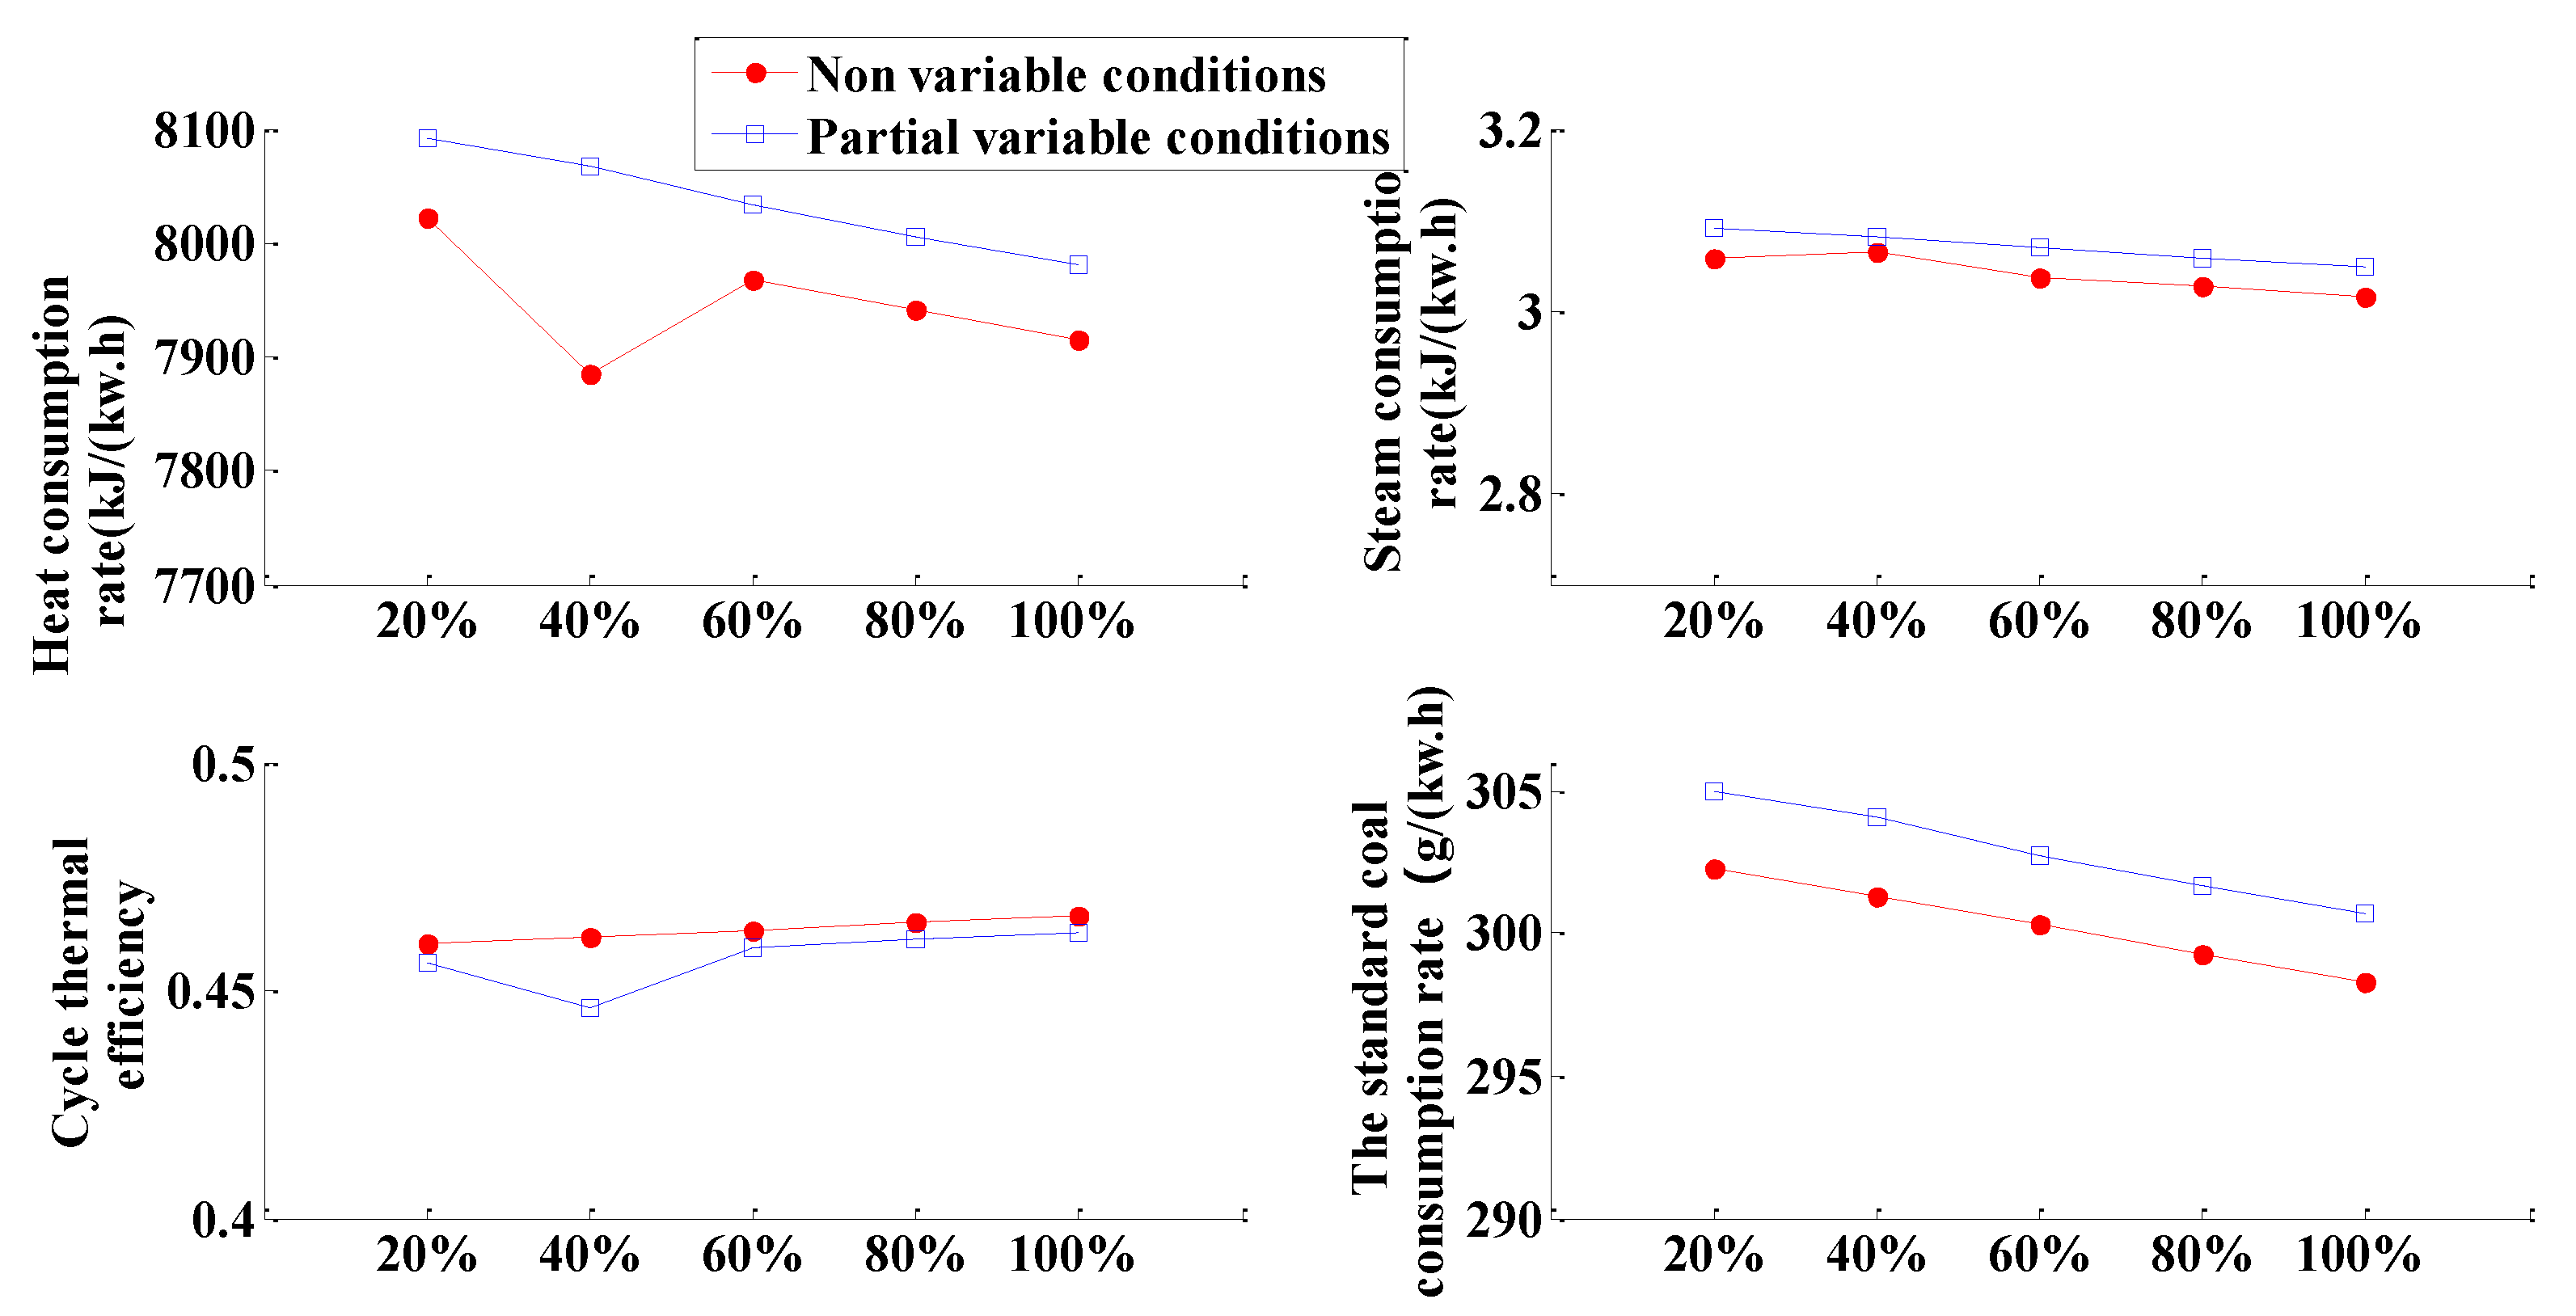
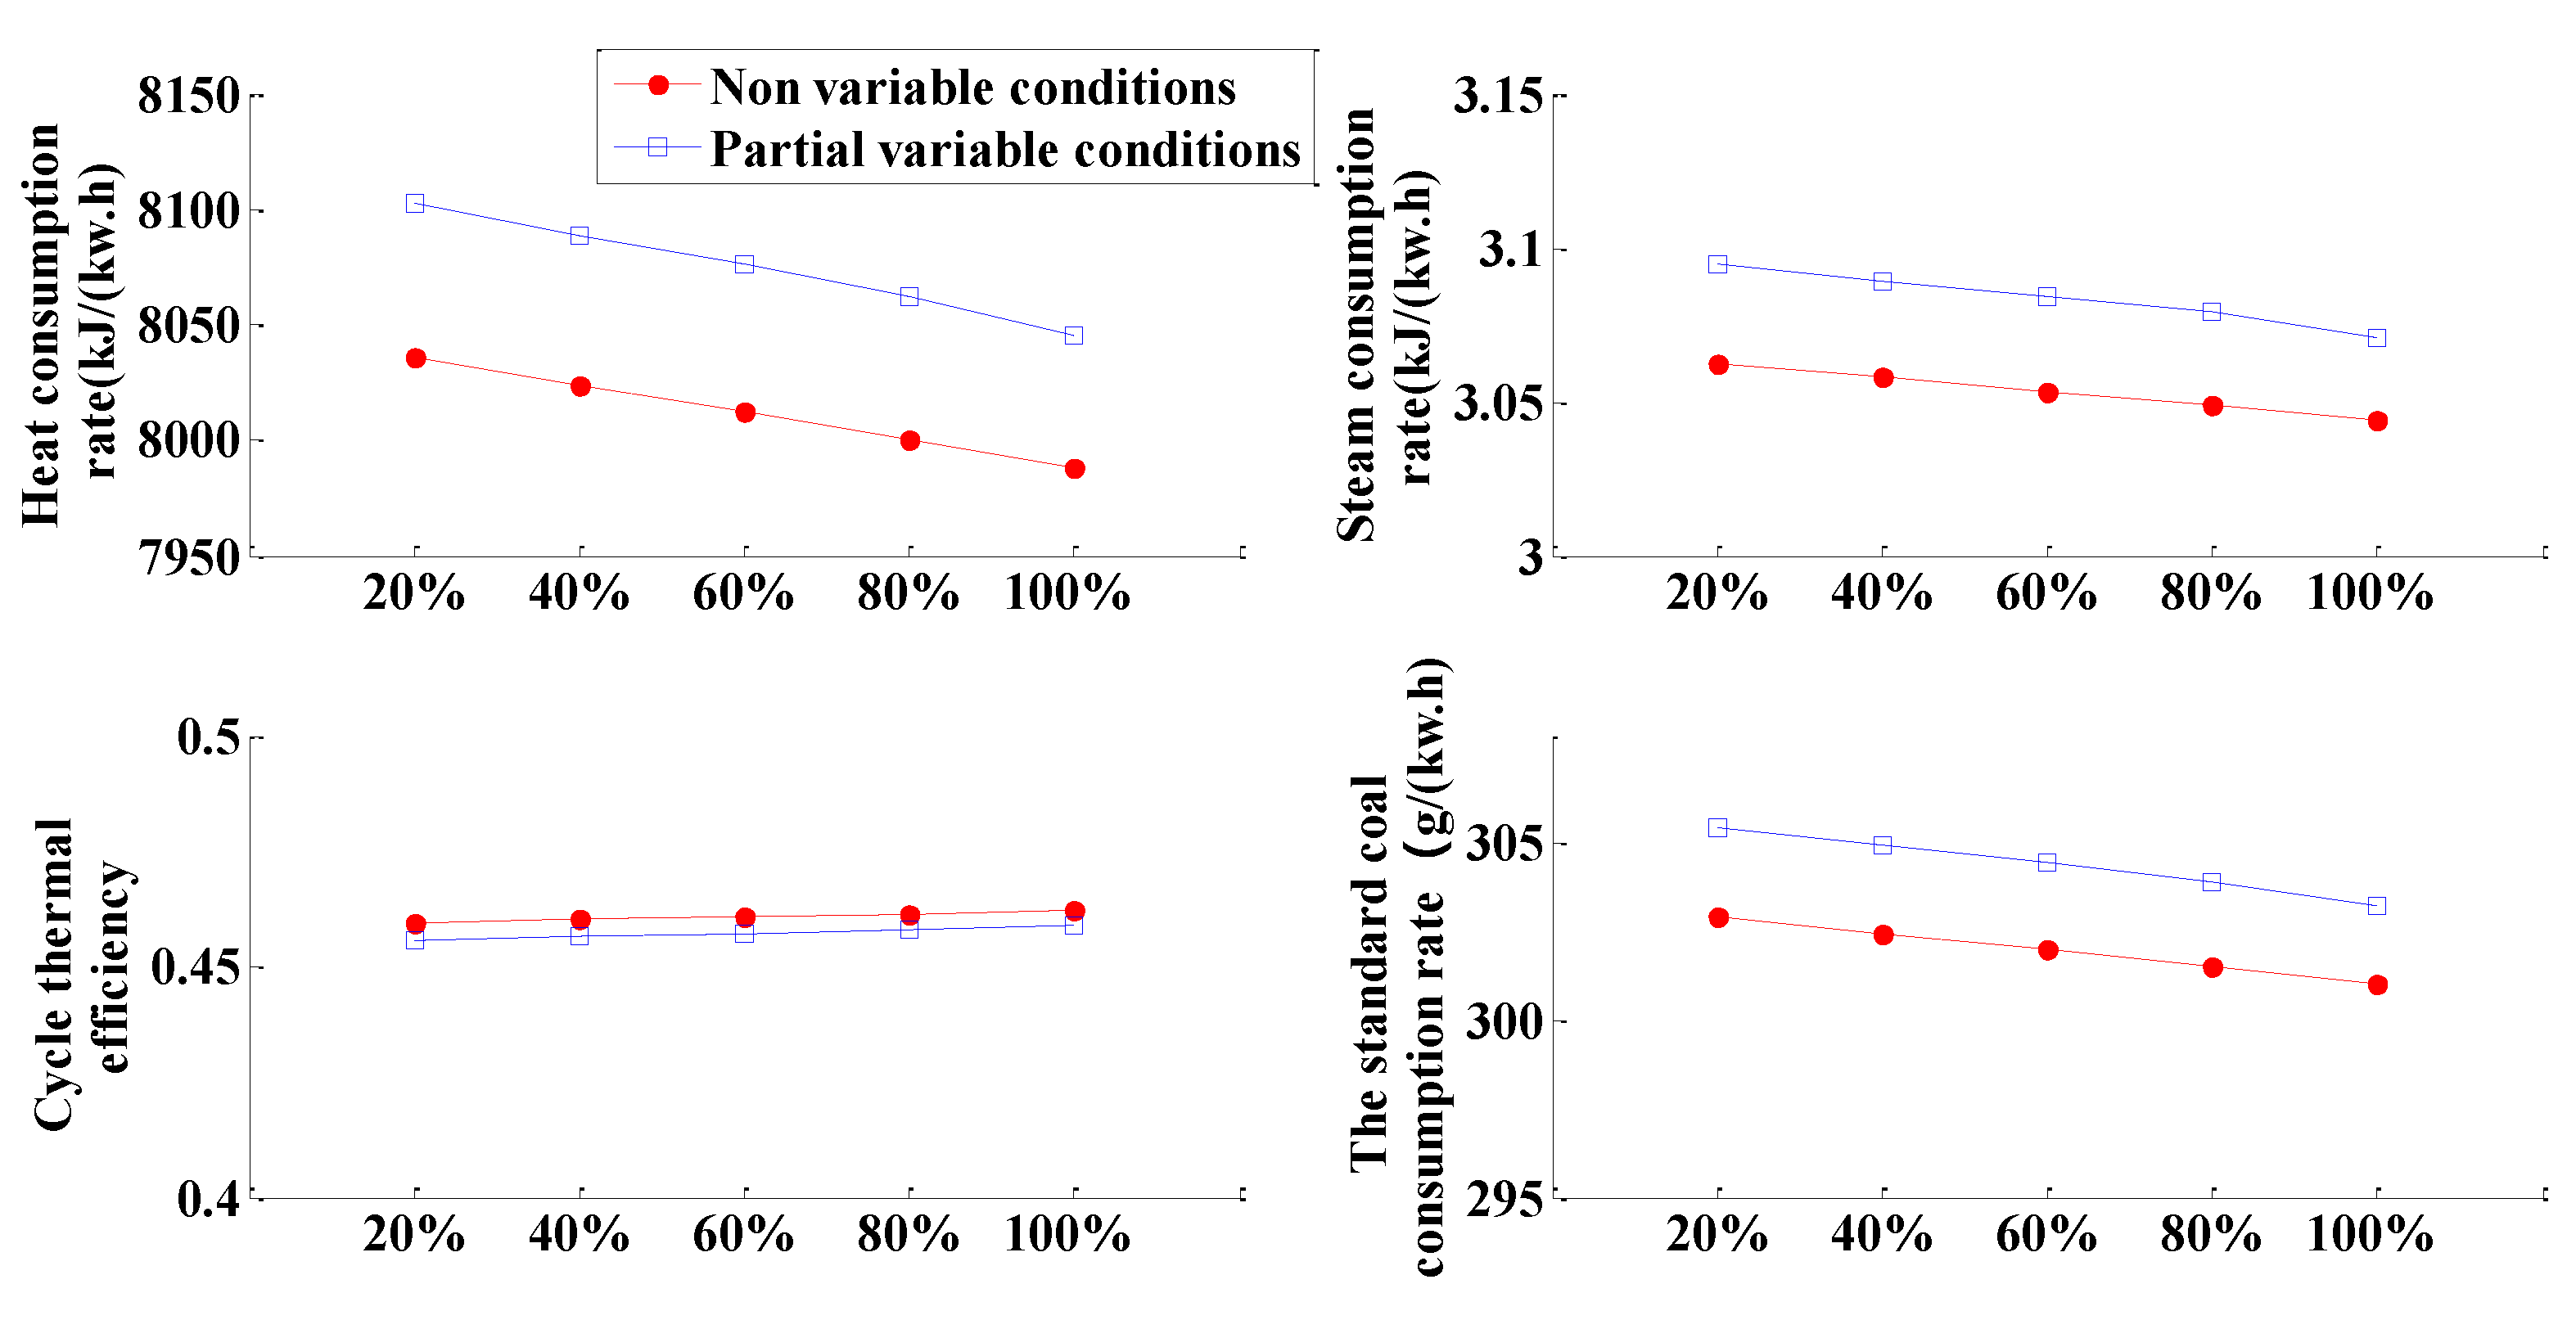
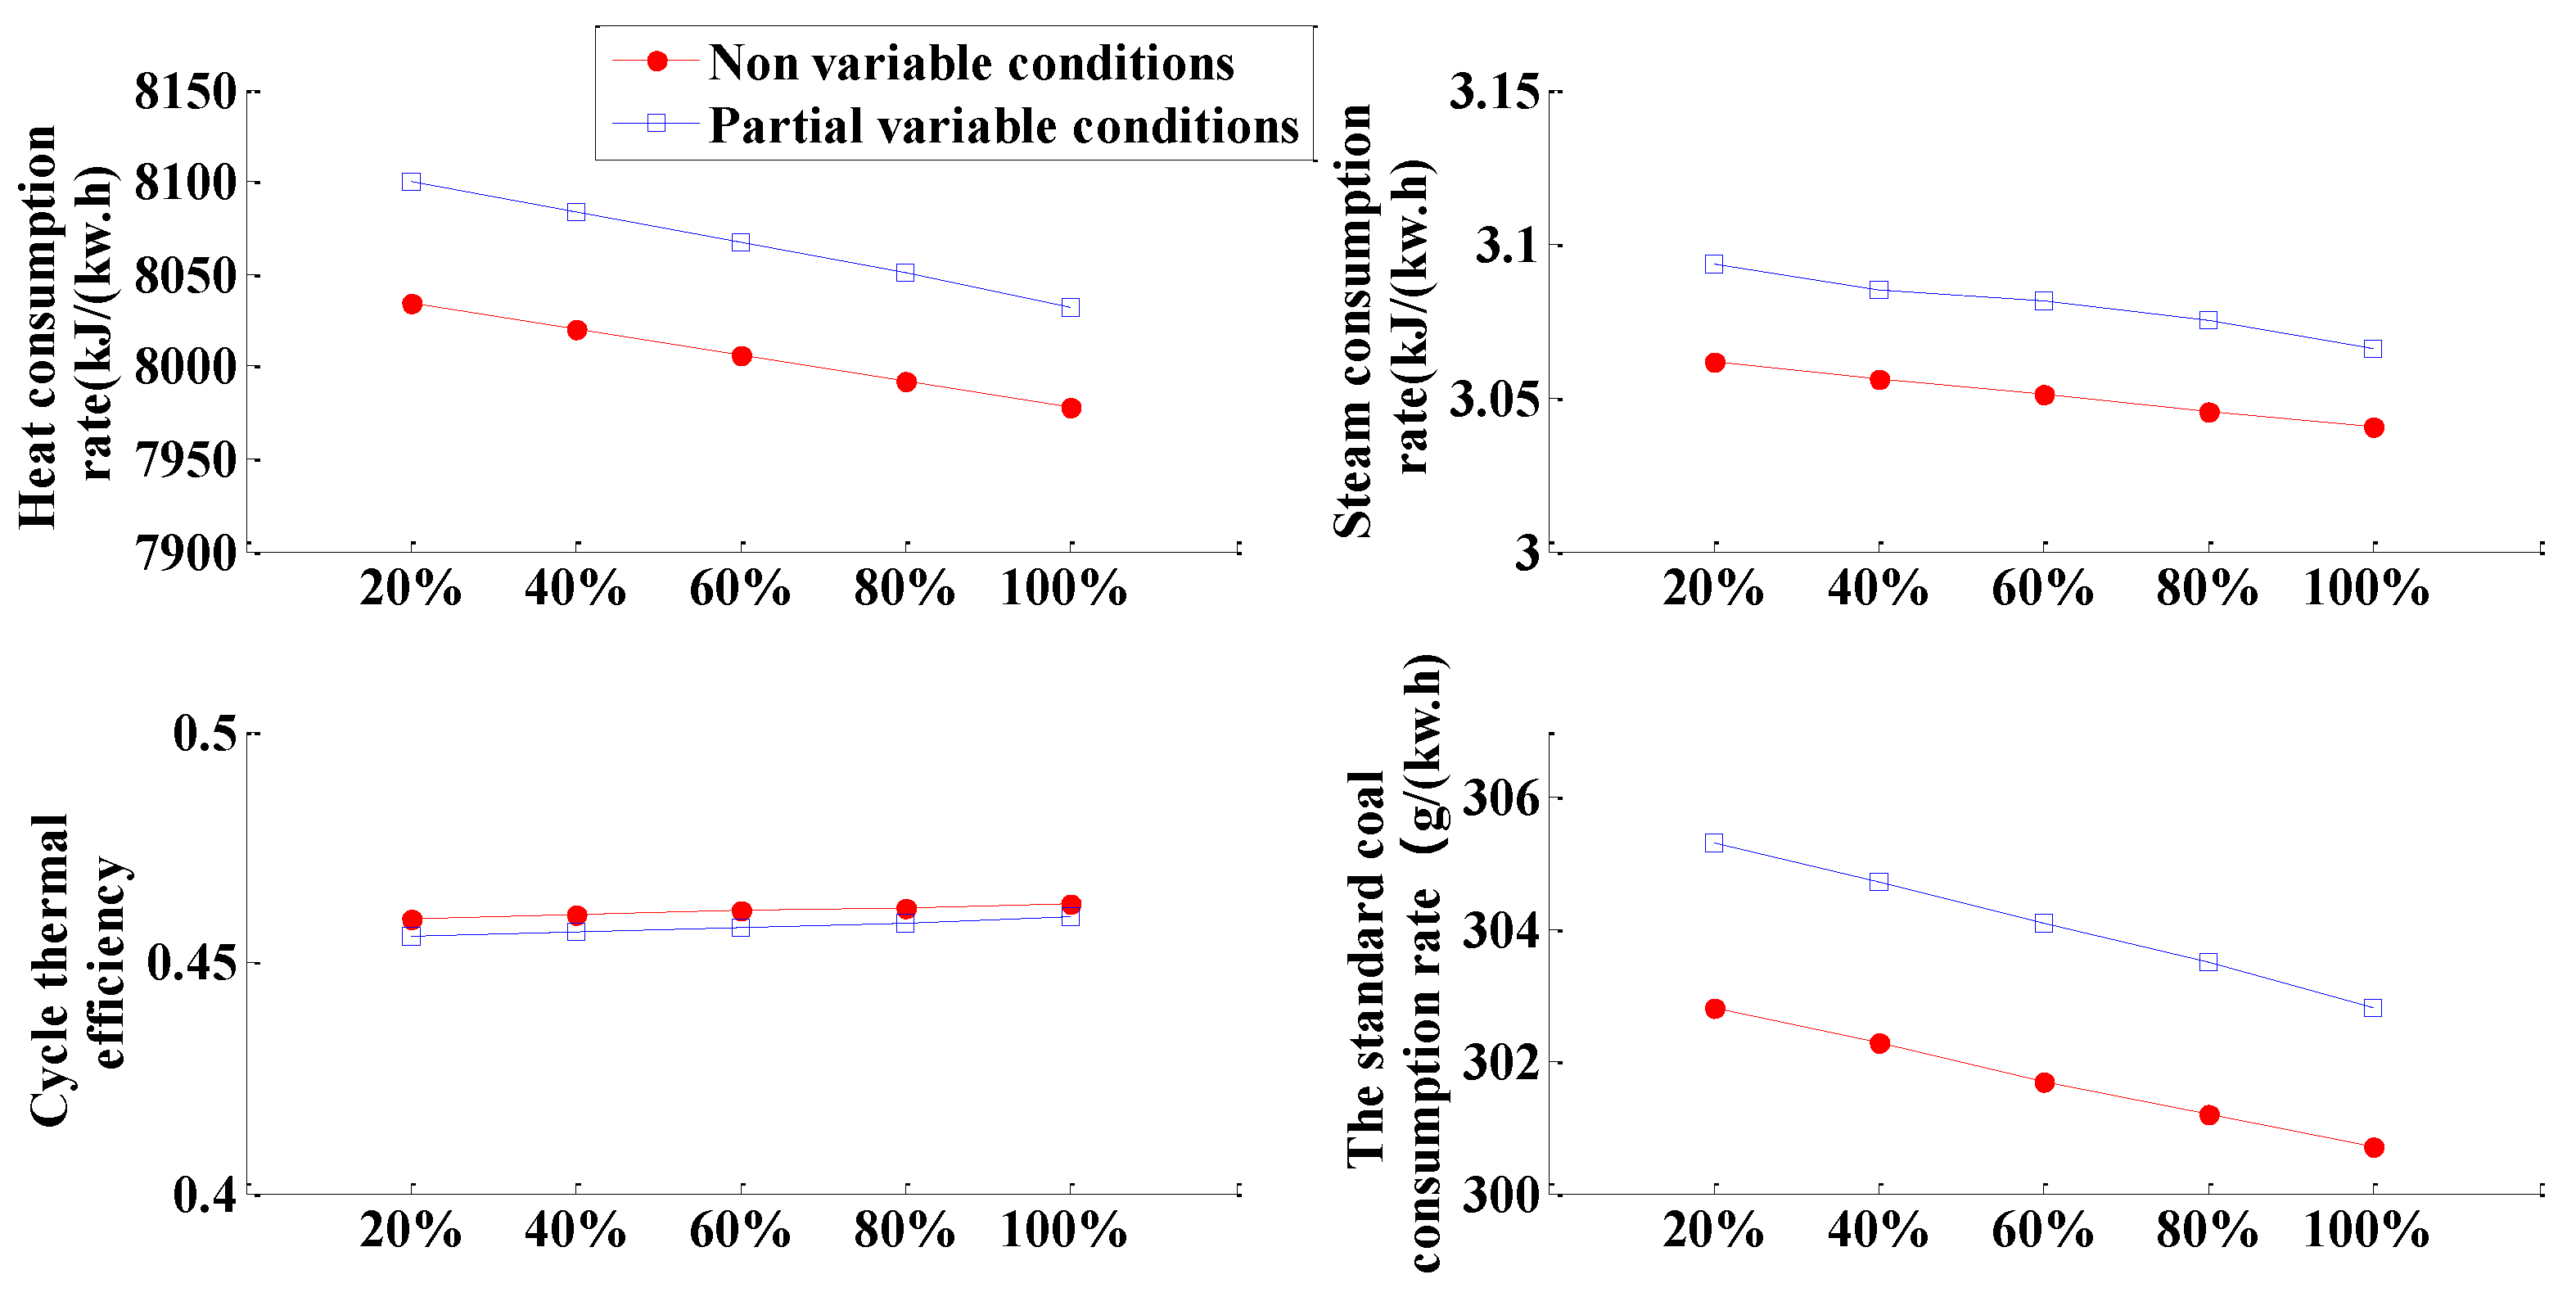
Figure 10,
Figure 11,
Figure 12,
Figure 13,
Figure 14,
Figure 15 and
Figure 16 show the percentage of steam extraction from 0 to 100%, with a step size of 20% for the solar steam substituted coal-fired units in the 1st to 7th stages. The comparison of heat consumption rate, steam consumption rate, cycle thermal efficiency, and standard coal consumption rate under partial variable condition and non-variable condition is conducted.
Table 8,
Table 9,
Table 9,
Table 10,
Table 11,
Table 12,
Table 13 and
Table 14 show the percentage of steam extraction from 0 to 100% when solar steam replaces coal-fired units steam extraction in the 1st to 7th stages. The pressure changes of turbine stage groups under partial variable and non-variable conditions are calculated.
The analysis of
Figure 10,
Figure 11,
Figure 12,
Figure 13,
Figure 14,
Figure 15 and
Figure 16 shows the following: (1) The results are compared with the original coal-fired units. When the 7th stage is replaced, the replacement steam extraction capacity is lower 80% than that of coal-fired units, and the cycle thermal efficiency is lower than that of coal-fired units. According to another formula of cycle thermal efficiency,
,
is the work done by condensing steam flow in the turbine,
is the work done by extraction steam flow in the turbine,
is the work done by leakage steam in the turbine,
is the coefficient of reheat steam,
is the specific enthalpy rise of reheat, and
is the enthalpy value of feed water. This is because, when the amount of substituted steam extraction is small, the change of steam extraction pressure is small and slightly increases, that is, the extraction enthalpy value
increases, and the drain water enthalpy value remains unchanged, so the drain water enthalpy rise remains unchanged. As a result, the amount of steam extraction
decreases and the work of steam extraction
decreases. The amount of extraction steam
decreases, so the condensate steam
increases and the condensate flow work
increases, and
remains the same. From the calculation results, the condensate flow (
) decreases compared with the original unit.
increases,
increases,
decreases, and
decreases under the action of these three; because the
reduction is greater than the
reduction, the cycle thermal efficiency
decreases. (2) The more extraction steam substituted at each stage, the higher the cycle thermal efficiency and the better the energy conservation. (3) By comparing the non-variable conditions with partial variable conditions, the thermal economy errors of the 1st to 7th stages are within the allowable range of the project. Therefore, the partial variable conditions can be used to replace the calculation of total variable conditions when the thermal economy calculation of the 1st to 7th stages is substituted for the calculation of all variable conditions.
The calculation results are shown in
Table 8,
Table 9,
Table 10,
Table 11,
Table 12,
Table 13 and
Table 14. The disturbances in power plant generally fall into two categories, that is, large disturbances and small disturbances. The large disturbance is the disturbance to the thermodynamic state of the steam turbine, which causes the redistribution of the steam flow in the system. Small disturbance refers to the flow part outside of the disturbance of steam turbine, and usually refers to the auxiliary equipment and system. Small perturbations have little influence on the thermodynamic state parameters of the through-flow part and, therefore, on the thermodynamic parameters of the whole system. It can be further assumed that small perturbations do not affect the through-flow portion of the turbine, thus the thermodynamic parameters of the other parts of the system can be greatly simplified. The parameter variation range of engineering application is within 5%, so this paper introduces the small disturbance theory to analyze the system in order to simplify the system analysis. The method of partially replacing all levels of steam extraction is used to explore what conditions are suitable for the scope of engineering application and think of it as a small disturbance. Because the solar radiation is variable, the determination of the small disturbances range can assist in the study of flux regulation when the radiation changes. The safe flow regulation range is obtained by determining the small disturbance range, which also has implications for the control of the system.
When the pressure change of the stage group is less than 5%, it can be regarded as a small disturbance, whereas, when the pressure change of the stage group is greater than 5%, it cannot be regarded as a small disturbance.
Table 8,
Table 9,
Table 10,
Table 11,
Table 12,
Table 13 and
Table 14 show that the 1st stage replacement extraction is within 20% of the stage, the 2nd stage extraction is less than 40%, the 3rd stage extraction is in the same stage of less than 80%, the 4th stage extraction is at the same level of less than 60%, the 5th stage extraction is within 80% of the native, the 6th stage extraction is in the same stage of 100%, the 7th stage to replace extraction at the corresponding stage is less than 80%. The above conditions satisfy the pressure change are less than 5% so can be considered as a small disturbance.


