Article

Simulation of Energy Exchange between Single Prosumer Residential Building and Utility Grid

1
Department of Energy Application Engineering, Institute of Technology, Estonian University of Life Sciences, 51006 Tartu, Estonia
2
CanmetENERGY Research Centre, Natural Resources Canada, 1 Haanel Drive, Ottawa, ON K1A 1M1, Canada
3
Department of Electrical Engineering and Automation, Aalto University, 02150 Espoo, Finland
4
Department of Biosystems Engineering, Institute of Technology, Estonian University of Life Sciences, 51006 Tartu, Estonia
5
Estonian Center of Industrial Mathematics, 50090 Tartu, Estonia
*
Author to whom correspondence should be addressed.
Energies 2021, 14(6), 1553; https://doi.org/10.3390/en14061553
Submission received: 10 February 2021 / Revised: 1 March 2021 / Accepted: 8 March 2021 / Published: 11 March 2021
(This article belongs to the Special Issue Power Electronics and Energy Management for Battery Storage Systems)

Abstract

:
Modern households usually have independent energy sources such as wind generators, photovoltaic (PV) panels, and similar green energy production equipment. Experts predict that soon, there will be an increasing number of such prosumers who both produce and consume energy. This process alleviates and reduces the load on large national electricity networks and also contributes to overall energy security. In this paper, a simulation model of a household, which employs a wind generator as its independent source of electricity, is developed. It is expected that this approach will be easily replicated for more complex configurations. The other components of the single prosumer microgrid that will be assessed are the non-shiftable electricity consumption equipment, which is used mainly in households and deployed separately for water heater, with a separate battery to meet the needs of these non-shiftable consumers. The 5-min data intervals for the year of simulation have been used. The characteristics of energy flow according to production and consumption schedules and the capacity of storage equipment have been modelled and simulated. Results disclose that wind turbine production size and buffer battery have a crucial impact on the demand cover factor.

1. Introduction

The European Union’s energy policy aims to achieve 32% of its total electricity production from renewable sources by 2030 [1]. Increasingly, more attention is being paid to converting energy from renewable sources such as wind and solar [2]. These natural energy sources present new challenges for electrical engineers and researchers regarding maximal extractions of energy for on-site use, and the methods of their deployment besides fossil energy sources [3]. The renewable sources are interfaced with the grid by the means of power electronic converters. Such systems are becoming widespread and getting more efficient with the developments in topologies and power semiconductor components [4,5]. In terms of national energy security, it is important to maintain enough rotating reserve because this helps to maintain the stability of the electricity grid [6,7]. Small cogeneration heat plants that are powered by biofuels can support grid stability to an extent, but the combustion of biofuels on the other hand harms the environment [8]. Hydropower is environmentally friendly and stable in 24-h cycles, although it varies from season to season [9,10].
Another important aspect of electricity use is storage. Storage is possible only at varying levels. Pumped hydropower plants can be used for large-scale electricity storage [11]. Flywheel storage [12] is also used as a storage device in smart grids, transportation and for maintaining grid stability; however, for the most part, private use remains theoretical. Europe largely supports the transition to minimize energy use in which most new buildings will consume nearly zero energy with autonomous energy production and adequate storage systems. In the past decade, microgrid-based prosumers have grown exponentially, and it is desired that these prosumers would play a more appreciable role in optimizing the operations of utility grids [13,14,15].
This article provides a simulation model of a household with a wind generator as its electricity source. The other components of microgrid under review are so-called non-shiftable equipment for electricity consumption, which are used in every home. We consider these appliances and household equipment, known as “non-shiftable” (NS) consumption, in the energy scheme and simulation experiments. Water consumption and water tank as storage are evaluated separately in the model because of the requirement for domestic water to be preheated before use. The final component of the energy scheme within the microgrid or household is a separate battery that ensures that the needs of NS consumers are best met and which can store as much energy as possible when it is produced by the wind generator.
Conventionally, energy consumed in households emanates from either the wind generator [16] or the utility grid. To attain self-sufficiency, i.e., where electricity generated locally matches local consumption, it is necessary to find an optimal combination of installed electricity production units, and storage buffers to mitigate the volatility of the primary energy carrier such as wind or solar irradiation [2]. The present study introduces a buffer battery (BB), which stands between the microgrid and utility grid. BB belongs to the household as material equipment but is virtually considered as energy, being one of the stores for the energy produced by the wind generator. The energy from the wind generator that is not consumed in the microgrid during the observation period is loaded there. If necessary, the energy needed for consumption in the microgrid is also provided from BB. The energy that cannot be contained in the BB is transmitted to the utility grid. It is, thus, possible that the energy consumed in the household can come from either wind generator, buffer or grid.
Cover factor augmentation is indirectly assessed by certain authors. An overview [17] describes loss minimization and power quality in distributed grids and sets as objective the decrease in active losses in batteries. Vanhoudt et al. [18] studied the possibility of increasing self-consumption by heat pump, which is indirectly related to energy storage. By comparing different renewable electricity sources, they found that the wind generator’s yield is better compared to photovoltaic (PV) panels. Naval et al. [2] modelled the versatility of electricity sources and related real-time electricity prices, with the wind as one of the most suitable primary energy carriers. The combination of wind and solar generation in a microgrid was studied in [17,19]. For a net-zero energy (NZE) hybrid microgrid, combined wind/solar generation with intermediate storage was analyzed using the HOMER Pro software (Homer Energy LLC, Boulder, USA) )suite [20]. A major disadvantage of this software is the 1-h or longer averaging period that it requires. Therefore, a less granular, self-developed MATLAB (The MathWorks, Inc., Kista, Sweden )model with an averaging period of 5 min was applied in this current research.
The cover factor is an indicator of load-shifting technology and is meant to handle volatile primary energy carriers such as wind and sunlight, by deploying intermediate storage devices [21,22,23,24,25,26]. In addition to shifting, Eltanay et al. [23] prioritized loads by dividing them into two major groups. In some sources, it is described as load matching index (LMI) or load generation matching index (LGMI) [27,28]. In [29] the optimal storage capacity for full ride-throughs was discussed. Households require power supplies from the largest possible number of renewable sources to reduce payoff times [2,30]. Increasing self-consumption not only levels load peaks [31] but also decreases costs on the electrical energy import to an economically feasible point of 60% self-consumption level [32].
The numerous studies described above indicate the increasing attention to the subject of the microgrid. However, despite this proliferation of studies trying to solve and predict the energy exchange between prosumer residential building and utility grid, to the authors’ knowledge, there is still insufficient research into or investigation on optimal system design of a microgrid system in terms of wind turbine and buffer battery sizes effects on the system performance and demand cover factor. The main novelty of this work is using a buffer battery between of microgrid and utility grid to increasing of self-consumption. It is not yet met in the scientific literature.
Hence, the main goal of this work is to simulate and establish setup configurations of BB between microgrid and utility grid to increase self-consumption of the prosumer. It is important to note that for evaluation of effectiveness and distinguishing of these configurations, a new cover factor was introduced and used. The microgrid parameters were also set. The approach can easily be generalized and replicated in more complex configurations. Modelling and numerical experiments were carried out in a MATLAB environment.
With these objectives in mind, the remaining article is structured as follows: Section 2 describes the configuration of the modelled household. Section 3 gives an overview of the initial data that are used in simulation experiments. Section 4 describes the simulation setup, while Section 5 presents the main results. Finally, the main conclusions drawn in this work are provided in Section 6.

2. System Setup

On the base of our computer simulation is a typical private household with an additional buffer battery (BB) between the local microgrid and the utility grid. The term microgrid refers to an electrical installation, which comprises local electricity generation, loads, storage and utility grid connection by default [33].
In Figure 1, the system setup consists of two scenarios. In the first, the microgrid is connected to the utility grid Figure 1a and the energy change between microgrid (MG) and utility grid (UG) is direct and bidirectional. In Figure 1a, Arrow A denotes energy acquired from UG, while Arrow B means excess energy produced by wind generator (WG) and sold to UG. In the second scenario, the microgrid has external buffer battery (BB) storage attached Figure 1b. In Figure 1b, Arrow C means the most expensive energy acquired from UG for a house owner. Arrow D denotes energy, which is taken back to MG and this is free for a homeowner as it was earlier saved to BB (Arrow E), produced by a wind generator, and leftover from household consumption. Arrow F indicates the possibility that wind generator works well and some energy goes to UG. Figure 2 presents MG. All processes are driven by the load controller.
The microgrid described in this work can be connected to the energy hub. An energy hub is considered a unit where multiple energy carriers can be converted, conditioned, and stored [34]. It is to be noted that this microgrid output is very stochastic and has the best cooperation with the UG. Through the UG there is also a possible connection with other energy carriers.

3. Input Data

As input data, a time series of production of the WG which is scaled to rated power Pnom = 5 kW, manufactured by TUGE Ltd (TUGE Ltd., Paldiski, Estonia) [35] was used. It is located in a coastal area with coordinates N 59.087694, E 23.591719. The dataset collected covers the period from 1 December 2015 to 30 November 2016, taking into consideration that December is the first winter month, and facilitating further seasonal analysis. The average WG power output is derived by dividing the electricity generated during the last sampling period by the length of the sample period Δt. In the actual research, Δt = 5 min, and a year is divided into intervals of 5 min in length. Raw consumption data is measured at a frequency of 4 times per second with the network analyzer—Chauvin Arnaux (Chauvin Arnaux Metrix, Paris, France). Unfortunately, raw data have not survived. After the measurement, raw data have been averaged to 10 s of time series data. In the next step, data were converted to 5 min averaged interval data. Production data was processed from the 5 min averaging interval. Generation and loads are sampled equally.
Figure 3 shows the data for one week in December 2015 in 5 min periods of energy units. Battery and WH capacities are considered usable net values. Adding supercapacitors as levelling elements to decrease excess power from wind generator to batteries in our case is not used because of the small probability to increase maximum power allowed to batteries. Energy-related parameters such as WH temperature are not appraised, and neither is the energy necessary to reach WH minimal temperature of 55 °C, to avoid proliferating Legionella bacteria [36]. Operating temperature is assumed to have been attained, and the state-of-charge charge/discharge dependency is neglected.
The annual output of the WG is scaled to match the annual load as closely as possible. A typical private household’s load pattern is considered with non-shiftable (NS) and hot water production (B) parts. The recorded annual electricity consumption was 3473 kWh, 47% (1632 kWh) being allocated to NS, and 53% (1841 kWh) to B, based on real measurement data [37]. We aimed to test the developed model and algorithm from our measured data. The Nordic climate conditions in Estonia are very changeable and even harsh given the very cold weather conditions in winter. Climate conditions are also accompanied by consumption data.

4. Simulation Model

In our simulation model, we first consider the control of energy flows in the power supply system of a private house that is sourced from a wind generator and that also has access to a utility grid. In Figure 2 we see the configuration of the microgrid (MG). The load controller in the center regulates sharing of energy produced by the generator.
This model has been created based on the principle that has been introduced in the sources [18,38]. This model belongs to multi-period multiple time scales over the year type [39]. In selecting wind turbine production data, we have based our analysis on one-year data with average wind conditions. Thus, the results of the simulation do not reflect the results for the different years to be taken into account when using outputs. This methodology does not command forecasting or economic issues [40]. These topics are planned in the following studies.
The sharing algorithm in every time interval is as follows [41], the variables denote (all in kWh):
  • X1: is the output energy of wind generator in the current interval.
  • X2: is the energy stored in a battery in the current interval.
  • Z1: is the energy needed for NS consumption in the current interval.
  • Z2: is the energy needed for hot water equipment in the current interval.
The simulation algorithm is delineated as follows:
(1)
Next time interval is opened. Main action—the rest of the energies from previous intervals is transferred to the current one.
(2)
WG output X1 first satisfies NS loads Z1.
(3)
If X1 > Z1, the quantity X1Z1 forwarded to WH. Steps 4 and 5 are skipped.
(4)
If X1 < Z1, the quantity Z1X1 is taken from the battery, if possible, i.e., if Z1X1 < X2. Otherwise, missing energy comes from UG.
(5)
Energy Z2 is taken from a battery or UG.
(6)
Energy movements saved.
If the process does not require all the energy produced in the current time interval, the excess will move to the battery, and if there is still more energy left after that, it will go to the utility grid.
For evaluation of effectiveness and distinguishing these configurations and energy flows, this paper introduced and used a new cover factor. In literature, one can find several forms of cover factors. In our numerical experiments, expressed in detail below, the following formula was applied:
YD = (W1 + W2 + W3 + W4)/Wtotal
where:
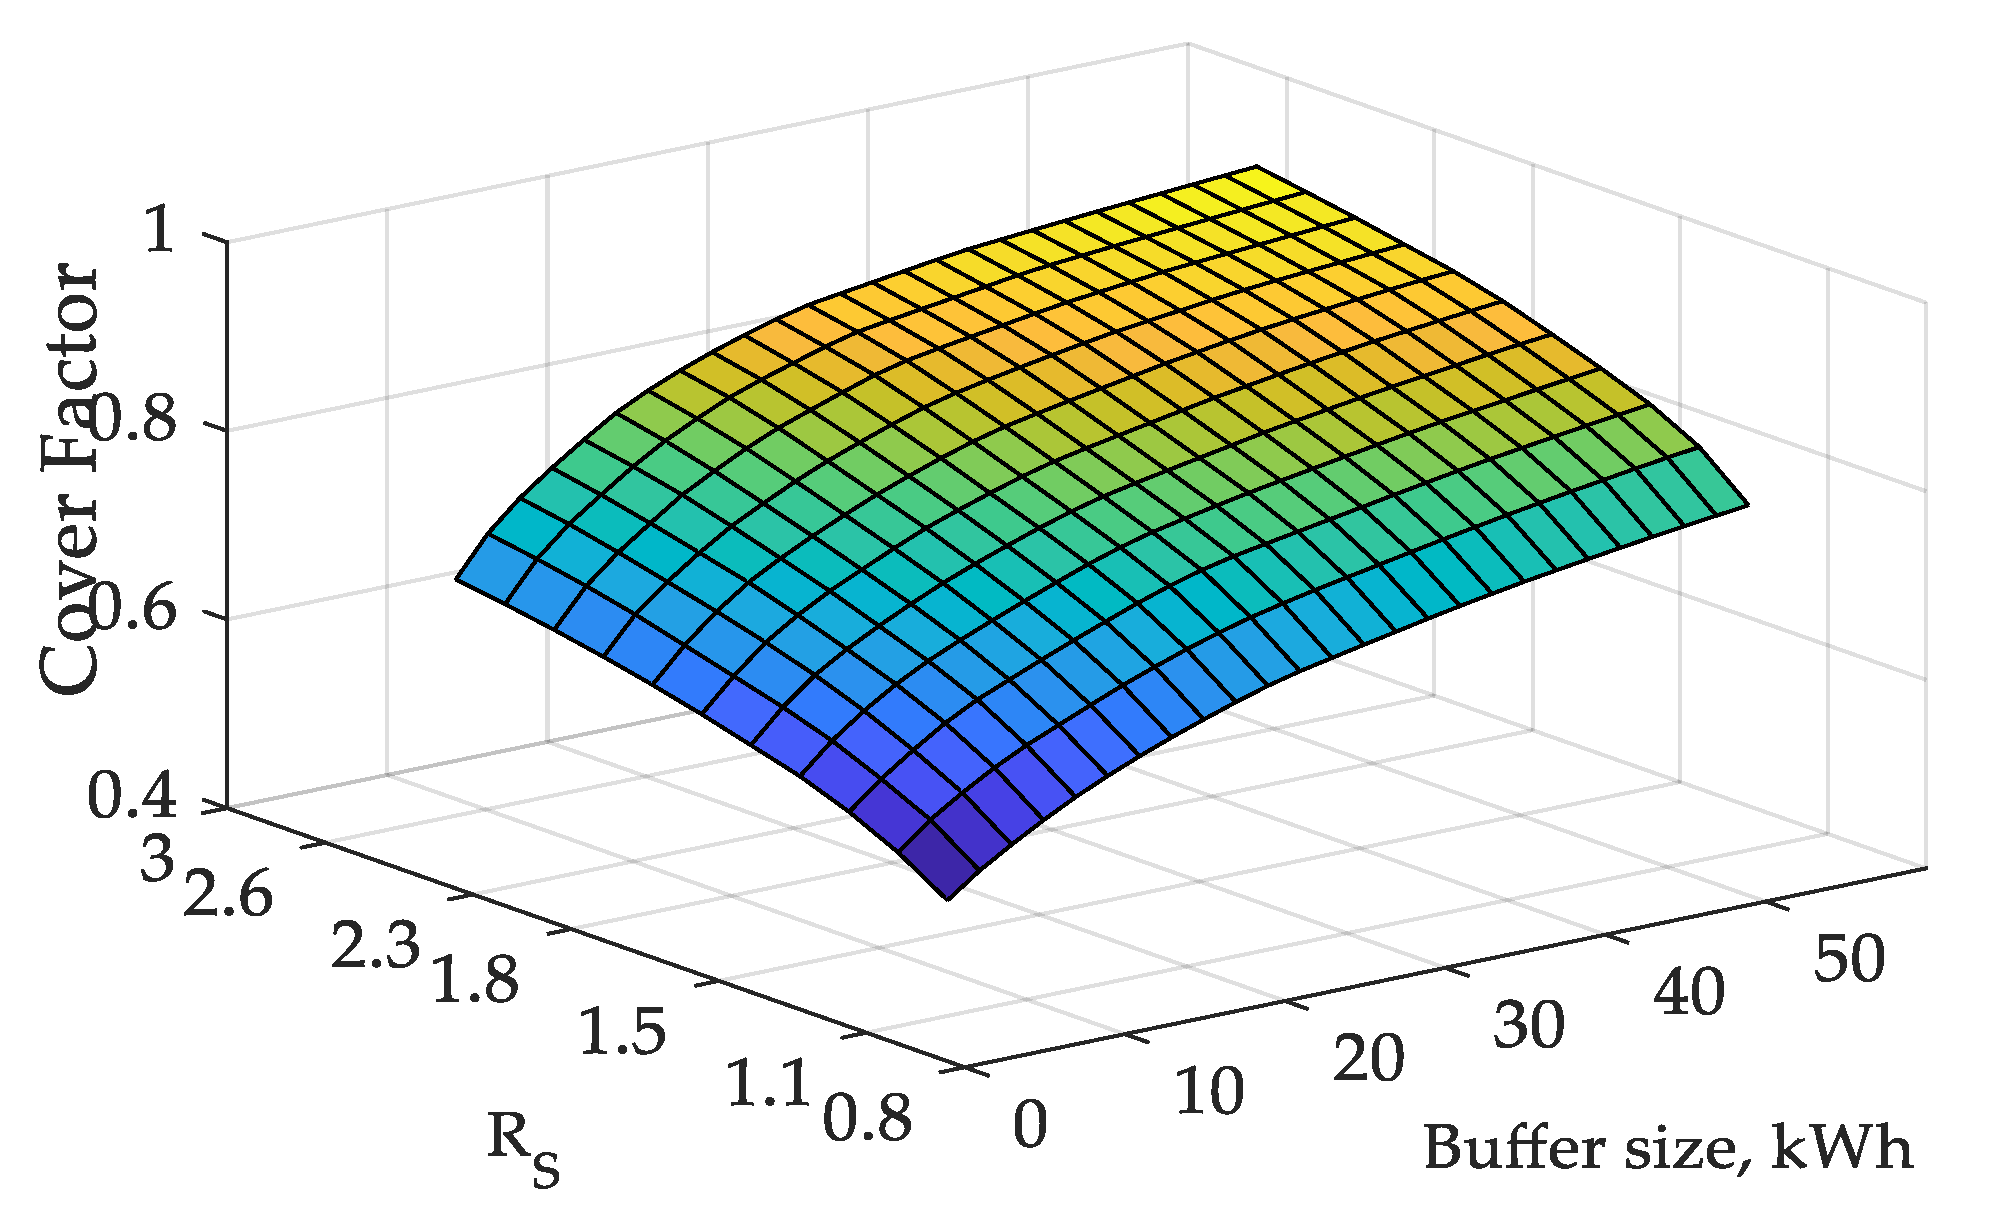
  • YD is the demand cover factor.
  • W1 is the total annual amount of energy produced by WG, which is directly consumed by NS devices needs.
  • W2 is the total annual amount of energy produced by WG, which is used with hot water consumption from WH.
  • W3 is the total annual amount of energy produced by WG, which is used for NS consumption from the battery during the year. If the WG is unable to supply directly to NS load, the missing energy will be taken from the battery.
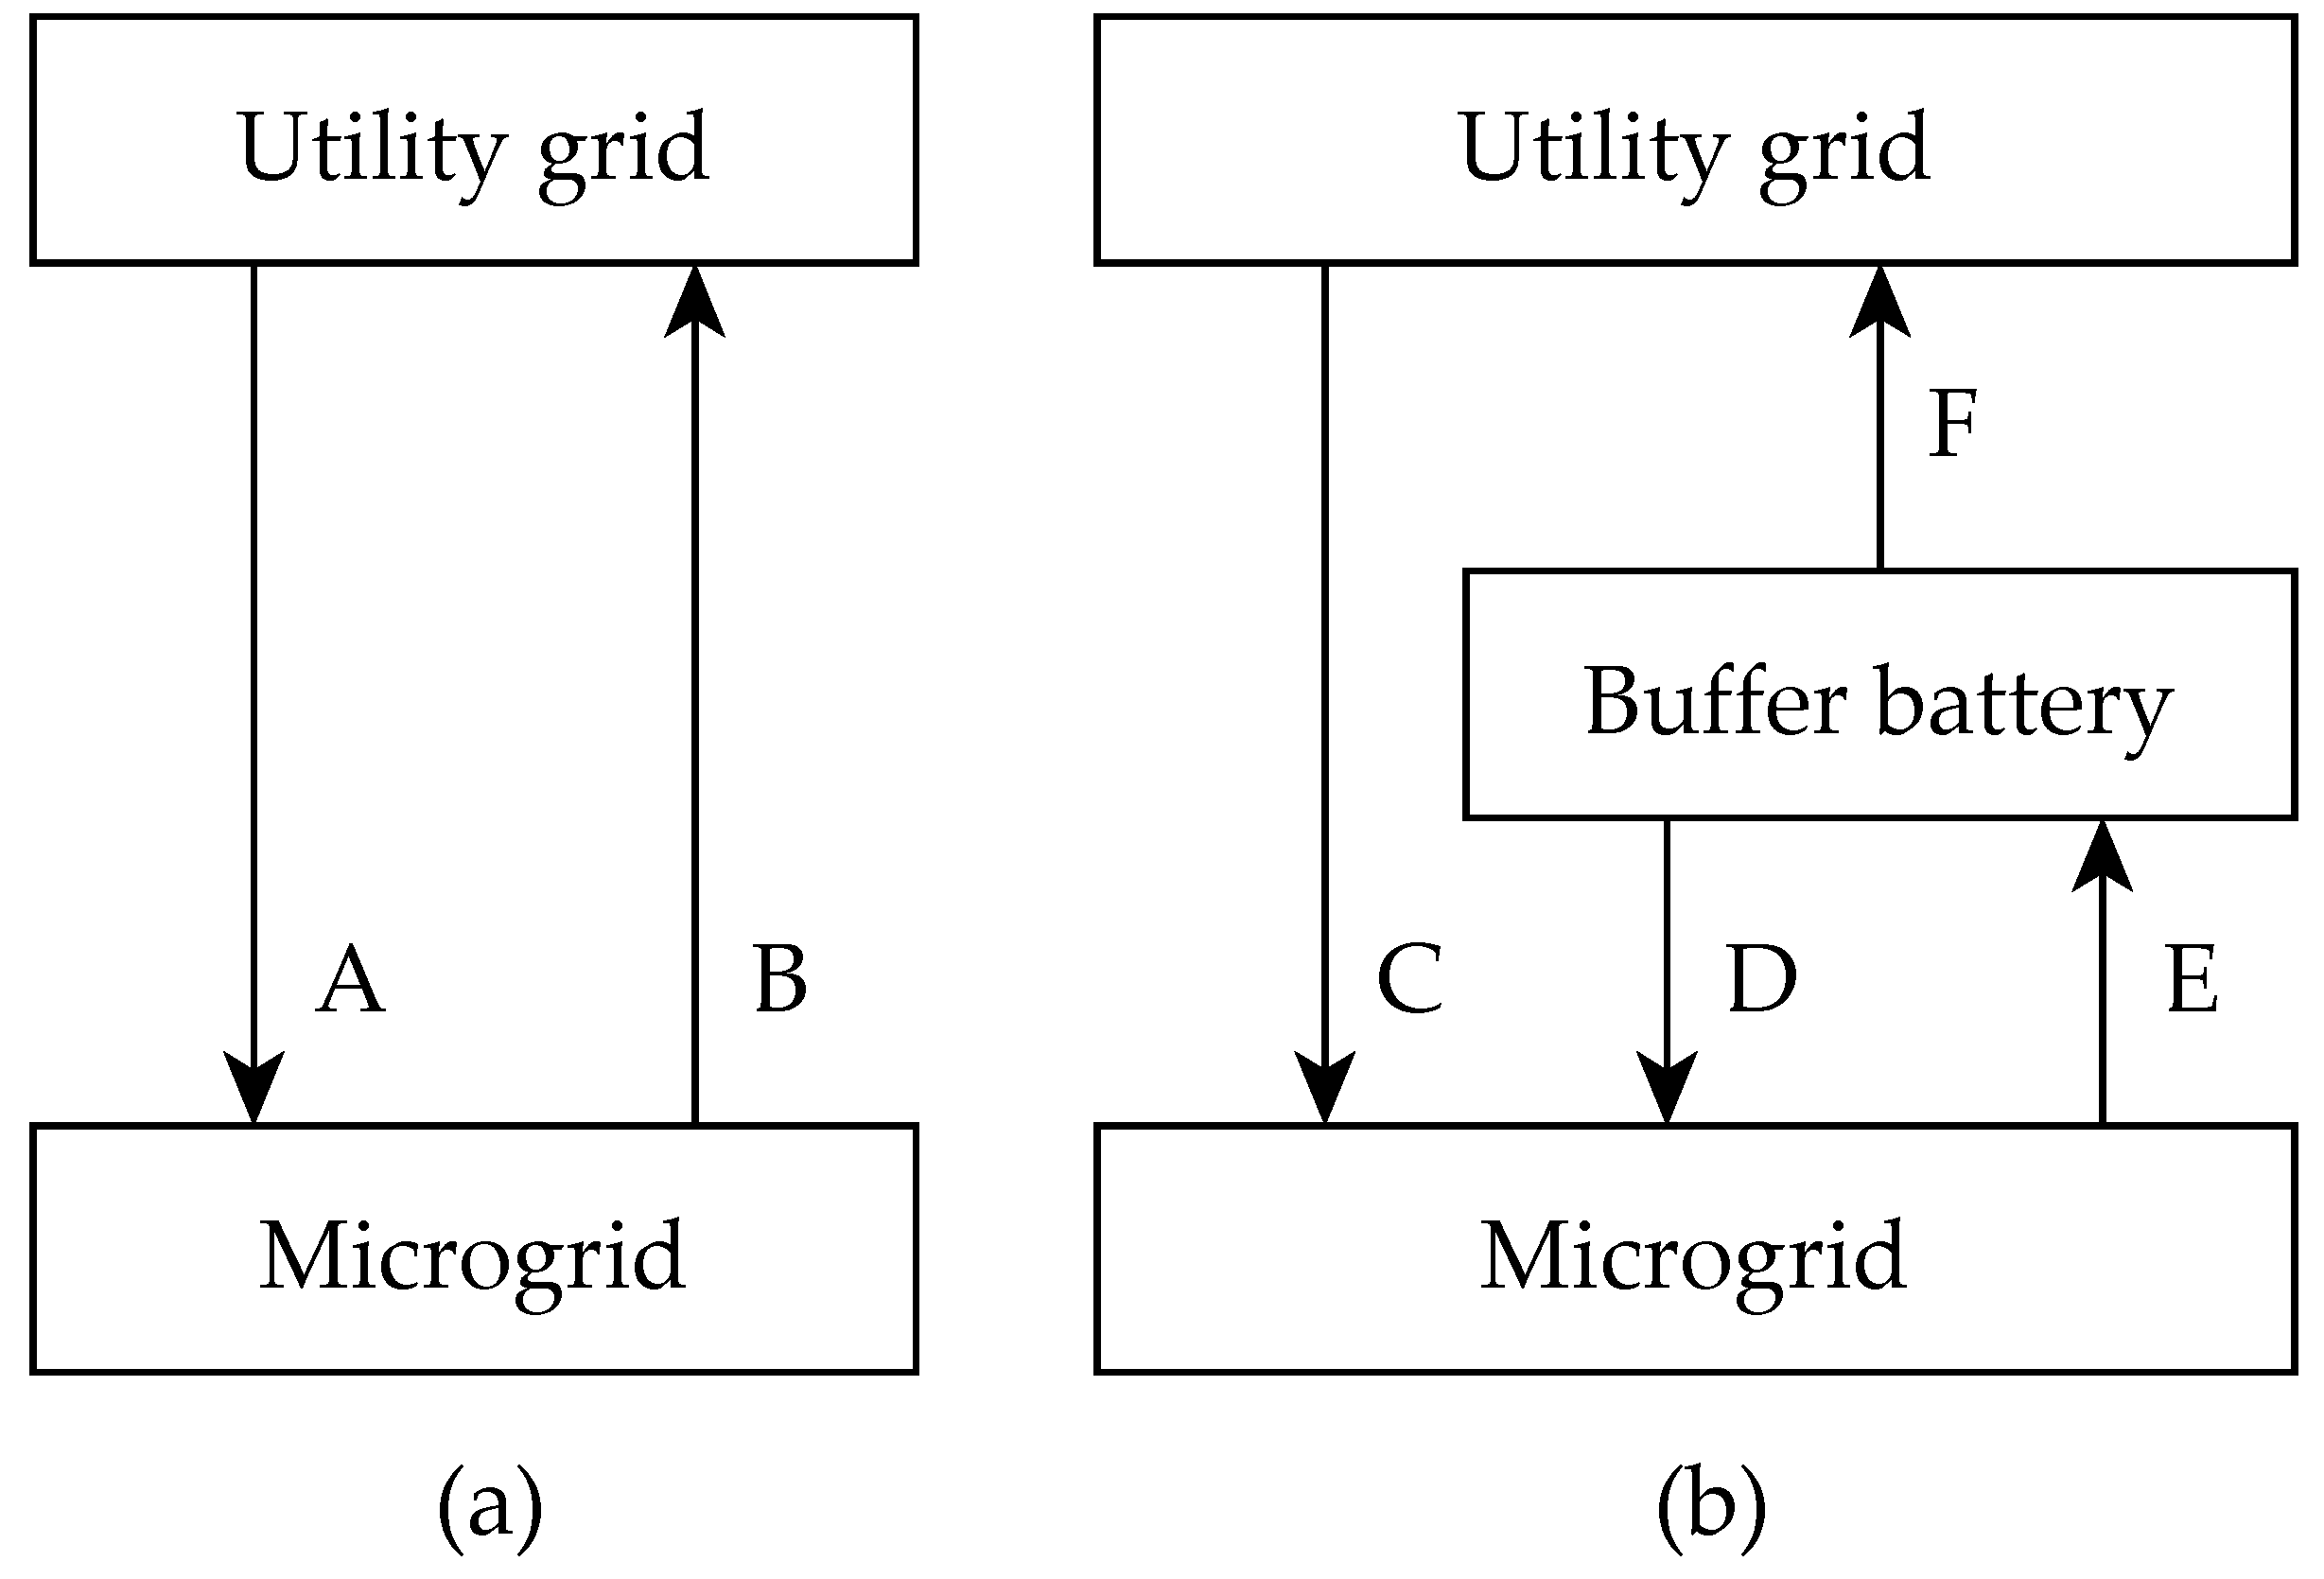
  • W4 is the total annual amount of energy flowing back from BB to MG. This is if there is not enough power in the battery and WH, then the energy is taken from BB. This is new in this paper. The flow is depicted as Arrow D in Figure 1b and is decisive for finding the new demand cover factor value YD. If there is not enough energy in BB, it is taken directly from UG Arrow C on Figure 1b.
  • Wtotal is the total annual amount of energy consumed for water heating and non-shiftable load, in other words, the total energy consumption of the entire household.
The cover factor, shortly, is the ratio of energy produced by the wind generator, which is consumed in the household under consideration. It is easy to see that the following inequalities hold:
0 ≤ YD ≤ 1
Indeed, YD = 0 only when the wind generator exceptionally does not produce anything during the year. Denote with W the total annual amount of energy produced by the wind generator. For batteries in microgrid and BB, one can only load energy from a wind generator. It means that energy flow through Arrow E on Figure 1b can be only from the wind generator. The same holds for Arrow D and the same fact is true for MG battery. YD has no unit.
We have, therefore, the following expression:
W1 + W2 + W3 + W4 ≤ W
Because the energy amounts W1, W2, W3, and W4 used for microgrid consumption loads are produced by the same WG during the year. Mention that the initial conditions for energy in storage devices are set to zero in simulations. As the consumption from WG cannot exceed the total consumption inside MG then:
W1 + W2 + W3 + W4Wtotal
The last inequality holds because the total consumption load Wtotal may contain a part of energy acquired from the utility grid as we see from Steps 4 and 5 of the algorithm. According to the definition based on Equation (1) of cover factor YD, calculation from Equation (4) concludes that YD ≤ 1. Therefore, the inequalities in Equation (2) are proved.
The microgrid solution we offer, together with the BB between MG and UG, is subject to certain limitations. This solution is designed to meet the needs of a private house as it is detailed in the above described methodology. This system is built on the principle that the uncertain parameters of the WG output power are grounded in storage devices such as WH and batteries. The present approach adopted in this work is mainly focused on component- and system-level design approaches rather than taking system parameter uncertainty modelling as done by the source [42] or by using robust optimal energy management [40]. There is no way to include electric car chargers in this system, nor, for example, fast boilers. To do this, the microgrid must be built differently, given the larger instant consumer power.

5. Results and Discussions

To achieve the goals of this work, computer simulations were carried out. The whole energy system of the household Figure 1 and Figure 2 is inserted into a simulation model with linear charge and discharge characteristics. The input variables for the model are the year-long time series of wind generator output; non-shiftable loads; hot water consumption. The length of all three time series is 105, 120 and this is also the number of time intervals we used.
To estimate the coincidence between generation and load, the cover factor described by Equation (1) is applied. Cover factor YD characterizes the local generation/demand ratio. The simulation is based upon flow charts in Figure 1.
Based on Figure 4, the values of microgrid equipment parameters for numerical simulation experiments have been fixed. Because of practical considerations and expert assessment, the capacitance values of both the microgrid battery and WH are chosen to be 6 kWh. In future work, we intend to find a numerical method for the quantitative evaluation of these values and estimation of cover factor YD increments.
In the next stage of the simulation experiment, the amplification coefficient RS was introduced to find the dependence in wind generator production of energy flow from microgrid through BB to utility grid Arrow F in Figure 1b and vice versa Arrow A in Figure 1a. The amplification coefficient (RS) is the ratio of the energy produced per year by the wind generator to the energy consumed in the microgrid. With different values of coefficient RS, the output of the wind generator is multiplied. Figure 4 depicts energy flows, where RS varies between 0.8 and 3. At the crossing point or collocation point of two lines, RS = 1, (it means the original production time series), the absorbed and injected energy become equal. Further increase of RS results in a linearly growing part of generated electricity fed into the utility grid. The energy, absorbed from the UG, is characterized by a slightly falling line.
In equilibrium Figure 5, the exported and imported energy equal both 1401 kWh, with YD being = 0.597. Even a minor wind generator over-leverage results in significantly more electricity being injected into the utility grid.
The next experiment examines the dependency of energy flows from the buffer battery size. Figure 6 shows the direct energy flow from grid to MG Figure 1b, Arrow C. Figure 6 depicts the electricity flow back from BB to MG Figure 1b Arrow D. Considering BB size 10 kWh in Figure 5, the grid-to-microgrid energy is equal to 1180 kWh, while BB-to-microgrid energy becomes equal to 221 kWh Figure 6. These two numbers sum up as 1401 kWh, which is valid for the “bufferless” case Figure 5. The same approach can be applied to other RS and BB values.
Figure 6 shows direct energy flow from UG to MG Figure 1b, (C). Figure 7 depicts the electricity flowing back from BB to MG Figure 1b (D). Considering BB size 10 kWh Figure 5 the grid-to-microgrid energy is equal to 1180 kWh, while BB-to-microgrid energy becomes equal to 221 kWh Figure 5. These two numbers sum up as 1.401 kWh, which is valid for bufferless operation Figure 4. The same approach applies to other RS and BB values as well. In Figure 7, energy amounts are in the y-axis on the Formula 2 fraction line the fourth member W4.
Figure 8 depicts the energy flow from BB to UG. If RS = 1 when moving to UG energy amount is 1164 kWh, which is nearly equal to MG entering energy flow, that is 1180 kWh, as in Figure 5. It was found that this difference is not decisive. The small difference is caused by RS = 1 overproduction of 100 kWh from consumption, which is due to scaling conditions.
Increasing RS moves all residual energy to UG, as seen in Figure 8. In Figure 9, it can be seen dependence from BB size to cover factor by different RS. The reasonable capacity of BB is 10 kWh. If BB = 0 when by RS = 1 is YD = 0.597 and by BB = 10 kWh YD = 0.66. If we have RS = 2, when YD = 0.796. As seen in Figure 9, the cover factor increase occurs when RS is much bigger than the BB size, but BB size multiplies RS influence.
Based on Figure 9, results reveal that both, the BB and RS have an obvious influence on the demand cover factor. This suggests that the greater capacity factor of WG causes an additional increment in YD.

6. Conclusions

This paper developed and presented a simulation model of energy flows to investigate the self-consumption of a household with a wind generator as its independent source of electricity. The main assessment parameter is the demand cover factor (1). As input data, time series of typical private household load patterns with non-shiftable (NS) and hot water consumption (B) parts Figure 3, as well as the time series of production of the wind generator (WG) with rated power Pnom = 5 kW, were used. This simulation approach is easily generalized/replicated in more complex configurations of households, and also for different individual places such as warehouses, industrial buildings, etc. By increasing local consumption from renewable energy sources, energy losses in the utility grid and greenhouse gas emissions are reduced.
The study demonstrated that a buffer battery introduced between the utility grid and household inner microgrid has a notably positive influence on the demand cover factor. As a result, it is possible to reduce the amount of energy purchased from the utility grid, as seen in Figure 6 and Figure 7. Figure 6 shows that if BB = 10 kWh, RS = 1, is purchased from UG to MG 1180 kWh. If RS = 2 and BB= 10 kWh, we only need to buy 701 kWh of electricity from UG. Wind turbine oversizing is reasonable based on these calculations, as wind production varies greatly over the years. Figure 7 shows the amounts showing how much less electricity we buy from UG compared to BB = 0.
It was proved that the production of the wind turbine is crucial for the value of the demand cover factor. To demonstrate this, the amplification coefficient RS was introduced to find the dependency of wind generator production of energy flow from microgrid to the utility grid and vice versa. Figure 9 shows that compared to the baseline situation as RS = 1 and BB = 0 YD = 0.597 then in a situation where RS = 2 and BB = 10 kWh are YD = 0.796. This is a significant increase.
Moreover, the amplification coefficient RS affects the cover factor only when applied to wind generator production. Numerical experiments showed that when applied to consumption data, the change is marginal.
Future research may focus on the WG production forecast and economic factors and parameters, which should be included in real simulation models.

Author Contributions

A.A. supervised the work and prepared the original research; W.Y. and M.L. provided the support in formulating the simulation problem; R.I. and T.K. draft preparation and evaluation of manuscript; P.M. conceptualization and MATLAB simulation. All authors have read and agreed to the published version of the manuscript.

Funding

This research was funded by the Estonian Centre of Excellence in Zero Energy and Resource Efficient Smart Buildings supported this research and Districts, ZEBE, grant TK146 funded by the European Regional Development Fund.

Acknowledgments

The authors would like to thank Tuge Energia Ltd., for making the data of the 10 kW wind generators available, Alo Allik for consumption data for this study and the Estonian Centre of Excellence in Zero Energy and Resource Efficient Smart Buildings and Districts, ZEBE, grant TK146 funded by the European Regional Development Fund supported this research.

Conflicts of Interest

The authors declare no conflict of interest.

References

  1. Energy Efficiency Directive. Available online: https://ec.europa.eu/energy/topics/energy-efficiency/targets-directive-and-rules/energy-efficiency-directive_en strategy (accessed on 10 January 2021).
  2. Naval, N.; Sánchez, R.; Yusta, J.M. A virtual power plant optimal dispatch model with large and small-scale distributed renewable generation. Renew. Energy 2020, 151, 57–69. [Google Scholar] [CrossRef]
  3. Annuk, A.; Jõgi, E.; Hovi, M.; Märss, M.; Uiga, J.; Hõimoja, H.; Peets, T.; Kalder, J.; Algirdas, J.; Allik, A. Increasing self electricity consumption by using double water heating tanks for residential net zero energy buildings. In Proceedings of the 6th International Conference on Renewable Energy Research and Application (ICRERA), San Diego, CA, USA, 5–8 December 2017; Volume 6, pp. 106–110. [Google Scholar] [CrossRef]
  4. Chub, A.; Zdanowski, M.; Blinov, A.; Rabkowski, J. Evaluation of GaN HEMTs for high-voltage stage of isolated DC-DC converters. In Proceedings of the 10th International Conference on Compatibility, Power Electronics and Power Engineering (CPE-POWERENG), Bydgoszcz, Poland, 29 June–1 July 2016; pp. 375–379. [Google Scholar] [CrossRef]
  5. Blinov, A.; Chub, A.; Vinnikov, D.; Rang, T. Feasibility study of Si and SiC MOSFETs in high-gain DC/DC converter for renewable energy applications. In Proceedings of the IECON 2013—39th Annual Conference of the IEEE Industrial Electronics Society, Vienna, Austria, 10–14 November 2013; pp. 5975–5978. [Google Scholar] [CrossRef]
  6. Lepa, J.; Annuk, A.; Kokin, E.; Põder, V.; Jürjenson, K. Energy production and consumption charts in energy system. Oil Shale 2009, 26, 309–318. [Google Scholar] [CrossRef] [Green Version]
  7. Zemug, L.; Su, S.; Yunning, Z.; Xiaolomg, J.; Houhe, C.; Yujiang, R. Energy management strategy of active distribution network with integrated distributed wind power and smart buildings. IET Renew. Power Gener. 2020, 14, 2255–2267. [Google Scholar] [CrossRef]
  8. DeCicco, M.; Liu, D.Y.; Heo, J.; Krishnan, R.; Kurthen, A.; Wang, L. Carbon balance effects of U.S. biofuel production and use. Clim. Change 2016, 138, 667–680. [Google Scholar] [CrossRef] [Green Version]
  9. Okok, M.O.; Ruchathi, G.; Oromat, E. Expanding access to clean energy in developing countries: The role of off-grid mini hydro power projects in Kenya. Int. J. Renew. Energy Res. 2019, 9, 1571–1577. [Google Scholar]
  10. Hadiyanto, D.; Purwanto, Y.A.; Noorachmat, B.P.; Sapei, A. An indicator and evaluation criteria for off-grid micro-hydro power sustainability assessment. Int. J. Renew. Energy Res. 2019, 9, 1–15. [Google Scholar]
  11. Zoss, T.; Karklina, I.; Blumberga, D. Power to gas and pumped hydro storage potential in Latvia. Energy Procedia 2016, 95, 528–535. [Google Scholar] [CrossRef] [Green Version]
  12. Kesgin, M.G.; Han, P.; Taran, N.; Ionel, D.M. Overview of flywheel systems for renewable energy storage with a design study for high-speed axial-flux permanent-magnet machines. In Proceedings of the 8th International Conference of Renewable Energy Research and Applications (ICRERA) 2019, Brasov, Romania, 3–6 November 2019; pp. 1026–1031. [Google Scholar] [CrossRef]
  13. Rehman, Z.; Mahmood, A.; Razaq, S.; Wamiq, A.; Naeem, U.; Shehzad, K. Prosumer based energy management and sharing in smart grid. Renew. Sustain. Energy Rev. 2018, 82, 1675–1684. [Google Scholar] [CrossRef]
  14. Jie, C.; Bu, Z.; Wang, Y.; Yang, H.; Jiang, J.; Li, H.-J. Detecting prosumer-community groups in smart grids from the multiagent perspective. IEEE Trans. Syst. Man Cybern. Syst. PP 2019, 99, 1–13. [Google Scholar] [CrossRef]
  15. Bautista-Villalon, M.; Gutirerrez-Villalobos, J.; Rivas-Araiza, E.A. IoT-based system to monitor and control household lighting and appliance power consumption and water demand. In Proceedings of the 7th International Conference of Renewable Energy Research and Applications (ICRERA) 2018, Paris, France, 14–17 October 2018; pp. 785–790. [Google Scholar]
  16. Blinov, A.; Vinnikov, D.; Husev, O.; Chub, A. Experimental analysis of wide input voltage range qZS-derived push-pull DC/DC converter for PMSG-based wind turbines. In Proceedings of the PCIM Europe, Nuremberg, Germany, 14–16 May 2013; pp. 1435–1444. [Google Scholar]
  17. Sambaiah, K.S. A review on optimal allocation and sizing techniques for DG in distribution systems. Int. J. Renew. Energy Res. 2018, 8, 1236–1256. [Google Scholar]
  18. Vanhoudt, D.; Geysen, B.; Claessens, F.; Leemans, L.; Jespers, L.; Bael, J.B. An actively controlled residential heat pump: Potential on peak shaving and maximization of self-consumption of renewable energy. Renew. Energy 2014, 63, 531–543. [Google Scholar] [CrossRef]
  19. Annuk, A.; Jõgi, E.; Lill, H.; Kalder, J.; Hovi, M.; Pihlap, H.; Härm, M.; Allik, A. Augmentation of self-consumption of electricity by using boilers and batteries for residential buildings. In Proceedings of the 7th International Conference of Renewable Energy Research and Applications (ICRERA), Paris, France, 14–17 October 2018; Volume 7, pp. 256–260. [Google Scholar] [CrossRef]
  20. Budes, E.E.B.; Ochoa, G.V.; Obregon, L.G.; Arango-Manrique, A.A.; Alvarez, J.R.N. Energy, economic, and environmental evaluation of a proposed solar-wind power on-grid system using HOMER Pro®: A case study in Colombia. Energies 2020, 13, 1662. [Google Scholar] [CrossRef]
  21. Katsaprakakis, D.A.; Zidianakis, G.; Yiannakoudakis, Y.; Manioudakis, E.; Dakanali, I.; Kanouras, S. Working on buildings’ energy performance upgrade in mediterranean climate. Energies 2020, 13, 2159. [Google Scholar] [CrossRef]
  22. Hossain, E.; Zawad, M.; Rakibul, K.H.; Islam, K.H.R.; Akash, M.Q. Design a novel controller for stability analysis of microgrid by managing controllable load using load shaving and load shifting techniques; and optimizing cost analysis for energy storage system. Int. J. Renew. Energy Res. 2016, 6, 772–786. [Google Scholar]
  23. Eltamaly, A.M.; Mohamed, M.A.; Alolah, A.I. A novel smart grid theory for optimal sizing of hybrid renewable energy systems. Sol. Energy 2016, 124, 26–38. [Google Scholar] [CrossRef]
  24. Hassanzadeh, M.N.; Fotuhi-Firuzabad, M.; Safdarian, A. Wind energy penetration with load shifting from the system well-being viewpoint. Int. J. Renew. Energy Res. 2017, 7, 977–987. [Google Scholar]
  25. Duerr, S.; Ababei, C.; Ionel, D.M. Load balancing with energy storage systems based on co-simulation of multiple smart buildings and distribution networks. In Proceedings of the 8th International Conference on Renewable Energy Research and Applications (ICRERA) 2017, San Diego, CA, USA, 5–8 December 2017; Volume 5, pp. 175–180. [Google Scholar]
  26. Jonaitis, A.; Miliute, R.; Deveikis, T. Dynamic model of wind power balancing in hybrid power system. Turk. J. Electr. Eng. Comput. Sci. 2017, 25, 222–234. [Google Scholar] [CrossRef]
  27. Bashir, A.A.; Kasmaei, M.P.; Safdarian, A.; Lehtonen, M. Matching of local load with on-site PV production in a grid-connected residential building. Energies 2018, 11, 2409. [Google Scholar] [CrossRef] [Green Version]
  28. Degefa, M.Z.; Lehtonen, M.; McCulloch, M.; Nixon, K. Real-time matching of local generation and demand: The use of high resolution load modeling. In Proceedings of the IEEE PES Innovative Smart Grid Technologies Conference Europe, Ljubljana, Slovenia, 9–12 October 2016. [Google Scholar]
  29. Hauer, I.; Balischewski, S.; Ziegler, C. Design and operation strategy for multi-use application of battery energy storage in wind farms. J. Energy Storage 2020, 32, 101572. [Google Scholar] [CrossRef]
  30. Li, X.; Lim, M.K.; Ni, D.; Zhong, B.; Xiao, Z.; Hao, H. Sustainability or continuous damage: A behaviour study of prosumers´ electricity cinsumption after installing household disreibuted energy resources. J. Clean. Prod. 2020, 264, 121471. [Google Scholar] [CrossRef]
  31. Rogeau, A.; Barbier, T.; Girard, R.; Kong, N. Evoluotion of electrical distribution grid sizing considering self-consunption of local renewable producton. In Proceedings of the 24th International Confeence & Exhibition on Electricity Distribution (CIRED), Glasgow, UK, 12–15 June 2017; pp. 1–5. [Google Scholar]
  32. Dancker, J.; Götze, J.; Schultz, E.; Könneke, N.; Beyrau, F.; Wolter, M. Optimal design and operation of a CHP based district heating system including a heat storage and electrode boiler to increase self-consumption. In Proceedings of the 2019 IEEE Inovative Smart Grid Technologies Conference—Latin America (ISGT Latin America), Gramado, Brazil, 15–18 September 2019. [Google Scholar] [CrossRef]
  33. Kroposki, B.; Basso, T.; DeBlasio, R. Microgrid standards and technologies. In Proceedings of the IEEE Power and Energy Society 2008 General Meeting: Conversion and Delivery of Electrical Energy in the 21st Century, PES, Pittsburg, PA, USA, 20–24 July 2008. [Google Scholar] [CrossRef]
  34. Geidl, M.; Koeppel, G.; Favre-Perrod, P.; Klöckl, B.; Andresson, G.; Fröhlich, K. Energy hubs for the future. IEEE Power Energy Mag. 2007, 5, 24–30. [Google Scholar] [CrossRef]
  35. TUGE 10 Technical Data, 10 kW. Tuge Energia Ltd., Paldiski, Estonia, 2020; pp. 4–6. Available online: http://www.tuge.ee/products/tuge10 (accessed on 10 January 2021).
  36. Volker, S.; Kistemann, T. Field testing hot water temperature reduction as an energy-saving measure—Does the Legionella presence change in a clinic’s plumbing system? Environ. Technol. 2015, 36, 2138–2147. [Google Scholar] [CrossRef]
  37. Annuk, A.; Hovi, M.; Kalder, J.; Märss, M. Consumption and Wind Production Time Series Data. Estonian University of Life Sciences: Tartu, Estonia, 2020. Available online: https://doi.org/10.15159/eds.dt.20.02 (accessed on 10 January 2021).
  38. Baetens, R.; De Coninck, R.; Roy, J.V.; Verbuggen, B.; Driese, J.; Helsen, L.; Saelens, D. Assessing electrical bottlenecks at feeder level for residential net zero-energy buildings by integrated systemsimulation. Appl. Energy 2012, 96, 74–83. [Google Scholar] [CrossRef]
  39. Sperstad, I.B.; Korpås, M. Energy storage scheduling in distribution systems considering wind and photovoltaic generation uncertainties. Energies 2019, 12, 1231. [Google Scholar] [CrossRef] [Green Version]
  40. Hossein, S.M.; Carli, R. A residential demand-side management strategy under nonlinear pricing based on robust model predictive control. In Proceedings of the 2019 IEEE International Conference on Systems, Man and Cybernetics (SMC), Bari, Italy, 6–9 October 2019; pp. 3243–3248. [Google Scholar] [CrossRef]
  41. Annuk, A.; Hovi, M.; Kalder, J.; Kabanen, T.; Ilves, R.; Märss, M.; Martinkauppi, B.; Miidla, P. Methods for increasing shares of self-consumption in small PV solar energy applications. In Proceedings of the 9th International Conference on Renewable Energy Research and Applications (ICRERA) 2020, Glasgow, UK, 26–29 September 2020; Volume 5, pp. 184–188. [Google Scholar] [CrossRef]
  42. Shi, R.; Li, S.; Zhang, P.; Lee, K. Integration of renewable energy sources and electric vehicles in V2G network with adjustable robust optimization. Renew. Energy 2020, 153, 1067–1080. [Google Scholar] [CrossRef]
Figure 1. Energy flows between microgrid (MG) and utility grid (UG). (a) MG without BB, (b) MG with (BB).
Energies 14 01553 g001
Figure 2. Configuration of microgrid (MG). (a) bidirectional energy flow between load controller and UG, (b) bidirectional energy flow between load controller and battery, (c) one directional energy flow from WG to load controller, (d) one directional energy flow from load controller to NS, (e) one directional energy flow from load controller to WH.
Energies 14 01553 g002
Figure 3. A week sample of initial data from December 2015.
Energies 14 01553 g003
Figure 4. Cover factor YD dependency on battery and water heater (WH) capacity.
Energies 14 01553 g004
Figure 5. Dependence of energy flows between the utility grid (UG) and microgrid (MG) without buffer battery (BB) for different RS values.
Energies 14 01553 g005
Figure 6. Energy from the utility grid (UG) to microgrid—MG.
Energies 14 01553 g006
Figure 7. Energy from buffer battery (BB) to microgrid (MG).
Energies 14 01553 g007
Figure 8. Energy from buffer battery (BB) to the grid.
Energies 14 01553 g008
Figure 9. Influence of BB size and RS on cover factor.
Energies 14 01553 g009
Publisher’s Note: MDPI stays neutral with regard to jurisdictional claims in published maps and institutional affiliations.

