
A Long-Term Analysis of the Architecture and Operation of Water Film Cooling System for Commercial PV Modules

 , , and
Abstract
1. Introduction
2. Development of the ODTU
2.1. Basic Premises for the Implementation of the ODTU
2.1.1. Accessibility
2.1.2. Safety
2.1.3. Minimum Area for Physical Installation
2.1.4. Access to Water
2.1.5. Shading
2.1.6. Grounding
2.1.7. Access to the Power Grid
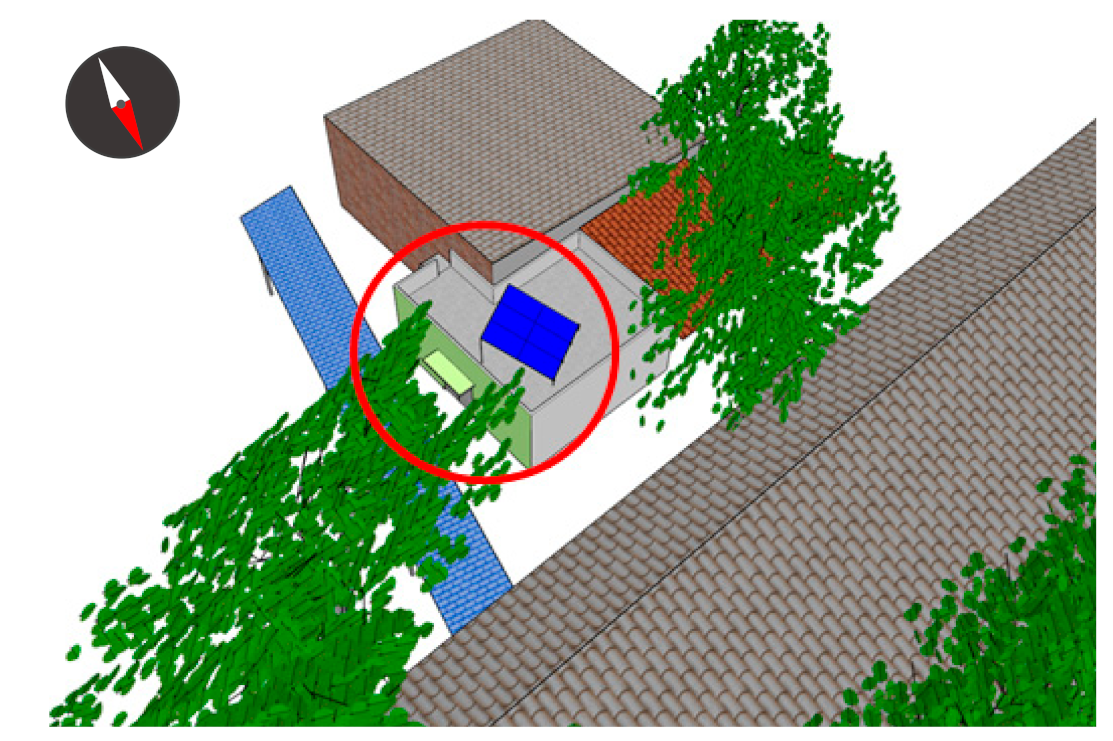
2.2. Shading Analysis of the Chosen Site
2.3. ODTU Implementation
2.4. Supervision and Monitoring System
2.4.1. Thermal and Electric Sensing and Monitoring
- (1)
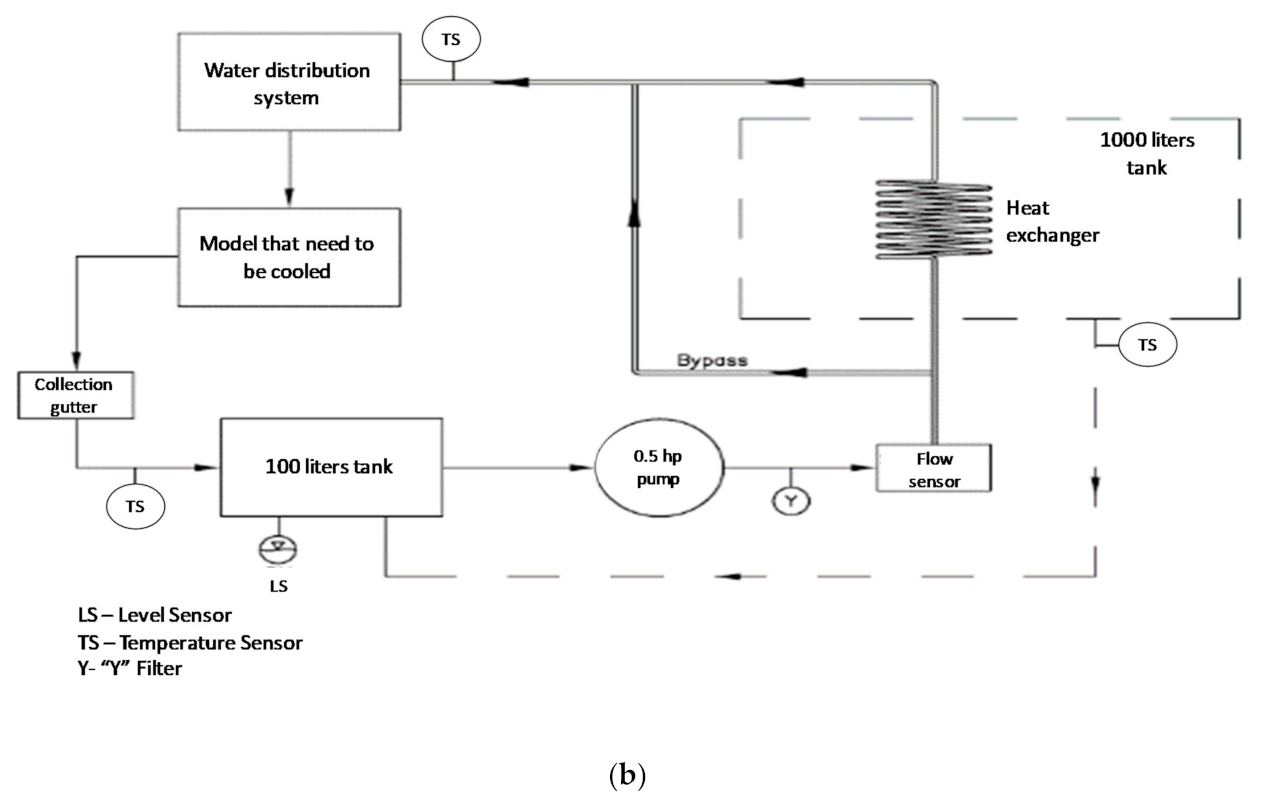
- Three PT100 resistance thermometer sensors (TS) with screwable head [61]: one connected to the 1.0 m3 tank; one connected to the beginning of the flushing line (right after the gutter); and one connected to the distributer line.
- (2)
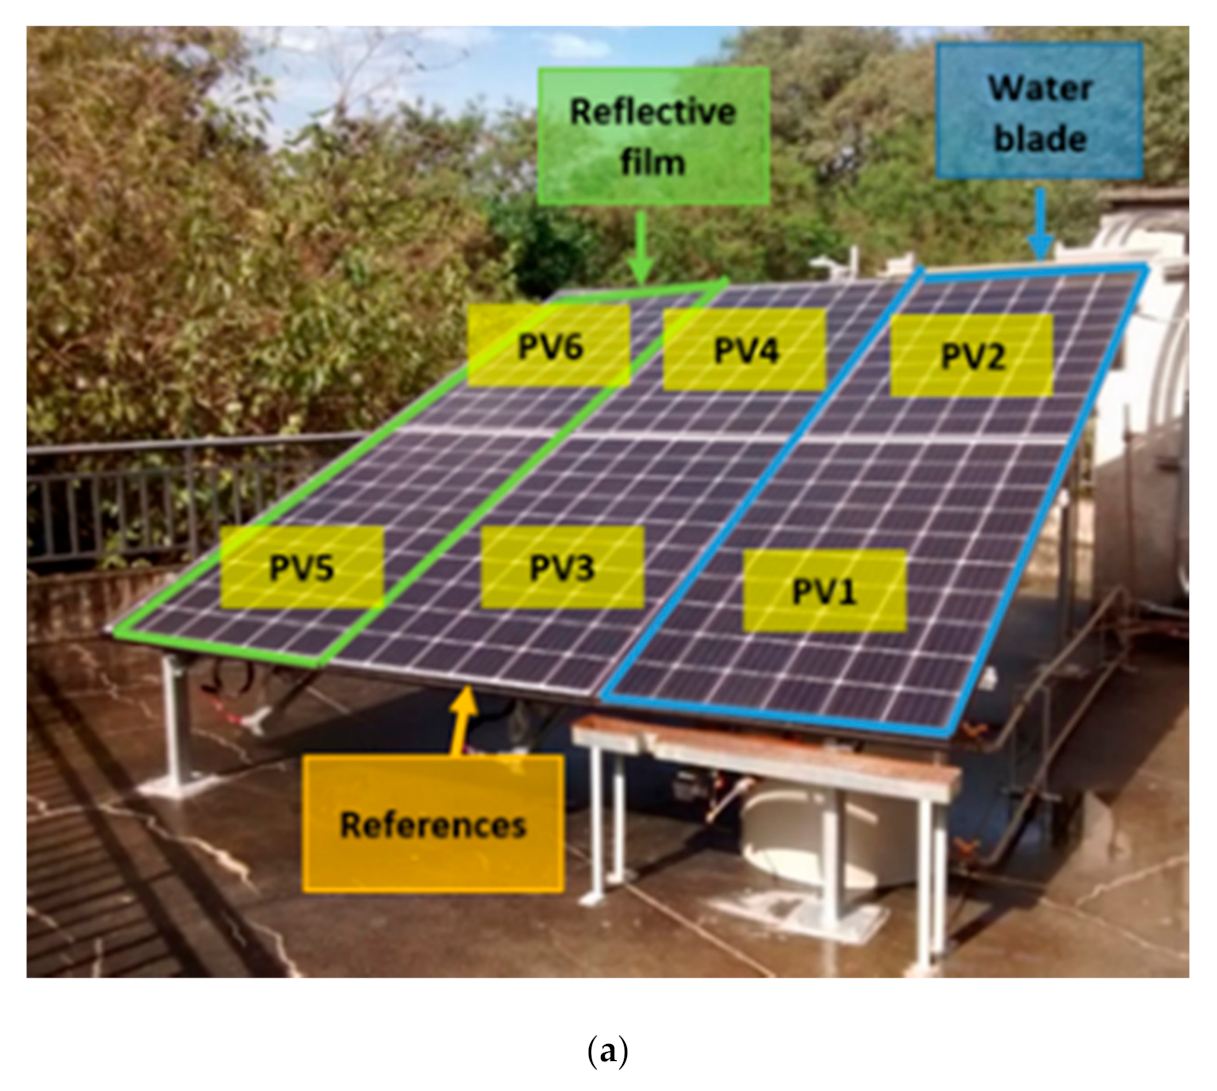
- 18 TS with exposed bulb type A [61], fixated on the bottom surface of the PV module. Three TS are fixed in each module, one for each arrangement of cells in series of the PV module.
- (3)
- Three dataloggers to obtain and to register the measured temperatures [62].
- (4)
- (5)
- Two active/reactive electric power transductors (three-phase) [65] to measure the power in unbalanced charges;
- (6)
- One flow sensor [66] installed on the supply line to measure the instant flow of water used in the system.
2.4.2. Meteorological Sensing and Monitoring
- (1)
- One pyrometer [67] installed on the same tilted surface of the PV modules, in order to measure the real global solar irradiance received by the PV modules. It is a part of the ODTU, and it is connected to one of the dataloggers.
- (2)
- One anemometer to measure the wind speed on the location [68];
- (3)
- One ambient temperature sensor [69];
- (4)
- One barometer used to measure the local atmospheric pressure [70];
- (5)
2.5. ODTU Commissioning
2.5.1. Visual Inspection
2.5.2. Operation Tests
2.5.3. Calibration of the DC Voltage, DC Current and AC Electric Power Sensors
3. Results and Discussion
3.1. Pre-Operation of the ODTU Water-Film
3.2. Operation of the ODTU Water-Film
4. Comparative Analysis
- It is evident that cooling systems increase the power generation of the PV modules;
- Most of the systems analyzed are in the northern hemisphere and mainly concentrated in Asia;
- In general, the average annual temperature of these locations is above 20 °C;
- Warm condition locations present the highest performance gains in power generation, while presenting the greatest reductions in the operating temperature of the PV modules when using a cooling system;
- Open cooling systems perform better than closed cooling systems;
- Except for this work and [31], all the cooling systems analyzed with more than a month of testing period are of the closed type.
- ODTU tests showed a longer execution time and better performance evaluation than the works analyzed in the literature review and systematized in Table A1 and Table A2. In the case of [31,79,80], with three months of testing period with cooling system operating. However, there was no comprehensive presentation of the results over the period. The results are concentrated on specific days when the performance indexes of the PV modules were higher.
- Due to the short testing period linked to open cooling systems, it was not possible to compare the possible degradations that can occur in the PV module due to the direct contact of the water with its surface;
- During the summer, the cooling system reduced the temperature by 15–19% on average, with a maximum of 35%; this is similar to the values found in [51], tested in the summer in a place with a cold semi-arid climate and an average annual temperature of 17.4 °C, and [81], tested in the spring in a place with hot semi-arid climate and average annual temperature of 25.2 °C;
- Regarding the gross generation, the average gains during the summer were of 2.3–6%, with maximum gains of 12%, as in [25], with a gain of 6.9% tested in the summer in a place with hot-summer-Mediterranean climate and average annual temperature of 16.1 °C, and [47], with a gain of 7.4% tested in the summer in a place with humid-subtropical climate and average annual temperature of 22 °C.
- During the winter, the average temperature reduction was approximately 19%, with a maximum reduction of about 31%. Only two other works were tested during that season. Ref. [6] with maximum reduction of 43.1% in a place with tropical savanna climate and average annual temperature of 23.5 °C, and [79], in a place with tropical rainforest climate and average annual temperature of 27.1 °C, did not simultaneously compare a cooled and an uncooled PV module.
5. Conclusions
Author Contributions
Funding
Institutional Review Board Statement
Informed Consent Statement
Data Availability Statement
Acknowledgments
Conflicts of Interest
Appendix A

| Ref/ Year | Local (City/Country) | Köppen Climate [80] | Season | Average Annual Temperature (°C) | N° PV Modules | Tilt Angle | Cooling System | Fluid | Pump | Flow Rate | Fluid Temperature (°C) | Test Period |
|---|---|---|---|---|---|---|---|---|---|---|---|---|
| [51] 2009 | Zarqa Jordan | Cold semi-arid (BSk) | Summer | 17.4 | 01 PV Cooled or uncooled | 32° | Open system Top side of PV | Water | Submersible pump | 4 L/min | Inlet: ~25 | 1 |
| [81] 2011 | Chuncheon Korea | Hot humid continental (Dwa) | Spring | 10.9 | 02 PV 01 cooled 01 uncooled | 23° | Open system Top side of PV | Water | Pump | 10 L/min | 03 days 13−15 May 2010 | |
| [48] 2011 | Cambridge USA | Humid continental (Dfa) | Autumn | 9.7 | 01 cooled | - | Close system Bottom side of PV | Water | Pump 17W | - | Inlet vs. outlet: ~4 | 01 day Mid-November |
| [24] 2013 | Cairo Egypt | Hot desert (BWh) | Summer | 21.3 | 14 PV 06 cooled 08 uncooled | - | Open system Top side of PV | Water | Pump 746 W. | 29 L/min | Assumed: 25 | 02 days One in June and one in July 2012 |
| [31] 2014 | Portland USA | Warm-summer Mediterranean climate (Csb) | Spring and Summer | 11.9 | 08 PV 01 cooled 07 uncooled | 30° | Open system Top side of PV | Water | Pump 7W | 7 L/min | With Ice: Inlet 8 | 03 months April to June, 2012 |
| [82] 2014 | Wysall UK | Oceanic (Cfb) | Summer | 9.6 | 84 PV cooled | 10° | Close system Bottom side of PV | Water | Pump | 0.017 kg/s | - | 01 day 19th July |
| [6] 2015 | Ilha Solteira Brazil | Tropical savanna (Aw) | Winter | 23.5 | 88 PV 44 cooled 44 uncooled | 23° | Close system Bottom side of PV | Water | No pump potential energy | 1.5–3 L/s | - | 14 days |
| [49] 2015 | Alexandria Egypt | Hot desert (BWh) | Spring | 20.6 | 03 PV 01 cooled 02 uncooled | 30° | Open system Top side of PV | Water | Pump | 1.2 L/h | - | 01 day of April 2014 |
| [53] 2015 | Perlis Malaysia | Tropical monsoon (Am) | Spring | 27.3 | 02 PV 02 cooled or uncooled | - | Open system Top and Bottom side of PV | Water and air | Pump | - | - | 01 day 31 March 2014 |
| [52] 2015 | Kerman Iran | Cold desert (BWk) | Summer | 16 | 03 cooled | 30° | Open system Top side of PV | Water | Pump | - | - | 03 days June and July |
| [20] 2016 | Abu Dhabi UAE | Hot desert (BWh) | 1 | 26.8 | 01 cooled | 60° | Close system Bottom side of PV | Water | Pump | 0.063 kg/s | Inlet: 30 | 01 month |
| [25] 2016 | Split Croatia | Hot-summer Mediterranean (Csa) | Summer | 16.1 | 01 cooled | 17° | Open system Top and Bottom side of PV | Water | Pump 4.2 W | 225 L/h | Inlet: 17 | 01 day |
| [83] 2017 | São Paulo Brazil | Oceanic (Cfb) | Summer and Autumn | 18.5 | 05 PV 02 cooled 03 uncooled | 23° | Close system Bottom side of PV | Water | Pump | 0.07−0.48 L/s | Inlet: 20.5−21.5 | 11 months (03 months with cooling system) |
| [84] 2017 | Kuala Lumpur Malaysia | Tropical rainforest (Af) | Winter | 27.1 | 01 cooled | 0° | Close system Bottom side of PV | Water | Pump | 30−180 L/h | - | 03 months January to March 2015 |
| [12] 2018 | São Paulo Brazil | Oceanic (Cfb) | Summer | 18.5 | 05 PV 02 cooled 03 uncooled | 23° | Close system Bottom side of PV | Water | Pump | - | - | 21 days |
| [22] 2018 | Kuala Lumpur Malaysia | Tropical rainforest (Af) | Winter | 27.1 | 01 cooled | 0° | Close system Bottom side of PV | Water | Pump | 30−180 L/h | Inlet: 30 | 01 months February |
| [44] 2018 | Lodz Poland | Warm humid continental (Dfb) | Autumn | 6.7 | 02 cooled | 30° | Close system Bottom side of PV | Water | Solar Pump | 1.3 kg/min | - | 01 day 01 October 2015 |
| [46] 2018 | Hefei China | Humid subtropical (Cfa) | Summer | 16 | 03 PV 02 cooled 01 uncooled | 32° | Close system Bottom side of PV | Water | Pump | 0.06 L/s | - | June and July 2017 |
| [47] 2018 | Taiwan China | Humid subtropical (Cfa) | Summer | 22 | 01 cooled | 23.5° | Open system Bottom side of PV | Water | Pump | 0.57 L/min | - | Maybe July |
| [54] 2018 | Catania Italy | Hot-summer Mediterranean (Csa) | Spring | 17.8 | 02 cooled | 25° | Close system Bottom side of PV | Water | Pump 3–45 W | 55 L/min | - | 07 days 3 to 9 May 2017 |
| [79] 2018 | New Delhi India | Hot semi-arid (BSh) | Spring | 25.2 | 05 cooled | 28° | Open system Top side of PV | Water | 1 | - | - | 02 days April 2017 |
| [85] 2019 | Bucaramanga Colombia | Tropical rainforest (Af) | 1 | 23.4 | 10 PV 03 cooled 07 uncooled | Open system Top side of PV | Water | Submergible pump | 1.75 L/min 3.75 L/min 4.75 L/min 9.50 L/min | - | 1 | |
| [86] 2019 | Elche Spain | Cold semi-arid (BSk) | Summer | 17.8 | 02 PV 01 cooled 01 uncooled | 45° | Open system Top and Bottom side of PV | Water | Pump | 0–80 L/h | - | 01 day July 26. 2016 |
| Ref/ Year | Theorical Research | Experimental Research | Thermal Results | Electric Results |
|---|---|---|---|---|
| [51] 2009 | Thermoelectric model for hourly solar radiation data for different locations in Australia: | Test of system performance under different radiation conditions, but does not compare the cooled with uncooled PV module at the same time | PV temperature (°C): Uncooled: ~58 Cooled: decreases about 26 | The increase in cell temperature above the standard operating temperature (45 °C) caused a drop of 5% in output power. Power gain with cooling system: about 15% |
| [81] 2011 | Thermal model of the surface cooling system | Compare and validate the thermal model results with the results of the empirical tests. Compare the cooled with uncooled PV module | PV temperature: Deviation between measured and predicted model is <4 °C. Maximum deviation between the cooled and uncooled was 20 °C | Average voltage gains with cooling system were 1.2/2.2/1.4 V for each test day. Maximum voltage gain was 3.2 V. Maximum power gain with cooling system was 11.6% |
| [48] 2011 | Thermal model to determine the production of clean water based on the increase of the cooling water temperature of the PV modules | Compare the measured with the predicted model. Determine the PV temperature with and without cooling system, but does not compare the cooled with uncooled PV module | PV temperature: Cooled: decreases by 10 °C With thermal management, additional gain of about 10 °C | With thermal management there is a gain of about 50 W |
| [24] 2013 | Thermal model to determine how long it will take to cool the PV modules to the normal operating temperature minimizing the amount of water and energy needed for cooling | Determine the influence of cooling and overheating on the performance of the PV cells, but does not compare the cooled with uncooled PV module at the same time | PV temperature: Simulated 46 and measured 42.5. Temperature reduction of 10 °C after the cooling system has operated for 5 min | Theorical: The output power is 790 W for 35 °C and 640 W for 65 °C. Experimental: determines that the efficiency of operating at 45 °C is 10.5% and for 35 °C, 12.5% |
| [31] 2014 | - | Explored various applications of the surface water cooling system: (i) open rack modules; (ii) insulated PV modules, (iii) ice water in the cooling system; and (iv) combining cooling system with concentrating methods | PV temperature (°C): (i) cooled 20−35/uncooled 40−60 (ii) cooled 20−40/uncooled 20−50 (iii) cooled 20−35/uncooled 20−55 (iv) cooled 20−40/uncooled 40−55 | (i) 12% average energy gain; after accounting for pump power consumption, 6%; the total power output gain over the course of the day was 9.4% and the total net energy gain was 4.6% (ii) gain in relation to the isolated modules was 14%, discounting the pumping energy, the net energy gain was 8.3% (iii) the inlet water temperature was 8 °C, minimum module temperature 16 ° C, with instantaneous power gain of 24% (iv) it reached the maximum power of the inverter; it was not possible to determine the gain of both systems operating on the module, reaching 200W, with a power gain of 43% |
| [82] 2014 | Thermal model to determine conversion of solar radiation into thermal energy by PV module absorbers and transporting absorbed thermal energy towards polyethylene heat exchangers | Examine the effectiveness of a cooling system in the improvement of the PV cell efficiency and compare the measured with the predicted model cumulative water produced | PV temperature: Experimental values indicate that water temperature difference could reach up to 16 °C. Simulated 62 °C and measured 57 °C | - |
| [6] 2015 | - | Determine the increase in electrical performance of a PV plant with cooling system and compare the cooled with uncooled PV module | PV temperature (°C): uncooled 60 cooled 34.1 | Maximum power gain was 6.5% Daily generation gain of 5.9% |
| [49] 2015 | - | Explore the automatic cooling and cleaning system in the performance of PV modules and compare the cooled with uncooled PV module | PV temperature (°C): Top side: uncooled 44/cooled 24. Bottom side: uncooled 51/cooled 31 | Maximum power: cooled 89.4 W/uncooled 68.4 W. Power gain 26% Efficiency: cooled 11.7%/uncooled 9% |
| [53] 2015 | - | Compare two open systems: 01 DC brushless fan at the bottom side of the PV module 01 DC water pump with inlet/outlet manifold at the top side of the PV module Compare the cooled with uncooled PV module | PV temperature (°C): Water pump: cooled 37.6 ˚C/uncooled 45.7 ˚C. The temperature variation of the PV module without a cooling system increased 6.4 ˚C with and without DC brushless fan. The average temperature of PV module along with the cooling system can be 44.8 ˚C, while the average temperature of PV without a cooling system seems to be 50.9 ˚C. The temperature variant of the PV module without a cooling system seemed to rise 6.1 ˚C reviews. | Gain of output voltage/output current/output power: Water pump: 3.5%/36.3%/39% Brushless fan: 3.5%/29.6%/32.2% |
| [52] 2015 | - | Investigate how the booster reflector and water film over the PV modules affect their performance. Compare the cooled with uncooled PV module | PV temperature/Maximum temperature: (i) without reflector 59 °C/65 °C; (ii) with water film 36 °C/41 °C; (iii) with reflector 71 °C/84 °C; (iv) with reflector and water film simultaneously 39 °C/48 °C | Mean Daily Power: (i) without reflector 51.6W; (ii) with reflector 58.8 W; (iii) with water film 60.8 W; (iv) reflector and water film 77.6 W Power gain in relation to a conventional module: (i) -; (ii) 14%; (iii) 17.8%; (iv) 50.4% |
| [20] 2016 | Thermoelectric model to determine the PVT module transient temperature and the to increase the overall PV effectiveness | Analyze the performance of each series-connected PV cell in PVT modules. Compare and validate the measured with the predicted model | PV temperature: Difference between the measured and the modelled is 8–12% The measured difference between cooled and uncooled is 5−10 °C | Recommended for environments with high ambient temperature and solar radiation |
| [25] 2016 | Thermal model to evaluate the energy efficiency | Analyze the cooling effect impact on the power output and electrical efficiency. Analyze four applied cooling options: (i) Without cooling; (ii) Back surface cooling; (iii) Top surface cooling; (iv) Simultaneous surfaces cooling | Average PV temperature: (i) 56 °C (ii) 33.7 °C (iii) 29.6 °C (iv) 24.1 °C | Maximal power output/Relative increase in power output: (i) 35 W/-; (ii) 39.9 W/14%; (iii) 40.1 W/14.6%; and (iv) 40.7 W/16.3% Electrical efficiency/Effective increase: (i) 13.9%/-; (ii) 15.6%/3.6%; (iii) 15.4%/2.5%; and (iv) 15.9/5.9% |
| [83] 2017 | Thermal model to evaluate the energy produced | Analyze the thermal and electrical performance of two different models of cooling systems for PV modules and compare cooled and uncooled PV modules | PV temperature: Maximum 68°C uncooled and minimum at the same time cooled 42.5 °C. The measured temperature difference between cooled and uncooled PV is 25.6°C | - |
| [84] 2017 | Thermal model to evaluate the energy efficiency | Investigate the effects of the PV module operating parameters on the output power and efficiency. Does not compare the cooled with uncooled PV module at the same time | - | Electrical efficiency decreases by 5.82% as the temperature increases by 26.1 °C. Electrical efficiency decreases by approximately 0.22% as the temperature increases by 1.0 °C. When the irradiation intensity increases by 100 W/m2 the temperature increases by 3.8 °C and the output power increases by 3.14 W |
| [12] 2018 | - | Present the development, production, installation, and performance testing of three cooling system models. Compare the cooled with uncooled PV modules | Temperature reduction: average of 20.5 °C and maximum 25.6 °C | - |
| [22] 2018 | Thermal model to evaluate the effect of high irradiation on PV power generation, due to a lens concentrator, to optimize the flow rate of the cooling fluid and thermal energy conversion | Compare and validate the measured with the predicted model. Does not compare the cooled with uncooled PV module at the same time | PV temperature: For every 100 W/m2 in solar radiation, the temperature increases about 0.9 °C The temperature difference between the measured and the modelled is 3.3–4.2% | For every 100 W/m2 increase in solar radiation the electrical power and electrical efficiency increase about 19.65 W and 0.06%, respectively. For every 10 L/h increment of fluid flow rate, the electrical efficiency increases about 0.43% |
| [44] 2018 | Thermal model and simulation using specialized computer program | Analyze the relationship between orientation of PVT collectors and their thermal and electric power generation, but does not compare the cooled with uncooled PV module | - | The efficiency of the PV module increases with the altitude angle, both in laboratory and field experiments |
| [46] 2018 | Experimental evaluation of the performance of two PV/T system: (i) pipe-based PV/T; (ii) PV/T with MHPA; (iii) conventional PV module at high ambient temperature. | - | The temperature could be up to (°C): (i) 90; (ii) 70; (iii) 100 Ambient temperature between 36–40 °C and solar radiation >800 W/m2 | Electrical efficiency decreased: (i) pipe-based PV/T: 9.6% to 7.7% (ii) PV/T with MHPA: 11.2% to 10% (iii) Conventional: 8.6% to 7%. |
| [47] 2018 | A mathematical model is built for predicting the system performance | Spray water on the bottom side of the PV. The pump was switched on once the PV temperature reached 45 °C and was switched off when it cooled to 35 °C | - | Experimental (875.9 W/m2) Average power output (W): 33.0; 37.4; 37.5 Average net power output (W): 33.0; 33.4; 35.8 Conversion efficiency (%): 6.77 6.87 7.38 Theoretical (800 W/m2) Average power output (W): 38.8; 43.5; 44.0 Average net power output (W): 38.8; 40.6; 42.4 Conversion efficiency (%): 8.72 9.13 9.52 Efficiency increment (%): -; 4.70; 9.17 |
| [54] 2018 | Mathematical model is built for predicting the system performance | - | Maximum difference in the bottom side temperatures between two modules are 3.0−4.0 °C | Cooling system increased the electrical power generated by 1.5%. Average errors of 12.1% and 5.3%, respectively, for the thermal and electrical energy produced |
| [79] 2018 | Thermal model (analytical) to evaluate the influence of temperature on the performance of building integrated photovoltaic-thermal system | Compare and validate the measured with predicted model for five technologies: (i) m-Si; (ii) p-Si; (iii) a-Si; (iv) CdTe; (v) CIGS | Maximum daily average temperature (°C): Cooled: ~36 Uncooled (i) 49.8; (ii) 50; (iii) 53; (iv) 54; (v) 58 Maximum fluctuation is observed in CIGS | Daily average electrical energy output (%): Cooled: (i) 12.3; (ii) 11; (iii) 6.1; (iv) %, 6.6; (v) 7.7 Uncooled: (i) 11.4; (ii) 10.3; (iii) 5.9; (iv) 6.3; (v) 7.0 |
| [85] 2019 | - | Experimental characterization of the operating temperature and output power from irrigated, 255 W PV modules, considered twelve irrigation regimes with four flow rates (L/min): 1.75; 3.75; 4.75; 9.50 and four operating cycles (1’:29’, 5’:25’, 15’:15’, and continuous. | PV continues its cooling process for 1–5 min after irrigation ends due to the evaporation of the residual water film that formed over its front surface; the temperature decreases between 0−15 ◦C. | Irrigation can enhance daily energy production by 10%. A flow rate equal to or greater than 3.75 L/min (2.34 L/min/m2) produces similar effects. Generated power increase: 0.5−2% for 400 W/m2; 2−5% for 400–800 W/m2; 5−10% for 800 W/m2 |
| [86] 2019 | - | Experimental evaluation of the improvement in efficiency of a PV module cooled by water sliding on its upper face and on its back side using a solar chimney. | The evaporative cooling efficiency has an average value of 33.9%. | The electrical efficiency: 50 L/h improvement to 6−7%; 250 L/h maintained about 10% with a peak of 11% |
References
- Grimoni, J.A.B.; Galvão, L.C.R.; Udaeta, M.E.M.; Kanayma, P.H. Introduction to Concepts of Energy Systems for Clean Development [Iniciação a Conceitos de Sistemas Energéticos Para o Desenvolvimento Limpo], 2nd ed.; Edusp: São Paulo, Brazil, 2015. [Google Scholar]
- Udaeta, M.E.M.; Galvão, L.C.R.; Rigolin, P.H.d.; Bernal, J.L.d. Full assessment energy-sources for inclusive energy-resources planning. Renew. Sustain. Energy Rev. 2016, 66, 190–206. [Google Scholar] [CrossRef]
- Hader, M.; Al-Kouz, W. Performance of a hybrid photovoltaic/thermal system utilizing water-Al2O3 nanofluid and fins. Int. J. Energy Res. 2019, 43, 219–230. [Google Scholar] [CrossRef]
- Abdullah, A.L.; Misha, S.; Tamaldin, N.; Rosli, M.A.M.; Sachit, F.A. Numerical Analysis of Solar Hybrid Photovoltaic Thermal Air Collector Simulation by ANSYS Numerical Analysis of Solar Hybrid Photovoltaic Thermal Air Collector Simulation by ANSYS. CFD Lett. 2019, 11, 1–11. [Google Scholar]
- Oh, J.; Govinda, S.; Tamizh, M. Temperature testing and analysis of PV modules PER ANSI/UL 1703 and IEC 61730 standards. In Proceedings of the 2010 35th IEEE Photovoltaic Specialists Conference, Honolulu, HI, USA, 20–25 June 2010; pp. 984–988. [Google Scholar] [CrossRef]
- Da Silva, V.O. Data Analysis on Performance of PV System Installed in South and North Directions; Universidade de São Paulo: São Paulo, Brazil, 2016. [Google Scholar] [CrossRef]
- Aste, N.; Del Pero, C.; Leonforte, F. Water PVT Collectors Performance Comparison. Energy Procedia 2017, 105, 961–966. [Google Scholar] [CrossRef]
- Elbreki, A.M.; Alghoul, M.A.; Al-Shamani, A.N.; Ammar, A.A.; Yegani, B.; Aboghrara, A.M.; Rusaln, M.H.; Sopian, K. The role of climatic-design-operational parameters on combined PV/T collector performance: A critical review. Renew. Sustain. Energy Rev. 2016, 57, 602–647. [Google Scholar] [CrossRef]
- Yamaguchi, T.; Kawakami, M.; Kitano, K.; Nakagawa, S.; Tokoro, T.; Nakano, T. Data analysis on performance of PV system installed in south and north directions. In Proceedings of the 3rd World Conference on Photovoltaic Energy Conversion, Osaka, Japan, 11–18 May 2003; pp. 2239–2242. [Google Scholar]
- Kozak, T.; Maranda, W.; Napieralski, A.; De Mey, G.; De Vos, A. Influence of Ambient Temperature on the Amount of Electric Energy Produced by Solar Modules. In Proceedings of the 2009 MIXDES-16th International Conference Mixed Design of Integrated Circuits & Systems, Lodz, Poland, 25–27 June 2009; pp. 351–354. [Google Scholar]
- Irwanto, M.; Irwan, Y.M.; Safwati, I.; Leow, W.-Z.; Gomesh, N. Analysis Simulation of the Photovoltaic Output Performance. In Proceedings of the 2014 IEEE 8th International Power Engineering and Optimization Conference (PEOCO2014), Langkawi, Malaysia, 24–25 March 2014; pp. 477–481. [Google Scholar] [CrossRef]
- Da Silva, V.O.; Gimenes, A.L.V.; Udaeta, M.E.M. Development of a real-scale cooling module for a PV power plant. IET Renew. Power Gener. 2018, 12, 450–455. [Google Scholar] [CrossRef]
- Canadina Solar Inc. Quartech CS6K-270/275M: PV Module Product Datasheet V5.3 EN. 2015. Available online: www.canadiansolar.com (accessed on 10 April 2017).
- SunEdison. MEMC SilvantisTM P290 Modulo, Data Sheet_Q2 2012; SunEdison: Maryland Heights, MO, USA, 2012. [Google Scholar]
- Siecker, J.; Kusakana, K.; Numbi, B.P. A Review of Solar Photovoltaic Technologies. Renew. Sustain. Energy Rev. 2016, 55, 414–425. [Google Scholar] [CrossRef]
- Joshi, S.S.; Dhoble, A.S. Photovoltaic -Thermal systems (PVT): Technology review and future trends. Renew. Sustain. Energy Rev. 2018, 92, 848–882. [Google Scholar] [CrossRef]
- Li, G.; Shittu, S.; Diallo, T.M.O.; Yu, M.; Zhao, X.; Ji, J. A review of solar photovoltaic-thermoelectric hybrid system for electricity generation. Energy 2018, 158, 41–58. [Google Scholar] [CrossRef]
- Mellor, A.; Alonso Alvarez, D.; Guarracino, I.; Ramos, A.; Riverola Lacasta, A.; Ferre Llin, L.; Murrell, A.J.; Paul, D.J.; Chemisana, D.; Markides, C.N.; et al. Roadmap for the next-generation of hybrid photovoltaic-thermal solar energy collectors. Sol. Energy 2018, 174, 386–398. [Google Scholar] [CrossRef]
- Hasan, M.A.; Sumathy, K. Photovoltaic thermal module concepts and their performance analysis: A review. Renew. Sustain. Energy Rev. 2010, 14, 1845–1859. [Google Scholar] [CrossRef]
- Al Tarabsheh, A.; Ghazal, A.; Asad, M.; Morci, Y.; Etier, I.; El Haj, A.; Fath, H. Performance of photovoltaic cells in photovoltaic thermal (PVT) modules. IET Renew. Power Gener. 2016, 10, 1017–1023. [Google Scholar] [CrossRef]
- Hasanuzzaman, M.; Malek, A.B.M.A.; Islam, M.M.; Pandey, A.K.; Rahim, N.A. Global advancement of cooling technologies for PV systems: A review. Sol. Energy 2016, 137, 25–45. [Google Scholar] [CrossRef]
- Nasrin, R.; Hasanuzzaman, M.; Rahim, N.A. Effect of high irradiation and cooling on power, energy and performance of a PVT system. Renew. Energy 2018, 116, 552–569. [Google Scholar] [CrossRef]
- Endecon Engineering. A guide to photovoltaic (PV) system design and installation: Energy technology development division, consultant report, a guide to photovoltaic (PV) system design and installation. San Ramon, California. 2001. Available online: https://www.energy.ca.gov/reports/2001-09-04_500-01-020.PDF (accessed on 12 May 2017).
- Moharram, K.A.; Abd-Elhady, M.S.; Kandil, H.A.; El-Sherif, H. Enhancing the performance of photovoltaic panels by water cooling. Ain Shams Eng. J. 2013, 4, 869–877. [Google Scholar] [CrossRef]
- Nizetic, S.; Coko, D.; Yadav, A.; Grubisic-Cabo, F. Water spray cooling technique applied on a photovoltaic panel: The performance response. Energy Convers. Manag. 2016, 108, 287–296. [Google Scholar] [CrossRef]
- Moradi, K.; Ebadian, M.A.; Lin, C.X. A review of PV/T technologies: Effects of control parameters. Int. J. Heat Mass Transf. 2013, 64, 483–500. [Google Scholar] [CrossRef]
- Abdullah, A.L.; Misha, S.; Tamaldin, N.; Rosli, M.A.M.; Sachit, F.A. Photovoltaic thermal /solar (PVT) collector (PVT) system based on fluid absorber design: A review. J. Adv. Res. Fluid Mech. Therm. Sci. 2018, 48, 196–208. [Google Scholar]
- Sahota, L.; Tiwari, G.N. Review on series connected photovoltaic thermal (PVT) systems: Analytical and experimental studies. Sol. Energy 2017, 150, 96–127. [Google Scholar] [CrossRef]
- Kasaeian, A.; Khanjari, Y.; Golzari, S.; Mahian, O.; Wongwises, S. Effects of forced convection on the performance of a photovoltaic thermal system: An experimental study. Exp. Therm. Fluid Sci. 2017, 85, 13–21. [Google Scholar] [CrossRef]
- Van Helden, W.G.J.; Van Zolingen, R.J.C.H.; Zondag, H.A. PV thermal systems: PV panels supplying renewable electricity and heat. Prog. Photovolt. Res. App 2004, 12, 415–426. [Google Scholar] [CrossRef]
- Smith, M.K.; Selbak, H.; Wamser, C.C.; Nicholas, U.D.; Krieske, M.; Ssailor, D.J.; Rosenstiel, T.N. Water cooling method to improve the performance of field-mounted, insulated, and concentrating photovoltaic modules. J. Sol. Energy Eng. 2014, 136, 034503. [Google Scholar] [CrossRef]
- Michael, J.J.; Iniyan, S. Performance of copper oxide/water nanofluid in a flat plate solar water heater under natural and forced circulations. Energy Convers. Manag. 2015, 95, 160–169. [Google Scholar] [CrossRef]
- Matuska, T. Performance and economic analysis of hybrid PVT collectors in solar DHW system. Energy Procedia 2014, 48, 150–156. [Google Scholar] [CrossRef]
- Nasrin, R.; Rahim, N.A.; Fayaz, H.; Hasanuzzaman, M. Water/MWCNT nanofluid based cooling system of PVT: Experimental and numerical research. Renew. Energy 2018, 121, 286–300. [Google Scholar] [CrossRef]
- Abdelrazik, A.S.; Al-Sulaiman, F.A.; Saidur, R.; Ben-Mansour, R. A review on recent development for the design and packaging of hybrid photovoltaic/thermal (PV/T) solar systems. Renew. Sustain. Energy Rev. 2018, 95, 110–129. [Google Scholar] [CrossRef]
- Michael, J.J.; Goic, R. Flat plate solar photovoltaic-thermal (PV/T) systems: A reference guide. Renew. Sustain. Energy Rev. 2015, 51, 62–88. [Google Scholar] [CrossRef]
- Lari, M.O.; Sahin, A.Z. Design, performance and economic analysis of a nanofluid-based photovoltaic/thermal system for residential applications. Energy Convers. Manag. 2017, 149, 467–484. [Google Scholar] [CrossRef]
- Maadi, S.R.; Kolahan, A.; Passandideh-Fard, M.; Sardarabadi, M. Effects of Nanofluids Thermo-Physical Properties on the Heat Transfer and 1st Law of Thermodynamic in a Serpentine PVT System. In Proceedings of the 17th Conference On Fluid Dynamics, Shahrood, Iran, 27–29 August 2017; pp. 1–14. [Google Scholar]
- Said, Z.; Arora, S.; Bellos, E. A review on performance and environmental effects of conventional and nanofluid-based thermal photovoltaics. Renew. Sustain. Energy Rev. 2018, 94, 302–316. [Google Scholar] [CrossRef]
- Da Silva, V.O.; Udaeta, M.E.M.; Gimenes, A.L.V.; Junior, A.C.d.; Linhares, A.L.; Rigolin, P.H.d. Development of Modular Cooling for Water-Cooled Photovoltaic Plant in Real Scale. In Advanced Cooling Technologies and Applications; IntechOpen: London, UK, 2018; p. 15. [Google Scholar]
- Sultan, S.M.; Efzan, M.N.E. Review on recent Photovoltaic/Thermal (PV/T) technology advances and applications. Sol. Energy 2018, 173, 939–954. [Google Scholar] [CrossRef]
- Lamnatou, C.; Chemisana, D. Photovoltaic/thermal (PVT) systems: A review with emphasis on environmental issues. Renew. Energy 2017, 105, 270–287. [Google Scholar] [CrossRef]
- Han, H.; Wu, S.; Zhang, Z. Factors underlying rural household energy transition: A case study of China. Energy Policy 2018, 114, 234–244. [Google Scholar] [CrossRef]
- Sawicka-chudy, P.; Sibiński, M.; Cholewa, M.; Klein, M.; Znajdek, K. Tests and theoretical analysis of a PVT hybrid collector operating under various insolation conditions. Acta Innov. 2018, 26, 62–74. [Google Scholar] [CrossRef]
- Brötje, S.; Kirchner, M.; Giovannetti, F. Performance and heat transfer analysis of uncovered photovoltaic-thermal collectors with detachable compound. Sol. Energy 2018, 170, 406–418. [Google Scholar] [CrossRef]
- Yuan, W.; Ji, J.; Li, Z.; Zhou, F.; Ren, X.; Zhao, X.; Liu, S. Comparison study of the performance of two kinds of photovoltaic/thermal(PV/T) systems and a PV module at high ambient temperature. Energy 2018, 148, 1153–1161. [Google Scholar] [CrossRef]
- Yang, L.-H.; Liang, J.-D.; Hsu, C.-Y.; Yang, T.-H.; Chen, S.-L. Enhanced Efficiency of Photovoltaic Panels by Integrating a Spray Cooling System with Shallow Geothermal Energy Heat Exchanger. Renew. Energy 2018, 134, 970–981. [Google Scholar] [CrossRef]
- Kelley, L.C. The Design and Control of a Termal Management System for a Photovoltaic Reverse Osmosis System; Massachusetts Institute Technology: Cambridge, MA, USA, 2011. [Google Scholar]
- Elnozahy, A.; Rahman, A.; Ali, A.; Abdel-Salam, M.; Ookawara, S. Performance of a PV module integrated with standalone building in hot arid areas as enhanced by surface cooling and cleaning. Energy Build. 2015, 88, 100–109. [Google Scholar] [CrossRef]
- Klunth, A. Using Water as a Coolant to Increase Solar Panel Efficiency. In Proceedings of the California State Science Fair, Los Angeles, CA, USA, 19−20 May 2008. [Google Scholar]
- Odeh, S.; Behnia, M. Improving Photovoltaic Module Efficiency Using Water Cooling. Heat Transf. Eng. 2009, 30, 499–505. [Google Scholar] [CrossRef]
- Tabaei, H.; Ameri, M. Improving the effectiveness of a photovoltaic water pumping system by using bosster refletor and cooling array surface by a film of water. IJST Trans. Mech. Eng. 2015, 39, 51–60. [Google Scholar]
- Irwan, Y.M.; Leow, W.Z.; Irwanto, M.; Fareq, M.; Hassan, S.I.S.; Safwati, I.; Amelia, A.R. Comparison of solar panel cooling system by using dc brushless fan and dc water. J. Phys. Conf. Ser. 2015, 622, 1–11. [Google Scholar] [CrossRef]
- Gagliano, A.; Tina, G.M.; Nocera, F.; Grasso, A.D.; Aneli, S. Description and performance analysis of a flexible photovoltaic/thermal (PV/T) solar system. Renew. Energy 2018, 1–13. [Google Scholar] [CrossRef]
- Das, D.; Kalita, P.; Roy, O. Flat plate hybrid photovoltaic- thermal (PV/T) system: A review on design and development. Renew. Sustain. Energy Rev. 2018, 84, 111–130. [Google Scholar] [CrossRef]
- Wu, J.; Zhang, X.; Shen, J.; Wu, Y.; Connelly, K.; Yang, T.; Tang, L.; Xiao, M.; Wei, Y.; Jiang, K.; et al. A review of thermal absorbers and their integration methods for the combined solar photovoltaic/thermal (PV/T) modules. Renew. Sustain. Energy Rev. 2016, 75, 839–854. [Google Scholar] [CrossRef]
- Heideier, R.B.; Gimenes, A.L.V.; Udaeta, M.E.M.; Saidel, M.A. Optical filter design applied to photovoltaic modules to maximize energy production. Sol. Energy 2018, 159, 908–913. [Google Scholar] [CrossRef]
- KSB. KSB Hydrobloc P500 Monofásica 220V, Data Sheet No. A2748/49.8P/6; KSB: Frankenthal, Germany, 2007. [Google Scholar]
- Da Silva, V.O.; Martinez-bolanos, J.R.; Heideier, R.B.; Gimenes, A.L.V.; Udaeta, M.E.M.; Saidel, M.A. Theoretical and experimental research to development of water-film cooling system for commercial photovoltaic modules. IET Renew. Power Gener. 2020, 1–19. [Google Scholar] [CrossRef]
- International Electrotechnical Commission. Photovoltaic System Performance Monitoring—Guidelines for Measurement, Data Exchange and Analysis-IEC 61724. 1998. Available online: https://webstore.iec.ch/preview/info_iec61724%7Bed1.0%7Den.pdf (accessed on 22 March 2017).
- LogTeck Automação e Sistema. Termoresistência PT100; LogTeck Automação e Sistema: São Caetano do Sul, Brazil, 2017. [Google Scholar]
- Novus. Manual de Instruções Fieldlogger; Novus: Canoas, Brazil, 2014. [Google Scholar]
- SECON. Transdutores (Transmissores) de Tensão DC Modelo V420ADC. Available online: https://www.secon.com.br/pdf/181101051237_TRANSDUTOR-TENSAO-VDC.pdf (accessed on 10 April 2017).
- SECON. Transdutores (Transmissores) de Corrente DC Modelo C420ADC. Available online: https://www.secon.com.br/pdf/181101050932_TRANSDUTOR-CORRENTE-CMI.pdf (accessed on 10 April 2017).
- SECON. Transdutores de Potência Ativa Trifásica. Available online: https://www.secon.com.br/pdf/190130083951_TRANSDUTORES-POTENCIA-ATIVA.pdf (accessed on 10 April 2017).
- IFM Eletronic. Operating Instructions Mechatronic Flow Sensor; IFM Eletronic: Essen, Germany, 2016. [Google Scholar]
- Hukseflux. Piranômetro Modelo: SR05-DA2-BL; Hukseflux: Delft, The Netherlands, 2016. [Google Scholar]
- Ammonit. Anemometer Thies First Class Advanced X S11200/ S11200H. 2018. Available online: https://www.ammonit.com/images/stories/download-pdfs/DataSheets/Anemometers/Anemometer_ThiesFirstClassAdvancedX_S11200-H.pdf (accessed on 11 April 2017).
- NRG Systems. 110S TEMPERATURE SENSOR. Available online: https://www.nrgsystems.com/products/met-sensors/other-met-sensors/detail/110s-temperature-sensor (accessed on 3 April 2017).
- NRG Systems. BP20 Barometric Pressure Sensor. Available online: https://www.nrgsystems.com/products/met-sensors/other-met-sensors/detail/bp20-barometric-pressure-sensor (accessed on 3 April 2017).
- Gimenes, A.L.V.; Linhares, A.L.; Abreu, A.C., Jr.; Bernal, J.L.O.; Galvão, L.C.R.; Galvão, M.D.; Udaeta, M.E.M.; Kanayama, P.H.; Acebron, R.M.; Paula, R.V.; et al. Instrumental measurement of primary and secondary energy and systematization of big-data generated in a pilot eolic-solar system. Espacios 2018, 39, 22–38. [Google Scholar]
- Nascimento, A.A.; Gimenes, A.L.V.; Linhares, A.L.; Abreu, A.C., Jr.; Bernal, J.L.O.; Spagiari, J.O.M.; Galvão, L.C.R.; Galvão, M.D.; Udaeta, M.E.M.; Rigolin, P.H.C.; et al. Design of the strategy for mass data from outdoor units of measurement of intermittent primary-energy quantities. Espacios 2018, 39, 24–43. [Google Scholar]
- Relva, S.G.; Gimenes, A.L.V.; Udaeta, M.E.M.; Galvão, L.C.R. Transmittance index characterization at two solar measurement stations in Brazil. Theor. Appl. Climatol. 2020, 139, 205–219. [Google Scholar] [CrossRef]
- Santana, J.R. Clouds and Their Effects on Solar Radiation in São Paulo; Universidade de São Paulo: São Paulo, Brazil, 2018. [Google Scholar]
- Koffi, H.A.; Kakane, V.C.K.; Kuditcher, A.; Hughes, A.F.; Adeleye, M.B.; Amuzu, J.K.A. Seasonal variations in the operating temperature of silicon solar panels in southern Ghana. Afr. J. Sci. Technol. Innov. Dev. 2015, 7, 485–490. [Google Scholar] [CrossRef]
- Sahli, M.; Correia, J.P.M.; Ahzi, S.; Touchal, S. Multi-physics modeling and simulation of heat and electrical yield generation in photovoltaics. Sol. Energy Mater. Sol. Cells 2018, 180, 358–372. [Google Scholar] [CrossRef]
- Sharma, R.; Chong, A.P.; Li, J.B.; Aberle, A.G.; Huang, Y. Role of post-metallization anneal sequence and forming gas anneal to mitigate light and elevated temperature induced degradation of multicrystalline silicon solar cells. Sol. Energy Mater. Sol. Cells 2019, 195, 160–167. [Google Scholar] [CrossRef]
- Gimenes, A.L.; Linhares, A.L.; Abreu, A.C., Jr.; Bernhard, D.B.; Bernal, J.L.; Udaeta, M.E.M.; Rigolin, P.H.C.; Acebron, R.M.; Carneiro, R.A.; Relva, S.G.; et al. Experimental development of cooling system addressing to photovoltaic power plant in real scale. Espacios 2018, 39, 49. [Google Scholar]
- Tomar, V.; Tiwari, G.N.; Bhatti, T.S.; Norton, B. Thermal modeling and experimental evaluation of five different photovoltaic modules integrated on prototype test cells with and without water flow. Energy Convers. Manag. 2018, 165, 219–235. [Google Scholar] [CrossRef]
- Climate-data.org. Climate Data for Cities Worldwide. 2018. Available online: https://en.climate-data.org/ (accessed on 27 September 2019).
- Kim, D.-J.; Kim, D.H.; Bhattara, S.; Oh, J.-H. Simulation and Model Validation of the Surface Cooling System for Improving the Power of a Photovoltaic Module. J. Sol. Energy Eng. 2011, 133, 041012. [Google Scholar] [CrossRef]
- Buker, M.S.; Mempouo, B.; Riffat, S.B. Performance evaluation and techno-economic analysis of a novel building integrated PV/T roof collector: An experimental validation. Energy Build. 2014, 76, 164–175. [Google Scholar] [CrossRef]
- Da Silva, V.O.; Udaeta, M.E.M.; Gimenes, A.L.V.; Linhares, A.L. Improving the Performance of Photovoltaic Power Plants with Determinative Module for the Cooling System. Energy Power Eng. 2017, 9, 309–323. [Google Scholar] [CrossRef]
- Rahman, M.M.; Hasanuzzaman, M.; Rahim, N.A. Effects of operational conditions on the energy efficiency of photovoltaic modules operating in Malaysia. J. Clean. Prod. 2017, 143, 912–924. [Google Scholar] [CrossRef]
- Osma-Pinto, G.; Ordóñez-Plata, G. Measuring the effect of forced irrigation on the front surface of PV panels for warm tropical conditions. Energy Rep. 2019, 5, 501–514. [Google Scholar] [CrossRef]
- Lucas, M.; Ruiz, J.; Aguilar, F.J.; Cutillas, C.G.; Kaiser, A.S.; Vicente, P.G. Experimental study of a modified evaporative photovoltaic chimney including water sliding. Renew. Energy 2019, 134, 161–168. [Google Scholar] [CrossRef]


| Parameter | Sampling Rate | Integration Period | No. of Sensors |
|---|---|---|---|
| Solar irradiance on the inclination of the PV modules | ≤1.0 min | 1.0 min | 01 |
| Direct current voltage | ≤1.0 s | 1.0 min | 06 |
| Direct current (DC) | ≤1.0 s | 1.0 min | 06 |
| Active/reactive electric power in alternating current (AC) in the exit of each inverter | ≤1.0 s | 1.0 min | 06 |
| Neutral-phase voltage of the AC phases in the coupling point | ≤1.0 s | 1.0 min | 03 |
| Temperature of the PV modules | ≤1.0 min | 1.0 min | 18 |
| Temperature of the water in the tanks | ≤1.0 min | 1.0 min | 02 |
| Temperature of the water at the entrance of the flushing line | ≤1.0 min | 1.0 min | 01 |
| Water flow | ≤1.0 min | 1.0 min | 01 |
| Active electric power consumed by the water pump | ≤1.0 min | 1.0 min | 01 |
| Theoretical value | 26.18 | 7.45 | 195.0 |
| Measured value | 26.56 | 7.10 | 188.6 |
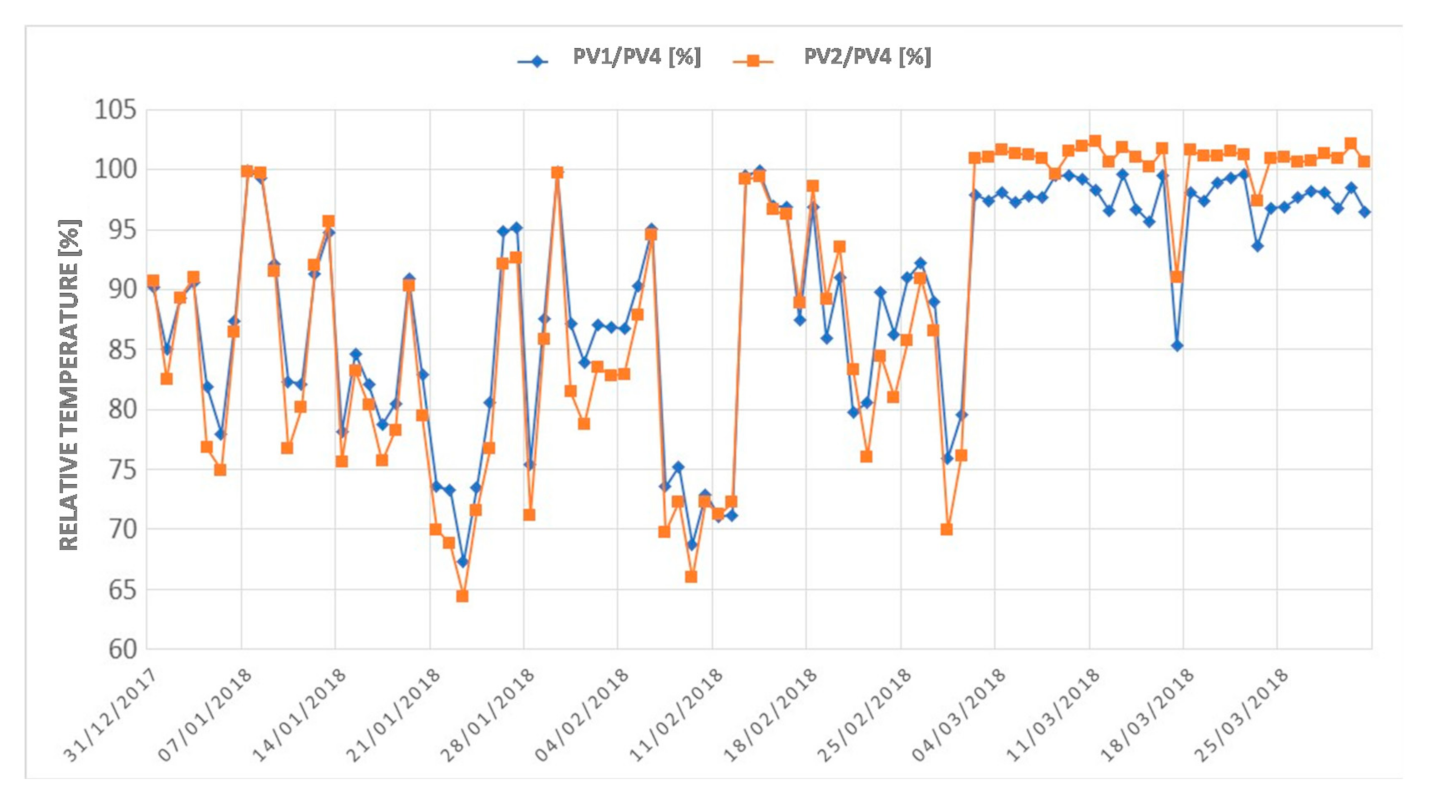
| Day | PV1 [°C] | PV2 [°C] | PV4 [°C] | PV1/PV4 [%] | PV2/PV4 [%] |
|---|---|---|---|---|---|
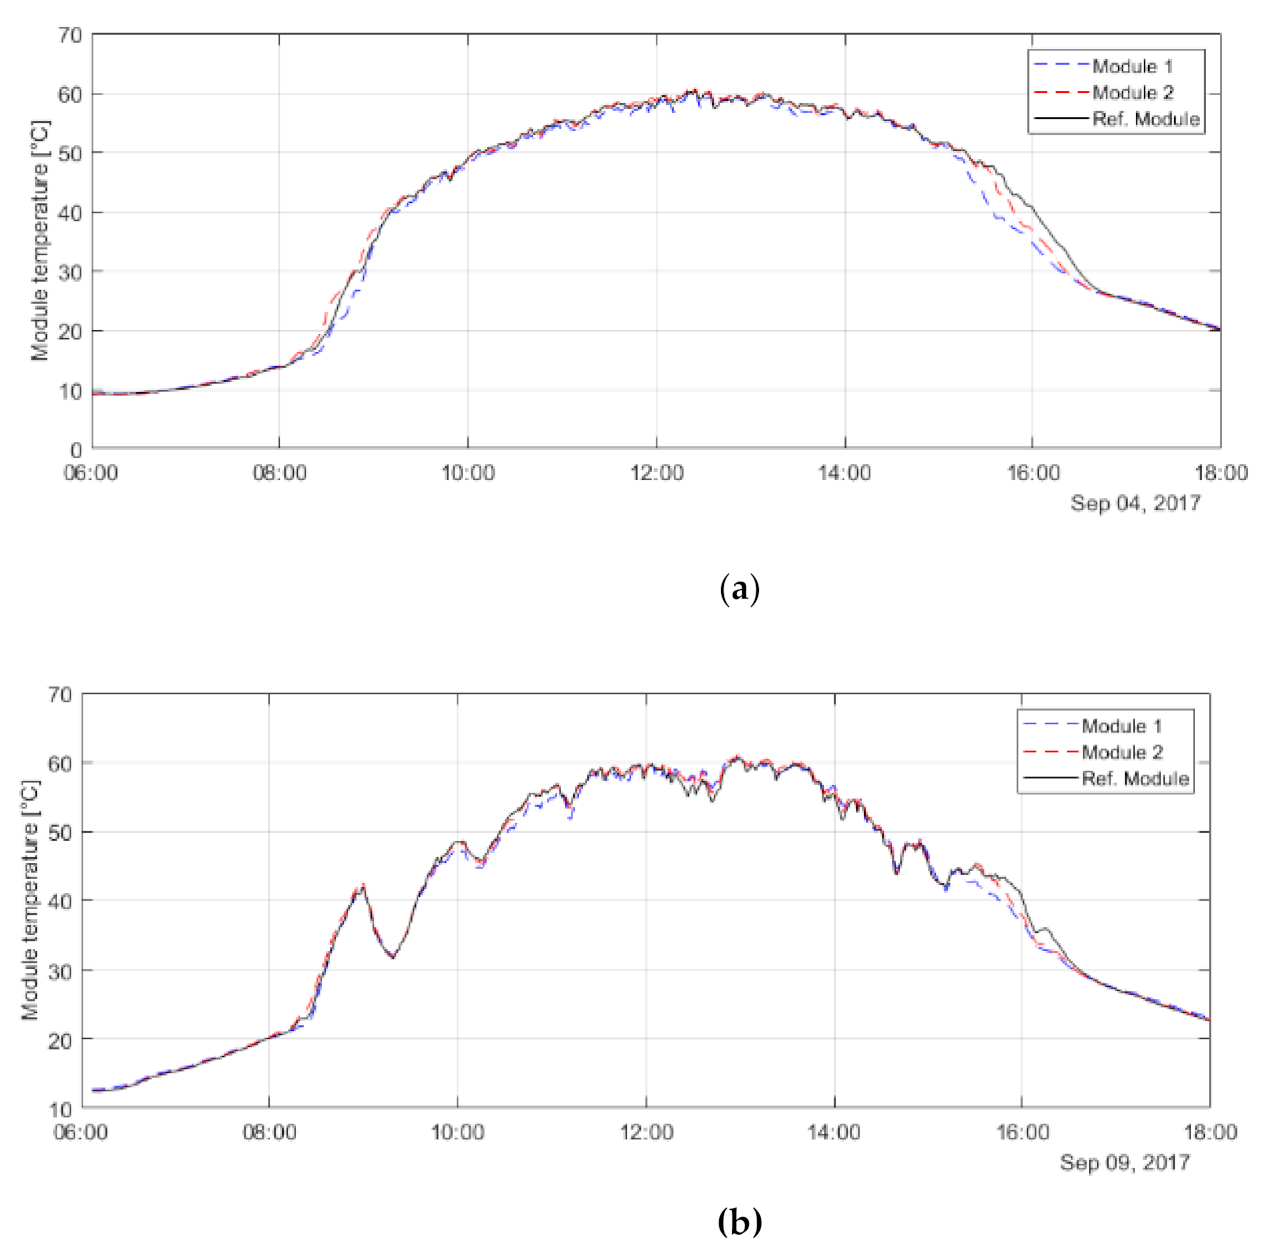
| 3 September 2017 | 52.30 | 52.58 | 52.02 | 100.54 | 101.07 |
| 4 September 2017 | 54.11 | 54.96 | 54.78 | 98.77 | 100.33 |
| 5 September 2017 | 53.66 | 54.94 | 54.95 | 97.65 | 99.98 |
| 6 September 2017 | 50.05 | 49.60 | 49.22 | 101.68 | 100.77 |
| 7 September 2017 | 52.60 | 52.3 | 51.74 | 101.66 | 101.07 |
| 8 September 2017 | 53.35 | 53.63 | 53.26 | 100.17 | 100.69 |
| 9 September 2017 | 52.88 | 53.32 | 53.04 | 99.69 | 100.52 |
| Parameter | PV1 Module | PV2 Module | PV4 Module |
|---|---|---|---|
| Total energy [kWh/week] | 7.49 | 7.74 | 7.84 |
| Average energy [kWh/day] | 1.07 | 1.11 | 1.12 |
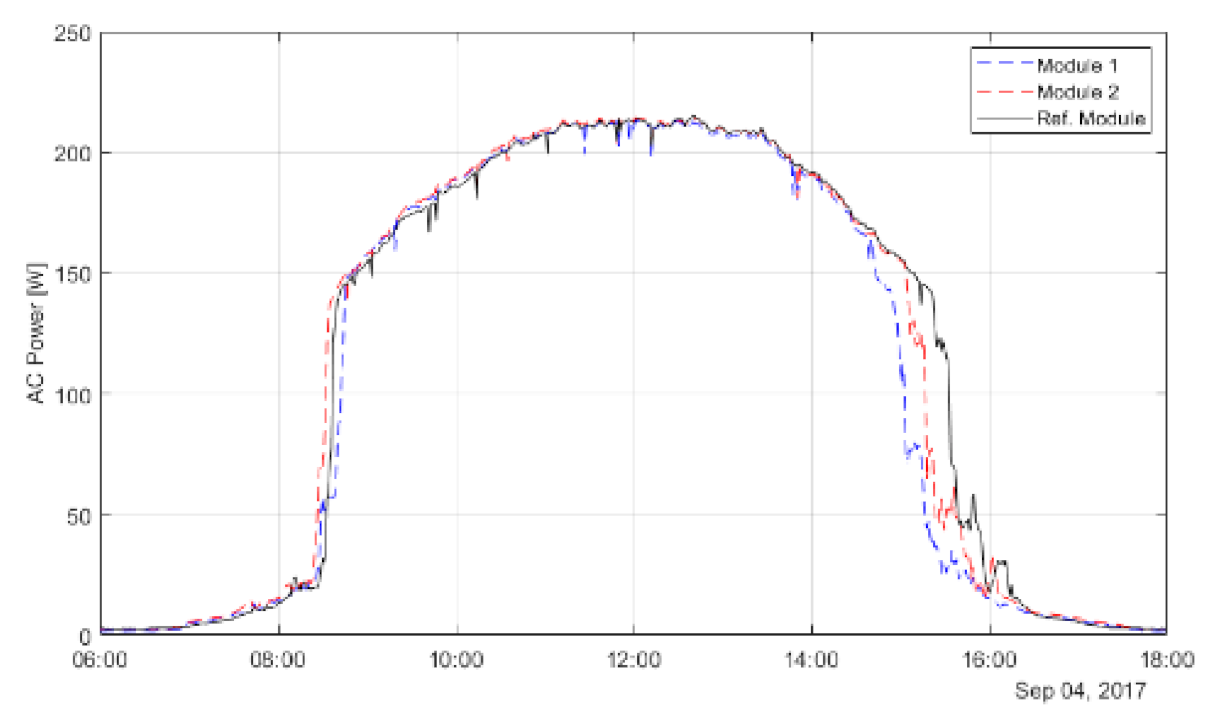
| Maximum electric power [W] | 219.18 | 220.25 | 220.59 |
| Average electric power [W] | 178.29 | 184.17 | 186.56 |
| Total energy [%/Mod. PV4] | 95.57 | 98.72 | 100 |
| Average electric power [%/Mod. PV4] | 95.57 | 98.72 | 100 |
| Month | Period | Average Daily Temperature [°C] |
|---|---|---|
| 01 | 31 December 2017–27 January 2018 | 17–28 |
| 02 | 28 January 2018–24 February 2018 | |
| 03 | 25 February 2018–31 March 2018 | |
| 04 | 1 April 2018–28 April 2018 | 14–24 |
| 05 | 29 April 2018–26 May 2018 | |
| 06 | 27 May 2018–30 June 2018 | |
| 07 | 1 July 2018–4 August 2018 | 10–28 |
| Day | Energy [Wh/day] | Operation [min/day] | No. of Starts | Average Flow [L/min] | Average Inlet Water Temp. [°C] | Average Outlet Water Temp. [°C] | Average Water Temp. 1.0 m3 Tank [°C] |
|---|---|---|---|---|---|---|---|
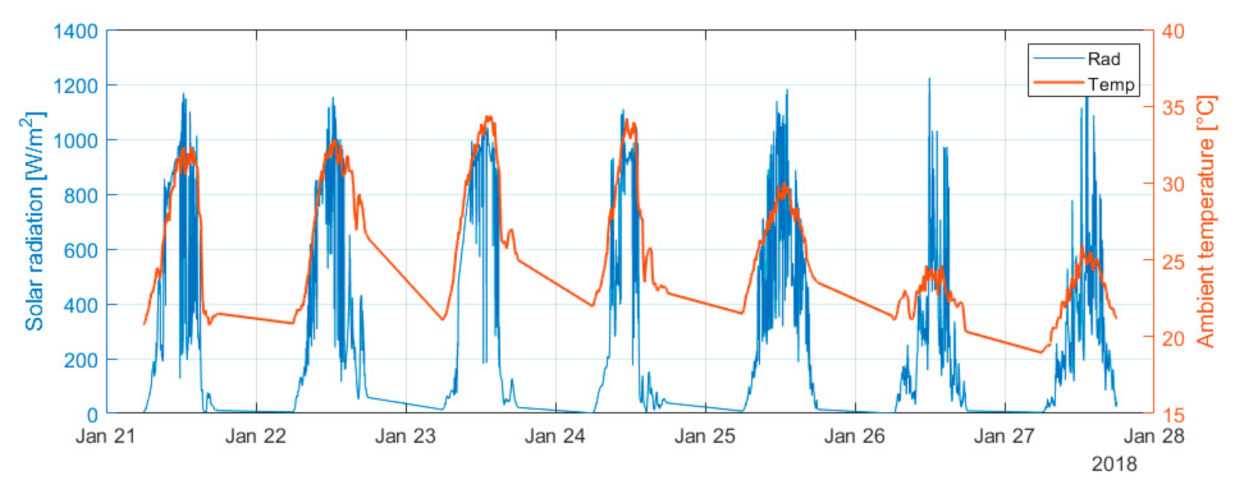
| 21 January 2018 | 277.27 | 145 | 40 | 2.42 | 31.80 | 36.81 | 28.24 |
| 22 January 2018 | 322.22 | 160 | 37 | 2.45 | 31.64 | 37.22 | 28.35 |
| 23 January 2018 | 855.86 | 262 | 25 | 3.18 | 34.22 | 37.38 | 30.74 |
| 24 January 2018 | 553.14 | 177 | 15 | 3.08 | 34.28 | 37.50 | 30.87 |
| 25 January 2018 | 173.98 | 105 | 35 | 2.54 | 31.86 | 35.37 | 29.32 |
| 26 January 2018 | 25.13 | 19 | 7 | 1.96 | 27.71 | 31.77 | 26.26 |
| 27 January 2018 | 22.29 | 19 | 7 | 2.23 | 26.64 | 32.48 | 24.15 |
Publisher’s Note: MDPI stays neutral with regard to jurisdictional claims in published maps and institutional affiliations. |
© 2021 by the authors. Licensee MDPI, Basel, Switzerland. This article is an open access article distributed under the terms and conditions of the Creative Commons Attribution (CC BY) license (http://creativecommons.org/licenses/by/4.0/).
Share and Cite
Silva, V.; Martinez, J.; Heideier, R.; Bernal, J.; Gimenes, A.; Udaeta, M.; Saidel, M. A Long-Term Analysis of the Architecture and Operation of Water Film Cooling System for Commercial PV Modules. Energies 2021, 14, 1515. https://doi.org/10.3390/en14061515
Silva V, Martinez J, Heideier R, Bernal J, Gimenes A, Udaeta M, Saidel M. A Long-Term Analysis of the Architecture and Operation of Water Film Cooling System for Commercial PV Modules. Energies. 2021; 14(6):1515. https://doi.org/10.3390/en14061515
Chicago/Turabian StyleSilva, Vinícius, Julio Martinez, Raphael Heideier, Jonathas Bernal, André Gimenes, Miguel Udaeta, and Marco Saidel. 2021. "A Long-Term Analysis of the Architecture and Operation of Water Film Cooling System for Commercial PV Modules" Energies 14, no. 6: 1515. https://doi.org/10.3390/en14061515
APA StyleSilva, V., Martinez, J., Heideier, R., Bernal, J., Gimenes, A., Udaeta, M., & Saidel, M. (2021). A Long-Term Analysis of the Architecture and Operation of Water Film Cooling System for Commercial PV Modules. Energies, 14(6), 1515. https://doi.org/10.3390/en14061515