1. Introduction
Wideband power sources are required in many applications, but one of the most demanding of them is supplying the measuring systems designed for testing of the inductive instrument transformers [
1,
2,
3,
4,
5,
6,
7,
8,
9,
10,
11,
12,
13,
14]. This is due to the fact that all the electromagnetic compatibility (EMC) requirements must not interfere with the operation of the sensitive measuring system, and simultaneously a high output power is required. This results from the nonlinearity of the magnetization characteristics of the magnetic core of the inductive instrument transformers, and the necessity to be tested in their rated operating conditions [
12,
13]. Therefore, during testing of wideband accuracy of voltage instrument transformers and dividers increases the exposure to the magnetic field from high voltage [
1,
2,
3,
4,
5,
6,
7,
8]. Additionally, the supplying of the measuring system used for testing current instrument transformers requires high immunity to the magnetic field from the high current track [
6,
7,
8,
9,
10,
11,
12,
13,
14]. Wideband testing procedures of transformation accuracy of inductive instrument transformers at harmonics of distorted current or voltage and requirements for the measuring and supplying systems are still under development [
5,
8,
9,
10,
14,
15]. The demand for such tests results from the low power quality of current and voltage in the power networks [
1,
11]. According to EU directive 2014/30/EU the electrical equipment should meet the requirements of electromagnetic compatibility [
16]. It ensures that electrical and electronic equipment does not generate, or is not affected by, electromagnetic disturbance. The wideband power sources are subject to the standard IEC 61326-1 that covers specify requirements for immunity and emission including the limits of radiated and conductive disturbances for electrical equipment, operating from the circuit being measured [
17]. In the field of conducted and radiated emission of disturbances power sources are subject to the standard EN 55011, which complies with general requirements of the standard IEC 61000-6-4 for emission in industrial environments [
18,
19].
In the paper [
20], the development of a programmable three phase AC power source is presented. It is capable of providing a stable voltage with variable amplitude and variable frequency over a wide range. Moreover, it can generate low harmonic distortion arbitrary waveforms. In the paper [
21], the response for the need for calibrators of different electrical equipment to generate non-sinusoidal voltages and currents is presented. Voltage harmonics magnitude and phase angle closed control loops enable accurate and precise adjustment of waveform parameters. The aim of this work is the development of a wideband power supply specified for laboratory testing with distorted current and voltage where the level and phase of each higher harmonics are individually selectable. One tested power source is self-made from audio power amplifier and arbitrary waveform generator and its behavior is compared with an off-the-shelf source type Chroma 61504. The application of the power source is to supply the step-up current or voltage transformer to test the wideband transformation accuracy of inductive instrument transformers [
9,
11,
12,
13,
14,
15]. The results of the EMC test of the audio power amplifier are compared with the results obtained for the off-the-shelf source. Moreover, the different modes of operation tested to find the worst condition concern the different loads and also the output frequency of the source. Furthermore, the voltage gain error and phase shift between input and output of tested power source at different frequencies are measured to determine if the input waveform composed of many harmonics is accurately reproduced.
3. Conducted and Radiated Emission Tests
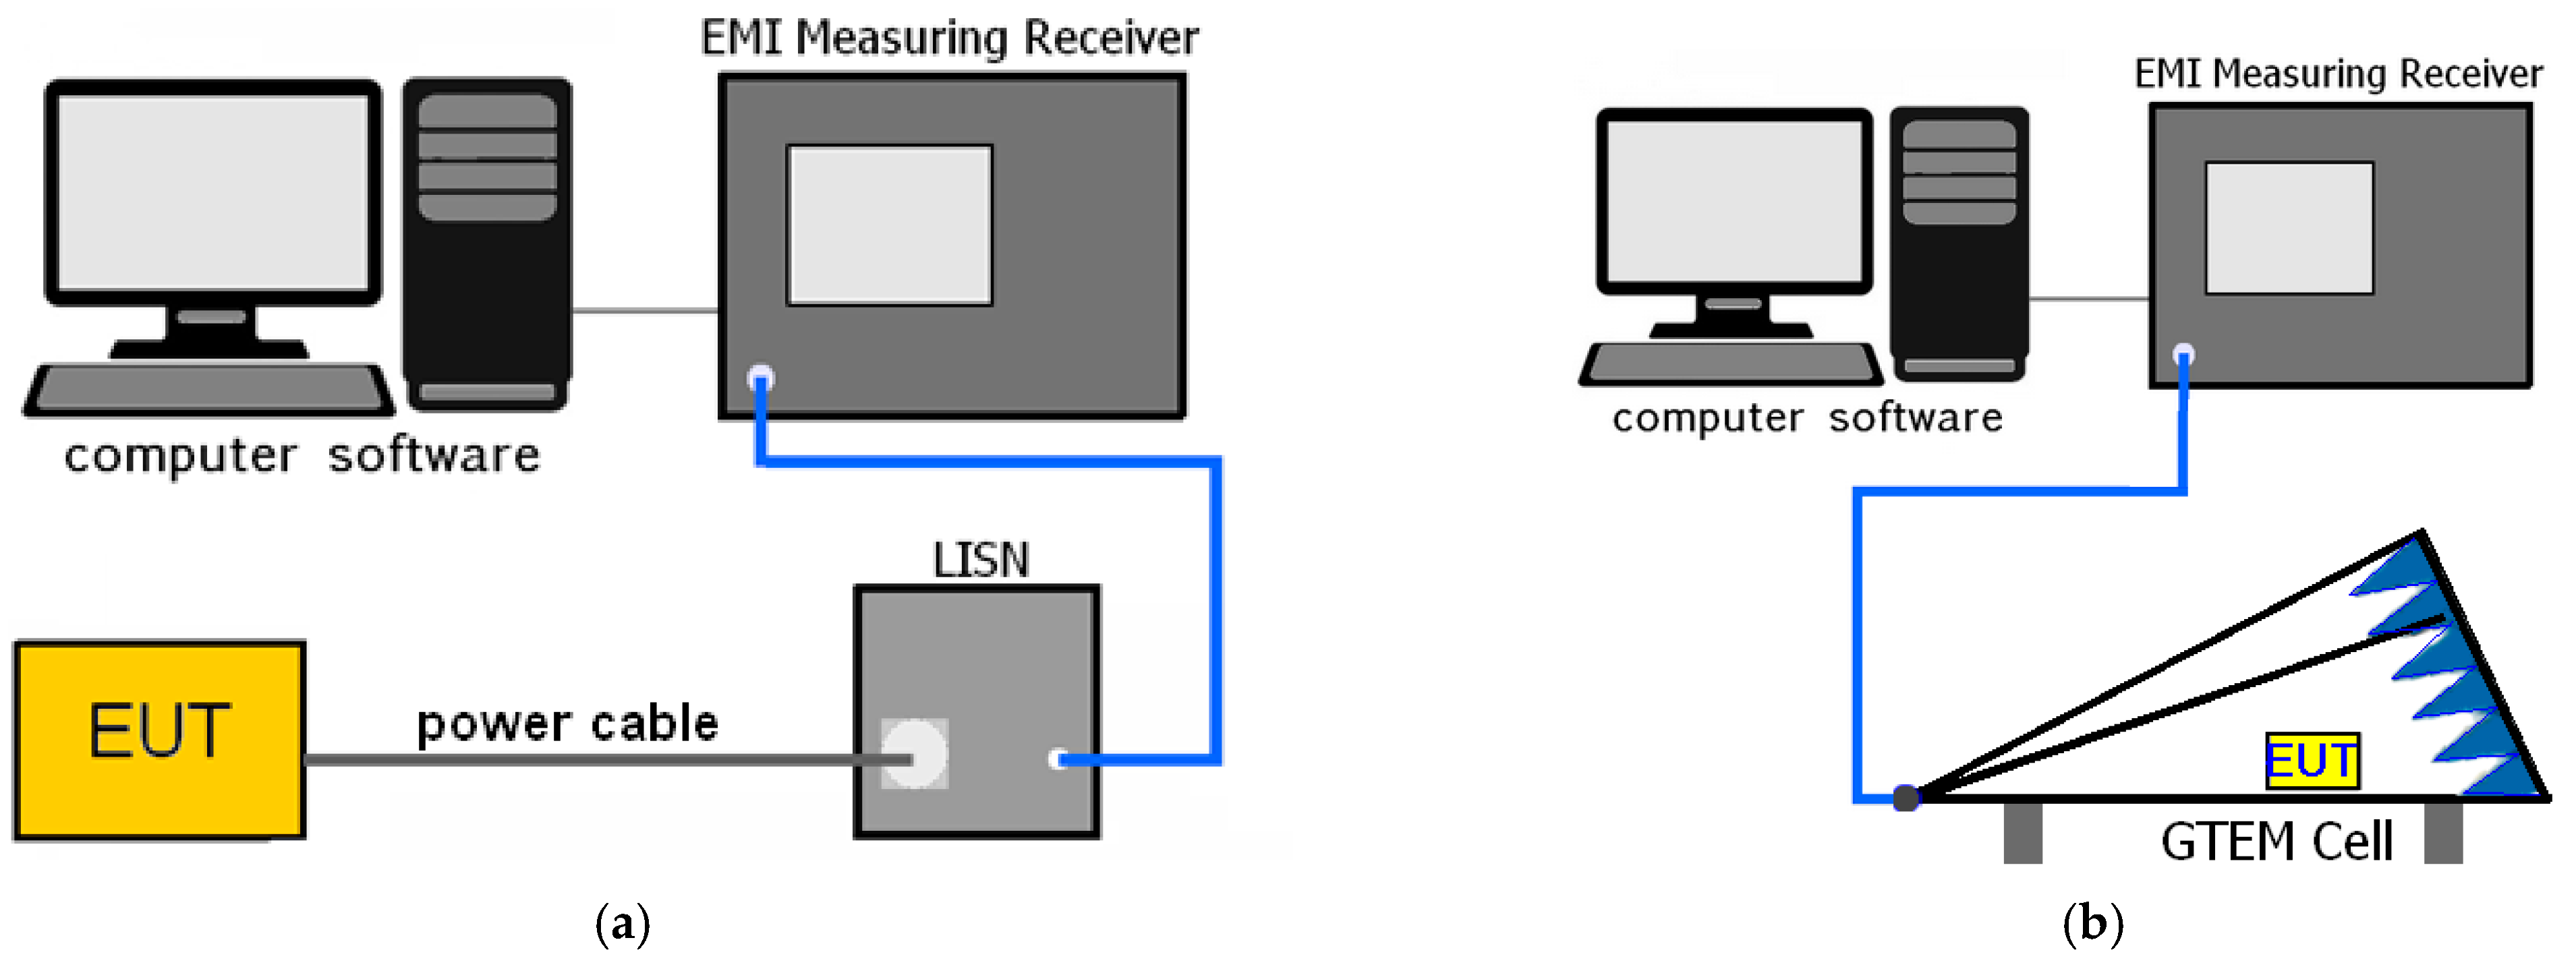
The tests in the field of electromagnetic compatibility concern measurements of the conducted emission according to the IEC 61326-1 standard in the frequencies range from 150 kHz to 30 MHz and the tests of radiated emission in the frequencies range from 30 MHz to 1 GHz [
16]. The conducted disturbance emission was tested with the use of the SMR 4503 measuring receiver, the LISN artificial network NNB-51 and a computer with COMPLIANCE-3 software version 3.90 (
Figure 1a). The emission of radiated disturbances was tested with the use of the GTEM-1000 chamber, the SMR 4503 measuring receiver and a computer with COMPLIANCE-3 software version 3.90 (
Figure 1b).
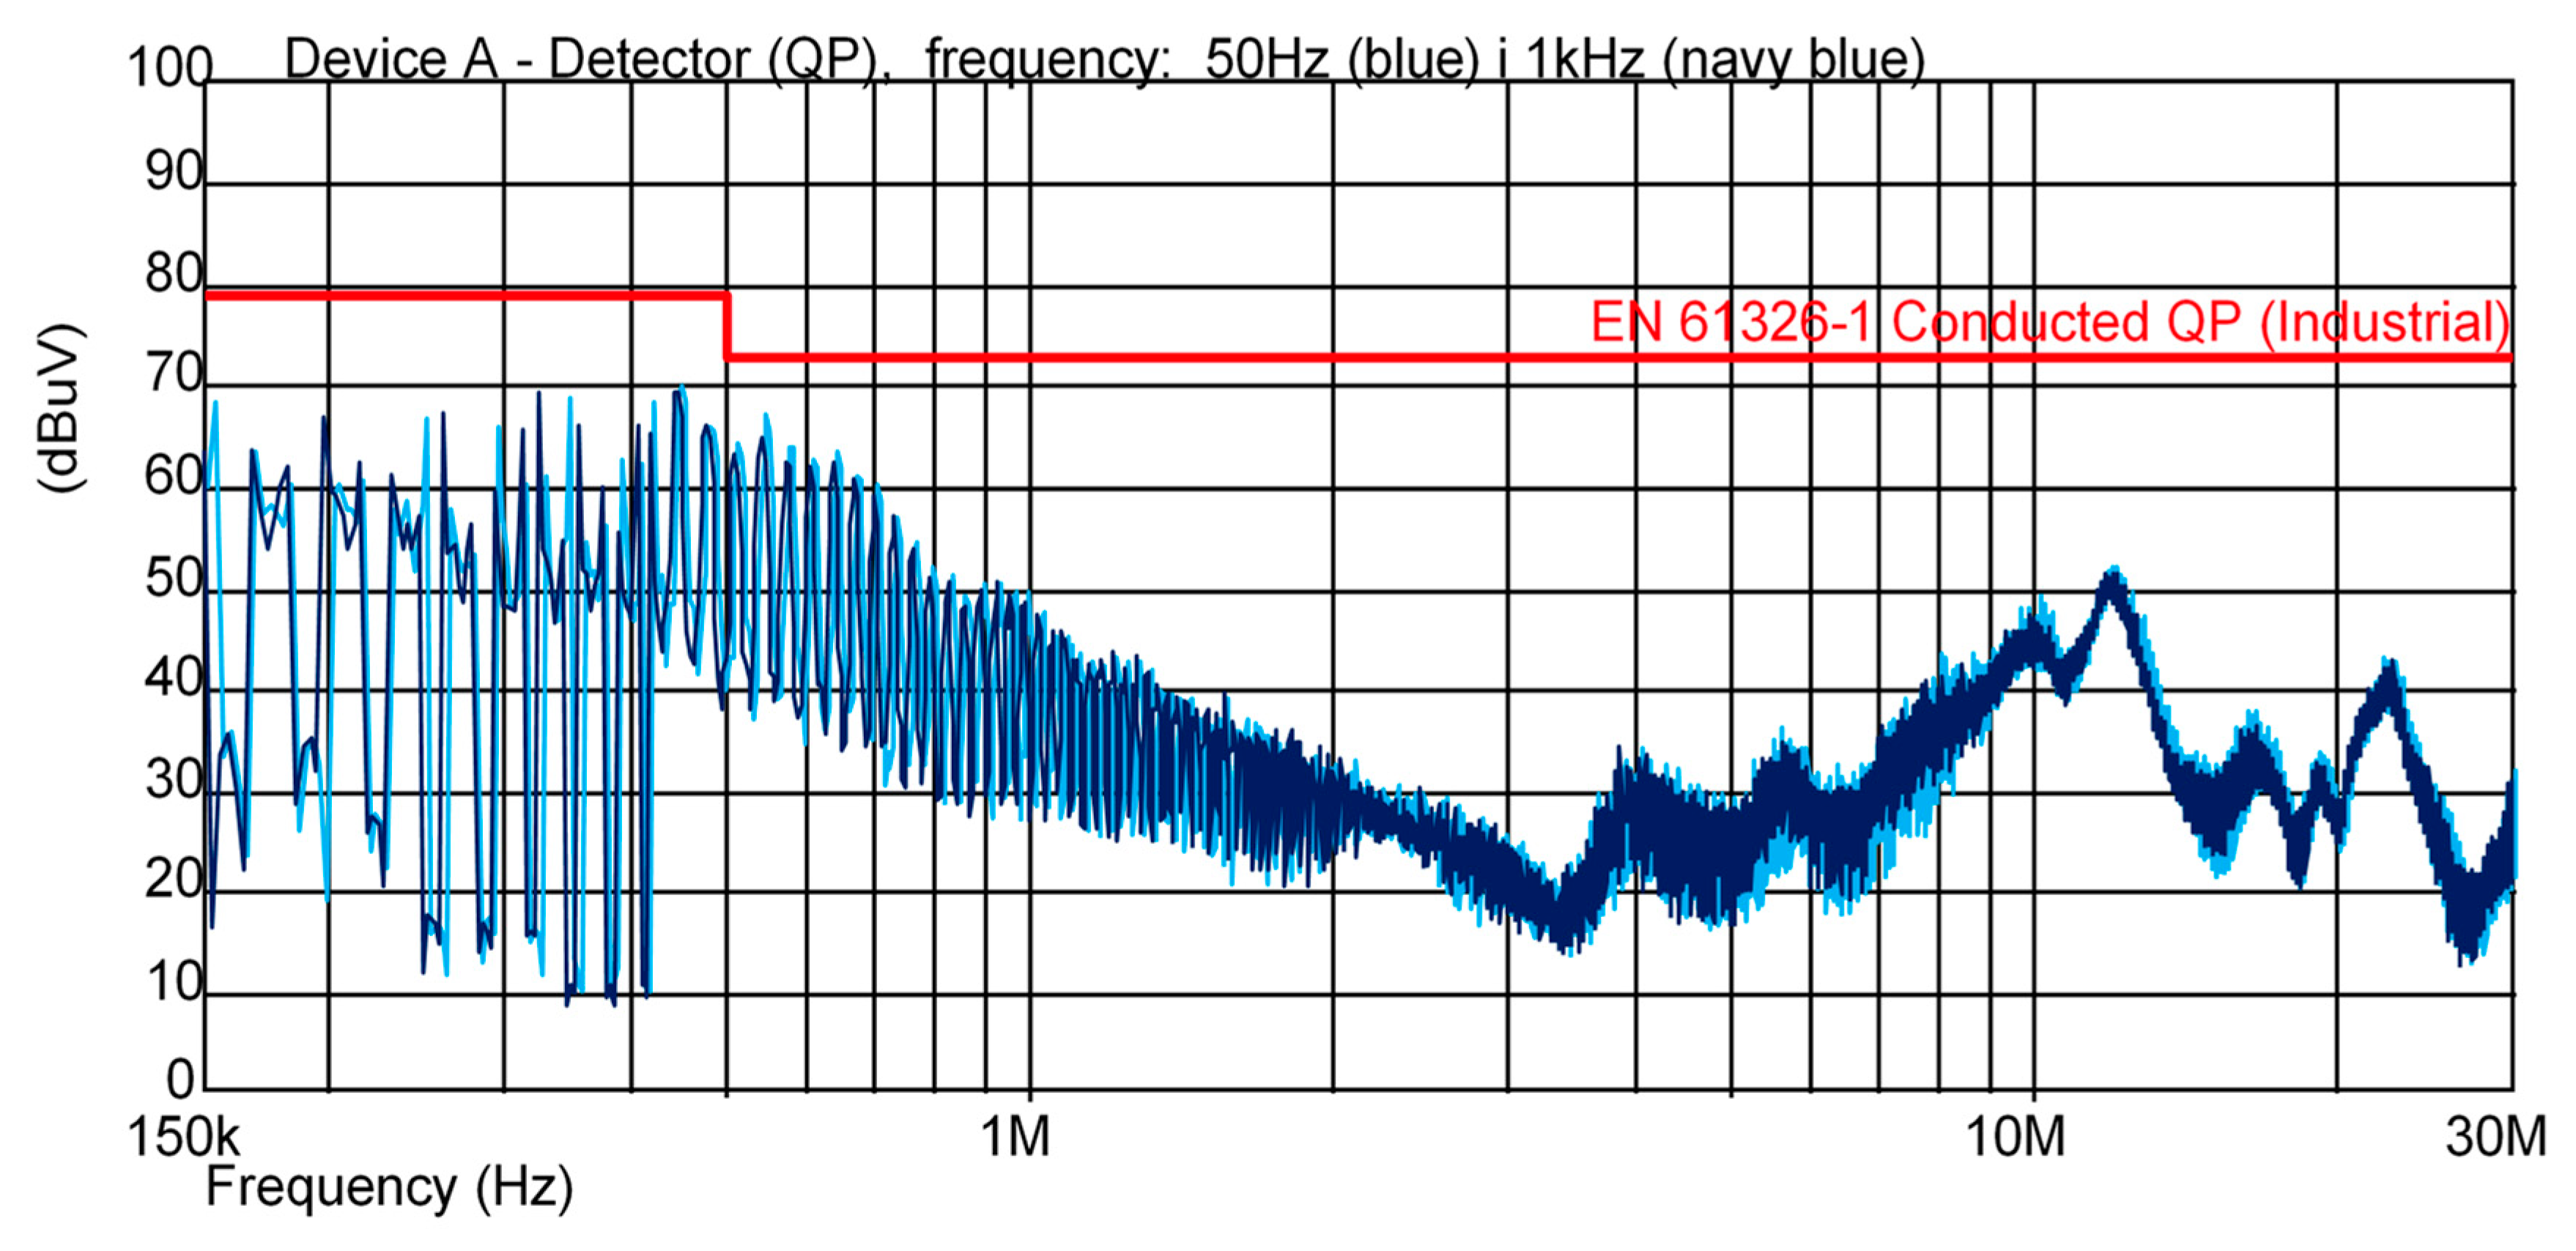
In the case of both power sources the tests were carried out to detect the influence of the frequency of generated output voltage on the conducted emission. Measurements were made for two selected frequencies: 50 and 1000 Hz. Additionally, the influence of the output power of the device on conducted emissions was examined. Measurements were made for three selected power levels: 1500, 770, 440 W. The results of the measurement are shown in
Figure 2,
Figure 3,
Figure 4 and
Figure 5. In
Figure 2 the frequency spectrum of conducted emission of PWM-based power source (device A) is presented. The frequencies of generated voltage by the device under test are equal to 50 and 1000 Hz with the value of the active load power equal to 1500 W.
The limiting values for conducted emission resulting from the standard IEC 61326-1 for the electrical equipment operating from the circuit being measured were not exceeded. Moreover, for device A, no influence of the generated frequency on the level of disturbances was observed.
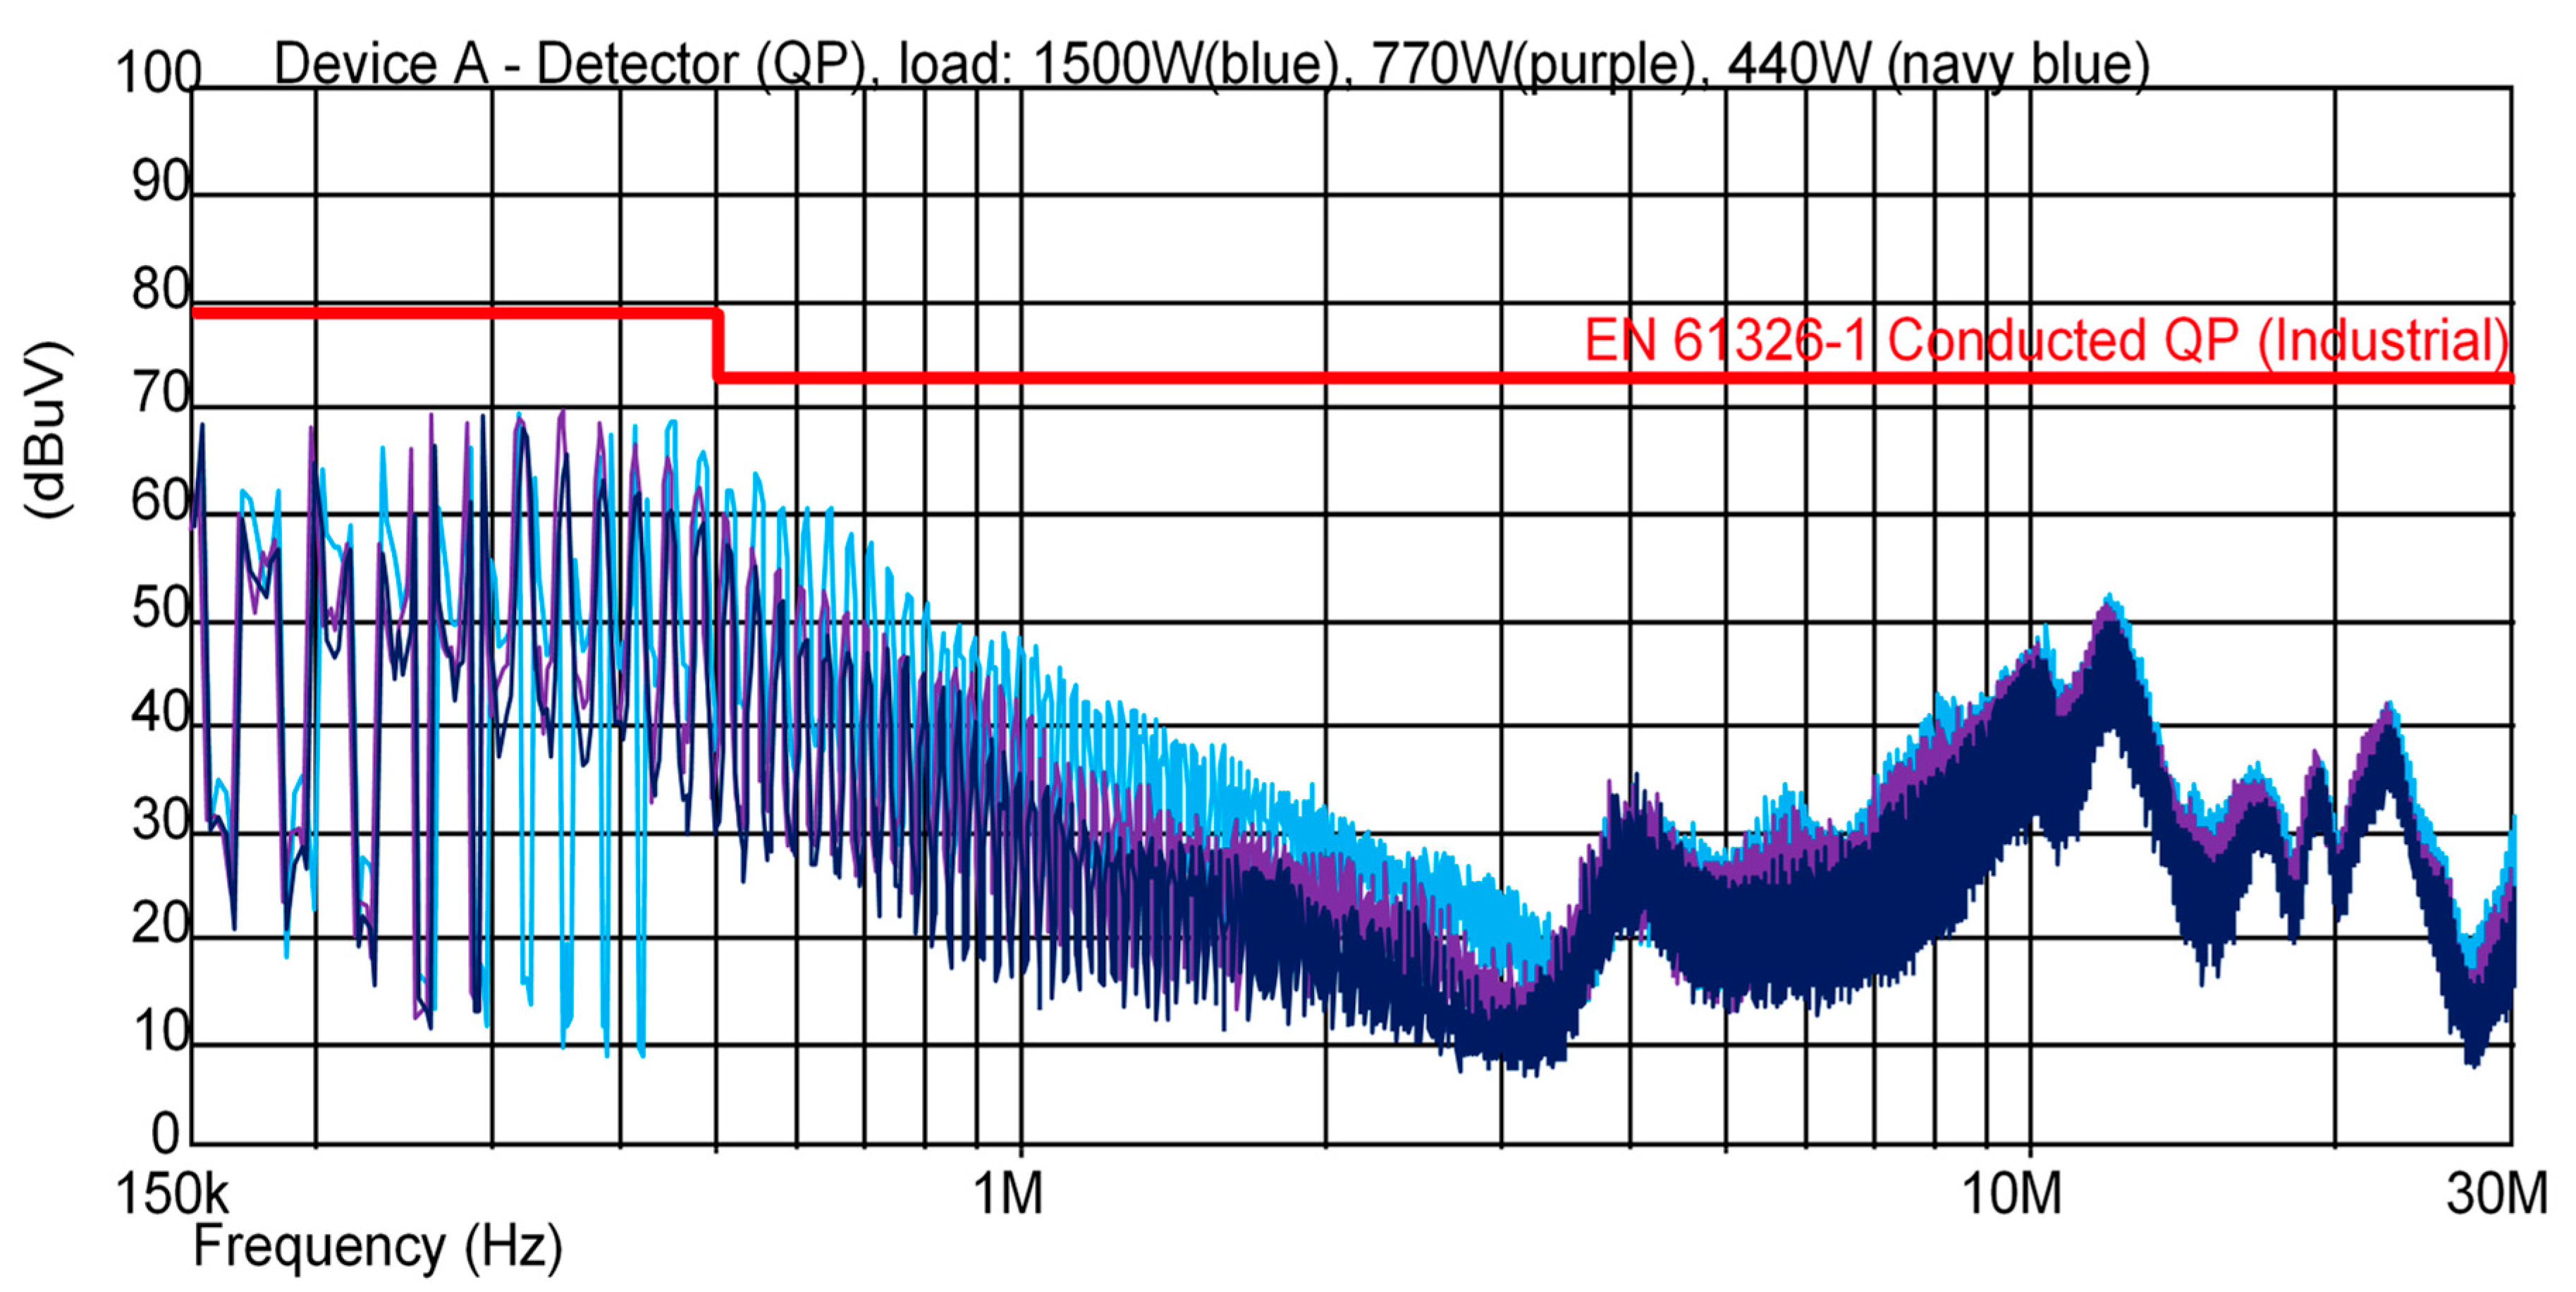
In
Figure 3 the frequency spectrum of conducted emission of PWM-based power source (device A) is presented. The frequencies of generated voltage by the device under test are equal to 50 Hz and the values of the active load power are equal to 1500, 770, and 440 W.
A decrease in the value of the output power causes a slight reduction in the level of generated conducted disturbances in the range from 400 kHz to 3 MHz by the PWM based power source.
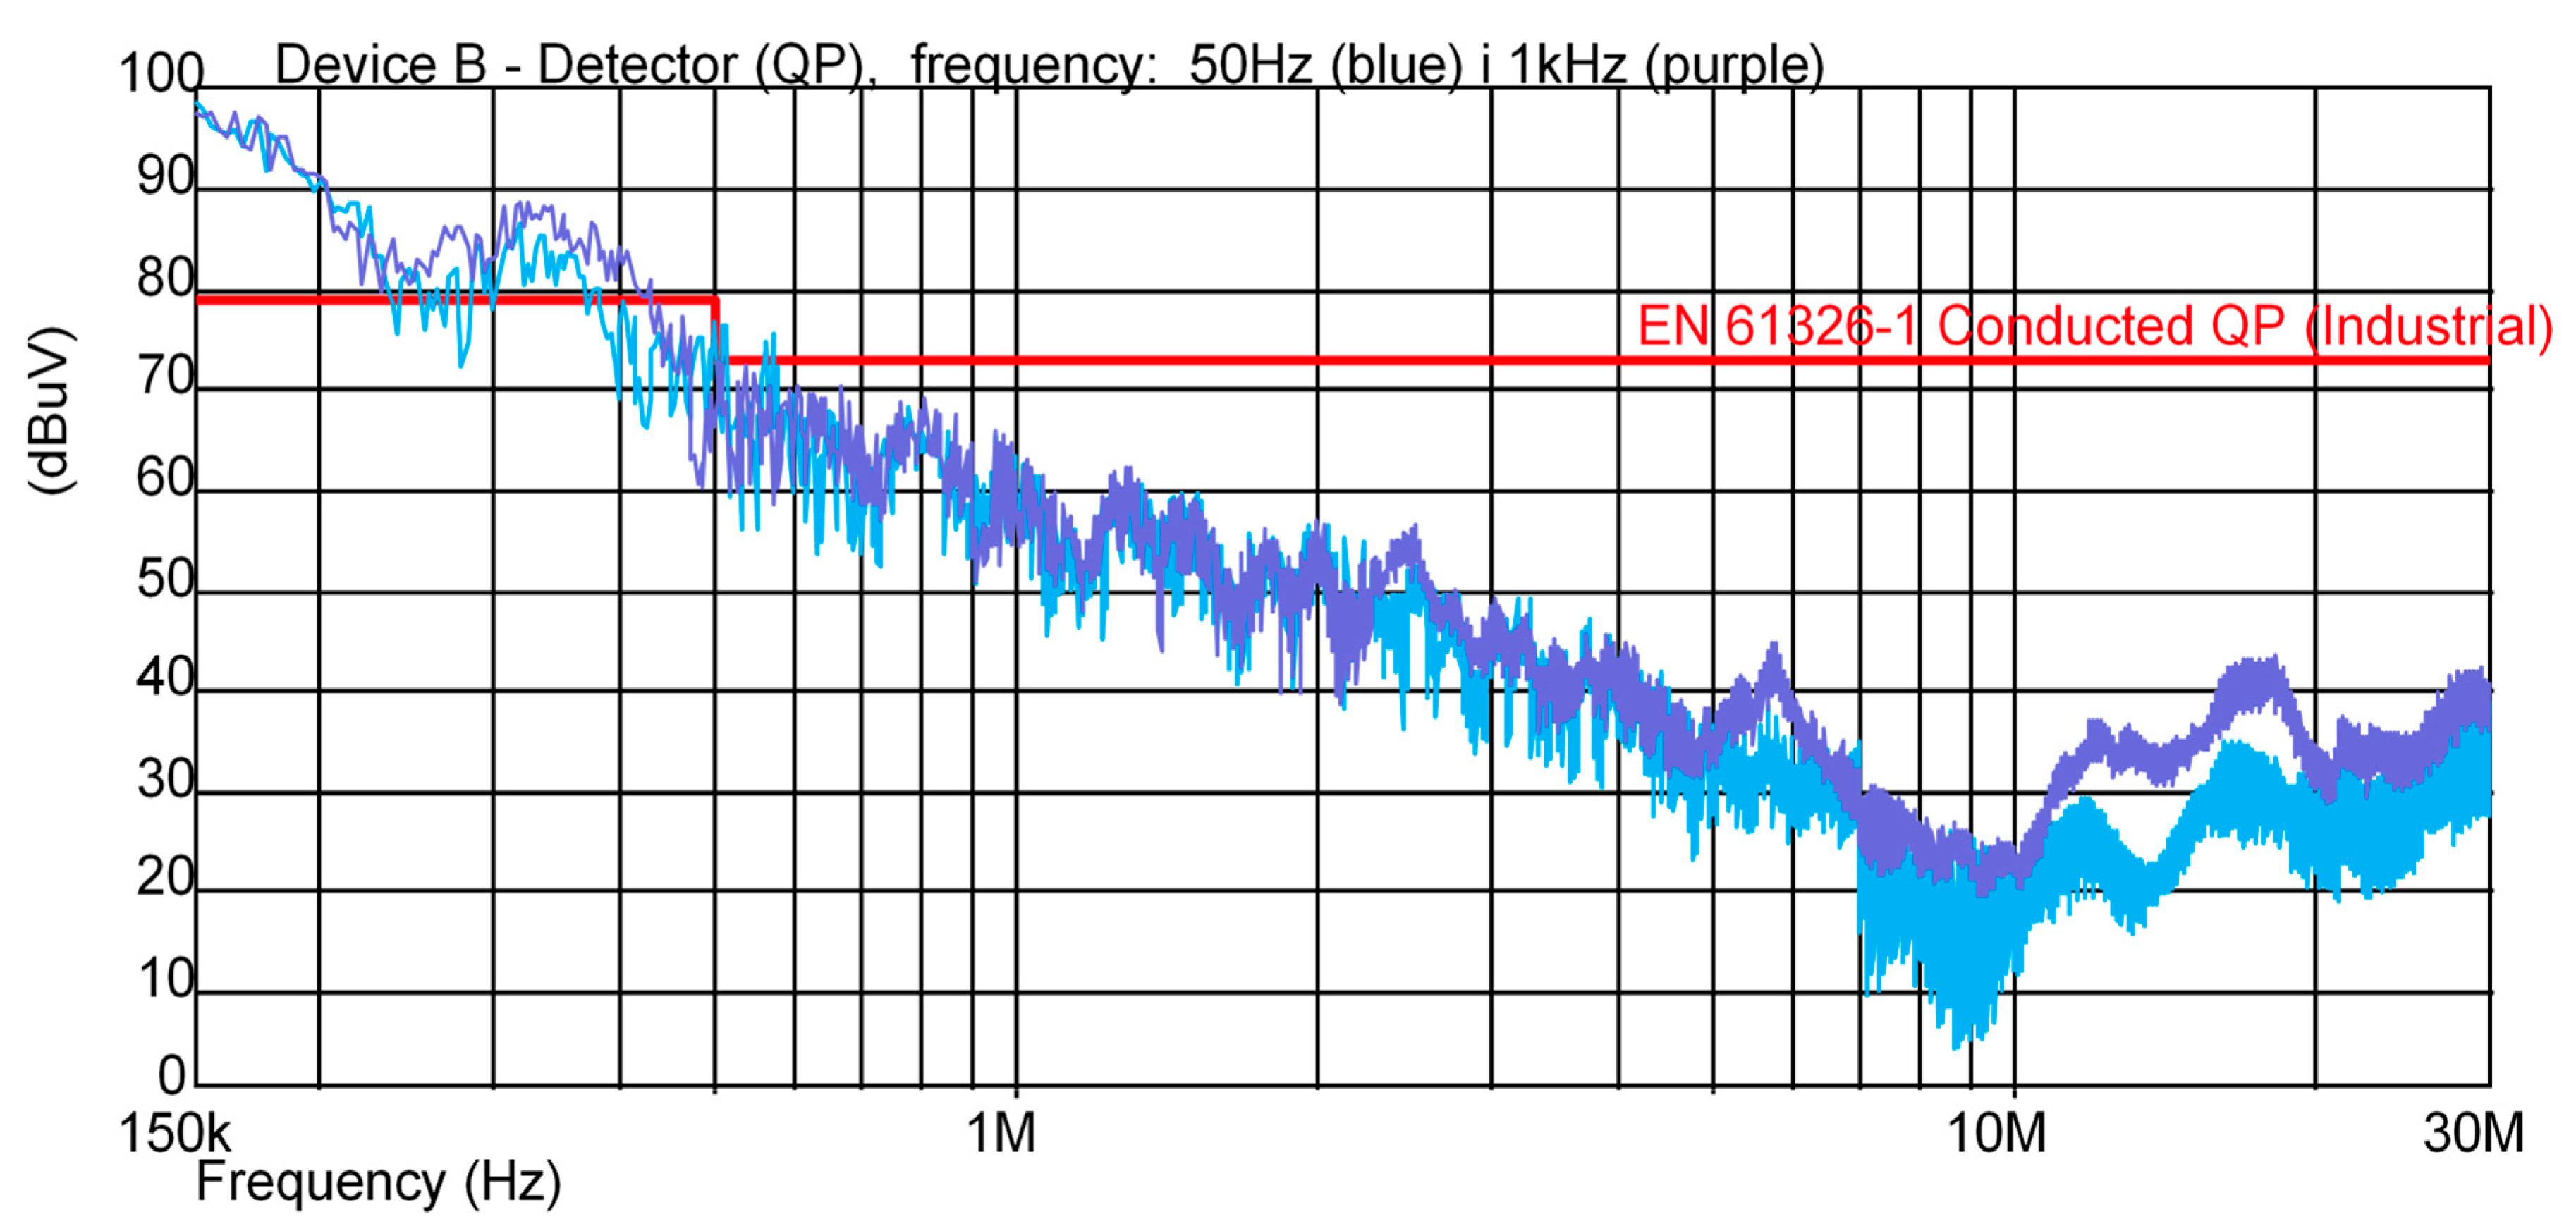
In
Figure 4, the frequency spectrum of conducted emission of the audio power amplifier (device B) is presented. The frequencies of the generated output voltage by the device under test are equal to 50 and 1000 Hz with output load active power equal to 1500 W.
For device B, no influence of the frequency of generated output voltage on the level of disturbances was observed, except for the range of 10–20 MHz. The limit specified for the level of conducted disturbances in the IEC 61326-1 standard was exceeded by the audio power amplifier. It is due to the fact that the device is not equipped by the manufacturer with an appropriate EMI (electromagnetic interference) filter.
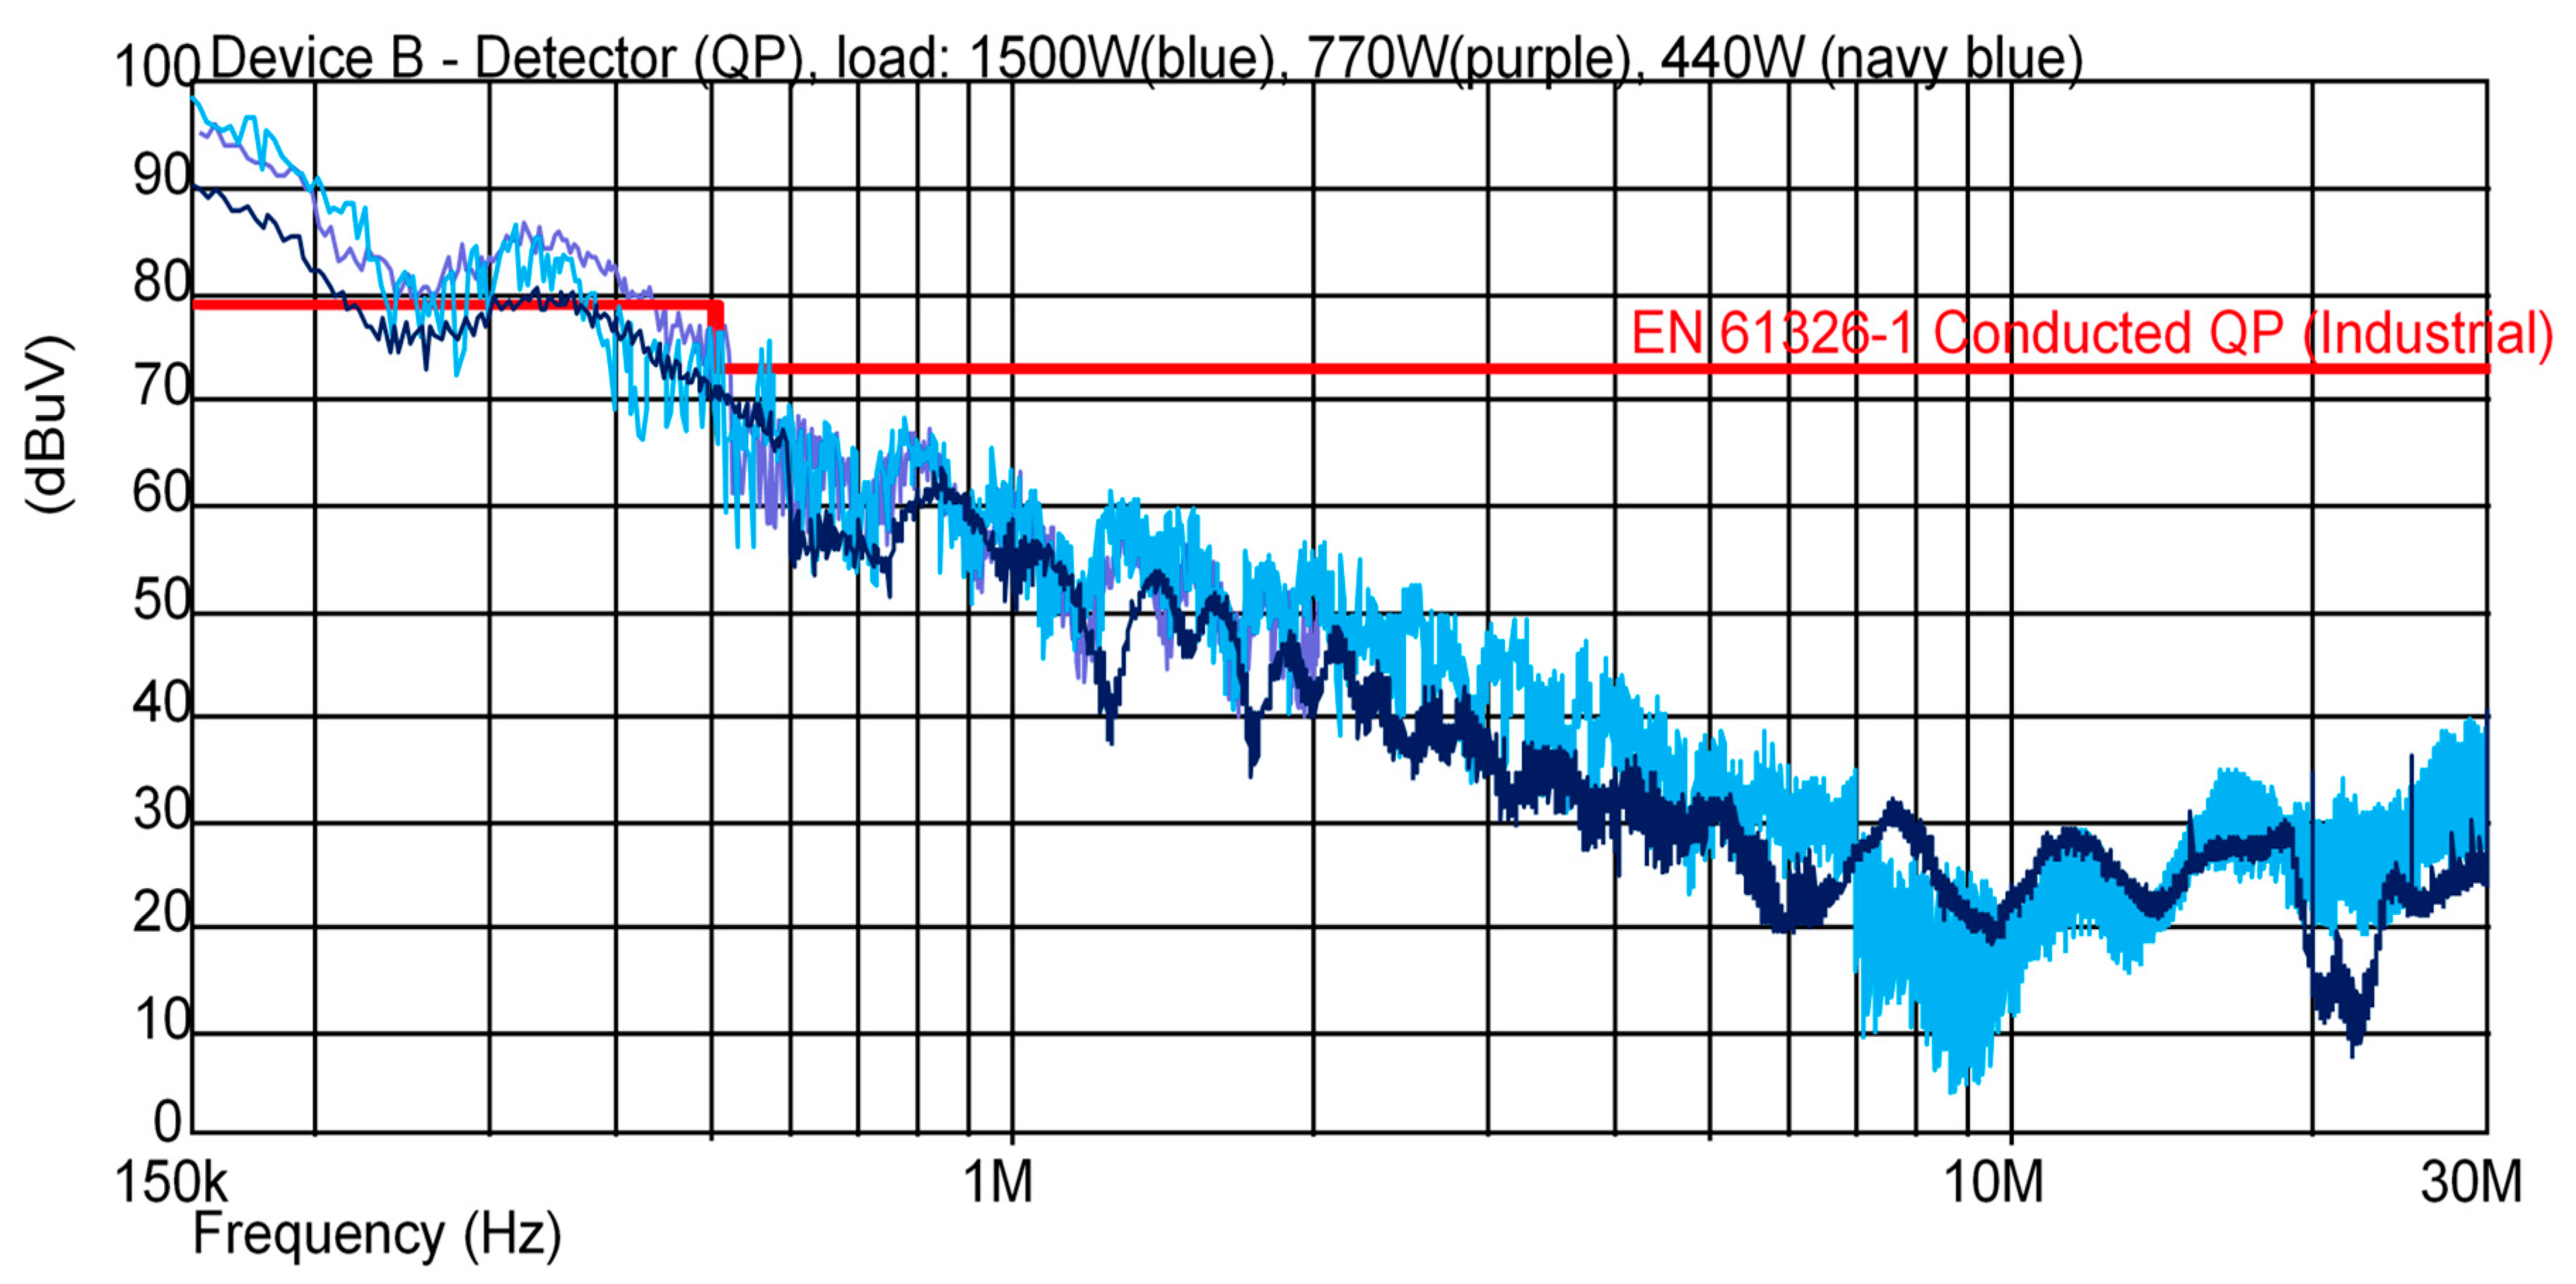
In
Figure 5, the frequency spectrum of conducted emission of the audio power amplifier (device B) is presented. The frequency of generated voltage by the device under test is equal to 50 Hz and the values of the active load power are equal to 1500, 770, and 440 W.
When the output power of device B is reduced, a decrease in the level of disturbances in the range of frequencies from 150 kHz to 30 MHz is observed, except for the range from 7 to 14 MHz.
In the case of conducted emission tests no significant influence of frequency of generated output voltage on the disturbance spectrum of both devices was observed. The results concerning the influence of the value of the output power confirm that it is an important factor in the assessment of the electromagnetic compatibility of the power sources with the requirements of the standard IEC 61326-1. Conducted disturbance emission measurements should be performed at the rated output power for which the device is designed to operate.
The radiated emission was tested for two selected frequencies of the output voltage equal to 50 and 1000 Hz with three levels of the output power: 1500, 770, and 440 W. The measurement results are shown in
Figure 6,
Figure 7,
Figure 8 and
Figure 9. In
Figure 6, the frequency spectrum of radiated emission of PWM-based power source (device A) is presented. The frequencies of the generated output voltage by the device under test are equal to 50 and 1000 Hz with the values of the active load power equal to 1500 W.
There is no detected influence of the frequency of generated output voltage on the level of radiated disturbances. The limit specified for the level of conducted disturbances in the IEC 61326-1 standard was exceeded by the PWM-based power source. The probable cause of the problem is the PWM-controlled inverter. To reduce the radiated emissions ferrite cores can be used.
In
Figure 7, the frequency spectrum of radiated emission of PWM-based power source (device A) is presented. The frequency of generated voltage by the device under test is equal to 50 Hz and the values of the active load power are equal to 1500, 770, and 440 W.
In the case when the value of the output power of the PWM-based power source is reduced a significant decrease in the level of radiated disturbances is detected.
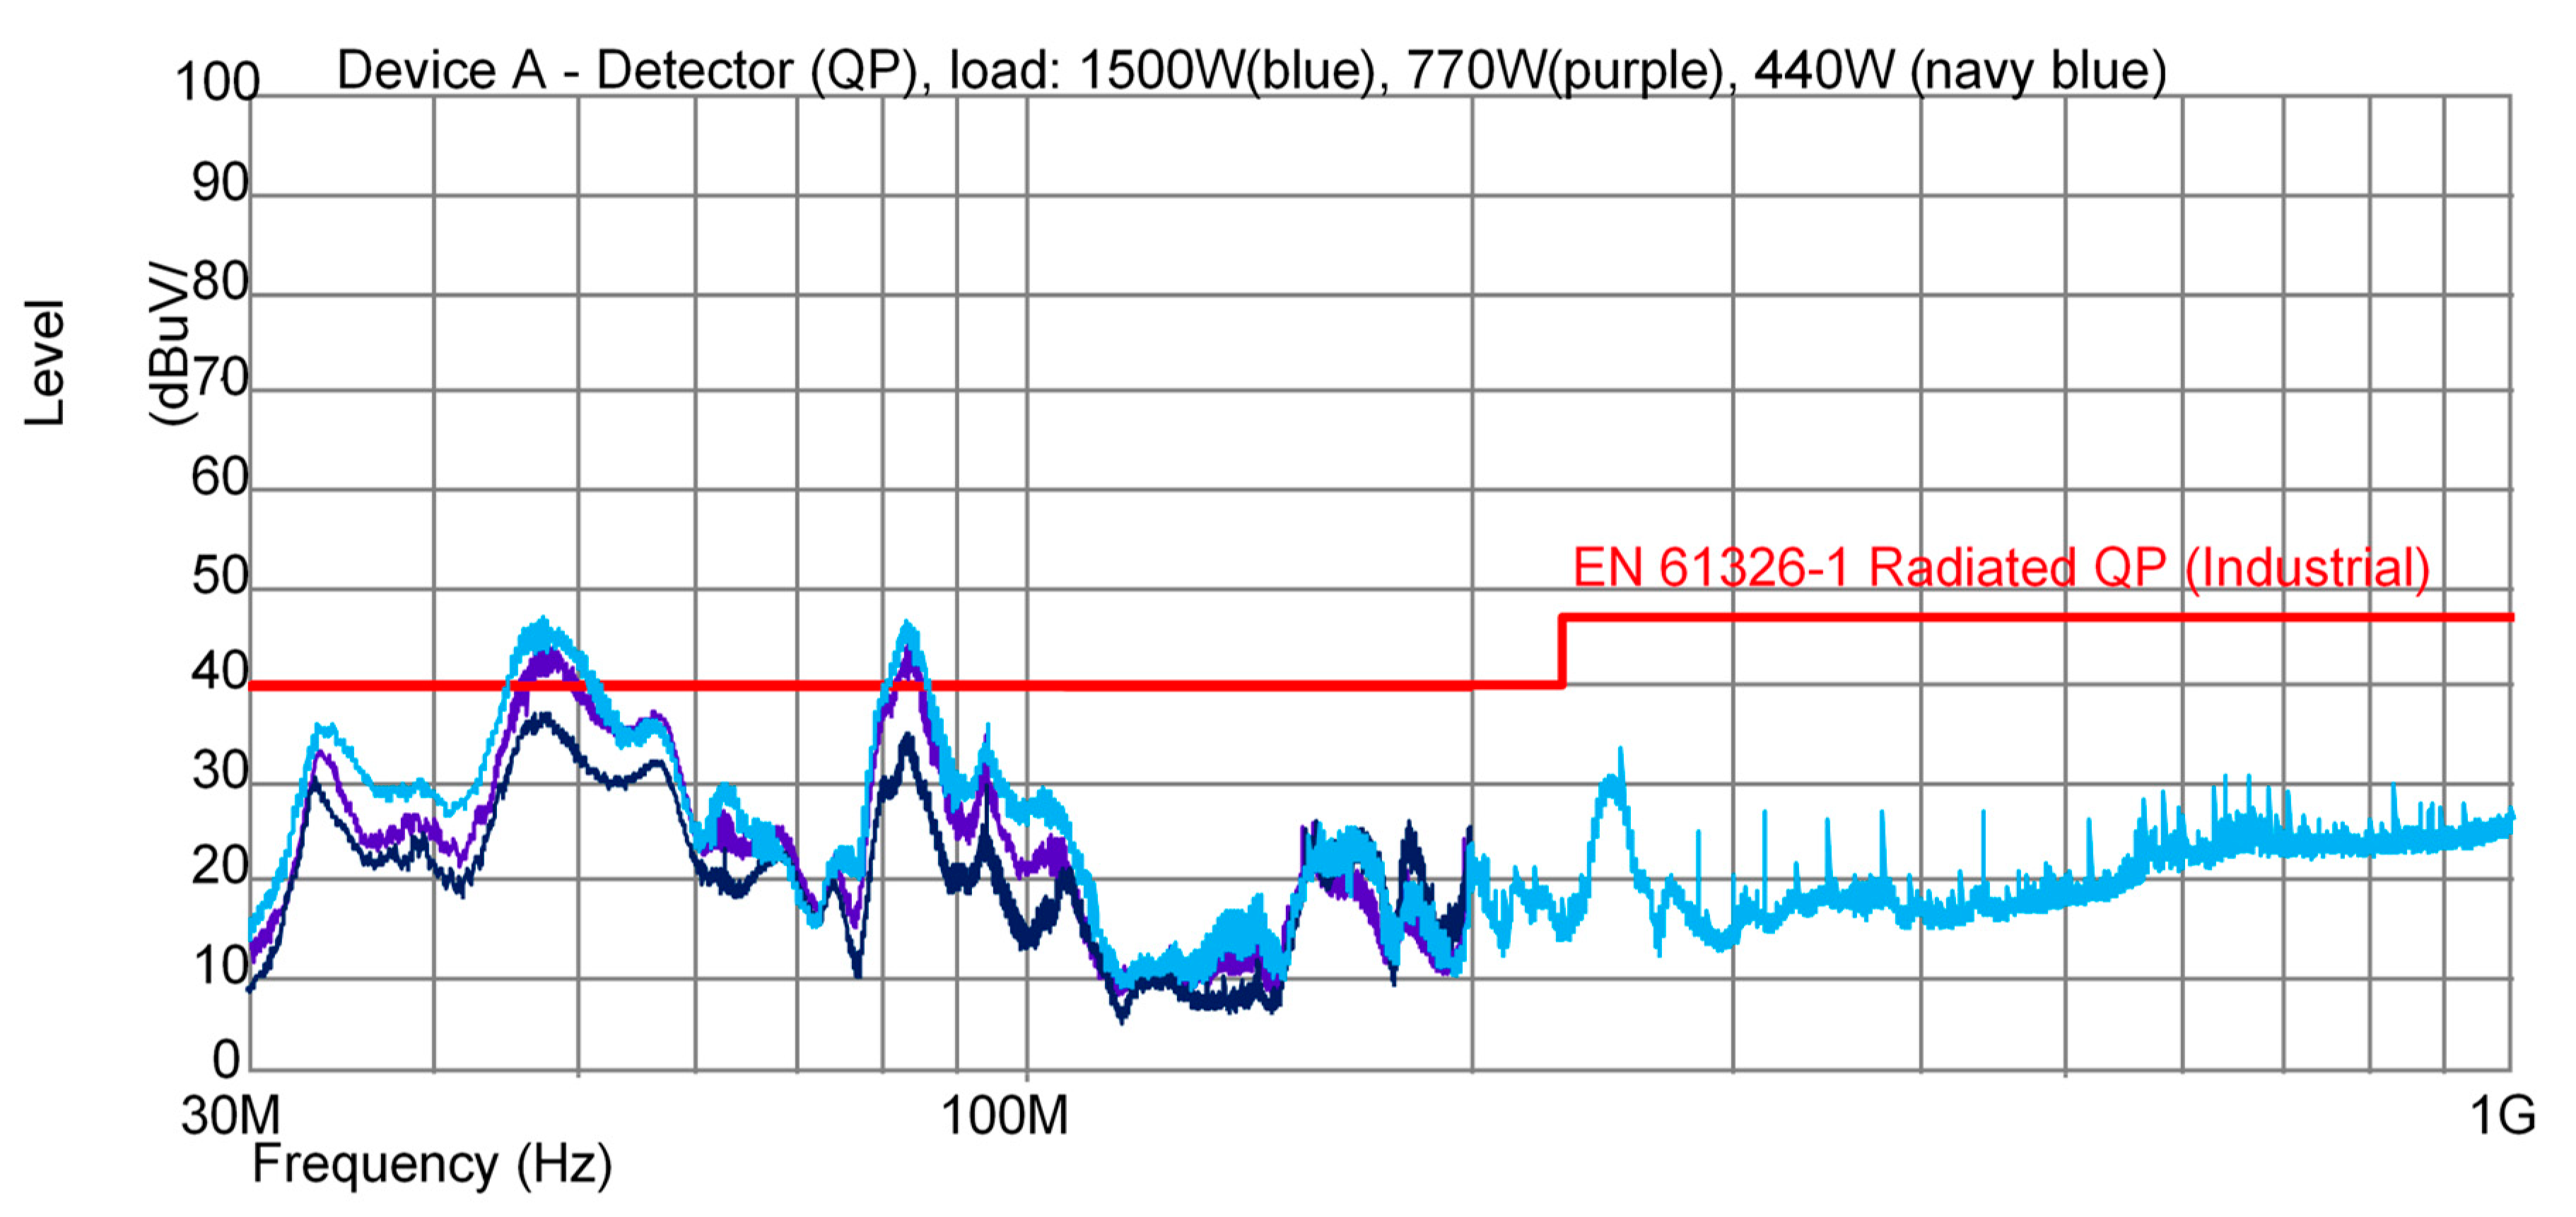
In
Figure 8, the frequency spectrum of radiated emission of an audio power amplifier (device B) is presented. The frequencies of generated voltage by the device under test are equal to 50 and 1000 Hz with active load power equal to 1500 W.
The limiting values for radiated emission resulting from the standard IEC 61326-1 for the electrical equipment operating from the circuit being measured were not exceeded. Moreover, for device B, no influence of the frequency of generated voltage on the level of disturbances is observed.
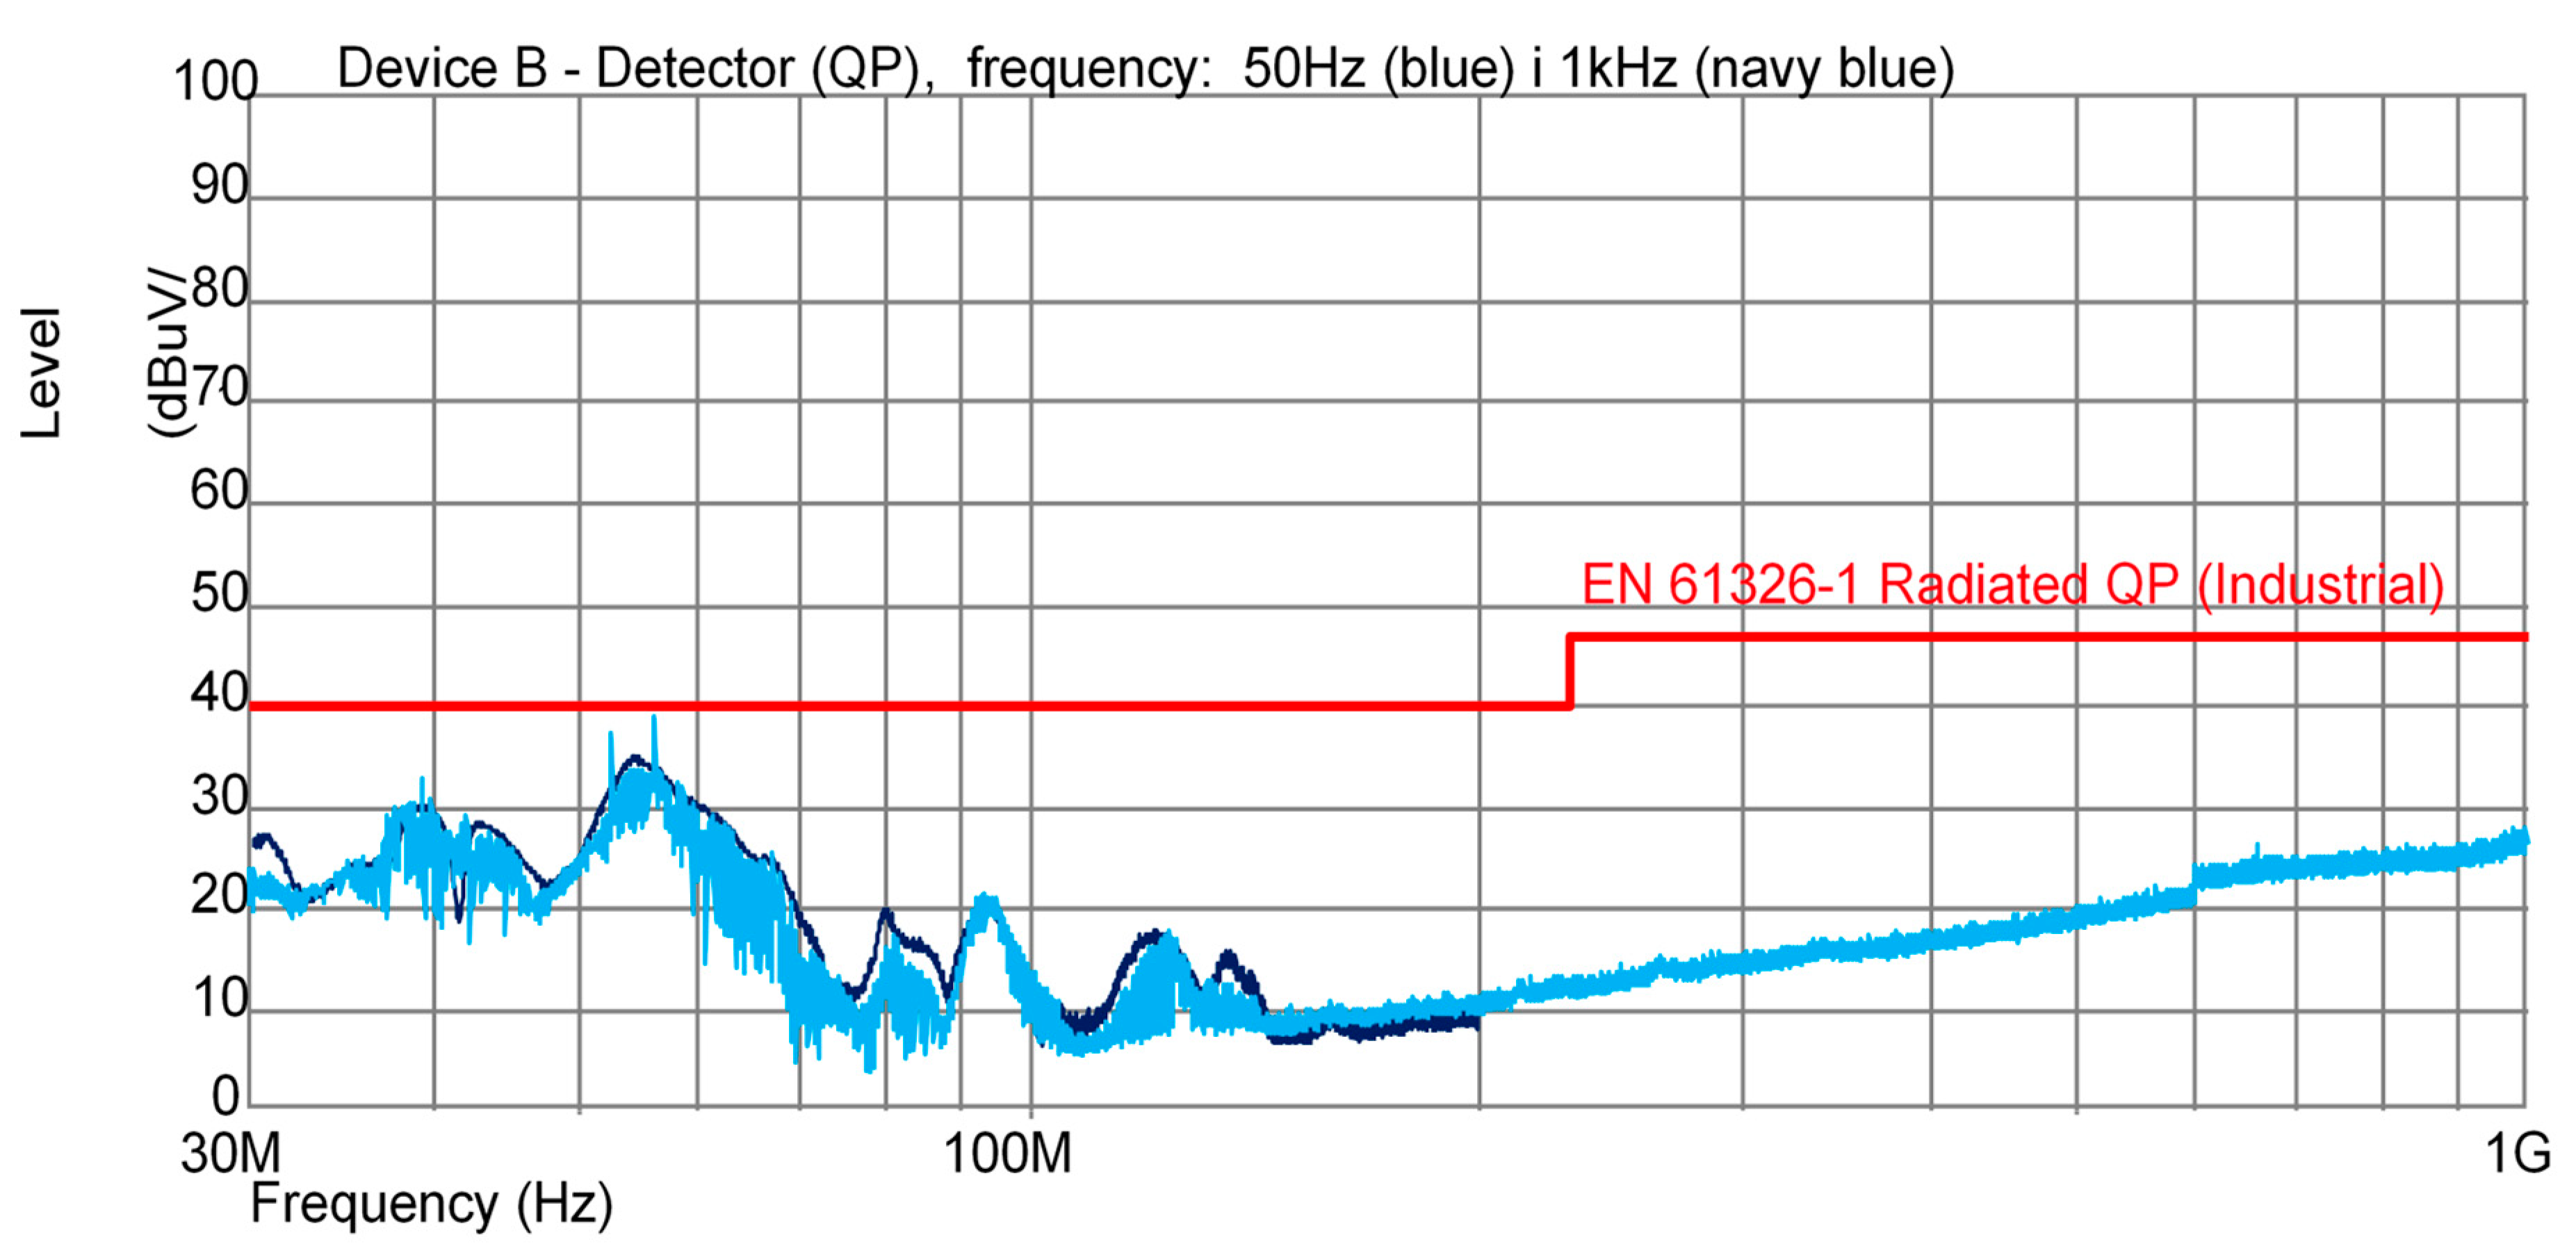
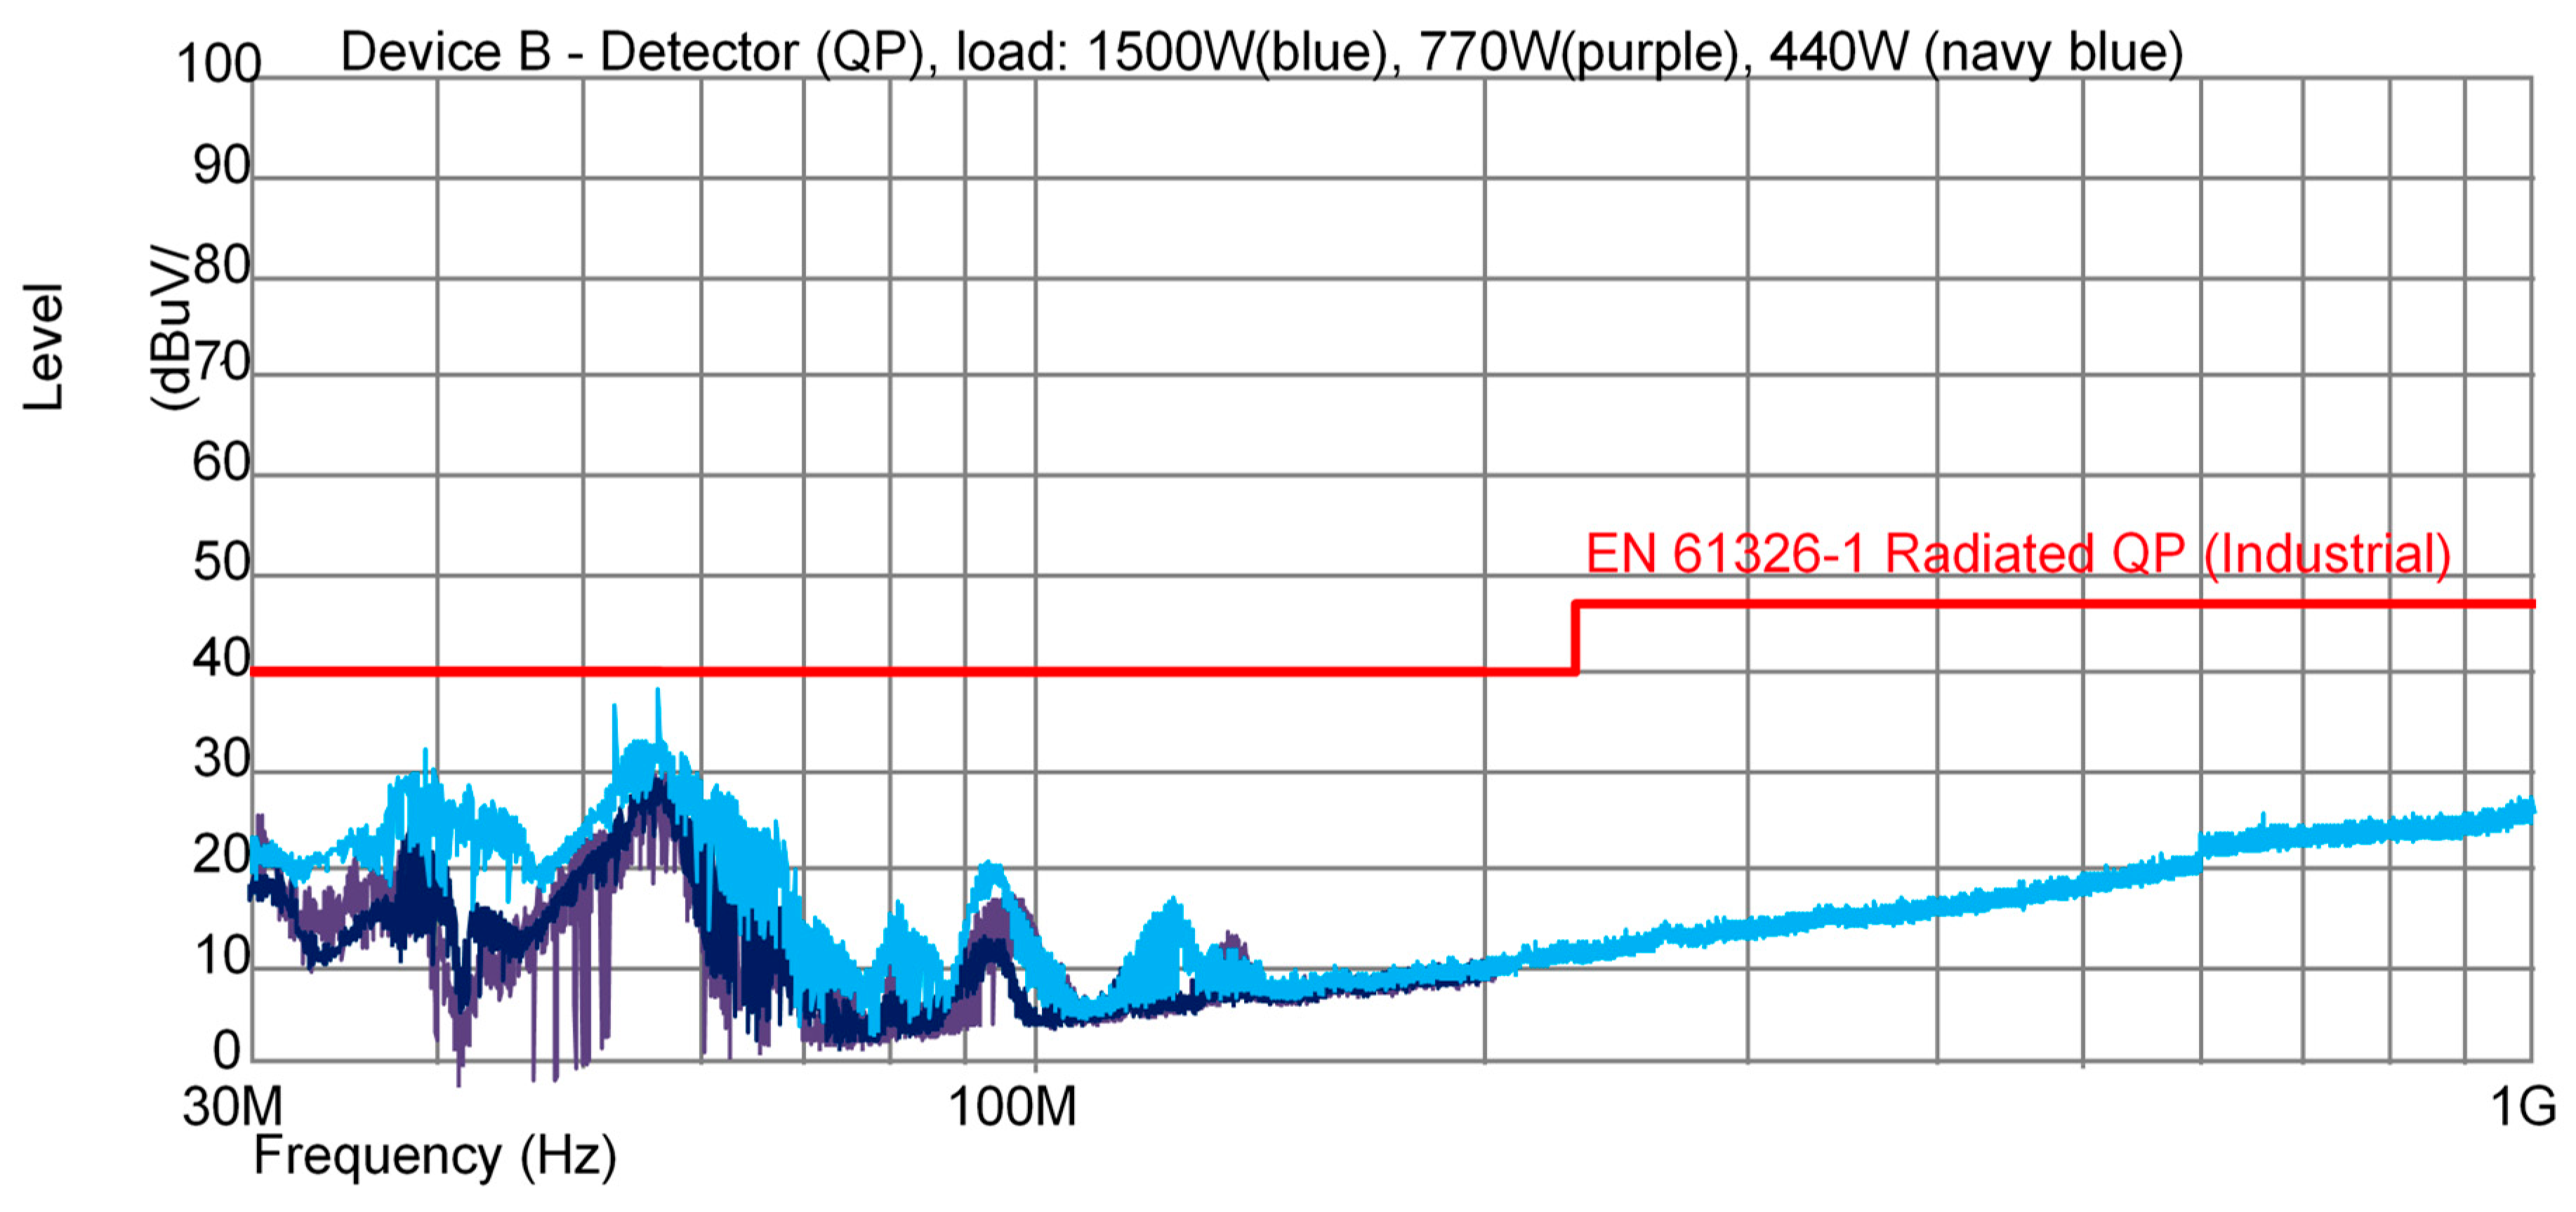
In
Figure 9, the frequency spectrum of conducted emission of an audio power amplifier (device B) is presented. The frequency of generated output voltage by the device under test is equal to 50 Hz and the values of the active load power are equal to 1500, 770, and 440 W.
Along with a decrease in the output power a significant decrease in the level of radiated disturbances is detected.
The results of the measurements of radiated emissions show as well high importance of the value of the output power of tested power source on the detected level of radiated disturbances. Therefore, the tests of compliance of the power source with the requirements of the standard IEC 61326-1 should be performed with the rated output power for which the device is designed.
4. Conducted Disturbances Tests in Frequencies Range from 100 Hz to 5 kHz
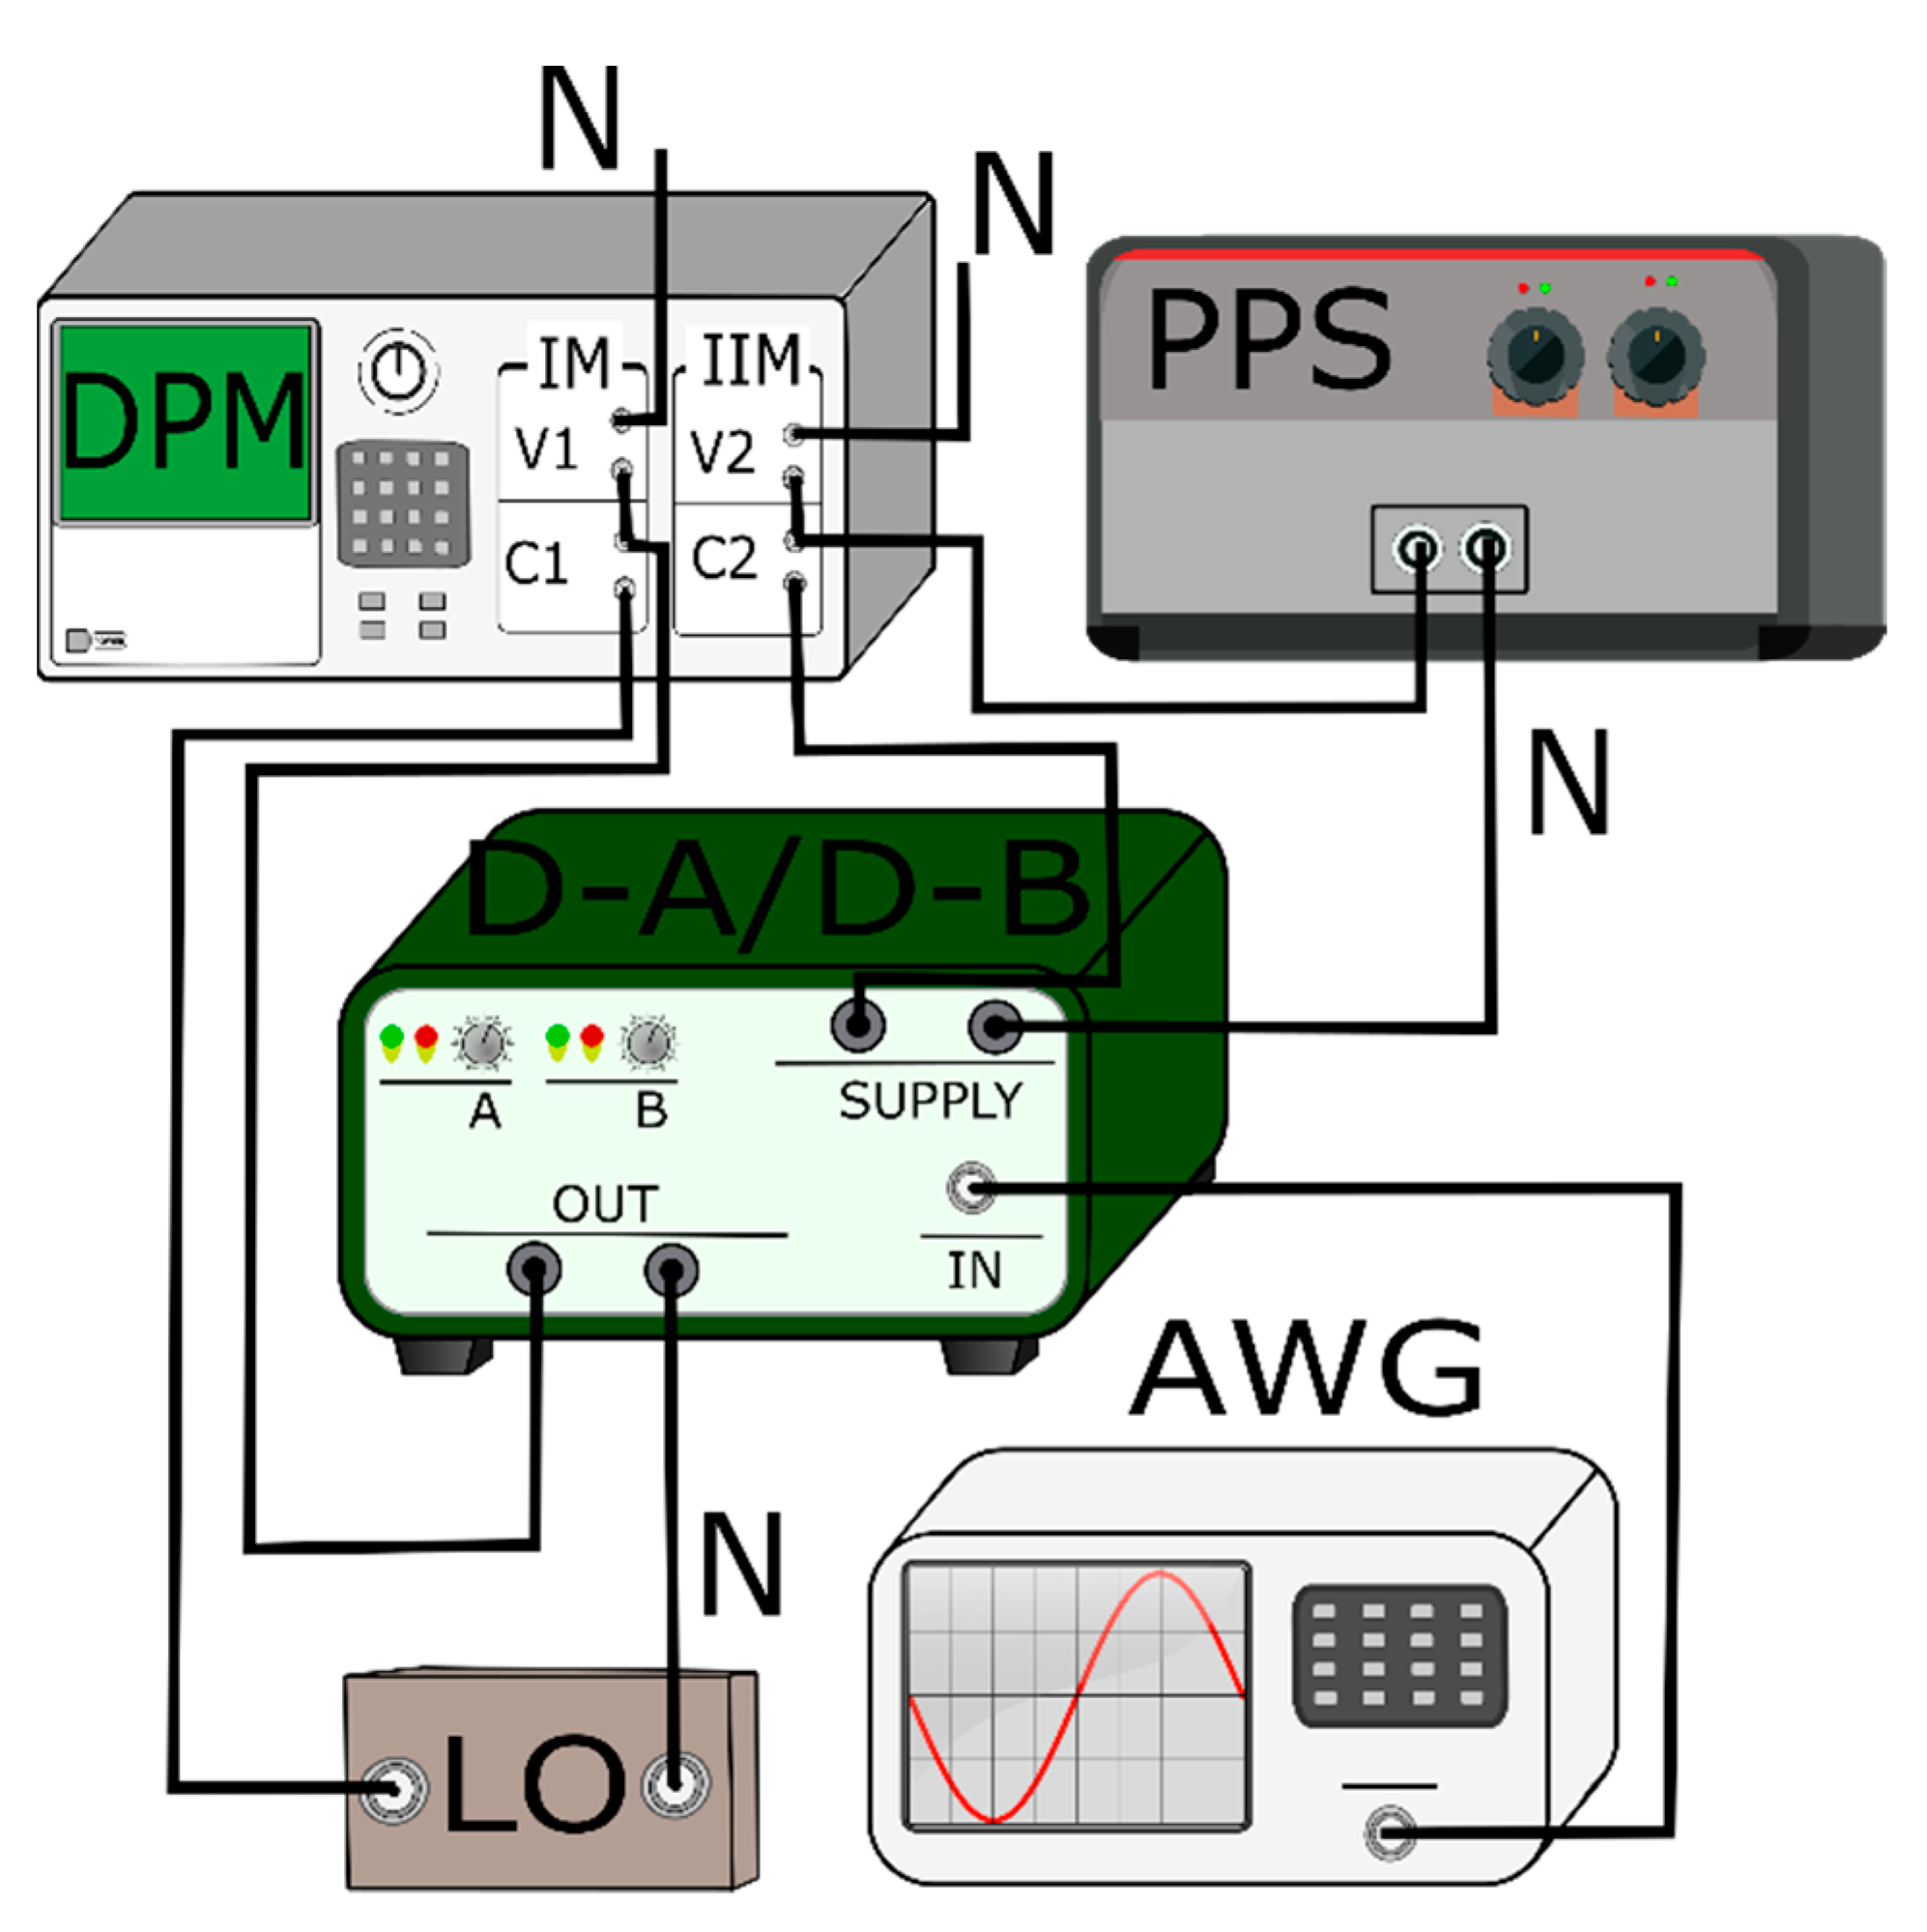
The next stage of laboratory tests aims to determine the level of conducted disturbances produced by two tested power sources in the frequency range from 100 Hz to 5 kHz. The measurements were made for inductive and resistive loads and different rms values of output current. The measuring circuit used to determine the rms values of harmonics in supplying current is presented in
Figure 10.
In
Figure 10, the following notations are used: AWG—arbitrary waveform generator, DPM—digital power meter, D-A/D-B—device A (PWM-based power source) or device B (audio power amplifier), PPS—programmable power supply, LO—load impedance of tested devices.
Utilization of the programmable power source ensures the pure sinusoidal voltage of frequency equal to 50 Hz to supply tested devices. To determine the total harmonic distortion factors (THDi) of suppling current one module of the digital power meter (DPM) is used to measure the rms values of harmonics of current and voltage. Moreover, the second module is used to measure output power to ensure the required load. In accordance with the standard IEC 50160 THDi factor may be calculated from formula [
23]:
In
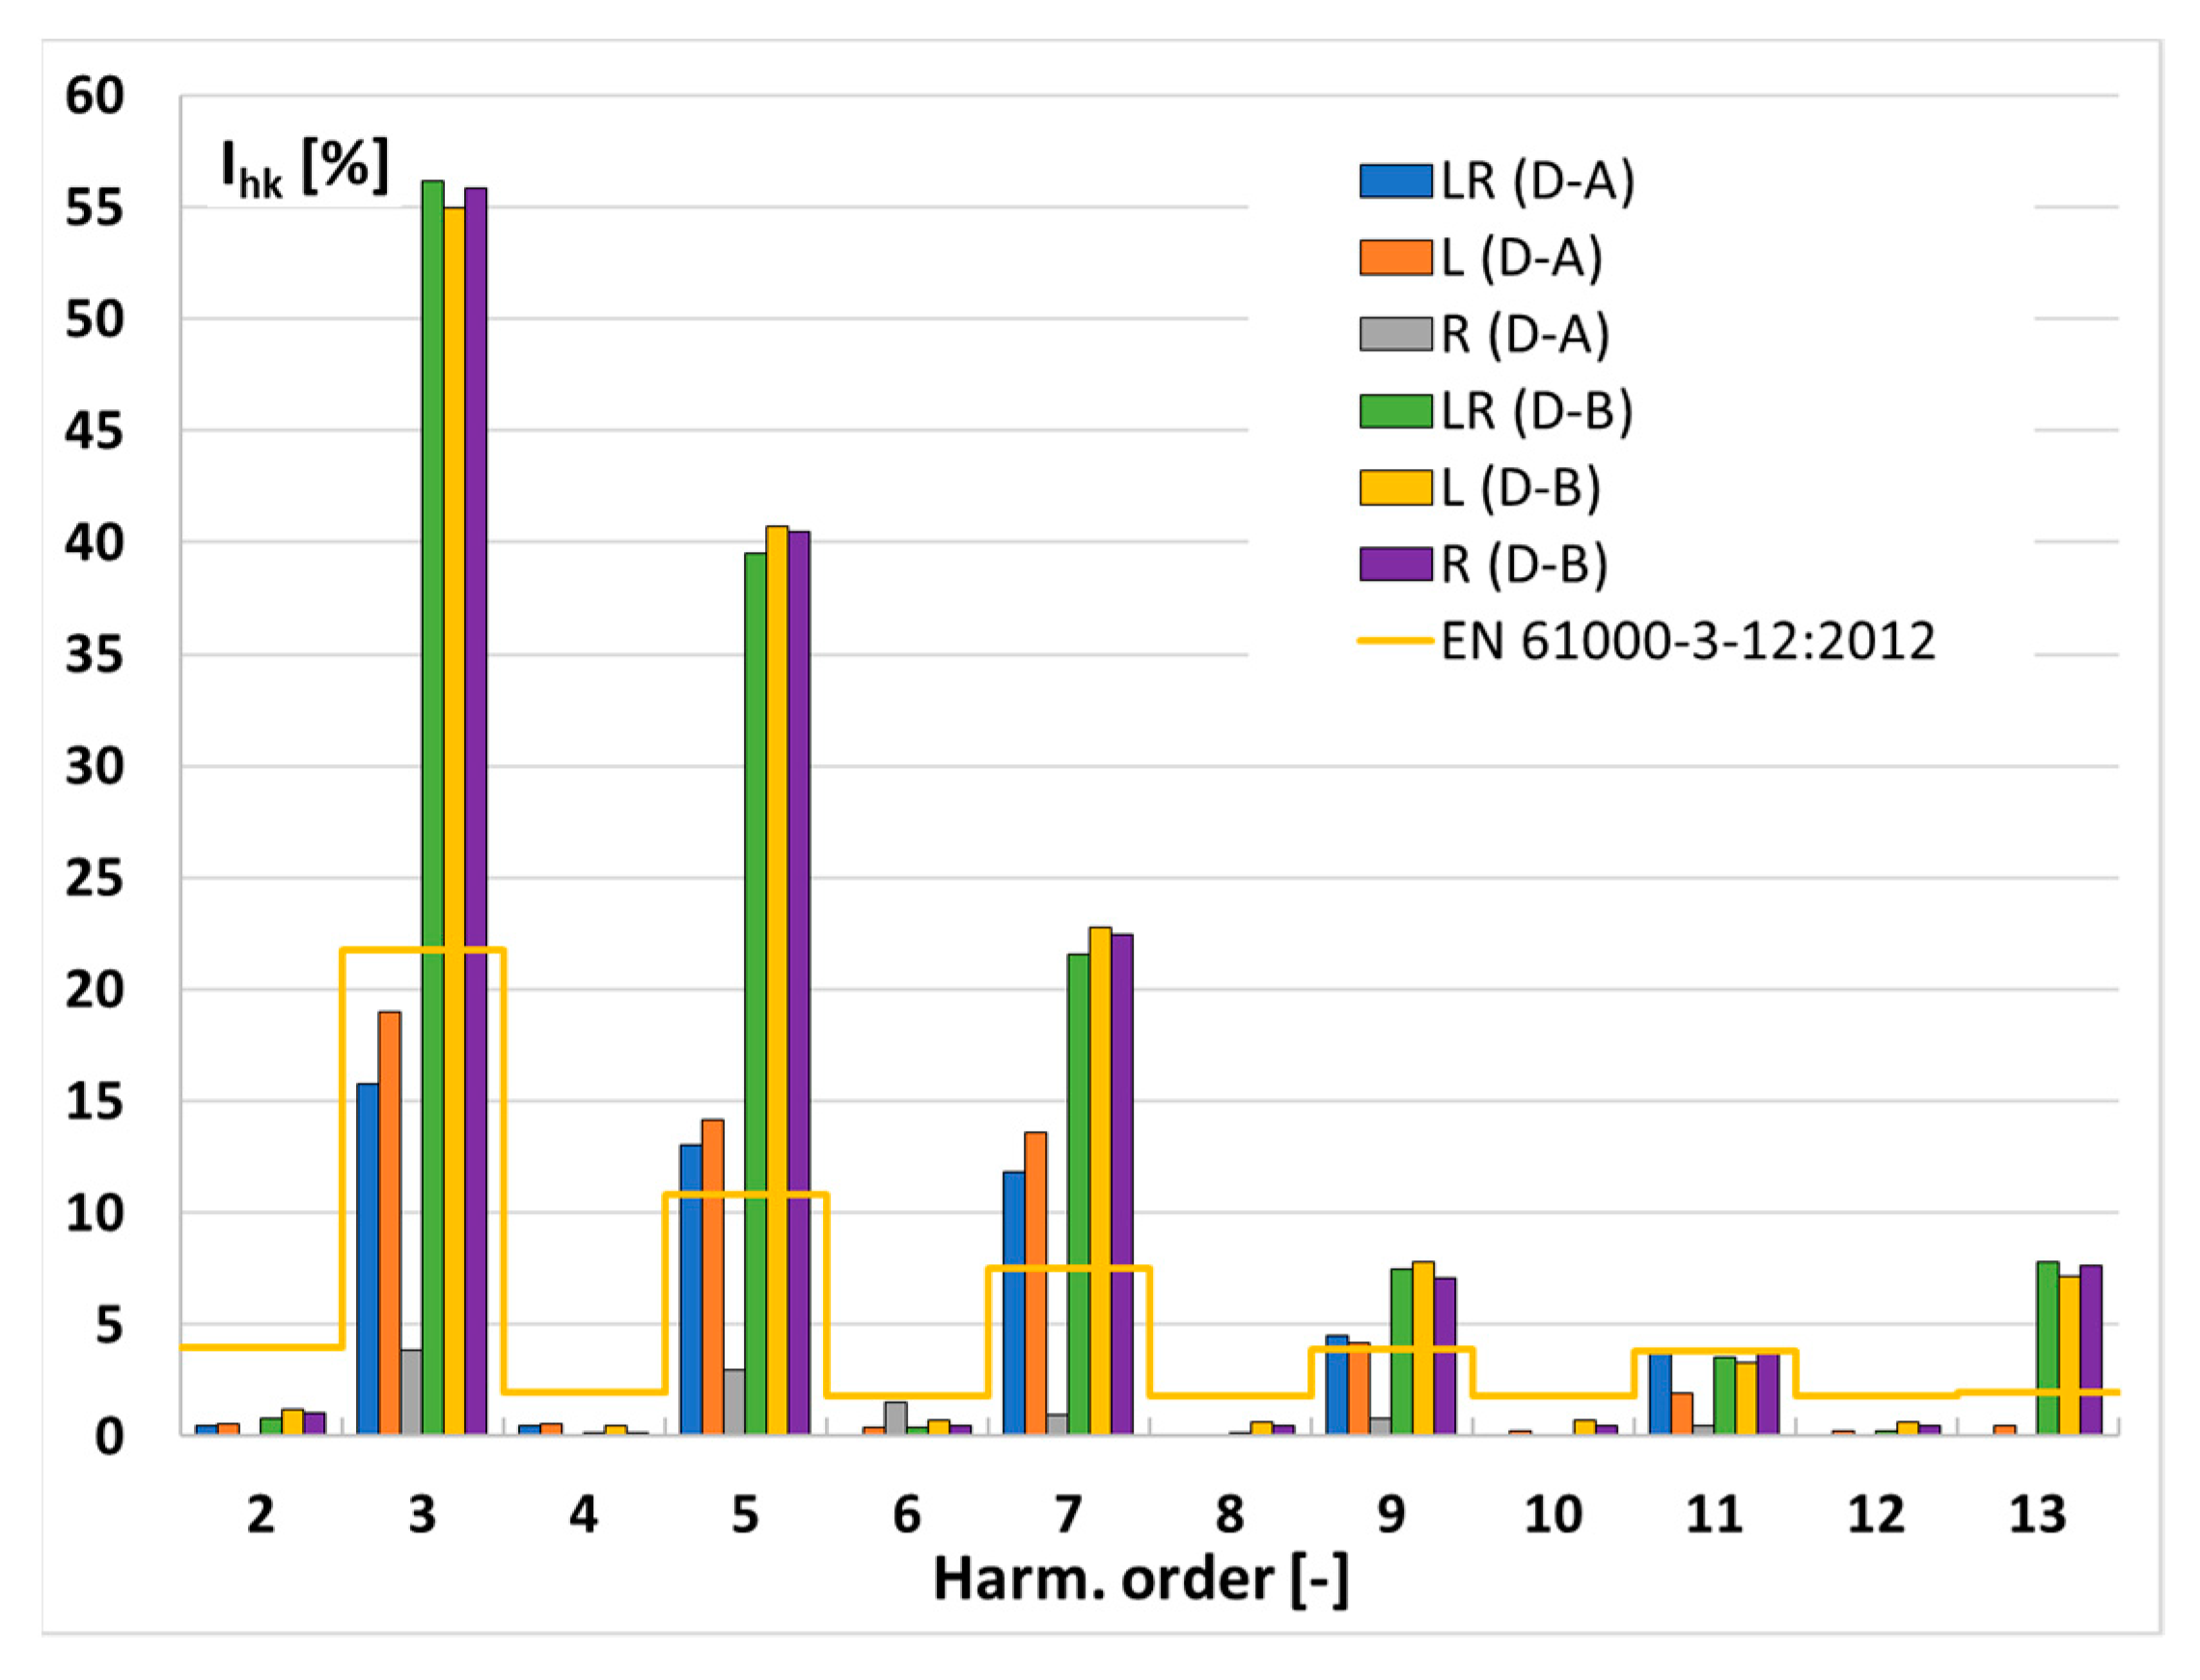
Table 1 calculated values of THDi factors for supply currents of tested PWM-based power source and audio power amplifier are presented. The percentage values of a given higher harmonics are presented in
Figure 11.
The PWM-based power source has a much lower distortion of the supply current in comparison with the audio power amplifier as results of determined values of total harmonics distortion factor. This results from the application of the power factor correction system that controls the time of charging of the output capacitor of DC rail through the inductor [
15]. The highest value of the THDi factor was detected in the case of the PWM-based power source for the rms value of the output current equal to 1 A. The lowest value is obtained for the maximum rms value of the output current equal to 6.5 A. There are no detected changes in obtained values due to the type of the load. The results for the audio power amplifier as well show no influence of the power factor but significant dependence on the load value, therefore the rms value of the output current.
The audio power amplifier is characterized by a supply current consisting of higher harmonics which rms values are significantly exceeding the limiting values specified in the standard EN 61000-3-12 [
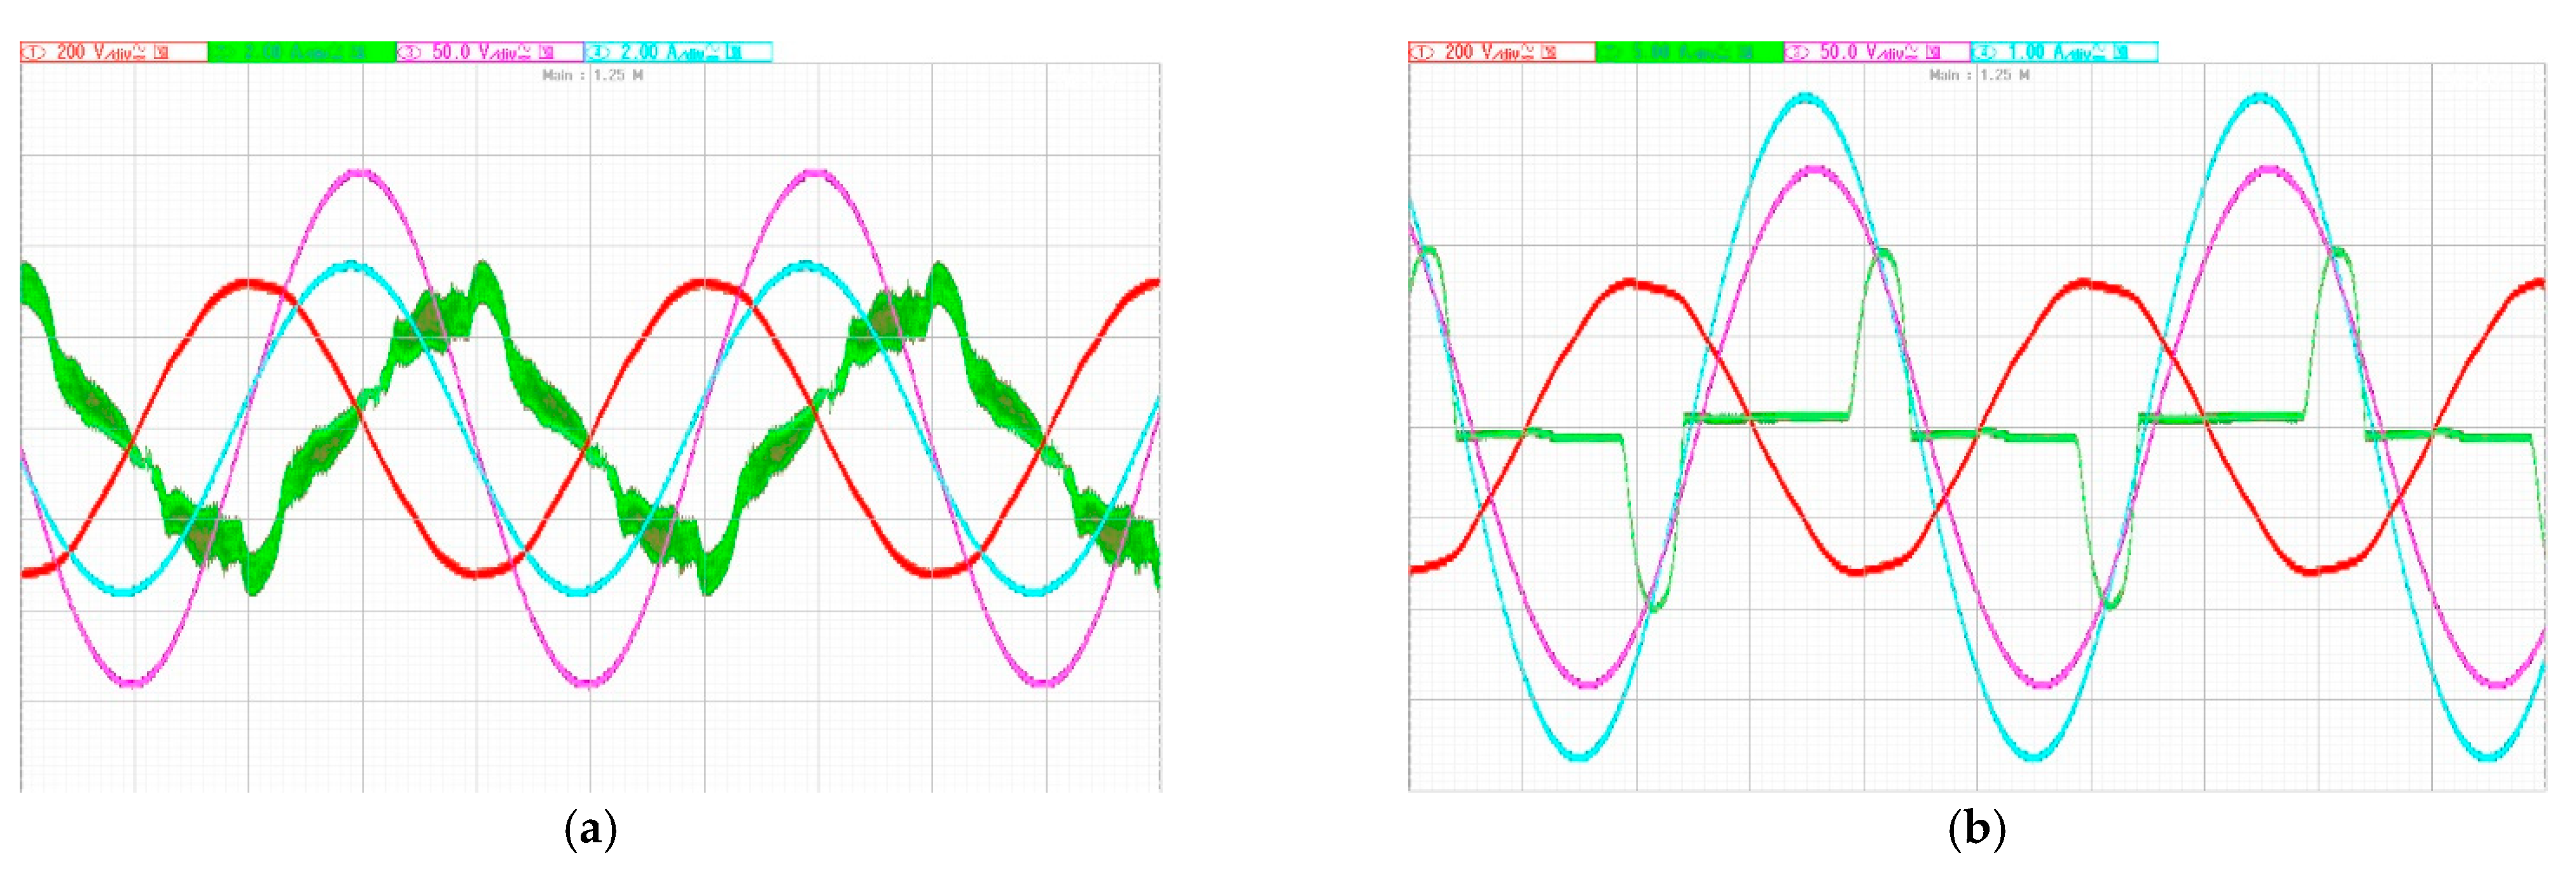
24]. This results from a distortion of the waveform of supply current presented in
Figure 12b. It will increase the exposure of the measuring systems connected to the same AC mains. Parts 3–16, covering limits for harmonic currents produced by energy supplying equipment with a rated current less than or equal to 75 A per phase connected to public low-voltage systems, is still not available. The differences in the percentage values of the higher harmonics generated into the supplying current of the PWM-based power source result from the rms value of the output current. If the rms value of the output current is equal to 6.5 A, the rms values of suppling current is the highest, therefore the percentage values of higher harmonics are the lowest (
Figure 11). In case when its rms value drops to 2.5 A for both resistive and inductive loads the rms values of harmonics of the input current are equal but significantly increased. In
Figure 12 the waveforms of the output and input currents and voltages measured for the PWM-based power source and the audio power amplifier for these conditions are presented.
The waveform of the suppling current of the audio power amplifier (
Figure 12b) is similar to a typical rectifier. The principle of operation of the power factor correction system in the PWM-based power source ensures significantly lower distortion of the suppling current. Moreover, its waveform is the same for inductive and resistance load, however the rms values of output current and voltages are different [
25].
5. Gain, Phase Linearity, and Conducted Disturbances Immunity Tests
The next stage of laboratory tests of the power sources was to determine the linearity of their voltage gain and phase shift with frequency in the range from 50 Hz to 5 kHz for sinusoidal and distorted input voltage. These tests were carried out in the measuring circuit presented in
Figure 13.
In
Figure 13 the notations are used as in
Figure 10, additionally: RVD—wideband reference voltage divider, DEC—wideband converter of differential voltage to single ended voltage.
The tested devices (D-A/D-B) are supplied by the programmable power source (PPS) fed by the arbitrary waveform generator (AWG) which enables to generate any supply voltage waveform required for the conducted disturbances immunity tests. The wideband reference voltage divider (RVD) is used to step-down the output voltage of the tested power source. The voltage ratio of the used RVD is selected in order to obtain the required gain for a given test conditions [
2,
4,
26]. The measuring system is composed of a digital power meter (DPM), in which the second module is used to measure the rms values of harmonics (up to 100th) of output voltage and current, as well as the phase shift between them. Moreover, the value and power factor of the load is determined. To obtain the values of voltage gain error and phase shift of harmonics caused by the tested device first module of DPM is used to measure the rms values of harmonics of input voltage and the rms values of harmonics of differential voltage between the output voltage of RVD and the input voltage of tested power source. Application of the high impedance wideband converter of differential voltage to single ended voltage (DEC) is required in ordered to prevent the impact of measuring circuit on the output voltage of used RVD [
6,
14]. The rms values of the hk harmonic of the output voltage of the tested device is determined from the equation:
UINhk—the rms values of a k-order harmonic of the input voltage of tested power source, UOUThk—the rms values of a k-order harmonic of the output voltage of tested power source, UDEChk—the rms values of a k-order harmonic of the output voltage of the DEC which is equal to difference voltage between the output voltage of RVD and the input voltage of tested power source, φRVDDEChk—the phase shift of a k-order harmonic of the output voltage of DEC in relation to the same frequency harmonic in the input voltage of tested power source.
The value of the voltage gain error of
hk harmonic of the output voltage may be calculated from equation:
The percentage value of the
hk harmonic of the composite error resulting from its voltage gain error and additional phase sift in the output voltage is determined from equation:
Determined
hk values of the composite error and voltage gain errors are used to calculate the value of the additional phase shift of harmonic of the output voltage:
Gain and phase linearity test with the frequency of the input voltage during amplification of sinusoidal of frequency equal to 50 or 500 Hz, and distorted input voltages were performed when tested devices were supplied by the programmable power source. The percentage values of higher harmonics were equal to the required values by the relevant standard [
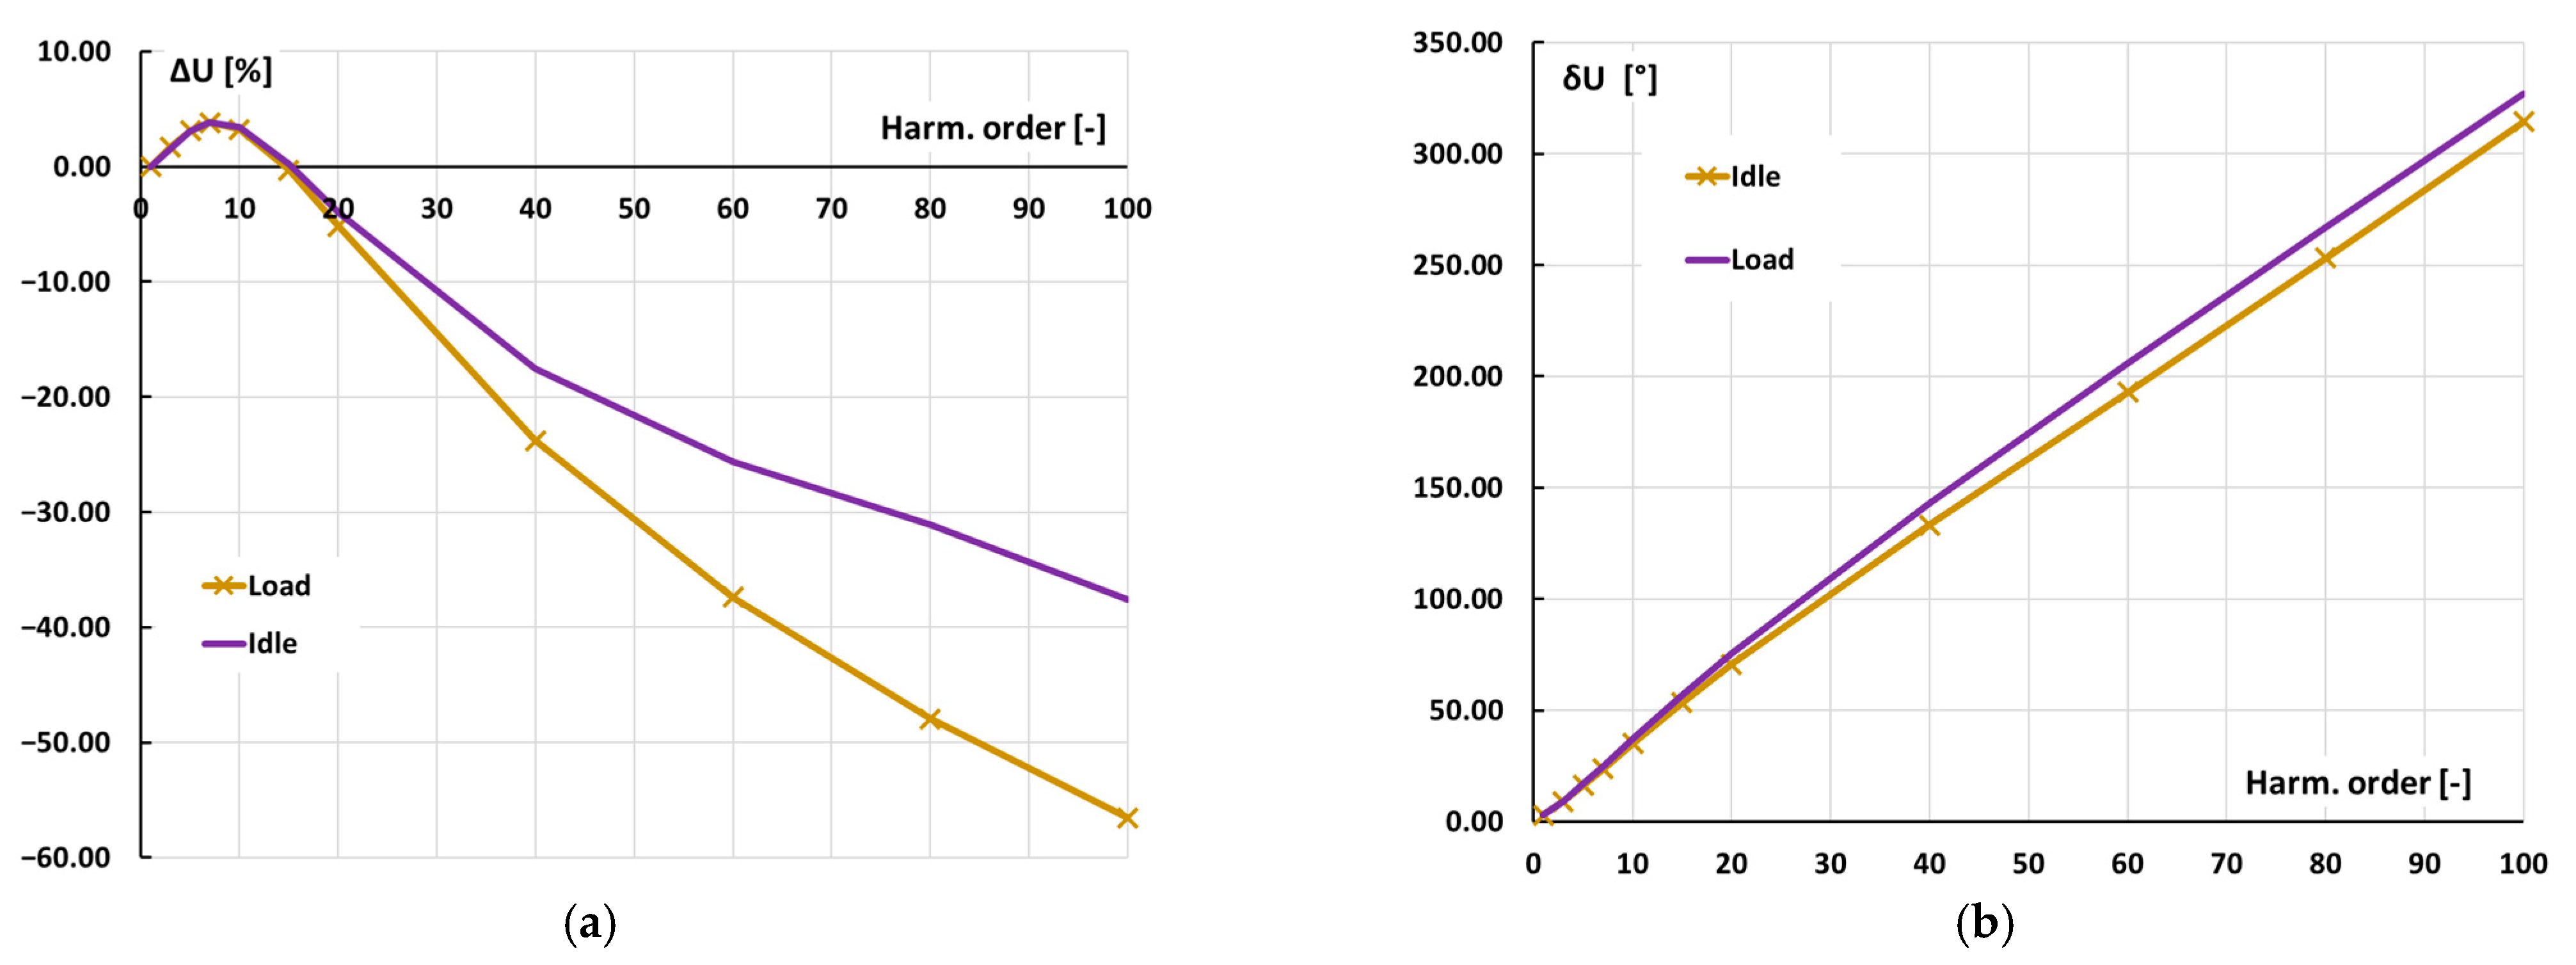
19]. Tests were performed in the no-load state and when the output active power was equal to 1500, 770, and 440 W or apparent power was equal to 1500, 770, and 440 VA with power factor equal to 0.45 were performed. The measurement results are presented in
Figure 14.
In the case of the PWM-based power source the most significant impact on the value of the voltage gain error and phase shift has the frequency of the input voltage. In the no-load state the voltage gain errors (
Figure 14a) have lower values than in the load state (from 20th harmonic). This may result from increased additional voltage drop on internal elements of the device for increased output current. The same values of voltage gain errors and phase shift were obtained regardless of the value of the load power factor. Furthermore, even for the case when conducted disturbances occur in the supply of PWM-based power source, the frequency characteristics of voltage gain errors and phase shift are the same as in
Figure 14.
The frequency characteristic of voltage gain errors and phase shift for audio power amplifier is presented in
Figure 15.
In the case of the audio power amplifier the most significant impact on the value of the voltage ratio error has the frequency of the input voltage but it is negligible taking into comparison the results determined for the PWM-based power source. This phenomenon is caused by the input low pass filter that is selected at too high a frequency. Moreover, there are slight changes in the power factor and value of the load of the power amplifier ±0.5%. Furthermore, even for the case when conducted disturbances occur in its supply voltage and current the frequency characteristics of voltage gain errors and phase shift are the same as in
Figure 15. The immunity to low frequency conductive disturbances results from the conversion of the power by DC rail.


