Article

Study on Optimum Power Take-Off Torque of an Asymmetric Wave Energy Converter in Western Sea of Jeju Island

1
Coastal Development and Ocean Energy Research Center, Korea Institute of Ocean Science and Technology (KIOST), Busan 49111, Korea
2
Green-Ship Research Division, Research Institute of Medium & Small Shipbuilding (RIMS), Busan 46757, Korea
3
Department of Ocean System Engineering, Jeju National University, Jeju 63243, Korea
*
Author to whom correspondence should be addressed.
Energies 2021, 14(5), 1449; https://doi.org/10.3390/en14051449
Submission received: 15 January 2021 / Revised: 27 February 2021 / Accepted: 1 March 2021 / Published: 6 March 2021
(This article belongs to the Special Issue Policy and Technology for Ocean Renewable Energy)

Abstract

:
This study primarily investigates an optimum energy conversion efficiency of asymmetric wave energy converter (WEC). A power take-off (PTO) system that provides a constant load torque opposite to pitch motion was implemented. Incident wave conditions were selected based on the measured data in the western sea of Jeju Island, South Korea. An optimum torque was calculated by comparing the time-averaged extracted power with various PTO load torque. InterDyMFoam solver based on Reynolds-averaged Navier-Stokes (RANS) equations were used in an OpenFOAM v4.0 framework—an open-source computational fluid dynamics model—against the experimental results derived from the wave flume. The upward pitch excursion was induced by wave force due to the asymmetric WEC characteristics; however, the downward pitch excursion depends on its weight. Numerically, the PTO torque was only loaded in uni-direction against the upward pitch motion. Moreover, the optimum PTO torque was estimated by comparing the time-averaged extracted power. Finally, the optimum PTO torque was evaluated by an irregular wave as a function of significant wave height. The optimum PTO provides design information about the asymmetric wave energy converter to improve energy conversion efficiency.

1. Introduction

Wave energy has the potential to play a major part in renewable energy fields. The wave energy converter (WEC) technology has become popular since the oil crisis in 1973. The Edinburgh duck WEC, a pitch-type asymmetric WEC, showed an energy efficiency of 90% in a two-dimensional wave test [1]; researchers have been studying to improve its performance and efficiency [2,3]. Moreover, harnessing massive wave energy was not considered then because the oil price went down in the mid-1980s. Energy harvesting from renewable energy sources, including wave energy, has drawn attention due to growing concern over climate change. The wave energy resources are well-concentrated and available in abundance around the world. However, few WEC technologies have reached the pre-commercial stage [4] because it poses practical challenges.
It is essential to configure WEC to efficiently absorb wave energy and use a better power take-off (PTO) control system for each WEC. An optimum PTO force is estimated with the linear potential flow theory. Babarit et al. [5] expressed a full linear PTO force based on additional mass, damping coefficient, and spring coefficient. The optimal damper for PTO was considered as a pure damper by neglecting its additional mass and spring coefficient. If the optimal damper is tuned to extract maximum wave energy, the tuned constant damper is considered a pure constant damper [6]. Terminator-type WECs, e.g., Edinburgh duck and eccentric horizontal cylinder, can only extract high wave energy within a narrow bandwidth close to its natural period [7]. Various PTO control strategies have been proposed to improve their performances [8]. One extensive study focused on a latching control by locking and releasing the WEC during part of the wave cycle to construct an optimal phase [9,10]. Another strategy was to declutch control or unlatch control by setting it equal to zero during the wave cycle [11]. These studies estimated an optimal extracted power based on the theory of linear potential flow. Peretta et al. [12] experimentally applied a negative stiffness mechanism to the Wave Energy Power Take Off System (WEPTOS) rotor to enhance the rotor motion. It is practically challenging to implement a stiffness device on the full-scale WEPTOS rotor.
Computational fluid dynamics (CFD) based on a fully nonlinear viscous model requires exceptionally high computational efforts. However, it is widely used in various fields due to advancements in hardware systems with parallel processing. Open Source Field Operation And Manipulation (OpenFOAM)—a CFD model with open source under a general public license (GPL)—is freely available and allows source code modification. Many studies such as simulating floating bodies, ships, WECs, falling wedges, and landslides have been conducted using OpenFOAM [13,14,15,16,17]. Ko et al. [18] estimated the extracted powers of the horizontal cylinder-type WECs with off-centered axes of rotation using dynamic behaviors by applying the tuned constant PTO damper, calculated by linear potential flow theory with OpenFOAM.
In this research, an optimum PTO torque is estimated by applying a load torque opposite its motion using OpenFOAM [19]. The numerical estimation provided fundamental data to design a hydraulic PTO system for real sea tests. The extracted power was numerically estimated depending on the PTO load torque; it was then validated with experimental results. A uni-directional load torque system was tested considering the characteristics of asymmetric WEC and compared with a bi-directional system. Optimal PTO load torques induced by regular and irregular waves of the western sea of Jeju Island, South Korea, were investigated by examining a bi- and uni-directional PTO load torque related to the distinctive dynamic behavior of the asymmetric WEC. The result implies that a load torque system is suitable for a hydraulic PTO system in the real sea test. Furthermore, the effect of changing significant wave height on the primary energy conversion of asymmetric WEC was investigated.

2. Experimental Setup of the 1/11-Scale Model

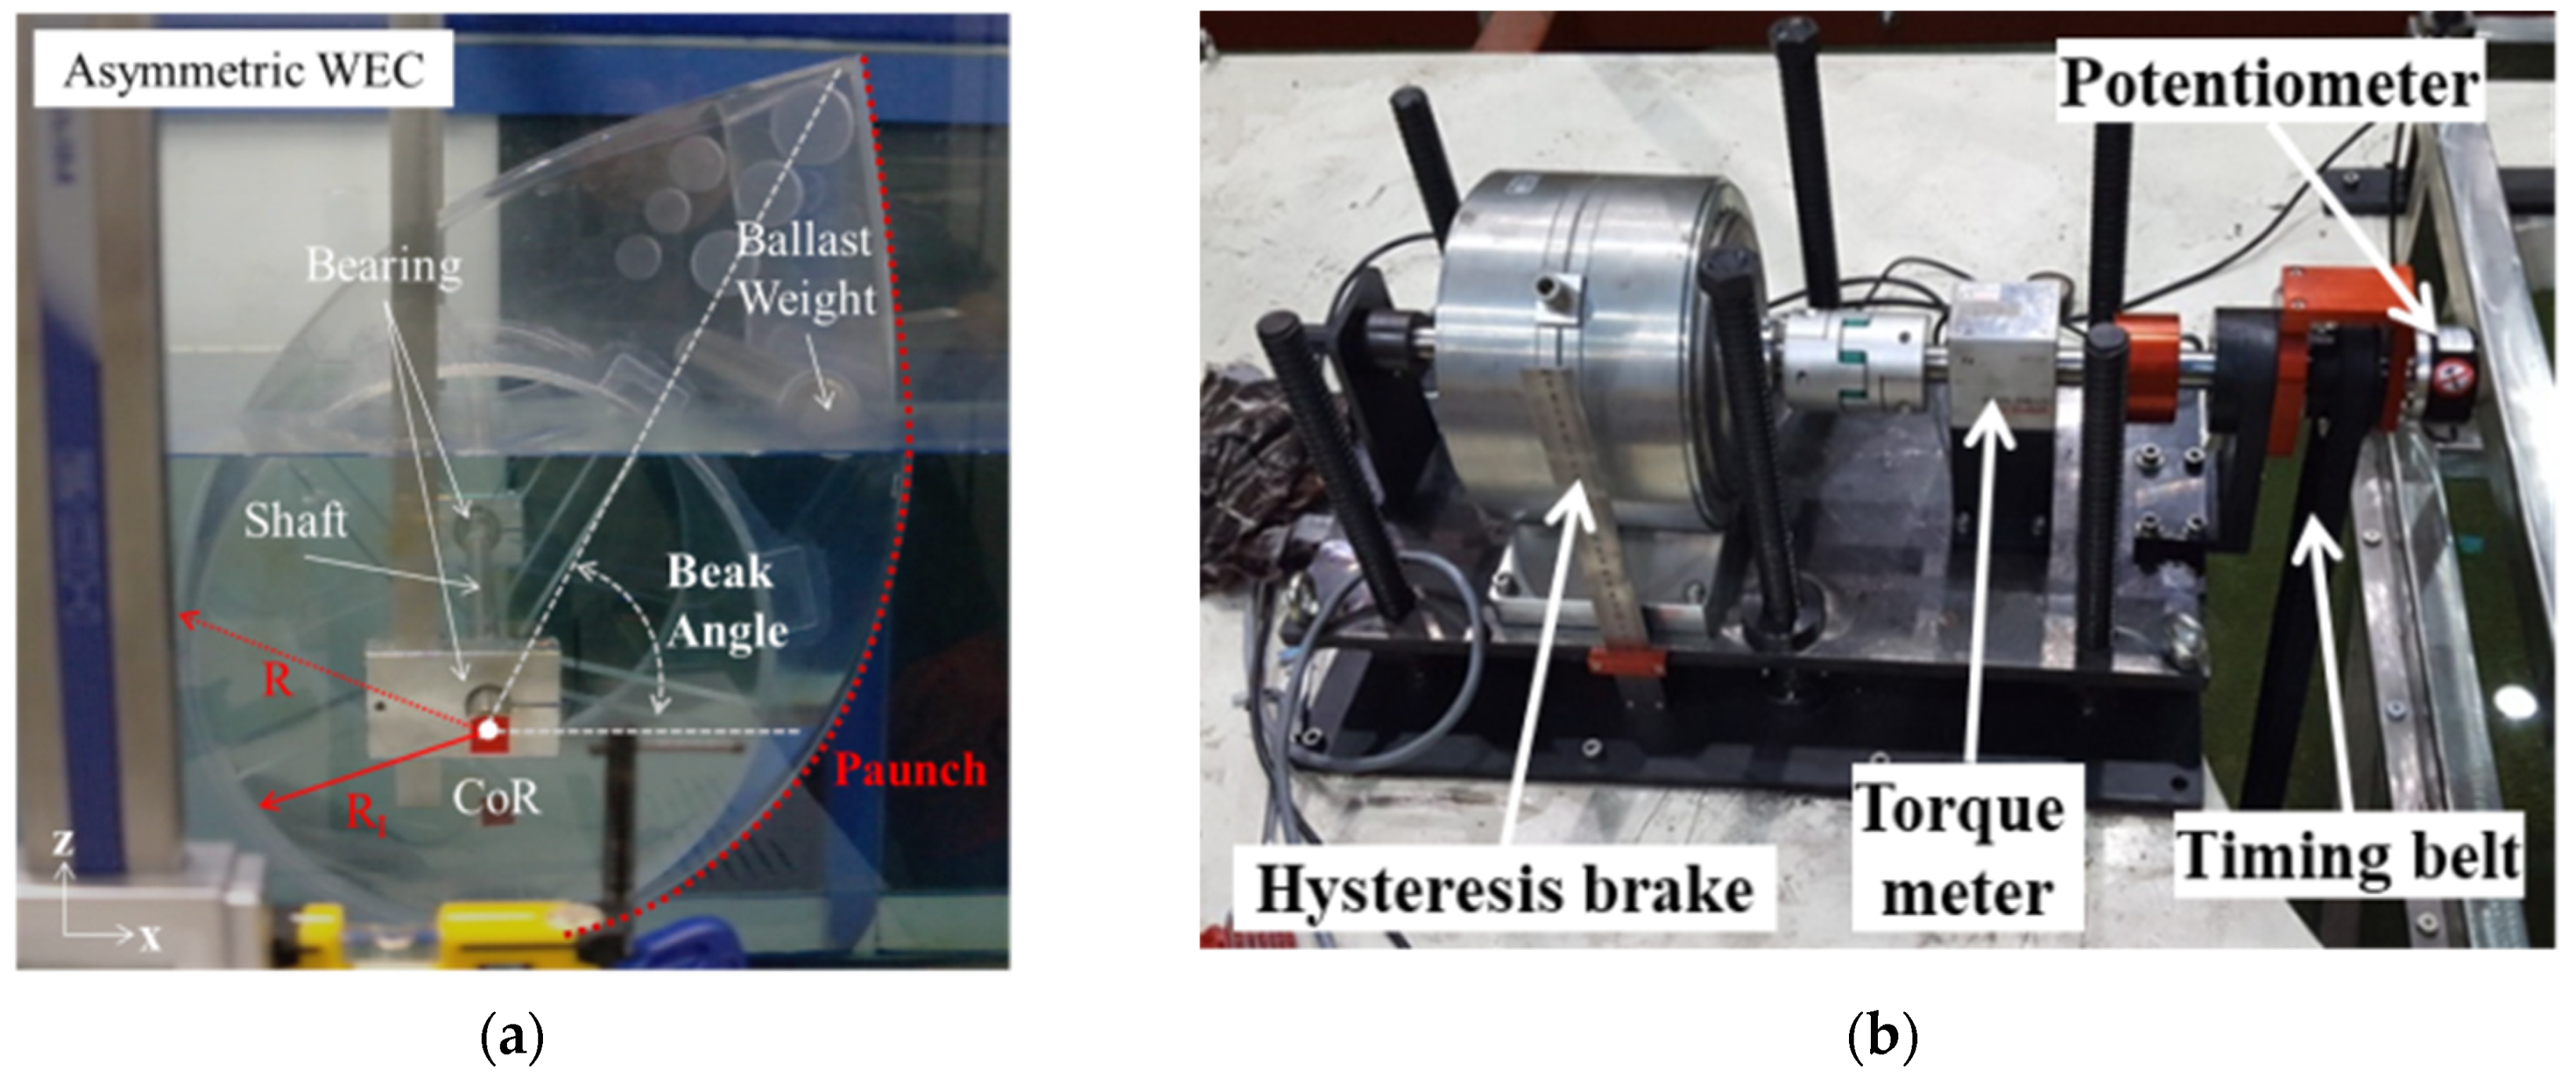
The optimized asymmetric WEC in the western sea of Jeju Island was fabricated for an experiment with a 1/11 scale of geometric similitude, as proposed by Poguluri and Bae [20]. In the WEC system, the incident wave energy is converted into primary rotational kinetic energy through the asymmetric WEC. Furthermore, the kinetic energy is converted into hydraulic energy through the hydraulic pump; thereafter, hydraulic power was extracted through the power generation motor. Figure 1a,b show a plan view and a side view of an asymmetric WEC and a PTO load torque system coupled together in a three-dimensional wave tank (28 m long, 22 m wide, and 2.5 m high) at the Research Institute of Medium & Small Shipbuilding (RIMS) in the Republic of Korea to investigate the primary energy conversion. A piston-type wavemaker was used to generate the wave. Furthermore, a porous wave absorber with a slope was placed opposite to the wavemaker to reduce wave reflection. Figure 2a shows the definition and the real image of asymmetric WEC. Moreover, the detailed specification of the asymmetric WEC is summarized in Table 1. It was coupled with a steel shaft and a bearing to allow only pitch motion; moreover, it was suspended from a stiff steel structure in the middle of the wave tank (see Figure 1).
The system was composed of a hysteresis brake for PTO load torque, a potentiometer, and a torque meter to measure pitch motion and the applied torque of the asymmetric WEC, as shown in Figure 2b. A timing belt was used to synchronize asymmetric WEC’s shaft and the PTO load torque system. The incident wave condition was considered to be H = 0.136 m and T = 1.432 s based on the significant wave height and the average period obtained from a wave climate study in the western sea of Jeju Island, South Korea [21]; additionally, the WECs were scaled down considering the Froude similitude and a scale factor of λ = 11 .

3. Numerical Analysis

The interDyMFoam—one of the OpenFOAM solvers—was used to analyze the interaction between the motion of an asymmetric WEC and multi-phase fluid. The continuity (Equation (1)) and Reynolds-averaged Navier-Stokes (RANS) equations (Equation (2)) were used to satisfy mass and moment conservation.
U = 0
ρ U t + · ( ρ U U ) = p * g · X ρ + · ( μ e f f U ρ U U ¯ ) + σ κ c α p ,
where ρ is the density, U denotes the Reynolds-averaged velocity vector, t represents time, p * is the pseudo-dynamic pressure, g is gravitational acceleration, X denotes the position vector, μ e f f is the effective dynamic viscosity calculated as the sum of the dynamic viscosity ( μ ) and the turbulent dynamic viscosity ( μ t ), and ρ U U ¯ represents the Reynolds stresses. Moreover, σ denotes the surface tension coefficient, κ c is the curvature of the free surface, and α p represents the phase fraction. The renormalization group (RNG) k - ϵ turbulence model was used to analyze the turbulent flow [22]. Equations (1) and (2) were solved to obtain velocity and pressure values. These values were used to construct the equation of motion of asymmetric WEC, as shown in Equation (3).
M T M P T O = S ( M e x t + M f l o w ) d s M P T O = J θ ¨ ,
where M T denotes the total moment, M P T O represents the moment due to the PTO mechanism, M e x t is the external moment due to gravity, and M f l o w denotes the buoyancy or moment due to pressure or viscosity. Moreover, J and θ ¨ represent the moment of inertia of WEC and the rotational accelerations, respectively.
The asymmetric WEC was deployed in the middle of a two-dimensional numerical wave tank, as illustrated in Figure 3. Waves2FOAM [23] was used for wave generation and absorption. Additionally, the module included relaxation zones at the end of the wave tank to minimize the reflected wave from the wall’s end.
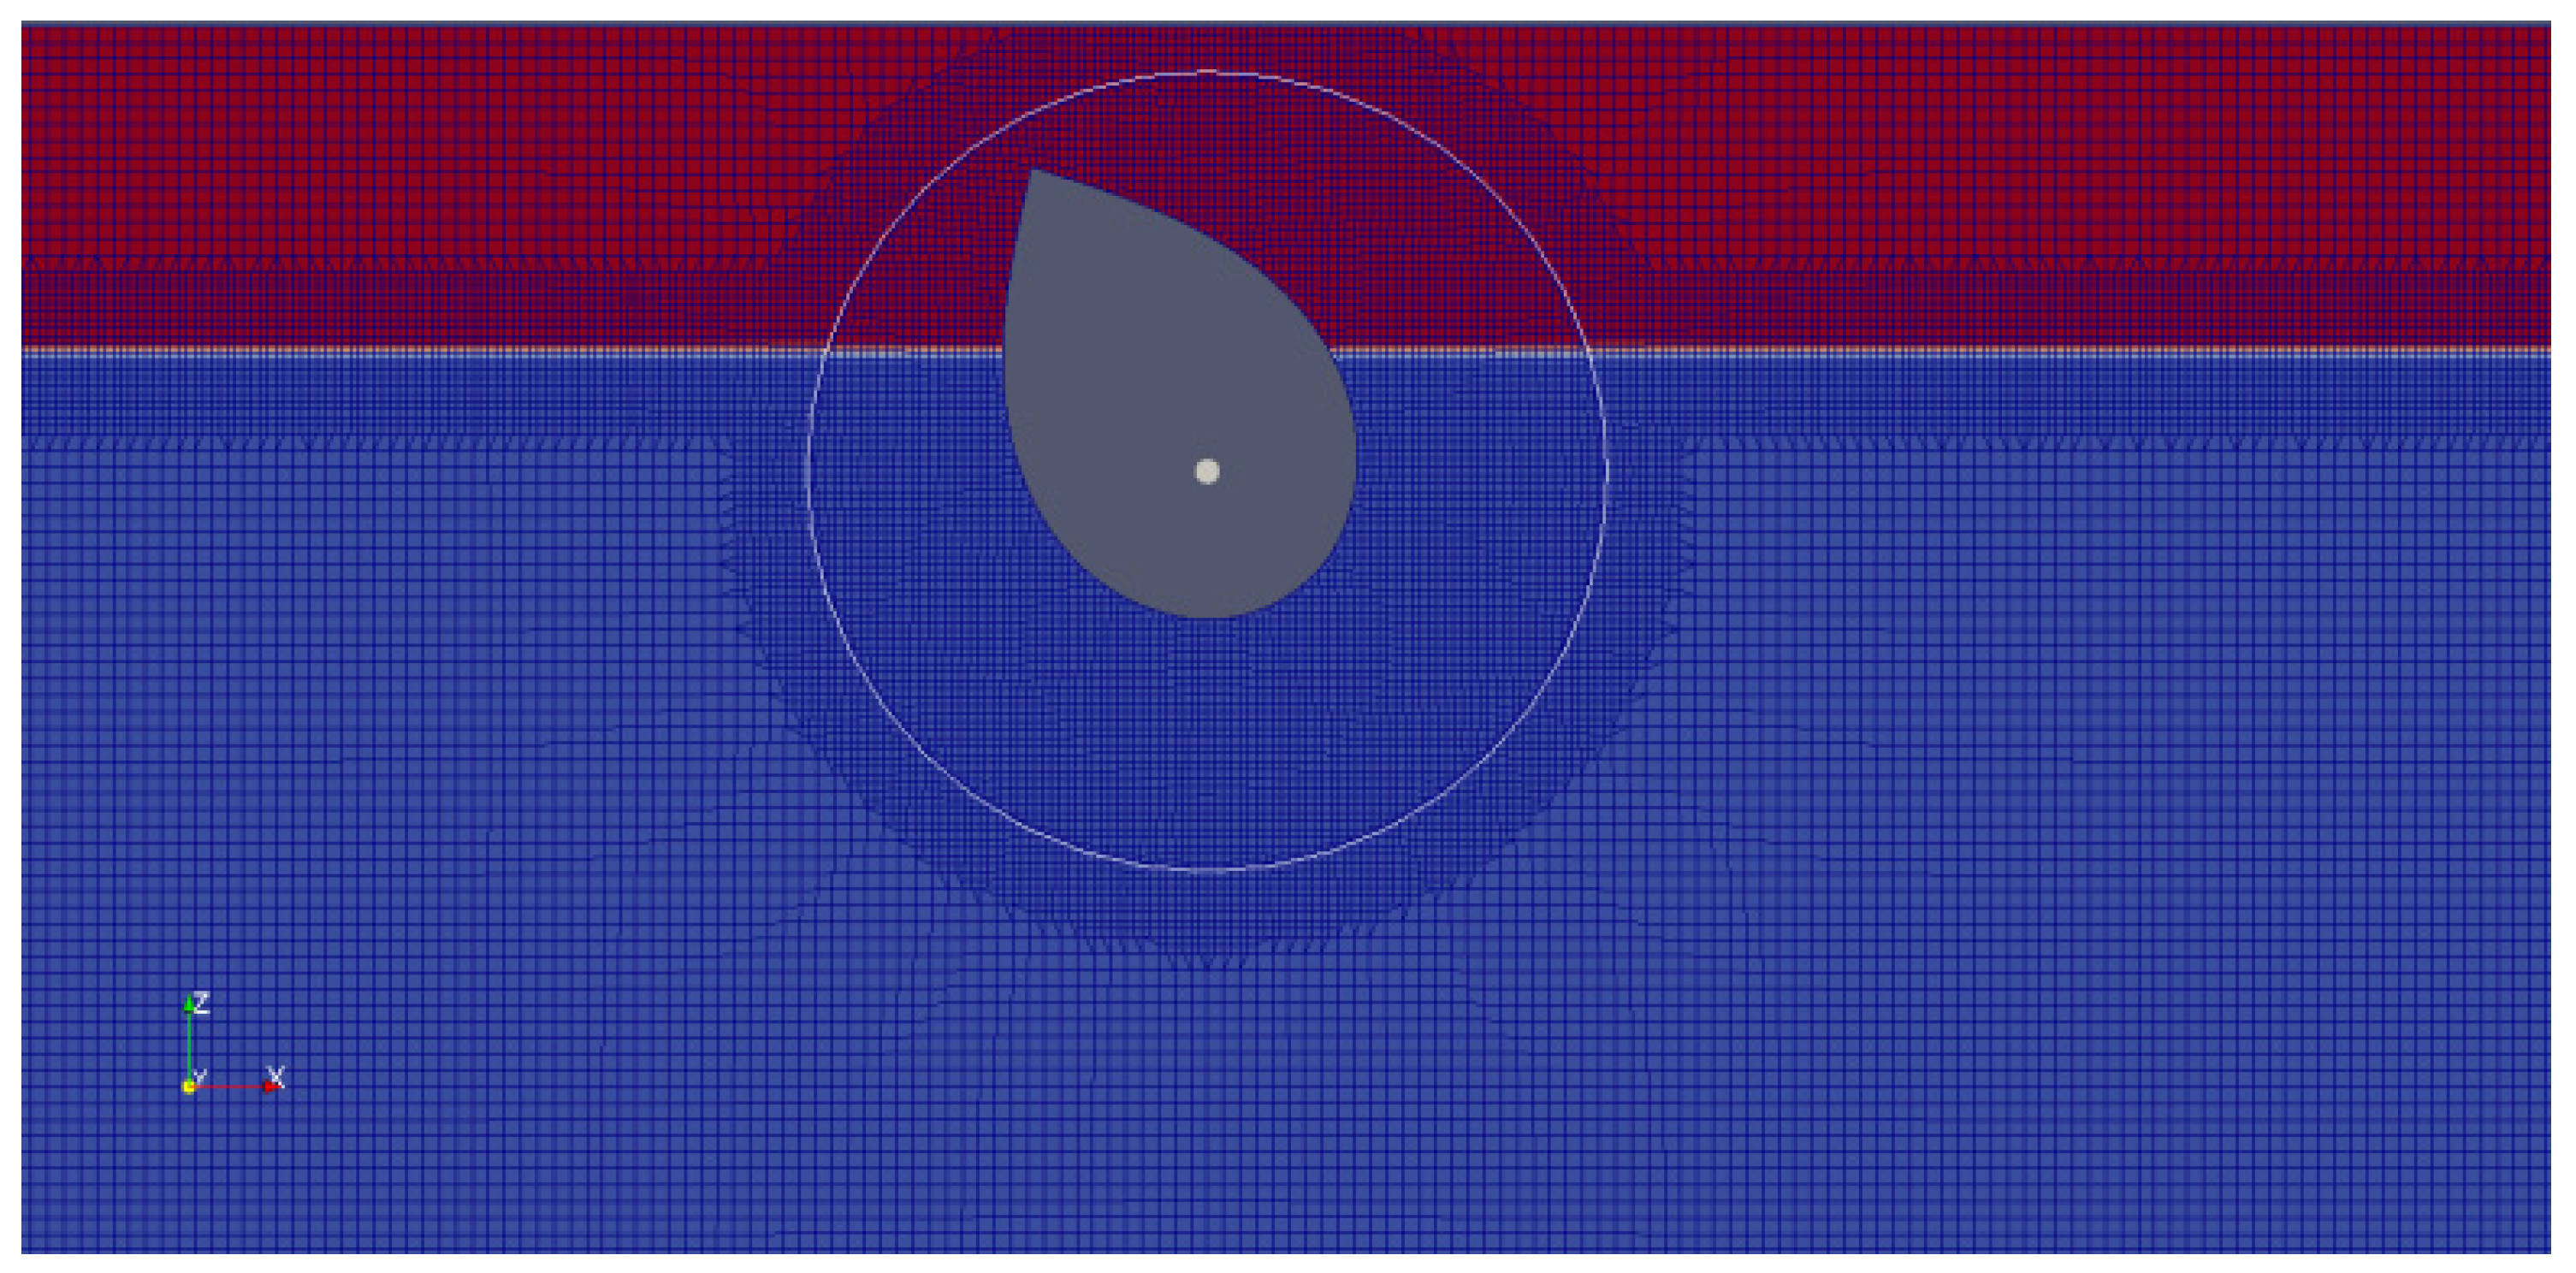
Figure 4 shows a pseudo-2D grid system for the 2D numerical simulation. The grid resolution around the asymmetric WEC and near the free water surface is finer considering the grid convergence test as summarized in Table 2. The grid shape was mostly hexahedral; however, a wedge shape was generated around the asymmetric WEC. Moreover, a transient interface was present between the finer and original grid. The Arbitrary Mesh Interface (AMI) comprised overlapping fixed cylindrical outer area and rotatable inner areas. Furthermore, all the results of the fluid were interpolated using the AMI.

4. Results and Discussion

4.1. Grid Convergence Test

A grid convergence test was conducted to evaluate the numerical accuracy and efficiency of wave generation. The time series of water surface elevations at the middle of the wave flume, where the WEC had been deployed with four grid resolutions, was compared to the Airy wave theory. The theoretically and numerically derived wave heights of 12 wave cycles were compared using the root-mean-square difference (RMSD). A quantitative comparison is shown in Table 2. Grid 3 was selected for considering numerical efficiency in the following numerical analysis in this study.

4.2. Model Validation (1/11 Model Scale)

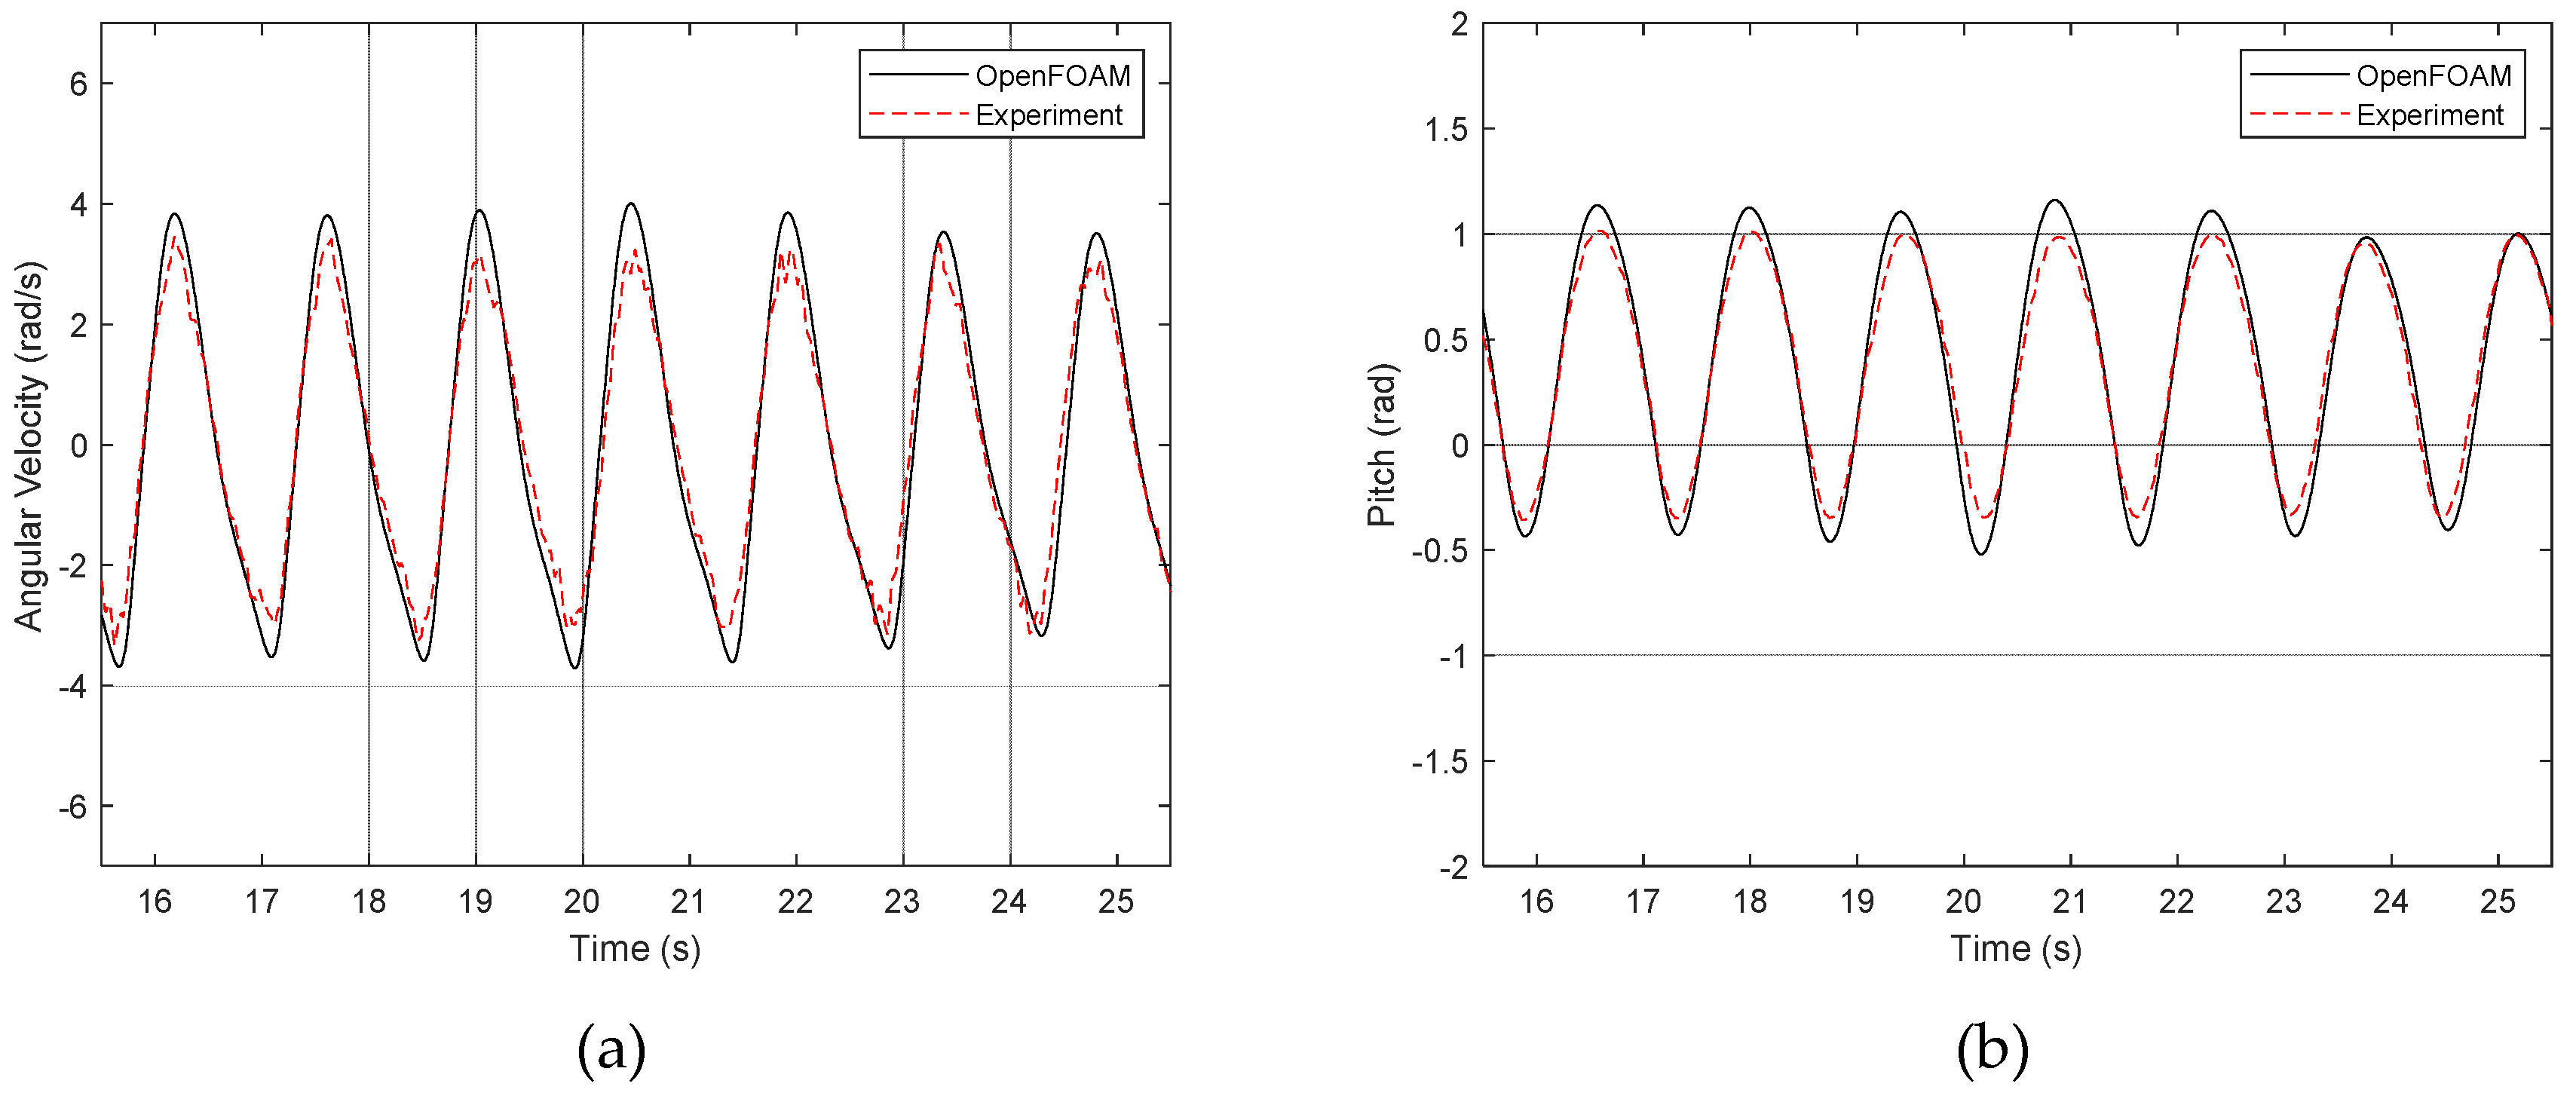
The time series of pitch angular velocity and pitch excursion were induced by wave height of H = 0.136 m and a wave period of T = 1.432 s using OpenFOAM. They were compared with the experimental data, as shown in Figure 5. The results were truncated corresponding to seven wavelengths of incident wave after a transient pitch motion. The comparison shows that the numerical results predict the experimental results in terms of cycle and magnitude of pitch motion. The positive pitch excursions induced by the wave crest were larger than the negative pitch excursions induced by the wave trough. This is because the paunch part configuration of the asymmetric WEC was designed by an exponential function based on an incident wave horizontal particle velocity so that the hydrodynamic force efficiently acts on the positive pitch excursion [24].
The tested torque cases were loaded gradually in the experimental and numerical investigation to estimate an optimum PTO torque, as summarized in Table 3. Additionally, the maximum and minimum PTO torque (cases 1 and 6) were loaded in numerical simulation to estimate an optimum shape of the extracted power curve. Moreover, the torque was loaded opposite to pitch angular velocity. The extracted power—averaged over six periods of pitch excursion—is obtained as shown in Equation (4).
P ¯ e x t = 1 t d t 0 t d | T ( t ) | · ω ( t )   d t ,
where T ( t ) and ω ( t ) denote the time series of PTO load torque and pitch angular velocity, and t 0 and t d represent a time duration of six periods.
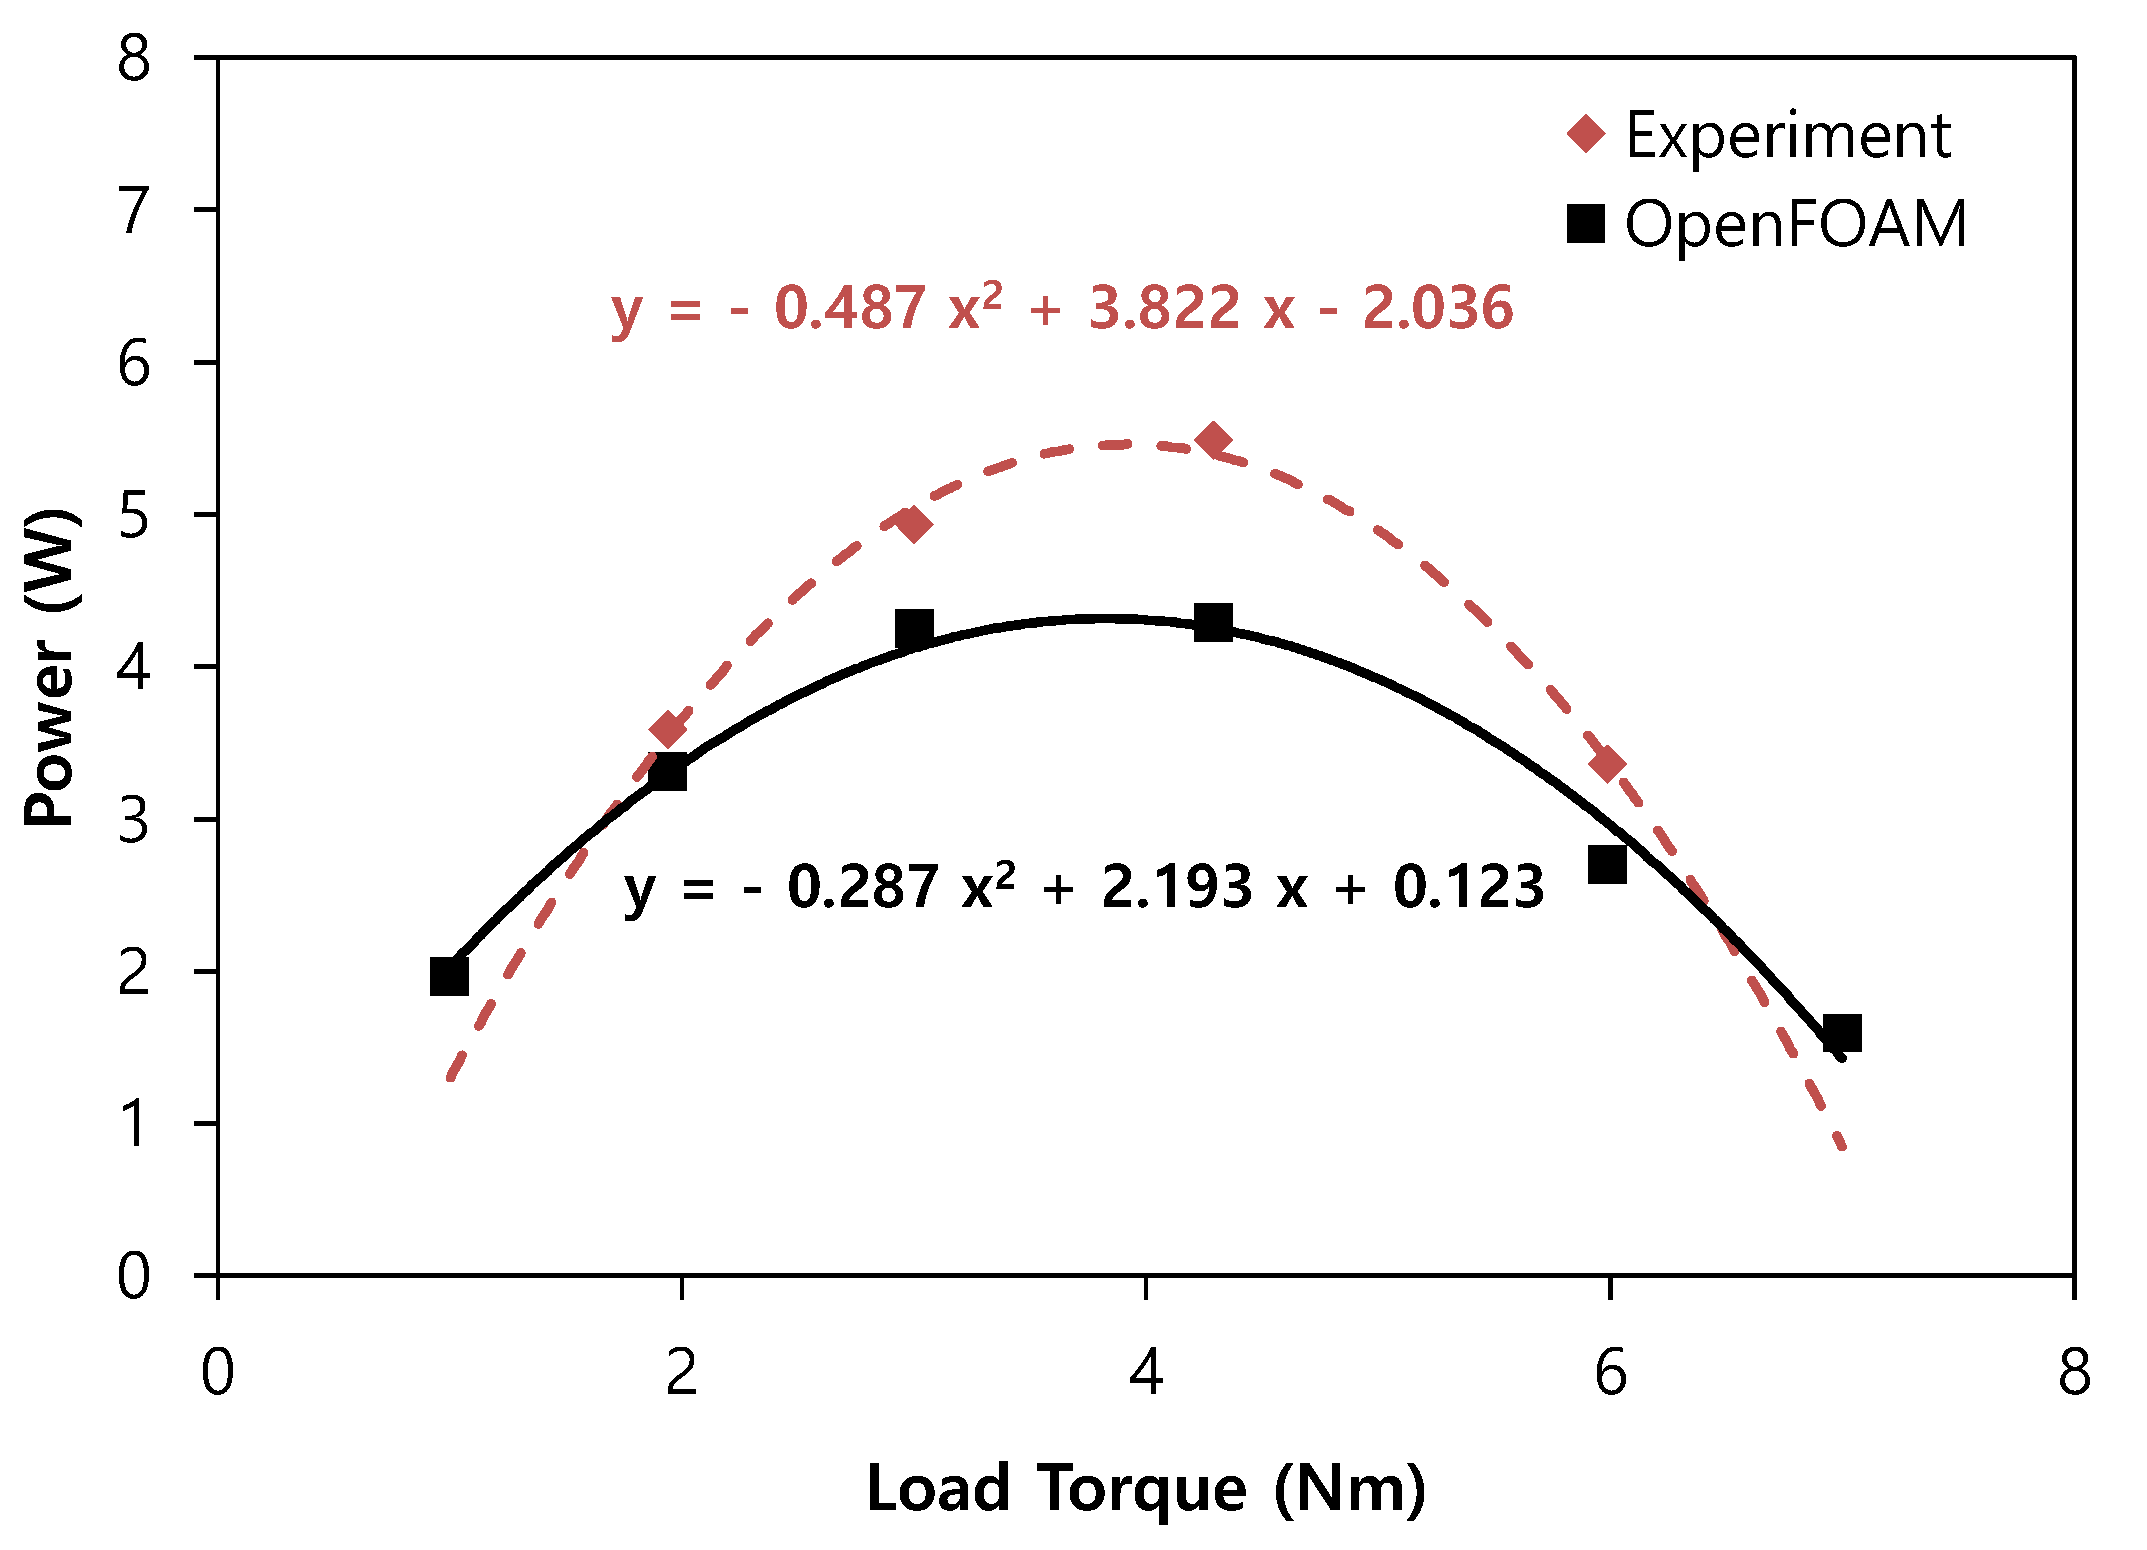
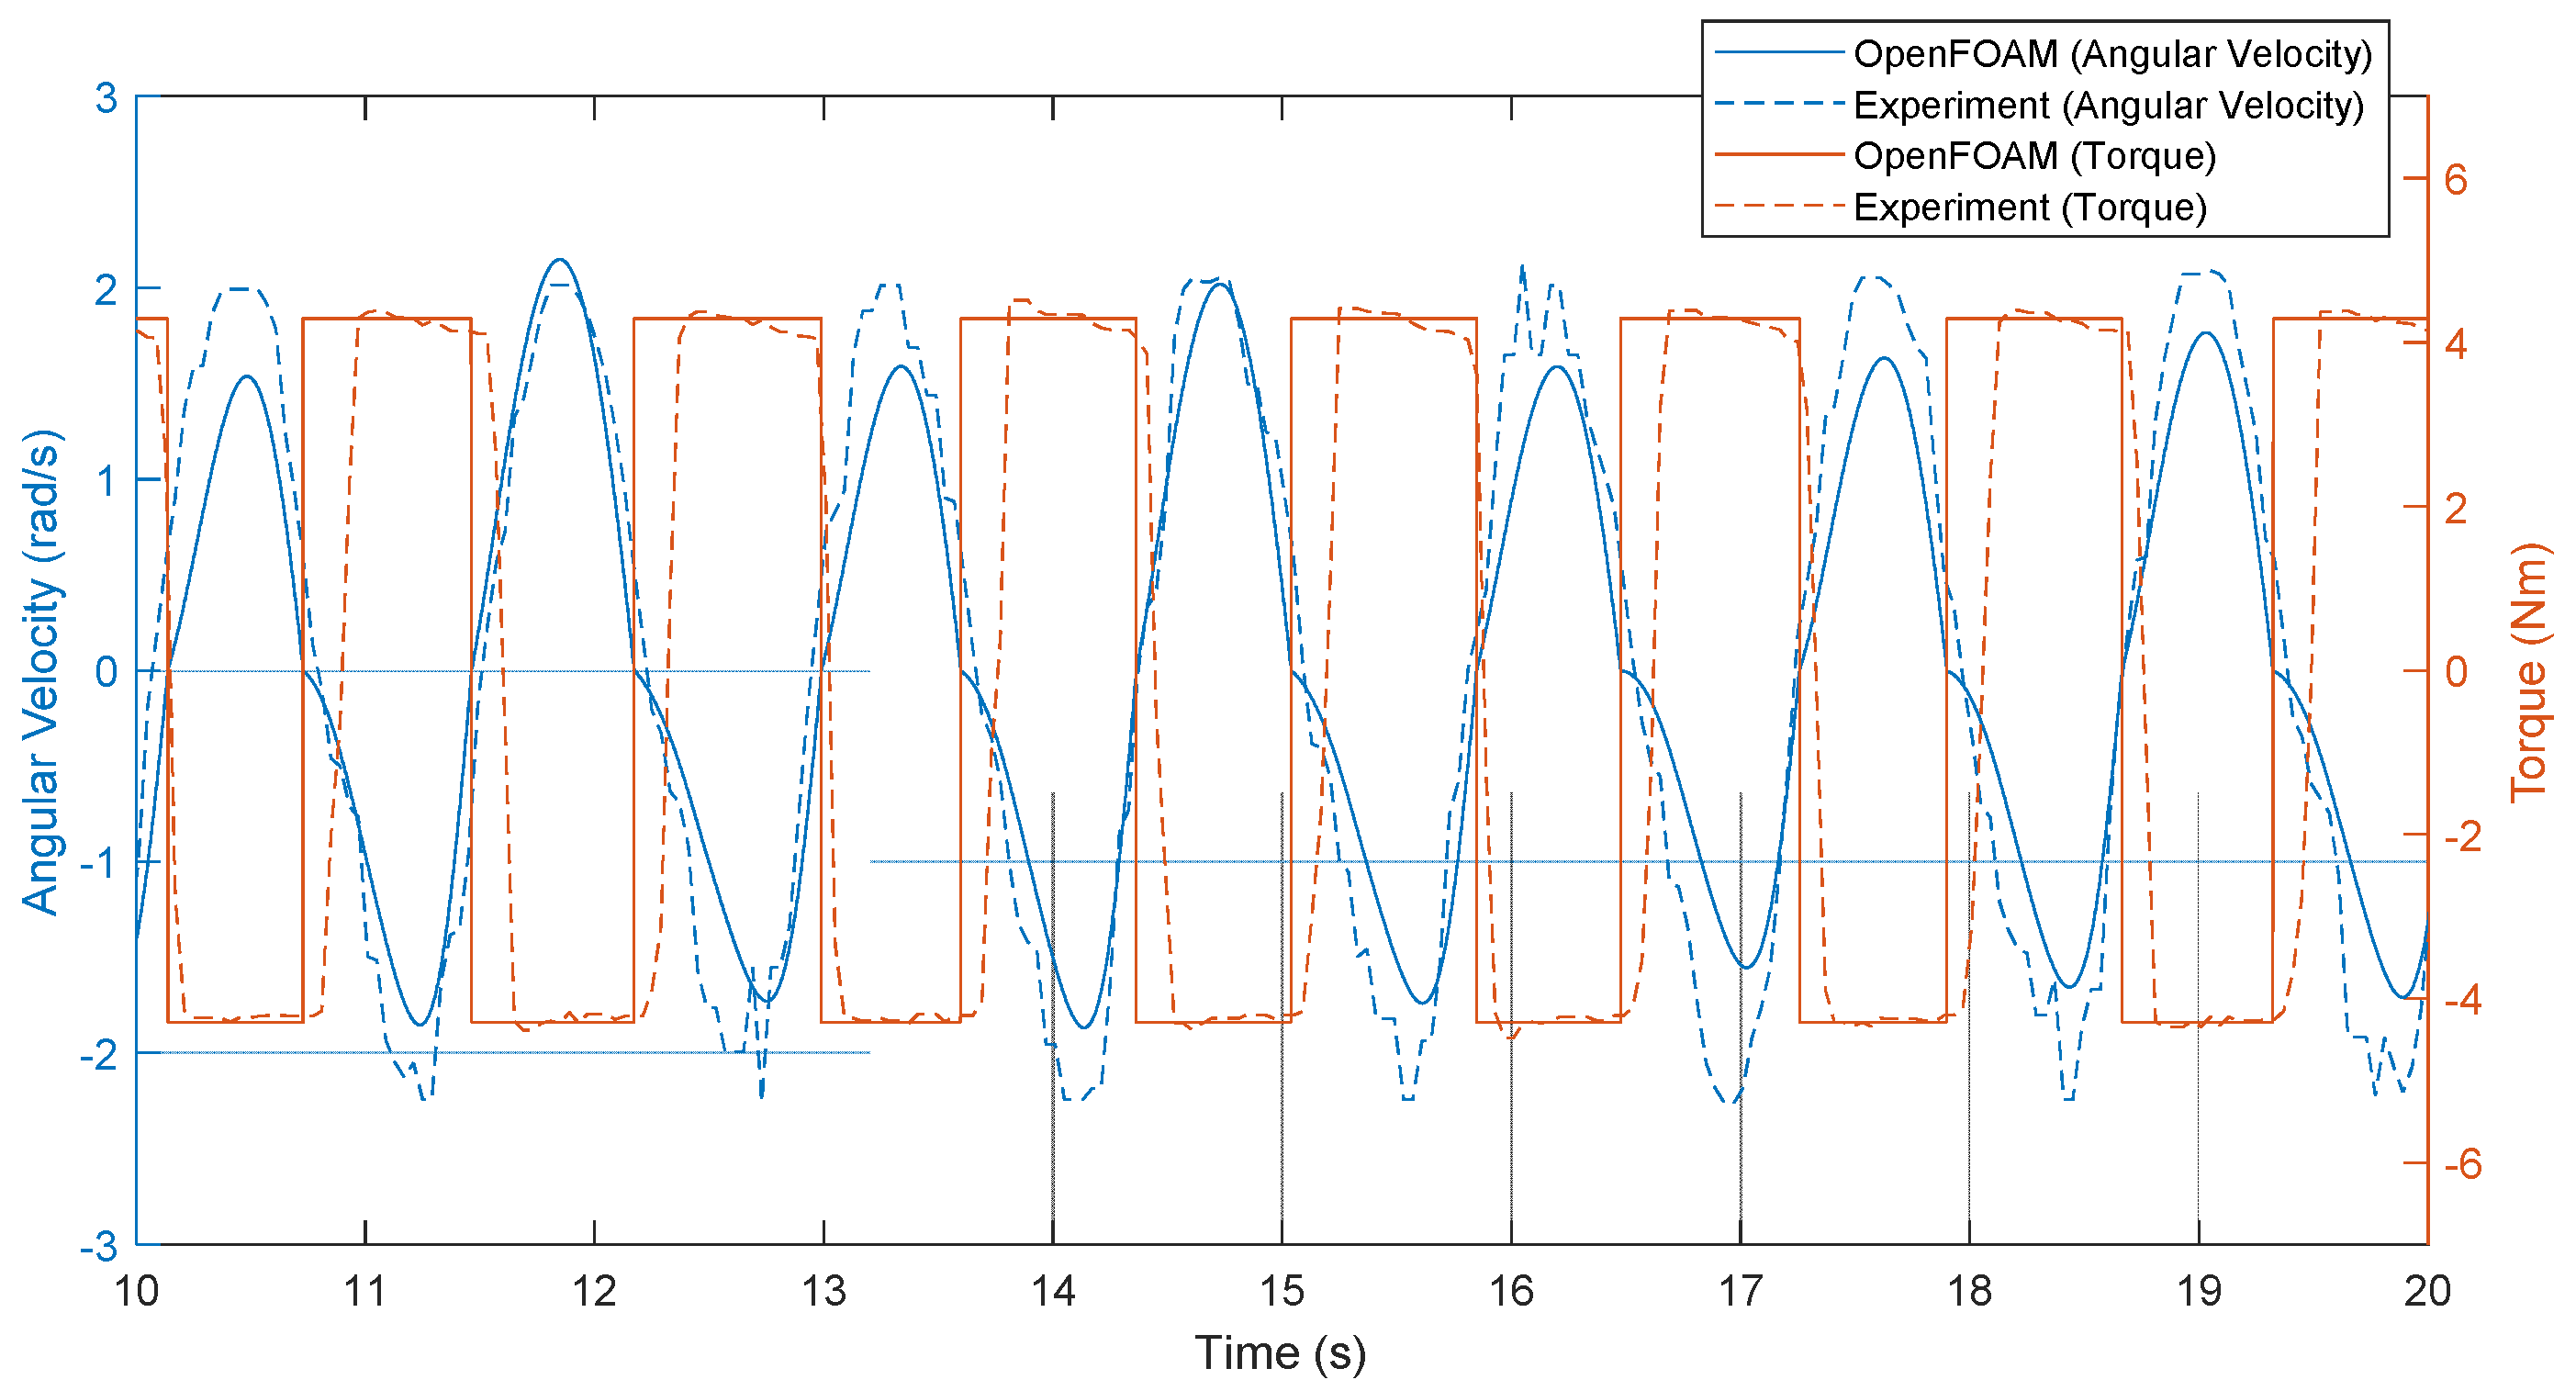
The extracted powers with various loading torques were compared with the numerical and experimental results, as shown in Figure 6. The second-order polynomial curve fitting was used to show the trend line and the maximum extracted power at the optimal load torque. The maximum extracted power of both results was estimated at the PTO load torque of 4.29 Nm, which can be regarded as the optimum PTO load torque. The experimental results are moderately over-predicted because the PTO torque is not constantly loaded, and the PTO torque load was not perfectly synchronized with angular velocity in the experiment, as shown in Figure 7. Conversely, the PTO loading torque is constant and shows a sudden increase in the synchronization in the numerical calculation.

4.3. 1/2 Scale Model Analysis for Real Sea Test

The asymmetric WEC on a 1/2 scale was designed to estimate an optimum PTO load torque numerically and provide design data for a hydraulic PTO system in real sea tests. The specification of asymmetric WEC is summarized in Table 4. The draft, beak angle, and center of gravity (CoG) location of the 1/2 scale model are similar to the optimized-prototype asymmetric WEC, proposed by Poguluri and Bae [20].
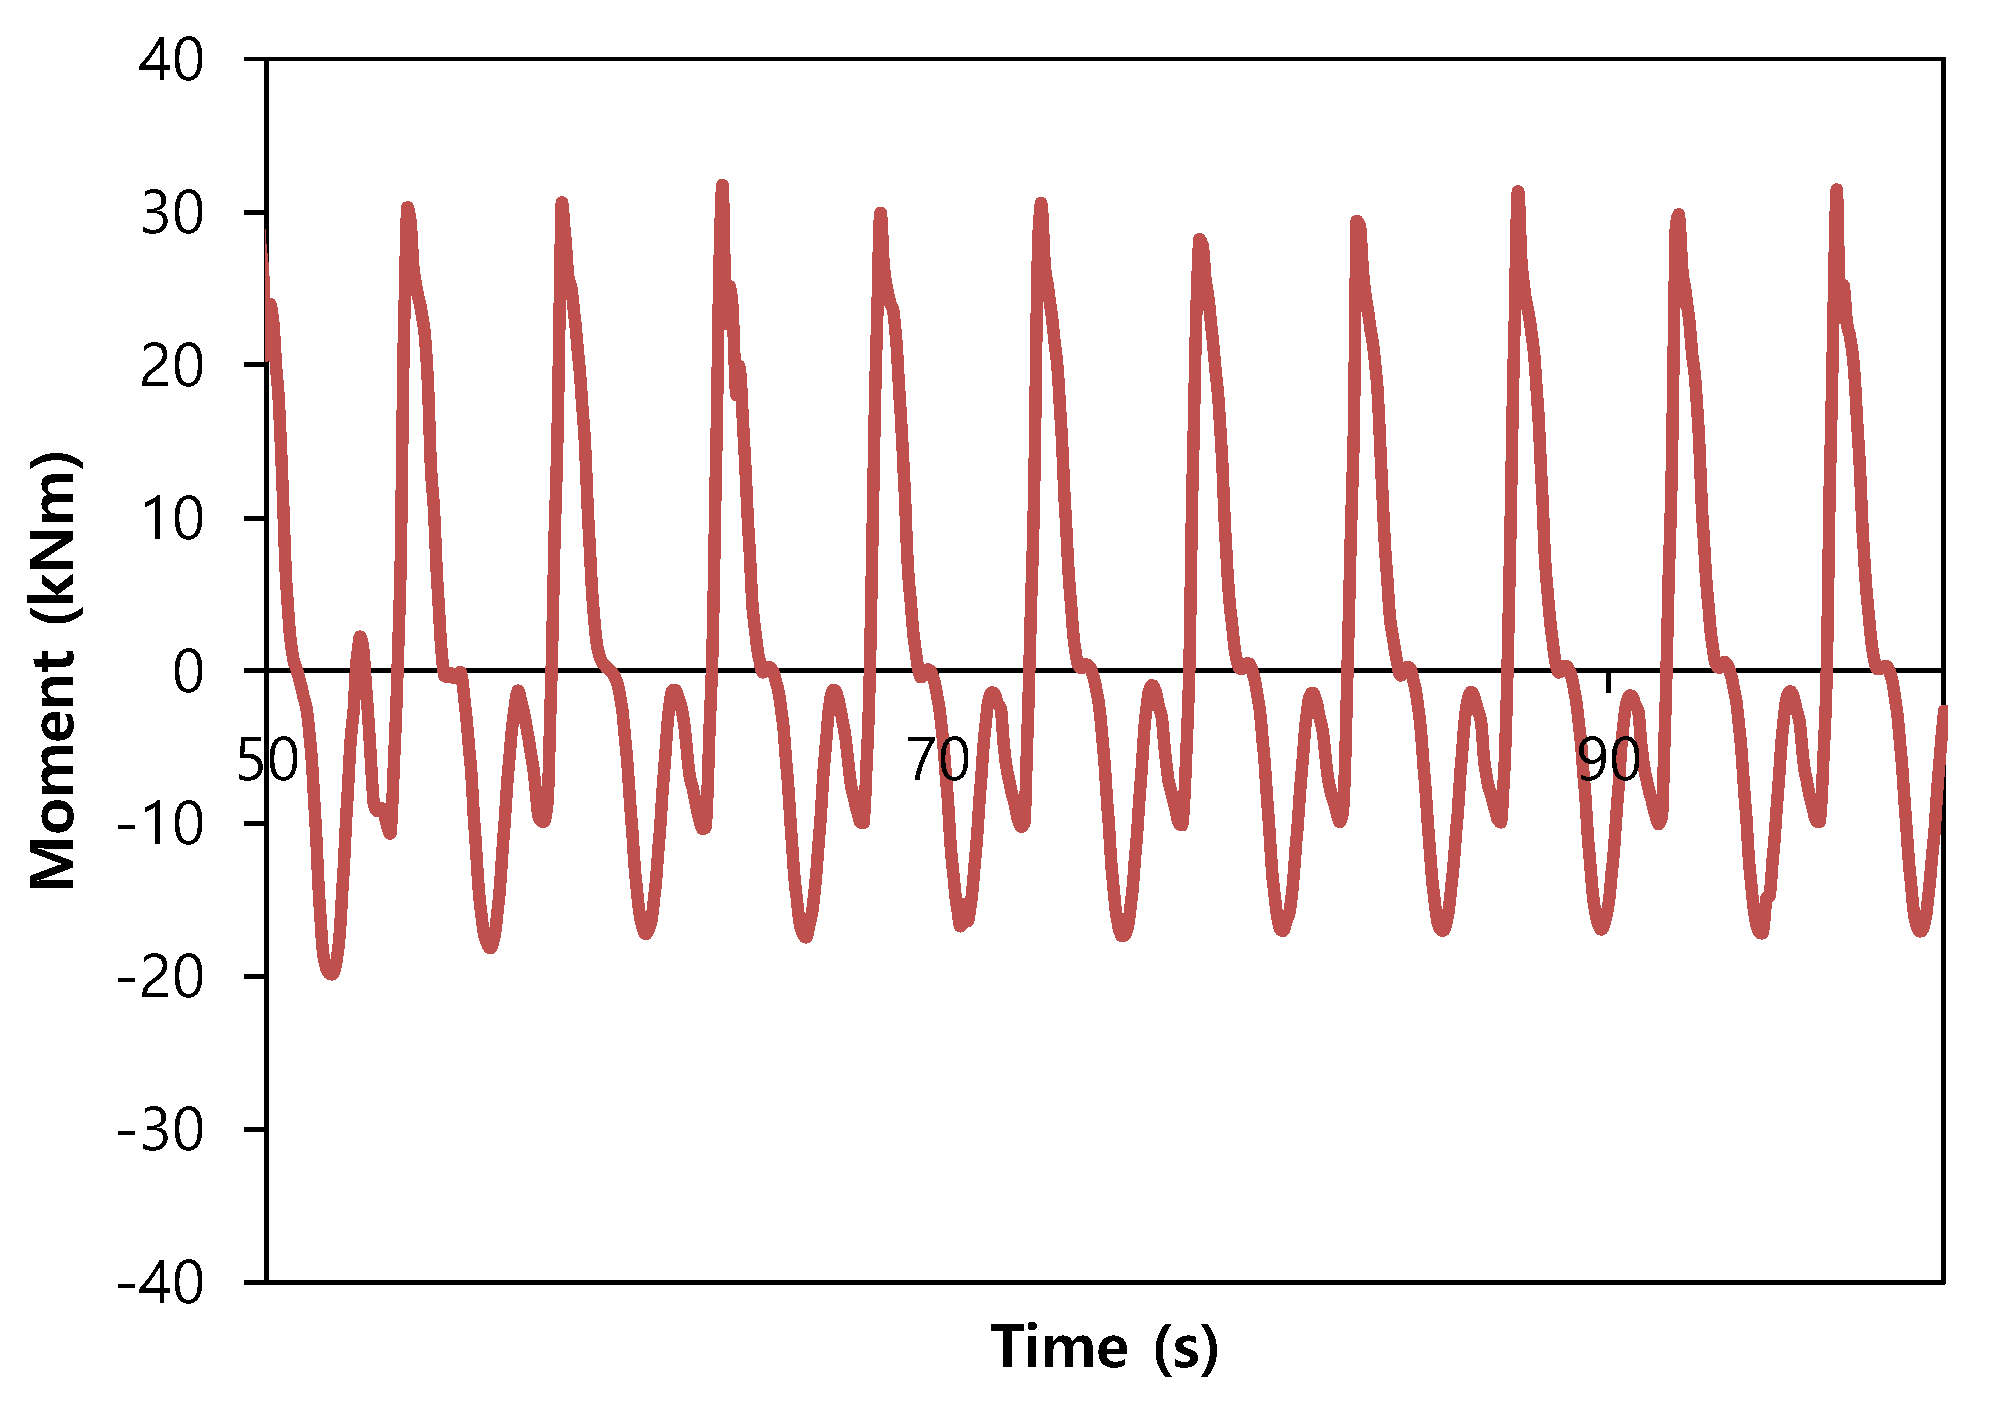
The behavioral characteristics of asymmetric WEC are that the positive pitch excursion is greater than the negative pitch excursion due to its unique configuration, as shown in Figure 5. The characteristic of asymmetric WEC was observed in the time series of a rotational moment of asymmetric WEC induced by H = 0.75 m and T = 4.75 s, as shown in Figure 8. Based on the characteristics, a declutching control was introduced into the PTO load torque in the numerical analysis as a uni-directional PTO system that gives a torque only if the pitch angular velocity is positive.
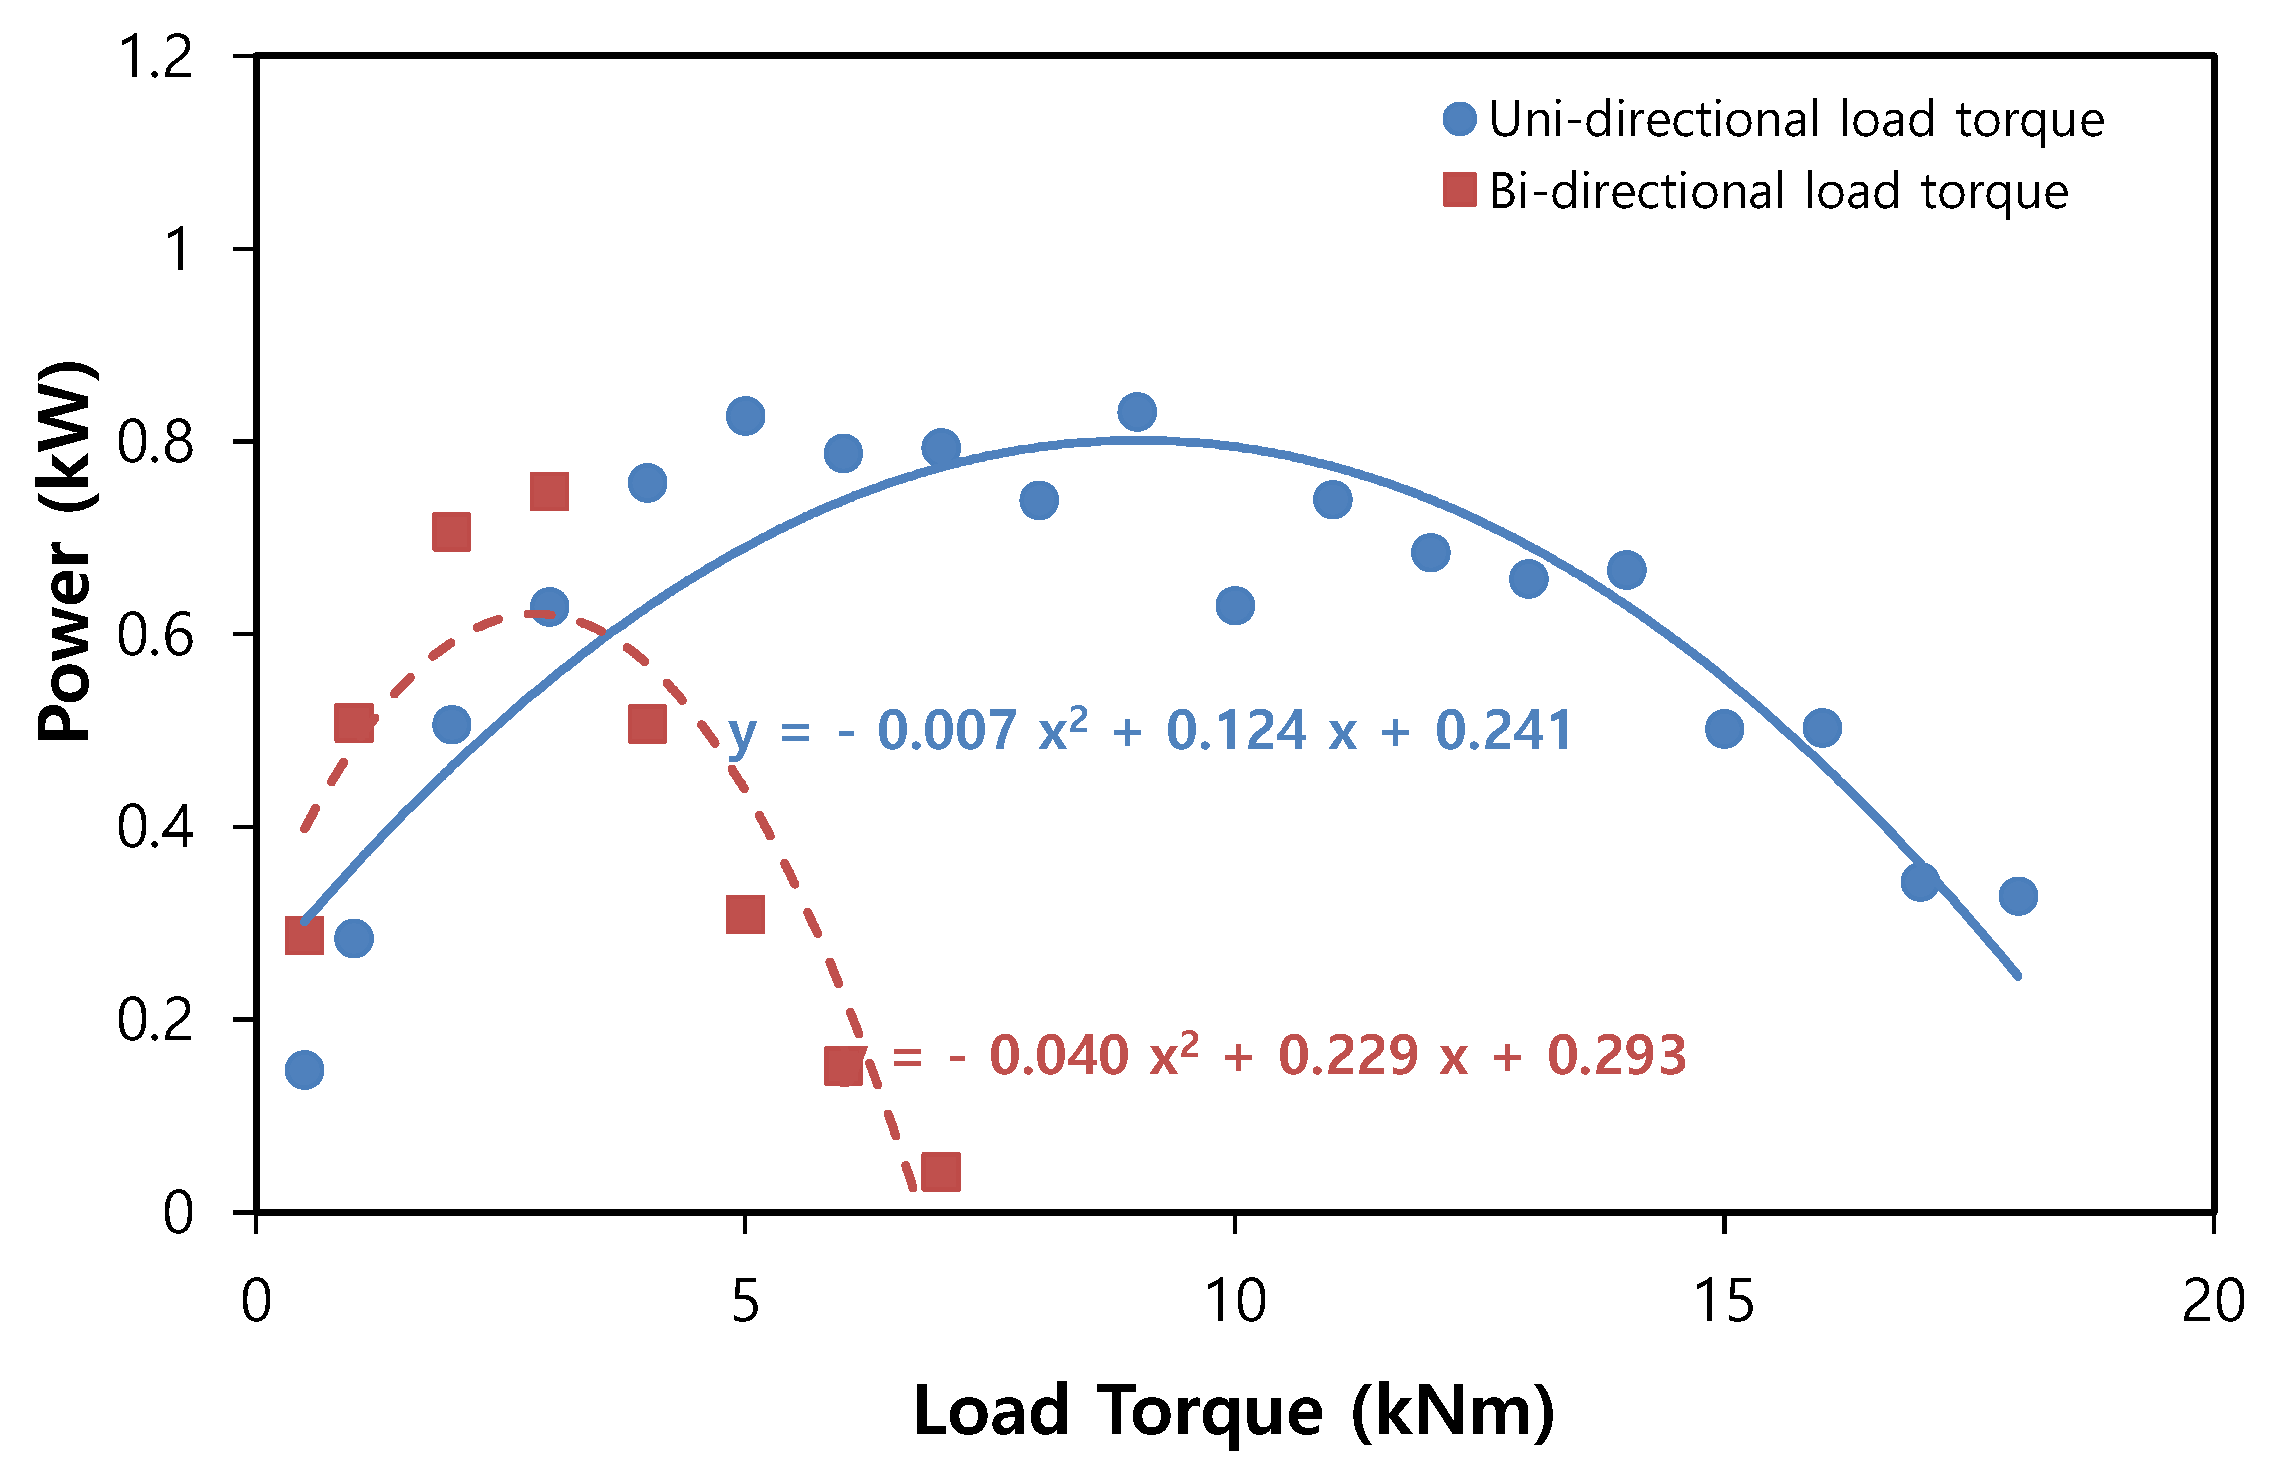
The extracted powers in response to increasing bi- and uni-directional PTO load torque at H = 0.75 m and T = 4.75 s were compared, as shown in Figure 9. The extracted powers were averaged over three times the wave periods. The optimized uni-directional PTO load torque (12 kNm) was more than the optimized bi-directional PTO load torque (3 kNm). The extracted power curve of second-order polynomial at uni-directional PTO load torque is much milder than at bi-direction. This means that the uni-directional PTO load torque is relatively insensitive to changes in extracted power with respect to changes in the PTO load torque. This characteristic is considered suitable for the hydraulic PTO system in the real sea test, which ensures a broad effective PTO range.
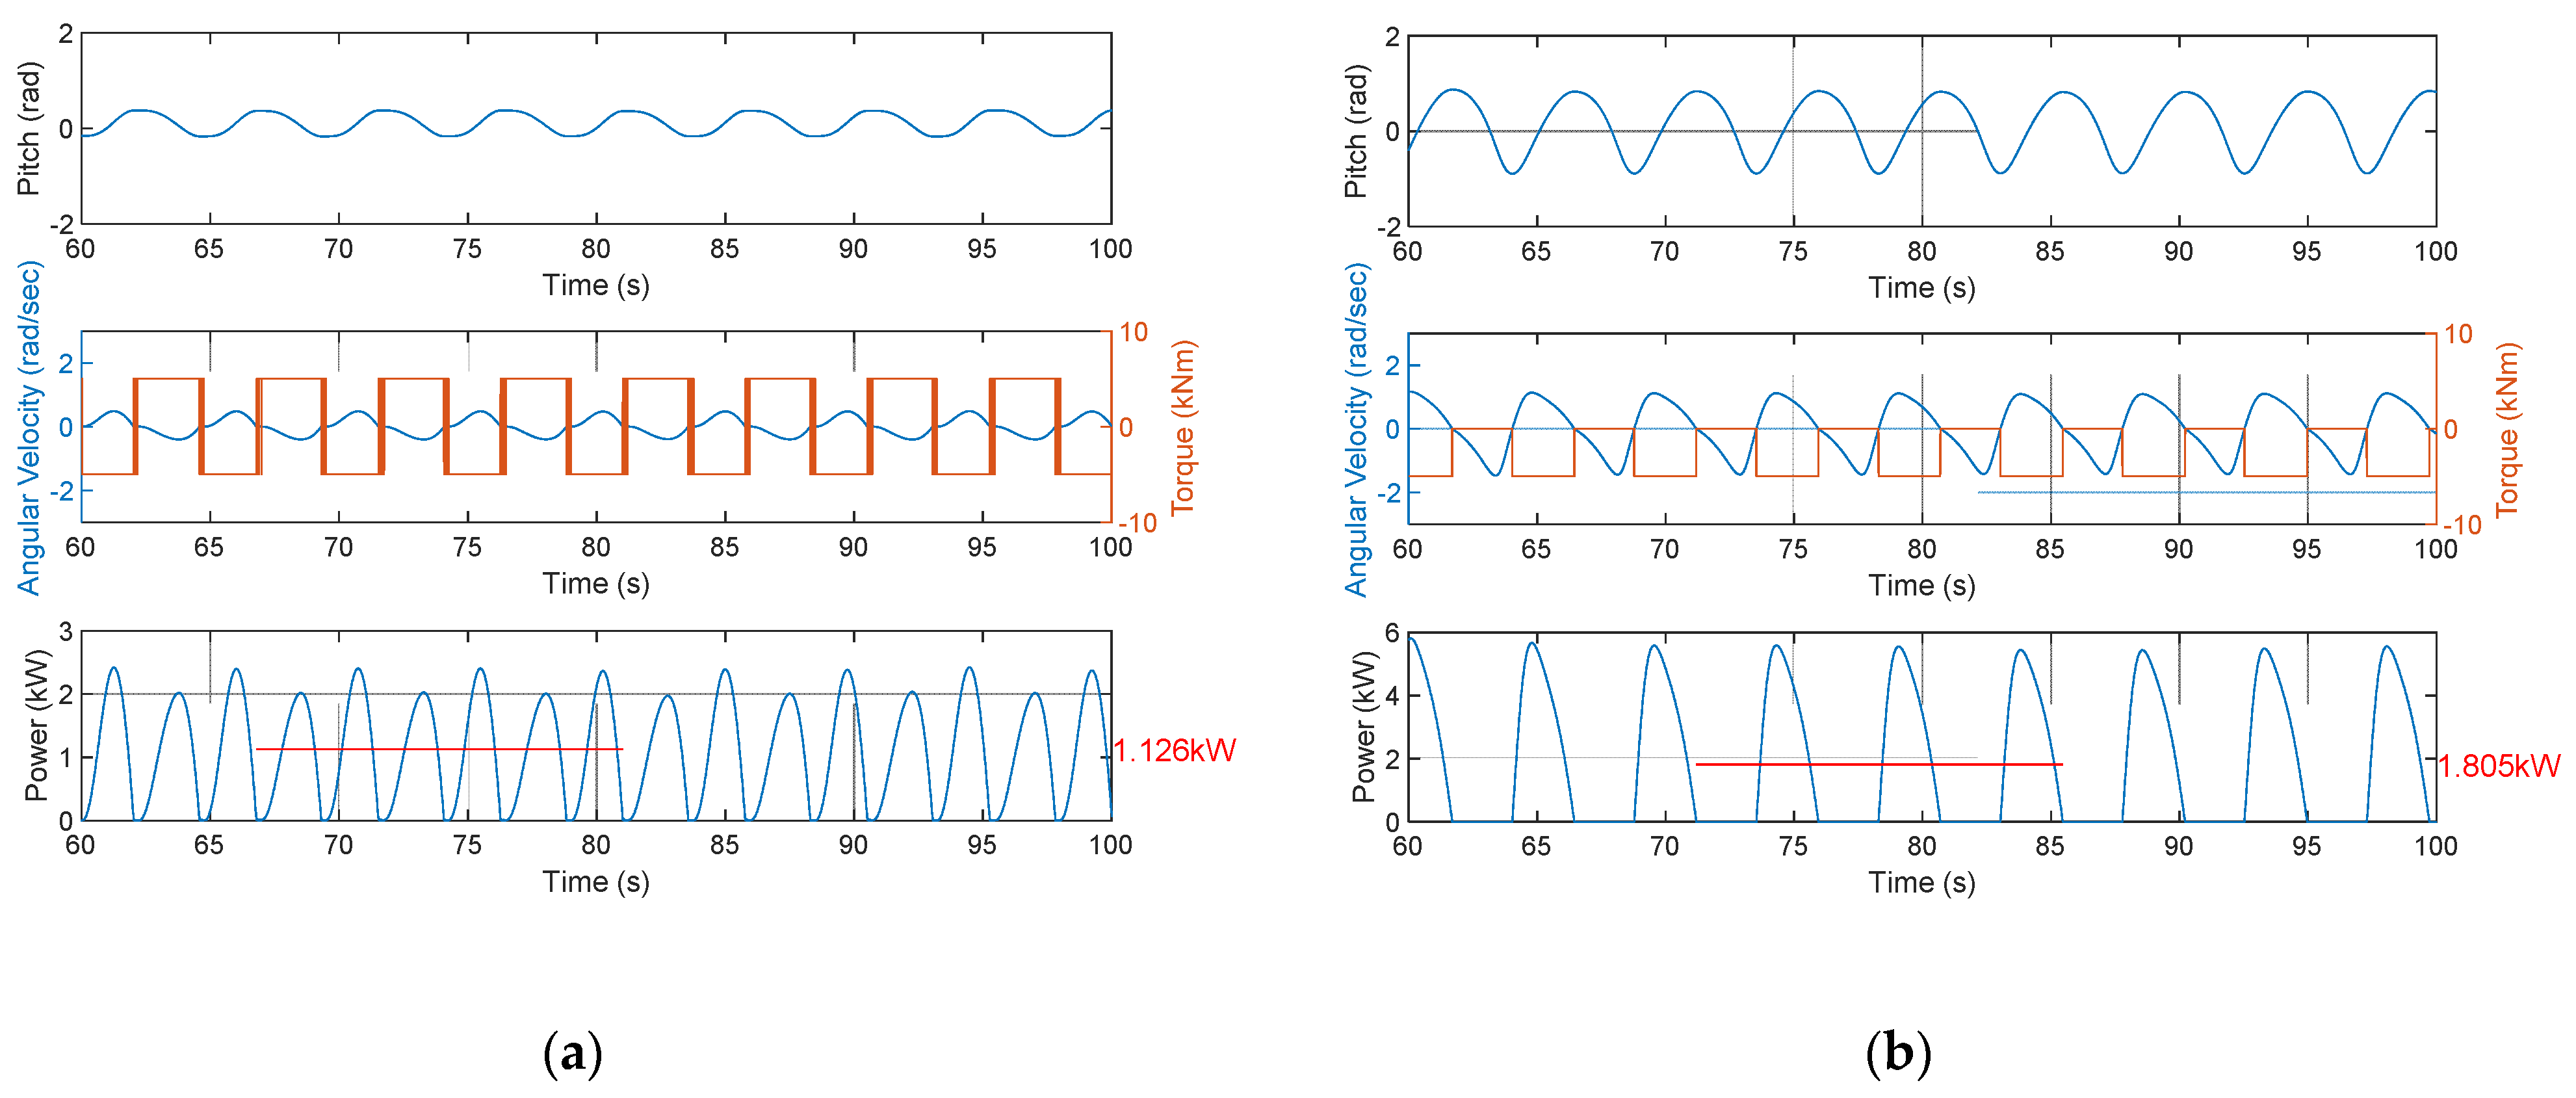
Figure 10a,b show the comparison of the time series of pitch excursion (top), angular velocity (middle), and the extracted power (bottom) at H = 0.75 m and T = 4.75 s between bi- and uni-directional PTO load torque of 5 kNm. Additionally, the time-averaged power over the three wave periods was included in the time series of extracted power. The restoring moment of the asymmetric WEC depends on its weight; however, the bi-directional PTO load torque system suppresses it to prevent the asymmetric WEC from being restored to its rest position (beak angle of 65°). Therefore, the pitch excursion with bi-directional PTO load torque is less than uni-directional PTO load torque because the asymmetric WEC absorbs the wave force in non-optimal conditions. The time series of angular velocity with bi-directional PTO load torque shows that the positive and negative constant PTO load torque oscillates rapidly near an inflection point because the total moment from flow and gravity is less than the constant PTO load torque. The uni-directional PTO load torque harnesses only half of the wave energy; however, the extracted power is larger because the PTO load torque is greater than the optimum PTO torque in the bi-directional case (5 Nm).
For irregular wave generation, the parameterized Joint North Sea Wave Project (JONSWAP) spectrum proposed by Goda [25] was used as shown in Equations (5) and (6).
S J ( ω ) = β H s 2 ω P 4 ω 5 exp [ 1.25 ( ω ω p ) 4 ] γ exp [ ( ω ω P ) 2 2 σ 2 ω P 2 ]
with   β = 0.0624 0.23 + 0.0336 γ 0.185 ( 1.9 + γ ) 1 × ( 1.094 0.01915 ln γ ) ,
where H s is the significant wave, and ω p = 2 π / T p is the peak frequency. Moreover, parameters are γ = 3.3 and σ = 0.07 for ω < ω p and σ = 0.09 for ω ω p . The first order sinusoidal waves with 200 components were superposed with a random phase difference. Figure 11a shows the time series of wave elevation generated in the numerical wave tank. Furthermore, Figure 11b shows the agreement between the spectral analysis from the generated waves and the target spectra to validate the irregular wave generation.
The extracted powers in response to increasing bi- and uni-directional PTO load torque at H s = 0.75 m and T p = 5.50 s were compared, as shown in Figure 12. The extracted powers were averaged over 1100 s. The optimized uni-directional PTO load torque (9 kNm) was greater than the optimized bi-directional PTO load torque (3 kNm). The extracted power curve of a second-order polynomial at uni-directional PTO load torque is much smoother than that in the bi-direction. Both results are similar to the regular wave test. This means that the extracted power with uni-directional PTO load is relatively insensitive to the PTO load torque variation than the bi-directional case.
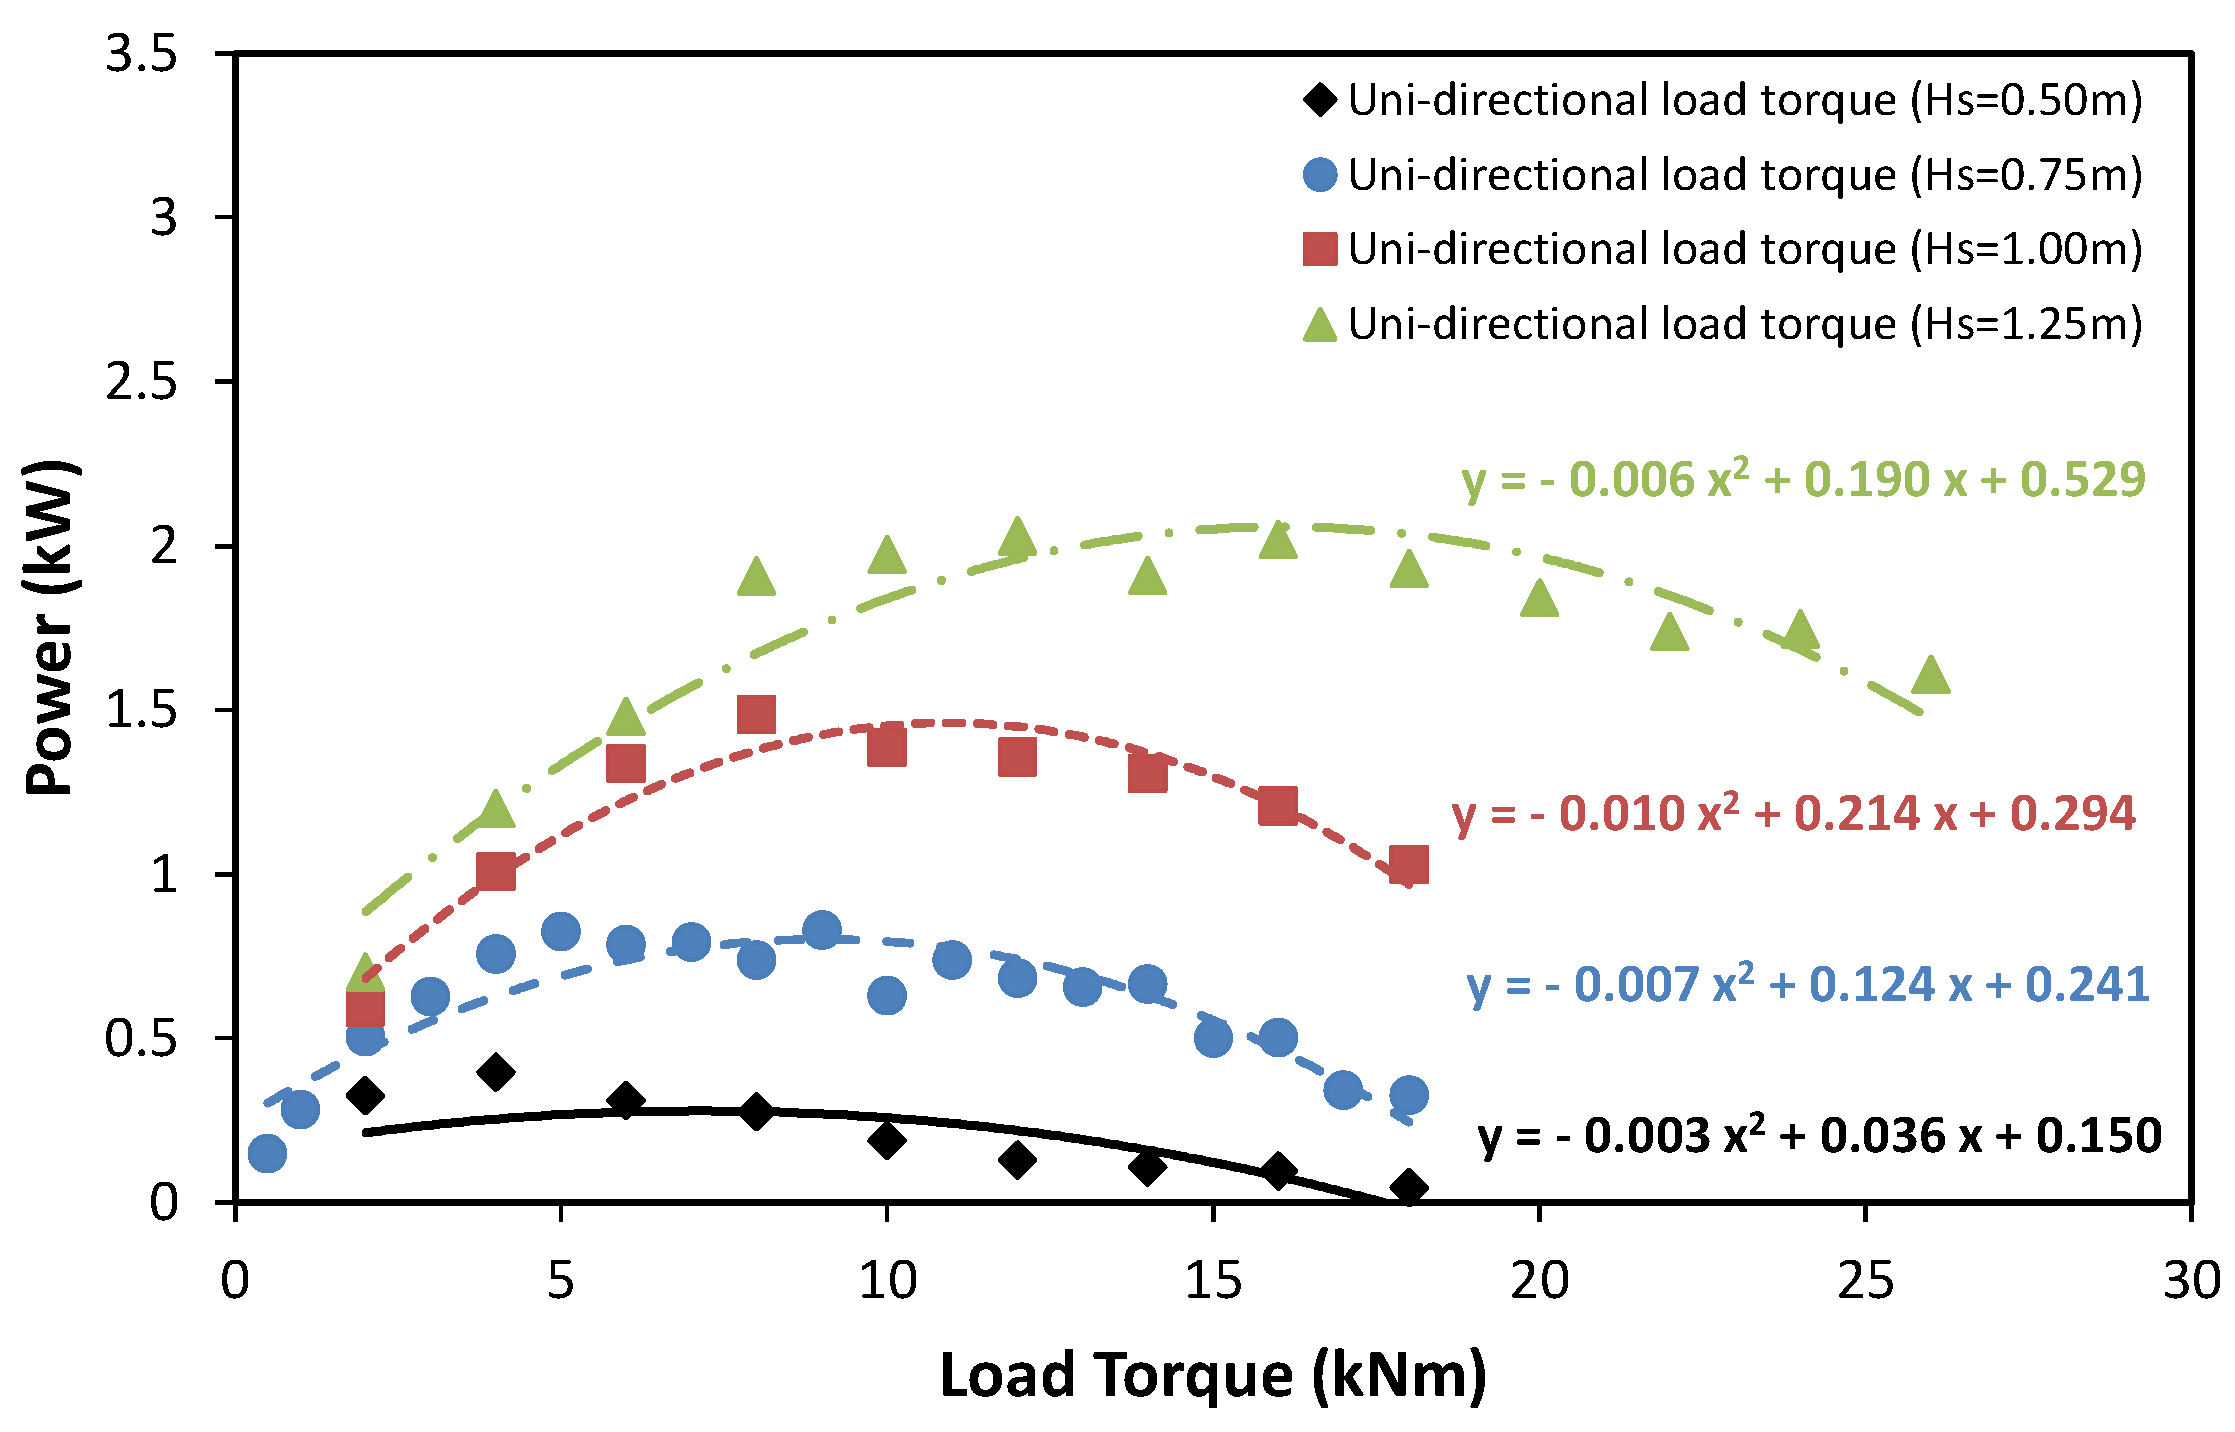
Furthermore, the extracted powers in response to significant wave height were investigated considering uni-directional PTO load torque. The extracted powers in response to increasing uni-directional PTO load torque at H s = 0.50 , 0.75 , 1.00 , and 1.25   m and T p = 5.50 s were compared, as shown in Figure 13. The optimal PTO load torque increased with increasing significant wave height. The extracted power was maximized over H s = 0.50 , 0.75 , 1.00 , and 1.25 m, when a proper PTO torque was selected in the 9 14 kNm range because the extracted power curves of second-order polynomial at uni-directional load torque have a mild tendency.

5. Conclusions

This paper investigates the optimum PTO torque of the asymmetric WEC with the OpenFOAM model and experimental data to design a 1/2-scale rotor to be used in real sea tests. The extracted power in response to changing the PTO load torque was estimated and compared with the experimental results. Both optimum PTO load torques at the maximum extracted power are in agreement.
The optimal PTO load torques induced by the regular wave and irregular wave based on wave climates in the real sea were investigated with OpenFOAM considering the bi- and uni-directional PTO load torque concerning the distinctive dynamical behavior of the asymmetric WEC. Hence, the maximum extracted power through the uni-directional PTO load torque was estimated to be slightly larger than the bi-directional PTO load torque. Moreover, the curve of extracted power with increasing uni-directional PTO load torque is gentler than the bi-directional PTO load torque. In addition, the optimal PTO load torque at the maximum extracted power is also estimated to be larger than in the bi-directional case. These results indicate that the uni-directional PTO load torque is more efficient than the bi-directional system for the hydraulic PTO design. The extracted power curve is shown to be still mild as the significant wave height increases. It was found that the extracted power induced by various significant wave heights can be nearly maximized by selecting a single optimal uni-directional PTO load torque. The estimation of the optimal load torque with numerical analysis provides design data for a hydraulic PTO system used in real sea tests.

Author Contributions

Conceptualization, H.S.K. and Y.H.B.; methodology, H.S.K.; formal analysis, H.S.K.; investigation, S.K. and H.S.K.; writing—original draft preparation, H.S.K.; experimental data curation, S.K.; supervision, Y.H.B.; project administration, Y.H.B.; funding acquisition, Y.H.B. All authors have read and agreed to the published version of the manuscript.

Funding

This work was supported by the Korea Institute of Energy Technology Evaluation and Planning (KETEP) and the Ministry of Trade, Industry & Energy (MOTIE) of the Republic of Korea (No. 20163010071690). This work was also supported by the National Research Foundation of Korea(NRF) grant funded by the Korean government (MSIT) (No.2021R1A2C1014600).

Institutional Review Board Statement

Not applicable.

Informed Consent Statement

Not applicable.

Data Availability Statement

Not applicable.

Conflicts of Interest

The authors declare no conflict of interest.

References

  1. Salter, S.H. Wave power. Nature 1974, 249, 720–724. [Google Scholar] [CrossRef]
  2. Salter, S.H.; Jeffrey, D.C.; Taylor, J.R.M. First Year Interim Report on Edinburgh Wave Power Project: Study of Mechanisms for Extracting Power from Sea Waves; University of Edinburgh: Edinburgh, UK, 1975. [Google Scholar]
  3. Evans, D. A theory for wave-power absorption by oscillating bodies. J. Fluid Mech. 1976, 77, 1–25. [Google Scholar] [CrossRef]
  4. Magagna, D.; Margheritini, L.; Alessi, A.; Bannon, E.; Boelman, E.; Bould, D.; Coy, V.; De Marchi, E.; Frigaard, P.B.; Soares, C.G. Workshop on identification of future emerging technologies in the ocean energy sector: JRC Conference and Workshop Reports. In Proceedings of the JRC Conference and Workshop: Workshop on Identification of Future Emerging Technologies in the Ocean Energy Sector, Ispra, Italy, 27 March 2018. [Google Scholar]
  5. Babarit, A.; Hals, J.; Muliawan, M.J.; Kurniawan, A.; Moan, T.; Krokstad, J. Numerical benchmarking study of a selection of wave energy converters. Renew. Energy 2012, 41, 44–63. [Google Scholar] [CrossRef]
  6. Sheng, W.; Alcorn, R.; Lewis, A. On improving wave energy conversion, part I: Optimal and control technologies. Renew. Energy 2015, 75, 922–934. [Google Scholar] [CrossRef]
  7. Falnes, J. A review of wave-energy extraction. Mar. Struct. 2007, 20, 185–201. [Google Scholar] [CrossRef]
  8. Salter, S.H.; Taylor, J.; Caldwell, N. Power conversion mechanisms for wave energy. Proc. Inst. Mech. Eng. Part M J. Eng. Marit. Environ. 2002, 216, 1–27. [Google Scholar] [CrossRef]
  9. Babarit, A.; Clément, A.H. Optimal latching control of a wave energy device in regular and irregular waves. Appl. Ocean Res. 2006, 28, 77–91. [Google Scholar] [CrossRef]
  10. Wu, J.; Yao, Y.; Zhou, L.; Göteman, M. Real-time latching control strategies for the solo Duck wave energy converter in irregular waves. Appl. Energy 2018, 222, 717–728. [Google Scholar] [CrossRef]
  11. Babarit, A.; Guglielmi, M.; Clément, A.H. Declutching control of a wave energy converter. Ocean Eng. 2009, 36, 1015–1024. [Google Scholar] [CrossRef] [Green Version]
  12. Peretta, S.; Ruol, P.; Martinelli, L.; Tetu, A.; Kofoed, J.P. Effect of a negative stiffness mechanism on the performance of the Weptos rotors. In Proceedings of the MARINE VI: VI International Conference on Computational Methods in Marine Engineering, Rome, Italy, 15–17 June 2015; pp. 58–72. [Google Scholar]
  13. Romano, A.; Lara, J.; Barajas, G.; Di Paolo, B.; Bellotti, G.; Di Risio, M.; Losada, I.; De Girolamo, P. Tsunamis Generated by Submerged Landslides: Numerical Analysis of the Near—Field Wave Characteristics. J. Geophys. Res. Ocean. 2020, 125, e2020JC016157. [Google Scholar] [CrossRef]
  14. Chen, H.; Qian, L.; Ma, Z.; Bai, W.; Li, Y.; Causon, D.; Mingham, C. Application of an overset mesh based numerical wave tank for modelling realistic free-surface hydrodynamic problems. Ocean Eng. 2019, 176, 97–117. [Google Scholar] [CrossRef]
  15. Ma, Z.; Qian, L.; Martinez-Ferrer, P.; Causon, D.; Mingham, C.; Bai, W. An overset mesh based multiphase flow solver for water entry problems. Comput. Fluids 2018, 172, 689–705. [Google Scholar] [CrossRef] [Green Version]
  16. Di Paolo, B.; Lara, J.L.; Barajas, G.; Paci, A.; Losada, I.J. Numerical analysis of wave and current interaction with moored floating bodies using overset method. In Proceedings of the International Conference on Offshore Mechanics and Arctic Engineering, Madrid, Spain, 17–22 June 2018; p. V002T008A037. [Google Scholar]
  17. Hu, Z.Z.; Greaves, D.; Raby, A. Numerical wave tank study of extreme waves and wave-structure interaction using OpenFoam®. Ocean Eng. 2016, 126, 329–342. [Google Scholar] [CrossRef] [Green Version]
  18. Ko, H.S.; Kim, D.; Poguluri, S.K.; Cho, I.-H.; Bae, Y.H. Optimal performance studies of a horizontal eccentric cylinder-type WEC in western sea of Jeju island with linear inviscid and nonlinear viscous numerical model. Ocean Eng. 2020, 202, 107180. [Google Scholar] [CrossRef]
  19. Weller, H.G.; Tabor, G.; Jasak, H.; Fureby, C. A tensorial approach to computational continuum mechanics using object-oriented techniques. Comput. Phys. 1998, 12, 620–631. [Google Scholar] [CrossRef]
  20. Poguluri, S.K.; Bae, Y.H. A study on performance assessment of WEC rotor in the Jeju western waters. Ocean Syst. Eng. 2018, 8, 361–380. [Google Scholar]
  21. Hong, K.Y.; Ryu, H.J.; Shin, S.H.; Hong, S.W. Wave energy distribution at Jeju Sea and investigation of optimal sites for wave power generation. J. Ocean Eng. Technol. 2004, 18, 8–15. [Google Scholar]
  22. Yakhot, V.; Orszag, S.; Thangam, S.; Gatski, T.; Speziale, C. Development of turbulence models for shear flows by a double expansion technique. Phys. Fluids A Fluid Dyn. 1992, 4, 1510–1520. [Google Scholar] [CrossRef] [Green Version]
  23. Jacobsen, N.G.; Fuhrman, D.R.; Fredsøe, J. A wave generation toolbox for the open—Source CFD library: OpenFoam®. Int. J. Numer. Methods Fluids 2012, 70, 1073–1088. [Google Scholar] [CrossRef]
  24. McCormick, M.E. Ocean Wave Energy Conversion; Courier Corporation: North Chelmsford, MA, USA, 2013. [Google Scholar]
  25. Goda, Y. Statistical variability of sea state parameters as a function of wave spectrum. Coast. Eng. Jpn. 1988, 31, 39–52. [Google Scholar] [CrossRef]
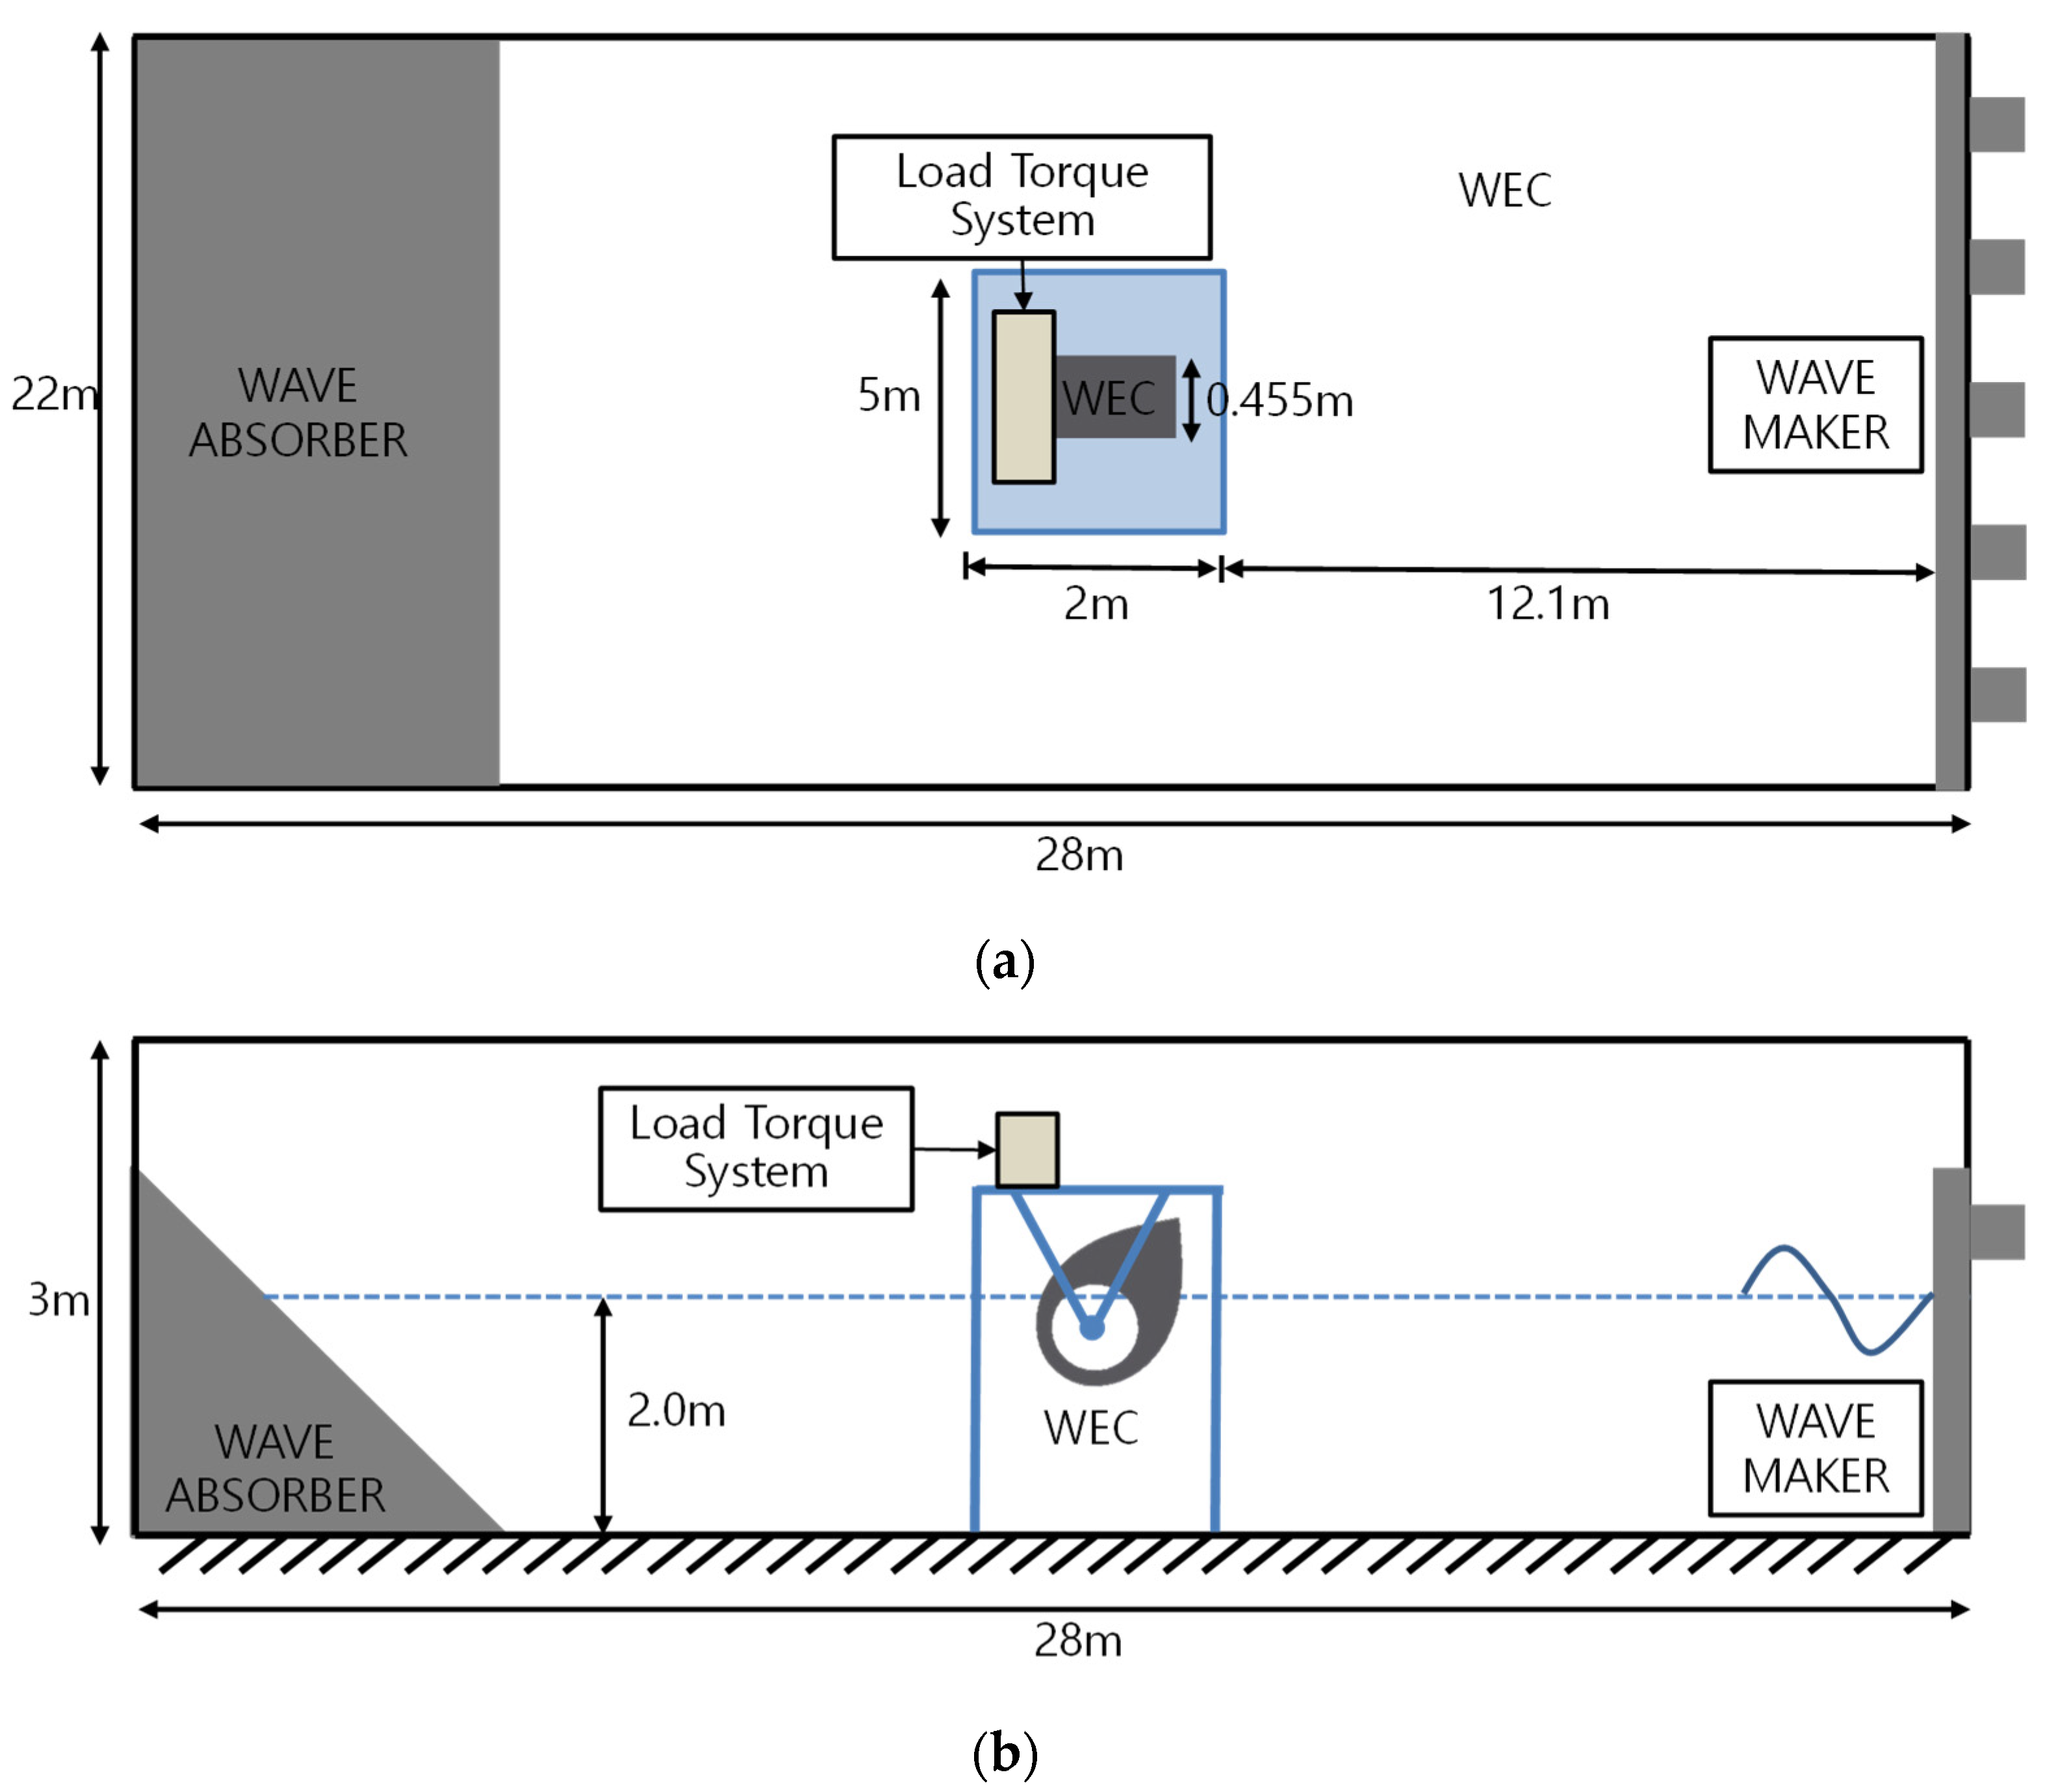
Figure 1. Sketch of experimental wave tank. (a) Plan view and (b) side view.
Energies 14 01449 g001
Figure 2. Definition and snapshot of the experimental set-up. (a) Asymmetric WEC and (b) PTO load torque system.
Energies 14 01449 g002
Figure 3. Two-dimensional schematic of an asymmetric WEC in a numerical wave tank.
Energies 14 01449 g003
Figure 4. Two-dimensional grid system near WEC and free surface elevation.
Energies 14 01449 g004
Figure 5. Comparison of time series of (a) angular velocity and (b) pitch excursion at H = 0.136 m and T = 1.432 s.
Energies 14 01449 g005
Figure 6. Comparison of the extracted power at H = 0.136 m and T = 1.432 s.
Energies 14 01449 g006
Figure 7. Comparison of time series of pitch angular velocity and power take-off (PTO) load torque of 4.29 Nm between experimental and numerical results.
Energies 14 01449 g007
Figure 8. Time series of pitch moment at H = 0.75 m and T = 4.75 s.
Energies 14 01449 g008
Figure 9. Comparison of the extracted power at H = 0.75 m and T = 4.75   s .
Energies 14 01449 g009
Figure 10. Comparison of the time series of pitch excursion (top), angular velocity (middle), and the extracted power (bottom) at H = 0.75 m and T = 4.75 s. (a) Bi-directional PTO load torque of 5 kNm and (b) uni-directional PTO load torque of 5 kNm.
Energies 14 01449 g010
Figure 11. Irregular wave generation. (a) Time series of wave elevation and (b) wave spectral density.
Energies 14 01449 g011
Figure 12. Comparison of the extracted power at H s = 0.75 m and T p = 5.50 s.
Energies 14 01449 g012
Figure 13. Comparison of the extracted power at H s = 0.50 , 0.75 , 1.00 , and 1.25 m and T p = 5.50 s.
Energies 14 01449 g013
Table 1. Specifications of an asymmetric WEC (1/11 scale).
MaterialAcrylic (Rotor)
Steel Bar (Ballast)
Beak Angle (deg)60
Stern Radius (R) (m)0.182
Inner Hollow Radius (RI) (m)0.17
Draft (m)3.796
Width (m)0.455
Horizontal and vertical coordinates of Center of Gravity (CoG) measured from Center of Rotation (CoR) (m)(−0.093, 0.0998)
Mass (kg)13.6505
Moment of Inertia (with respect to CoG) (kg·m2)0.4934
Table 2. A comparison of the root-mean-square difference (RMSD) values determined by the grid convergence test.
Mesh Resolutiondx/dz (m)Mesh Number per WavelengthMesh Number per Wave HeightRMSE of Wave Height
Grid 10.025/0.02512850.00310
Grid 20.017/0.01718880.00170
Grid 30.010/0.010320140.00094
Grid 40.007/0.007457190.00094
Table 3. Input PTO load torques.
Case 1Case 2Case 3Case 4Case 5Case 6
PTO Torque Load ( Nm )1.001.943.004.295.997.00
Table 4. Specification of an asymmetric WEC (1/2 scale).
MaterialAlloy Steel
Beak Angle (deg)65
Stern Radius (R) (m)1.0
Inner Hollow Radius (RI) (m)0.5
Draft (m)1.3
Width (m)2.5
Horizontal and vertical coordinates of Center of Gravity (CoG) measured from Center of Rotation (CoR) (m)(−0.1388, 0.1623)
Mass (kg)6880.2182
Moment of Inertia (with respect to CoG) (kg·m2)6790.6920
Publisher’s Note: MDPI stays neutral with regard to jurisdictional claims in published maps and institutional affiliations.