Article

Predicting Capacity Fade in Silicon Anode-Based Li-Ion Batteries

SUNY Polytechnic Institute, College of Nanoscale Science and Engineering, Albany, NY 12203, USA
*
Author to whom correspondence should be addressed.
Energies 2021, 14(5), 1448; https://doi.org/10.3390/en14051448
Submission received: 19 January 2021 / Revised: 23 February 2021 / Accepted: 4 March 2021 / Published: 6 March 2021
(This article belongs to the Collection Invited Papers on Electric Vehicles)

Abstract

:
While silicon anodes hold promise for use in lithium-ion batteries owing to their very high theoretical storage capacity and relatively low discharge potential, they possess a major problem related to their large volume expansion that occurs with battery aging. The resulting stress and strain can lead to mechanical separation of the anode from the current collector and an unstable solid electrolyte interphase (SEI), resulting in capacity fade. Since capacity loss is in part dependent on the cell materials, two different electrodes, Lithium Nickel Oxide or LiNi0.8Co0.15Al0.05O2 (NCA) and LiNi1/3Mn1/3Co1/3O2 (NMC 111), were used in combination with silicon to study capacity fade effects using simulations in COMSOL version 5.5. The results of these studies provide insight into the effects of anode particle size and electrolyte volume fraction on the behavior of silicon anode-based batteries with different positive electrodes. It was observed that the performance of a porous matrix of solid active particles of silicon anode could be improved when the active particles were 150 nm or smaller. The range of optimized values of volume fraction of the electrolyte in the silicon anode were determined to be between 0.55 and 0.40. The silicon anode behaved differently in terms of cell time with NCA and NMC. However, NMC111 gave a high relative capacity in comparison to NCA and proved to be a better working electrode for the proposed silicon anode structure.

1. Introduction

Lithium-ion batteries are the most popular type of rechargeable battery owing to their low cost, long life, reliability, and relative environment friendliness. Most electronic devices like laptop computers and mobile phones use lithium-ion batteries as their power source [1], and their use in automotive and aerospace applications has also become a reality [2,3]. Since these batteries are electrochemical power sources, they have great potential for use in large-scale applications. Hence, improvising their efficiency, robustness and specific charging/discharging capability are key research focus areas [4,5]. Li-ion batteries are categorized as energy storage systems which depend on insertion reactions for both positive and negative electrodes where lithium ions are the charge carriers. Li-ion batteries constitute multiple cell chemistries in accordance with this definition [6].
The anodes are generally carbon-based, lithium metal, lithium titanate, or alloy based (e.g., silicon-based), while cathodes are intercalating compounds permitting lithium ions to enter and exit [5,7]. Charging (lithiation) involves the lithium-ion accumulation on the anode after passing through the electrolyte from the cathode, and the opposite happens during the de–lithiation/discharging process. In electrode materials, expansion and contraction during lithiation/charging, delithiation/discharging process due to stresses induced by diffusion are common phenomenon. Such volume changes often lead to mechanical damages such as deformation, capacity fade and electrode fracture [8,9].
Silicon was selected as the anode material in this work. It has a gravimetric capacity of 4200 mAh/g even at low potentials, making it ideal for large scale applications like electric vehicles. A major concern with silicon is that it has a significant volume expansion of as high as 400% during lithiation. This generates strain, leading to cracking and then capacity fade, and eventual disintegration of the silicon electrode [10]. Silicon anode degradation can also occur due to the quality of the solid-electrolyte interface (SEI) developed from the solvent and salt decomposition in the electrolyte. During the first insertion phase of lithium into the electrode, a SEI layer is formed between the electrode and the electrolyte which acts like a barrier. The purpose of the barrier is to provide for conduction of lithium ions, electron flow insulation, and limiting electrolyte disintegration, all of which prevents the continuous reduction of the battery’s cycle performance [11,12]. Electrode particulate design structures such as nanowires, nanotubes, nanofibers, porous structures, and solid core-shell, yolk shell and hollow core shell structures, have been proposed to address specific Si electrode issues such as Si pulverization, electrical contact loss and fracture of the solid electrolyte interphase. Since Si nanoparticles have good electrochemical properties and can easily be mass produced, there is a need to select and optimize the particle structure and size.
Battery modeling is a cost-effective way to design optimized batteries and can reduce the time and cost of development by providing insight into the effect of design parameters and operating conditions on the performance of the battery, including the efficiency, safety, and degradation of batteries [13]. It was shown that the losses in capacity are linked to phase changes in the inserted electrode materials, active material dissolution, passive film formation, etc [14]. Consumption of lithium ions at the anode during the cell charge and cathode dissolution are considered as major factors for capacity losses [14,15,16]. Based on these issues, further modeling studies have shown that increased impedance at both the electrodes and loss of active lithium at negative electrode contribute to the irreversible capacity losses [15]. Identification and measurement of the design variables are two important factors which are regulated with validated modeling to support experimental work to improve battery operation. There are several different types of battery models, including empirical, electrochemical, and atomistic/molecular models [13,17].
Electrochemical models are considered to be the best tools to explore the design parameters and their influence on the performance of the battery. In our current research, we used COMSOL Multiphysics version 5.5 (Stockholm, Sweden) for the simulations to explore the effect of parameters on cell performance and also to address the above mentioned issues in silicon anodes. The current electrochemical model uses electrode structures as porous matrices of solid active particles. The objective of our research is to address the high-volume changes in silicon anodes by studying the effects of growth of SEI layer and at the same time to focus on a possible working cathode to establish a full cell. Most of the experimental work is still concentrated on half-cells with Li metal as the counter electrode to analyze the electrochemical behavior of silicon. Loss of recyclable lithium is the main factor in the reduction of performance of full cell. Studies on half cells cannot address long term cycling performance of silicon anodes and only full cells could possibly give an insight into the commercial application [18].
NMC electrodes have high specific energy and good thermal characteristics [7], while NCA provides high specific energy and specific power and a long lifespan, which makes it ideal for capacity fade tests [7,13]. Based on mentioned properties, the two cathode materials evaluated in this paper are lithium nickel manganese cobalt oxide (NMC) and lithium nickel cobalt aluminum oxide (NCA).
Comparisons between the performance of the two cathodes with silicon anode would be discussed further. A forthcoming work would be focused on the role of battery material, structural characteristics on the thermal behavior of lithium-ion battery with silicon as the anode.

2. Materials and Methods

2.1. Model Development

Two separate 1D capacity fade models (one with NCA as positive electrode and another with NMC as positive electrode) were developed to understand capacity fade in a cell. The cell was discharged at four different loads (0.5C, 1C, 1.5C, 2C). The capacity fade model is based on a constant current/constant voltage (CCCV) cycling condition. The cell is charged at a rate of 1C until the voltage exceeds 4.1 V. Then, at a constant voltage of 4.1 V, it is charged until the current drops below 0.1 A. Next, the cell is discharged until the voltage drops below 3.1 V at a constant current with a rate of 1C.
Since it is difficult to work experimentally with a material like pure silicon, the discharge curves in this model (with NCA cathode) were compared with those of research work carried out on a commercial NCA lithium-ion pouch cell where the negative electrode is graphite. According to the model, graphite electrodes show 20% capacity fade and reduction in the battery life for 2000 cycles [19].
Although the model is 1D, a schematic shown in Figure 1 shows the assumed structure in two dimensions, comprised of two electrodes sandwiched between a separator with electrolyte. Both the electrodes are modeled as porous solid matrices of active particles which are spherical in shape and of uniform size. The separator is a porous matrix filled with electrolyte made up of lithium hexafluorophosphate (LiPF6) dissolved in a 3:7 liquid mixture of ethylene carbonate (EC) and dimethyl carbonate (DMC).
Aging results in two phenomena: The first is the decomposition of the SEI layer and thus an increase in the internal resistance. The second is the increase in the capacity loss since the cyclable Li is utilized in the formation of SEI [19].
Accordingly, this model’s focus is on the diffusion and migration of the particles in the electrodes and electrolyte, the electrode kinetics, and the conductivity of the ions in the electrolyte.
Using this model, the volume fractions of the electrolyte in the electrodes were taken as follows:
ε 1 , s = 1 ε 1 , e 0.172
ε 2 , s = 1 ε 2 , e 0.170
where,
  • ε 1 , s = Solid phase volume fraction of the negative electrode
  • ε 2 , s = Solid phase volume fraction of the positive electrode
The values 0.172 and 0.170 represent the assumed volume fraction due to the conductive carbon filler material in each electrode, which is considered to be inert for electrolyte transport or lithium intercalation.
Additionally, since the modeling was based on the effects of the growth of the SEI layer, which causes capacity fade, it is important to focus on the kinetics of the layer formation. The nature of the SEI layer formation is dependent on the type of electrolyte in the battery, and results in the irreversible loss of ethylene carbonate. This is stated as [19]:
S   +   Li +   +   e P SEI
where S represents the ethylene carbonate electrolyte and PSEI is the parasitic SEI reactant formed in the reaction.
The following equation describes the kinetics of this parasitic reaction with respect to the local current density on the particle surface in the negative electrode:
i loc , SEI   =   1 + HK Ji loc , 1 C , ref exp α η SEI F RT + q SEI fJ i loc , 1 C , ref
where:
  • i loc , SEI = local current density,
  • HK = dimensionless silicon expansion factor function, defined as zero during de–intercalation and the value depends on the state of charge of the negative electrode,
  • J = exchange current density for the parasitic reaction (dimensionless),
  • α = transfer coefficient of the electrochemical reduction reaction,
  • η SEI = over-potential (assumes an equilibrium potential of 0 vs. lithium),
  • q SEI = local accumulated charge from the SEI formation,
  • f = parameter based on the SEI film properties (dimensionless)
The expression below is used to keep track of the SEI concentration in the porous electrode, cSEI (moles/m3),
c SEI t = υ SEI i loc , SEI nF
where:
  • υ SEI = reaction coefficient of the SEI species,
  • n = number of electrons involved in the reaction,
The term q SEI which is the local accumulated charge belonging to the SEI formed layer, is directly proportional to c SEI ,
q SEI = Fc SEI A υ
where:
  • A υ = electrode surface area (1/m)
  • F = Faraday’s constant
The parasitic reaction leads to the loss of cyclable lithium, hence increasing the resistance of the SEI film. The model incorporates two important formulas related to the SEI film. First, the film thickness is calculated as follows:
δ film = c SEI M P A υ ρ P + δ film , 0
where MP is the molar weight
ρ P is the density of the formed products from the side reactions. Here the initial film thickness at t = 0, δ film , 0 , was assumed to be 1 nm.
The second important characteristic is the film resistance Rfilm (Ω cm)
R film = δ film κ
where,
  • κ = SEI film conductivity (S/m)
This resistance increases with the film thickness.

2.2. Model Assumptions

Silicon was used as the negative electrode and ethylene carbonate (EC) in LiPF6 as the electrolyte. Since is there is no available experimental data for silicon, the following parameters in Table 1 and Table 2 are taken from COMSOL materials library validated by comparing the experimental data of graphite and EC in LiPF6 [20,21]. The Electrochemical model parameters in Table 3, and governing equations, boundary conditions of this model in Appendix A and Appendix B are used from comsol library [19].
NOTE:
Initial capacity of the cell = Maximum Lithium concentration in the positive electrode × Maximum electrode state of charge of positive electrode × Solid phase volume fraction of positive electrode × Thickness of the positive electrode × Faraday’s constant
Initial   capacity   of   the   cell   =   c s , max × SOC max × ε s × L p ×   F

3. Results

The performance of the lithium-ion battery was simulated by modeling a silicon anode and comparing both NCA and NMC cathodes. Figure 2 shows the discharge curves for different Si particle sizes (4   μ m, 2   μ m, 1   μ m, 150 nm, 100 nm) coupled with the NCA cathode, for the first and 2000th cycle. For these cases, there were no observed potential losses. However, when we compare the 2000th cycle discharge curves of these five particle sizes in Figure 3, it is observed that the degree of capacity fade decreases with a decrease in the particle size of the negative electrode. This loss in capacity is negligible for the smallest particles (150 nm and smaller), consistent with other published work mentioning that the particle size, surface condition and morphology are important in the electrochemical performance of lithium-ion batteries [23,24,25,26,27].
Further, the electrolyte volume fraction stability at both anode interfaces in Figure 4 was assessed at four different values of the volume fraction of the electrolyte in the anode material ( ε 1 , e ) , 0.55, 0.50, 0.45 and 0.40, while holding the volume fraction of the electrolyte in the positive electrode constant at 0.41. The positive electrode volume fraction was based on the values from the COMSOL materials library.
The changes in the volume fraction are shown in Figure 4. It was observed that, for all samples, the available volume fractions after 2000 cycles were essentially the same as from the initial value, for boundaries of the negative electrode.
Using the results from Figure 3 and Figure 4 to select values of particle sizes (100 nm) and electrolyte volume fraction of the electrolyte in the negative electrode (0.45) for a battery modeled with the NCA cathode, the effects of four loading conditions (0.5C, 1C, 1.5C, 2C) on cell lifetime are modeled as shown in Figure 5. It is observed that none of the loading conditions show any capacity fade between the 1st and 2000th cycles, indicating that the selected values of particle size and volume fraction of the electrolyte in the negative electrode were a good choice.
Analogously to Figure 2, Figure 6 compares cycle 1 and cycle 2000 discharge curves for the NMC cathode. In the case of NMC, the optimized Si anode particle sizes were determined to be 150 nm or smaller, which resulted in no significant capacity fade. Figure 7 compares the discharge curves of the NMC electrode for different Si anode particle sizes (4   μ m, 3   μ m, 1   μ m, 150 nm, 100 nm) for the 2000th cycle of each case. It shows that the fade increases with particle size like the trend in Figure 3. Similar to Figure 4, Figure 8 shows the available electrolyte volume fraction values at the two boundaries of the Si anode. There was no substantial difference in the volume fraction values for both NCA and NMC cathodes at the two boundaries even after 2000 cycles.
Figure 9 is a comparison of the discharge curves of 1 and 2000 cycles at four rates of discharge (0.5C, 1C, 1.5C, 2C) for a NMC cathode.
Comparing Figure 9 with Figure 5, the NCA cathode shows a lifetime of over 8000 s at a load 0.5C, while NMC shows a lifetime of 7000 s at the same load. It is also observed that as the load increases, the cell lifetime decreases, which is evident, but the lifetime variation is dependent on the chemistry of the battery.
The relative capacity under a load 1C remained unchanged at 0.85 after 2000 cycles for NCA cathode, while it was unchanged at 0.98 for NMC.

4. Discussion

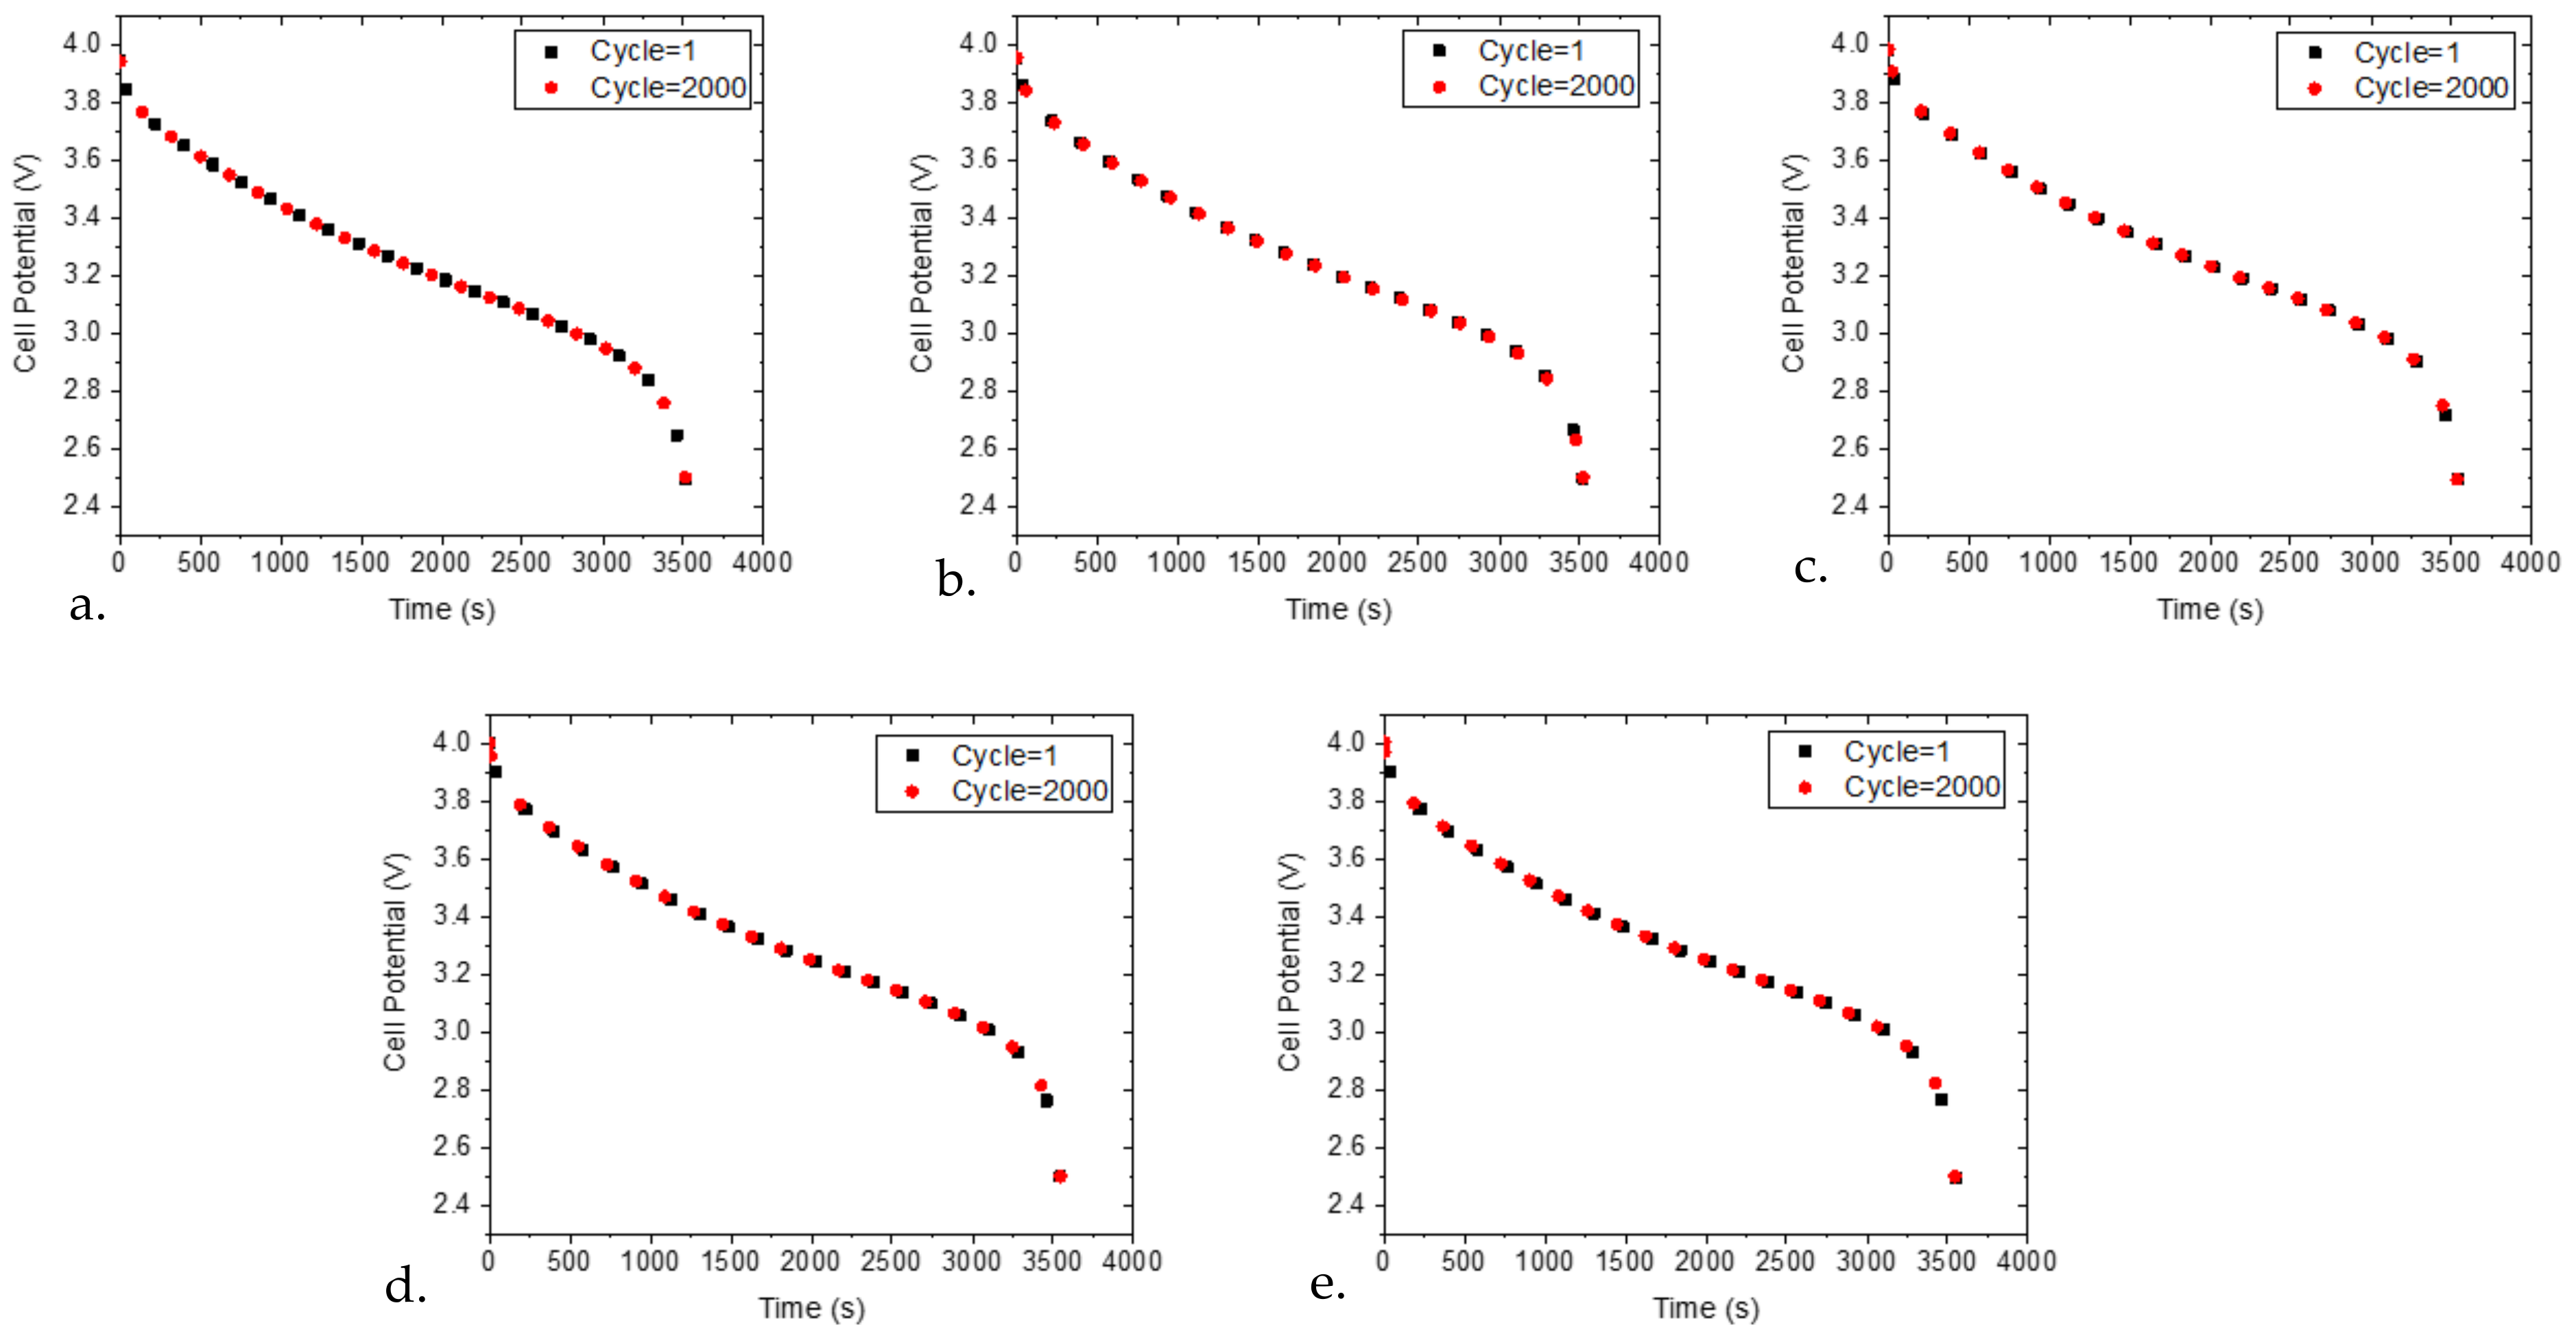
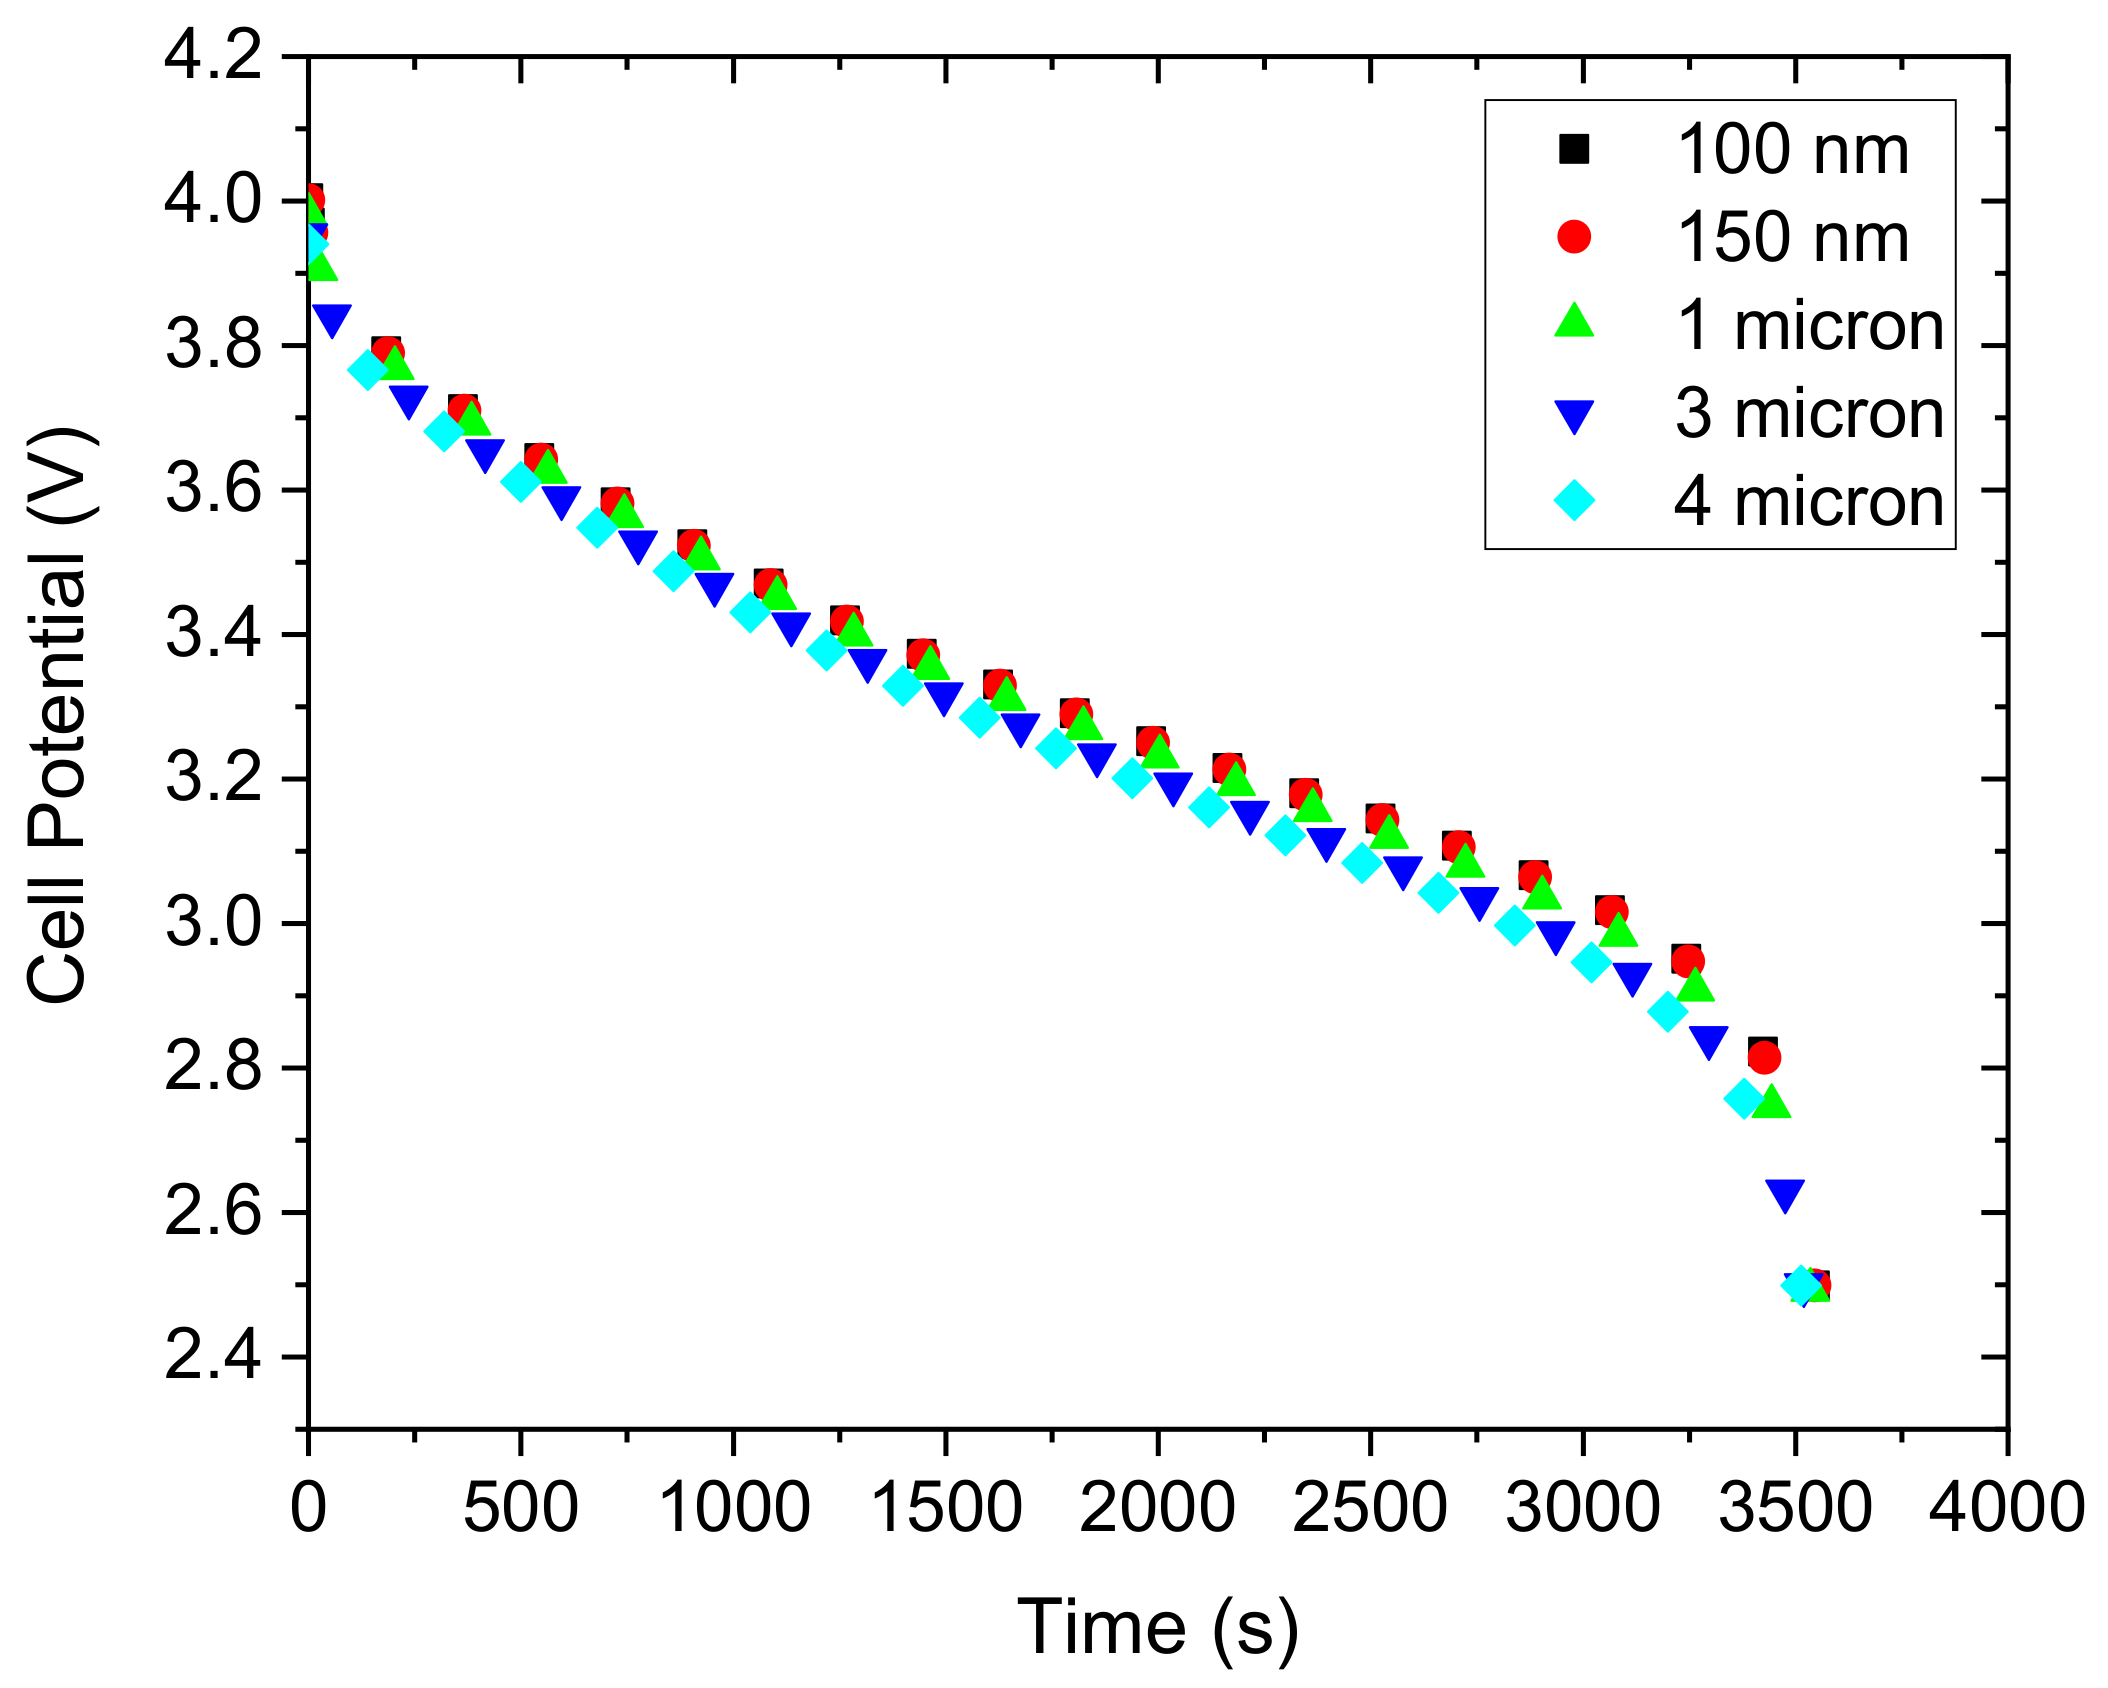
4.1. Effect of Changing the Si Anode Particle Size

Two types of polarizations occur during battery discharge, electrochemical polarization, and diffusion polarization. Electrochemical polarization arises because of the difference in the reaction rate at different positions of the electrodes. Initially, the reaction rate is highest near the membrane and lowest at the collector which is reversed as the discharging process continues. On the other hand, diffusion polarization develops from changes in the electrolyte concentration due to the current flow through the electrode and electrolyte interface. The electrochemical reaction rate and mass non uniformity can also lead to diffusion polarization [28].
Solid and liquid phase diffusion polarization increases as the discharge process progresses, and the active material particle size affects solid phase diffusion [28]. Consistent with this, Figure 2 and Figure 6 show that smaller Si anode particle sizes minimize the overall capacity fade effects. There was no detectable capacity fade for Si anode particle sizes of 150 nm and smaller, as summarized in Table 4 for NCA cathodes.
A similar trend was observed in the case of NMC cathode and Table 5 describes the effect of Si particle size on the discharge curves.
Figure 2 and Figure 6 show that smaller negative electrode particles reduce polarization, this is believed to arise from the short diffusion lengths for the lithium ions. As a result, electrodes with such small particles may be useful for high-rate charge/discharge processes [29]. Electrode materials with large specific surface areas have short solid-state transport distances, which result in enhanced power density and offer a better cycling stability [30,31].
A larger specific surface area leads to improvement in the electrochemical reaction rate, a decrease of the polarization potential and reduction in the activation polarization [28].

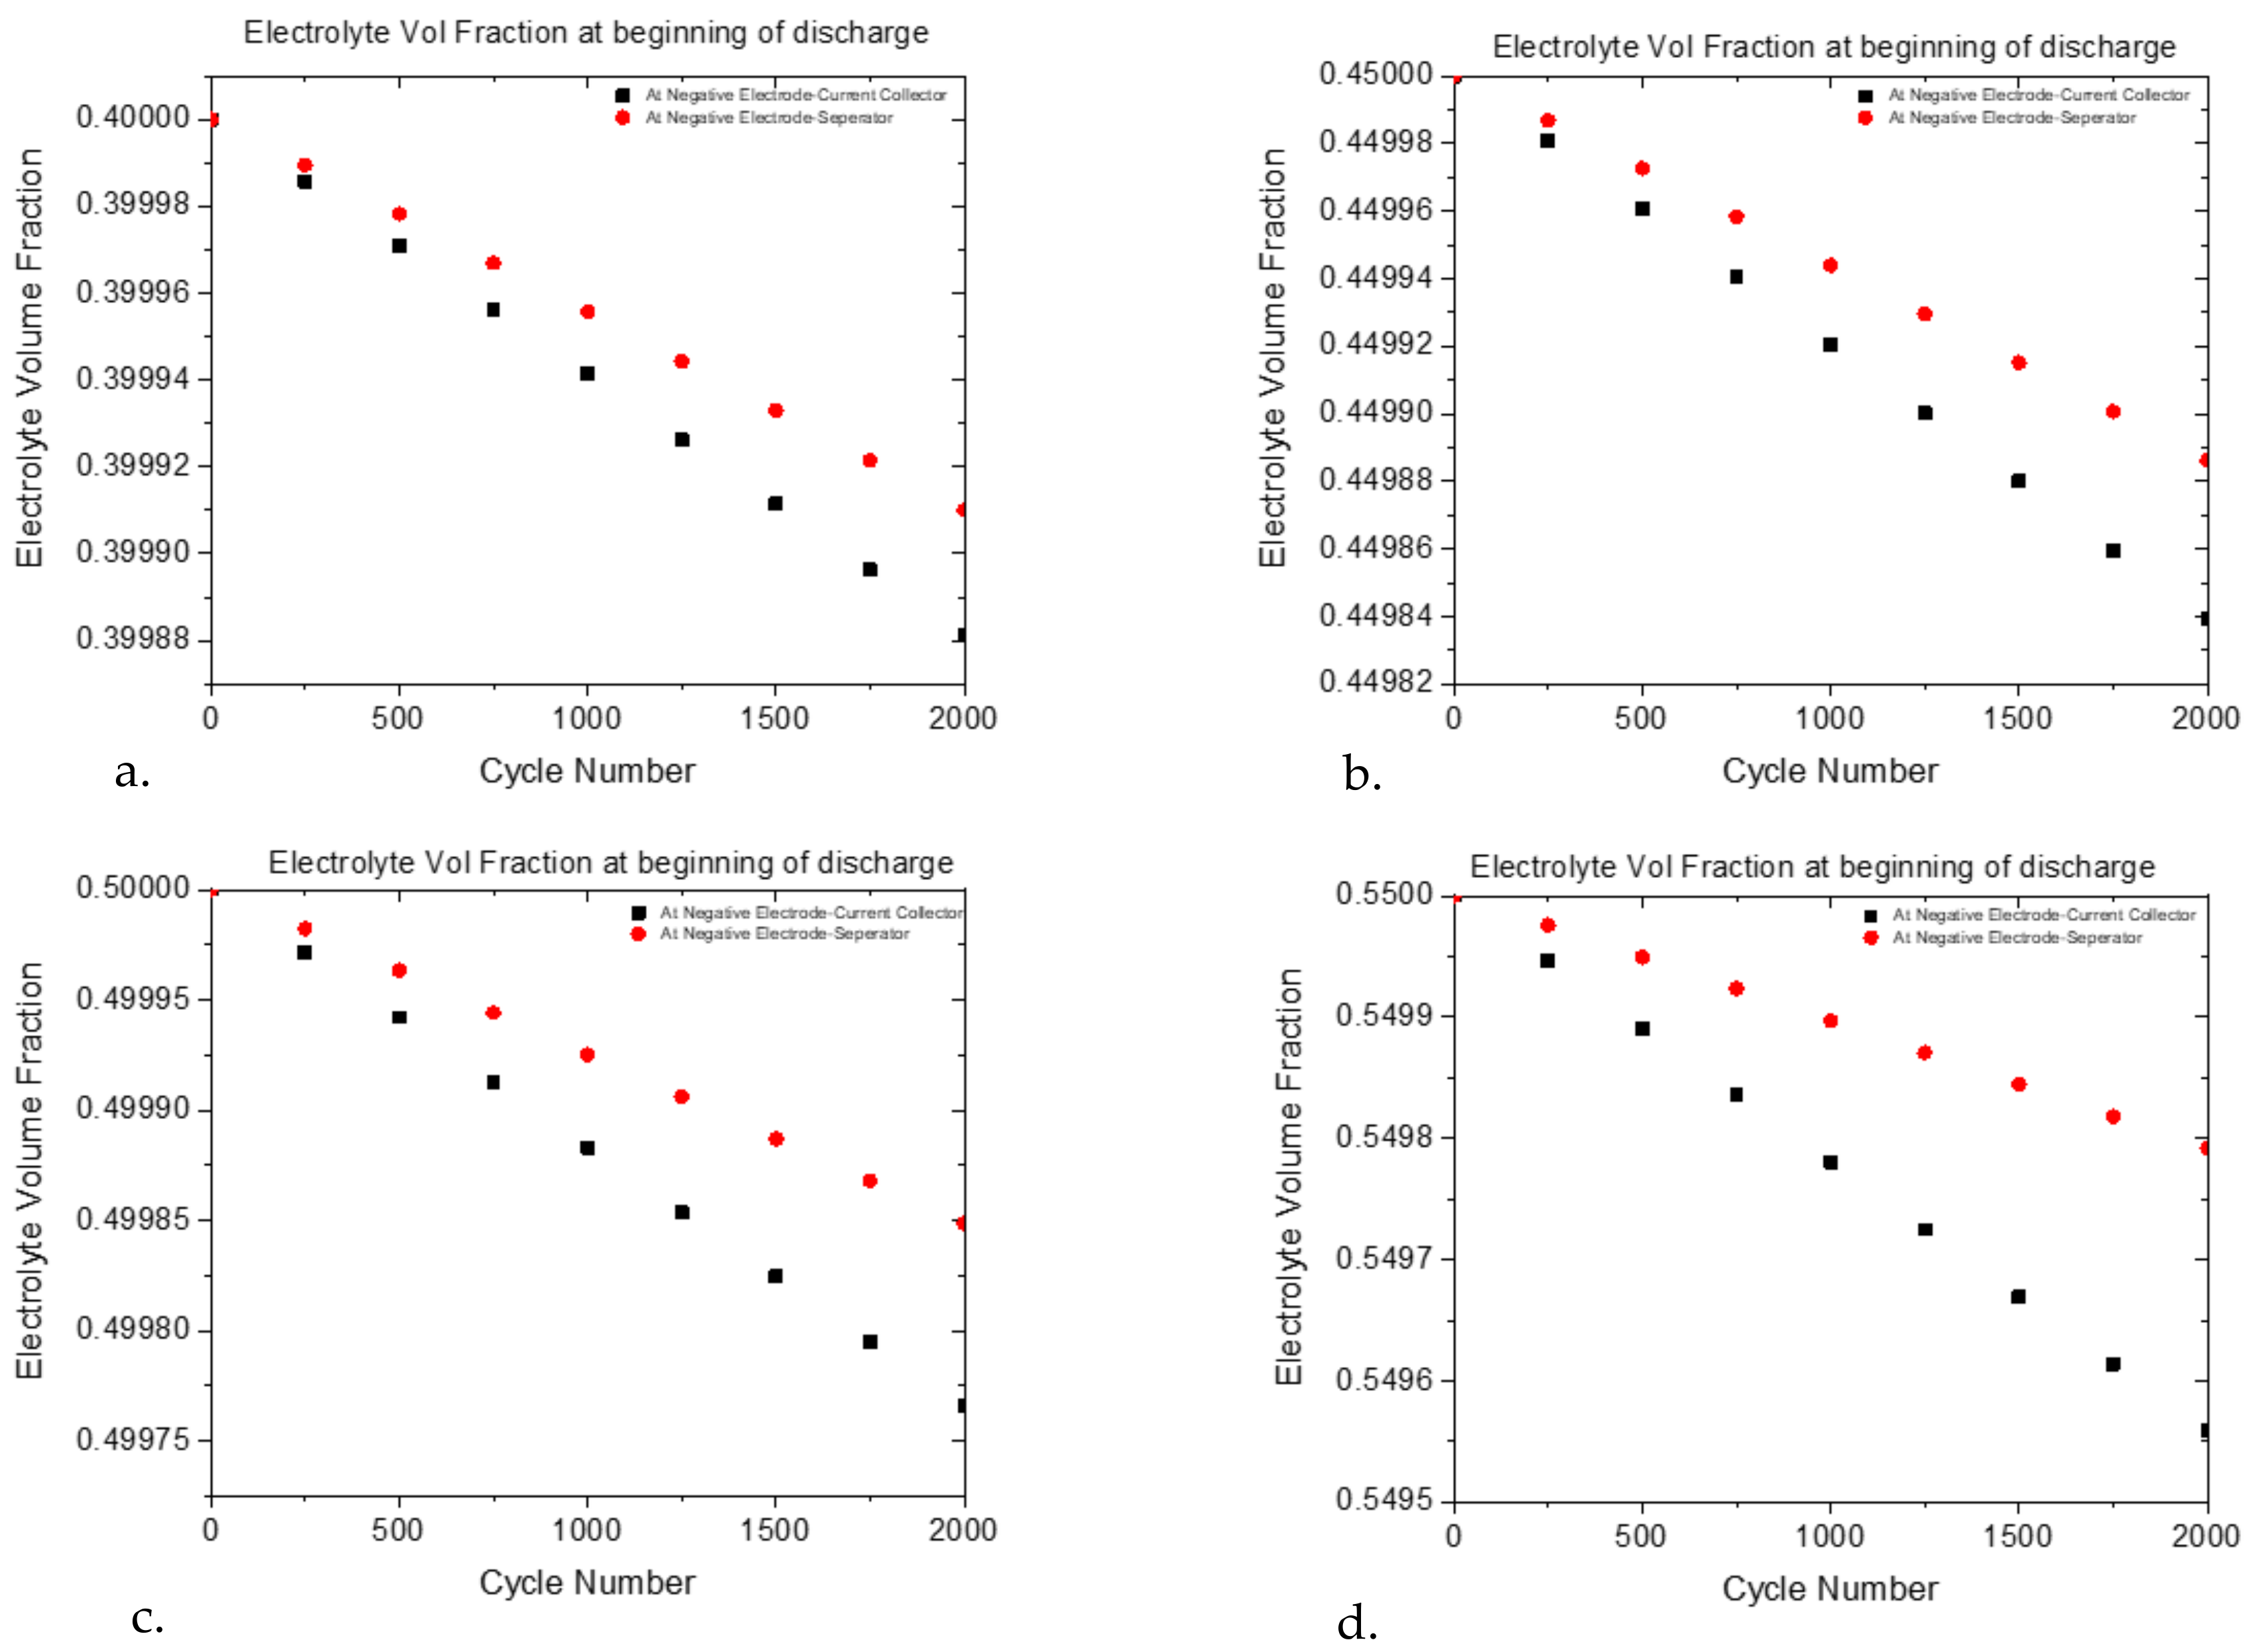
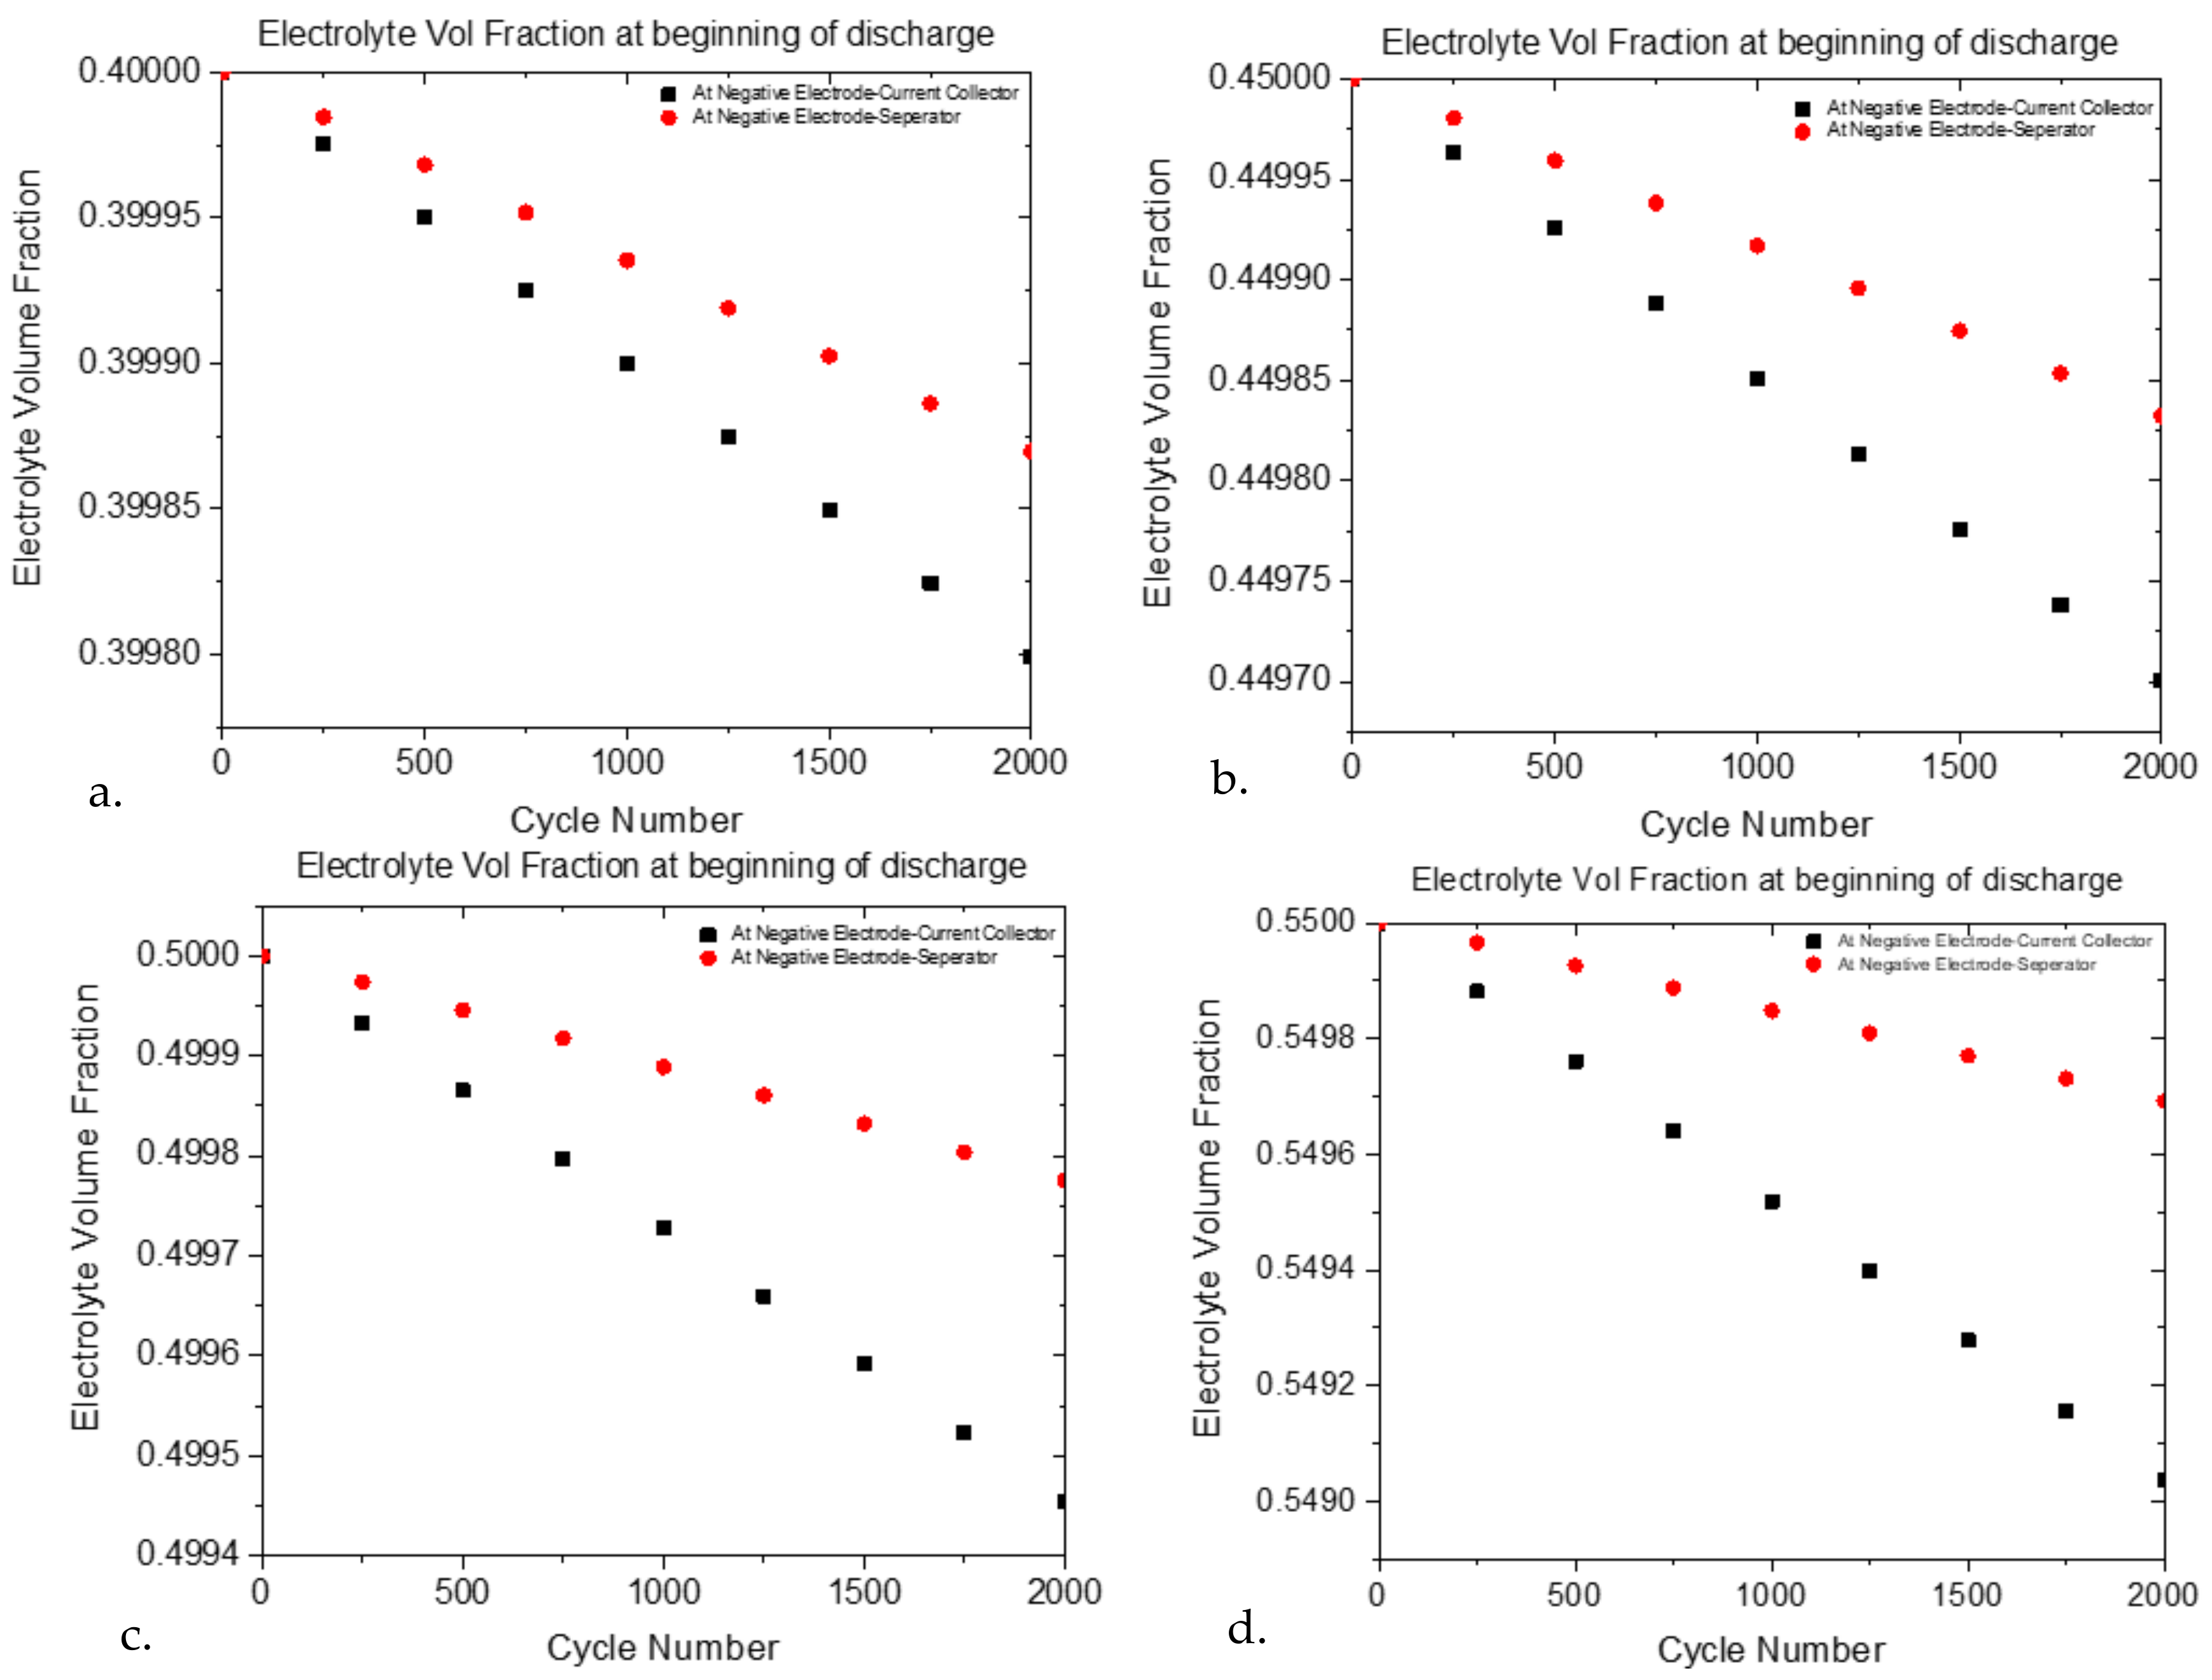
4.2. The Effect of Variations of the Electrolyte Volume Fraction in the Si Electrode

Figure 4a–d describes the changes in the electrolyte volume fraction as a function of cycle number at both surfaces of the negative electrode. There is a high rate of formation of the SEI layer closer to the separator, therefore the electrolyte volume fraction change is more significant in this region. As such, it is important to focus on optimizing the volume fraction in these areas to minimize the potential drop across the SEI layer.
Figure 5 shows the discharge curves at four different cell loadings. It explains the observed performance of the cell by showing that, irrespective of the loading conditions, there was no capacity fade and hence the optimized values of particle size and volume fraction did not lead to any measurable changes in polarization effects.
A similar process was followed to model the NMC cathode and it was found that the same Si anode properties worked to reduce the losses in capacity as for NCA. Figure 6 shows the discharge curve comparison for the first and the 2000th cycle for particle sizes (4   μ m–100 nm) of the Si anode with the NMC cathode. Figure 8a–d show that an electrolyte volume fraction from 0.55 to 0.40 in the negative electrode had almost the same fraction at both boundaries for all volume fractions tested. The results show that for the four values of the electrolyte volume fraction, there was negligible change in the values at the two anode boundaries after 2000 cycles, indicating that the loss of lithium due to side reactions is small.
Generally, increasing the volume fraction of the electrolyte in the electrode leads to increases in polarization, capacity fade, and internal resistance. This happens because, when the volume fraction increases, the lithium ions can easily intercalate/de-intercalate into/out of the active material. It was demonstrated in Figure 4 that cells with optimized volume fractions show very little potential drop.
Aging losses and kinetic limitations in the battery electrodes can be minimized with improved values of the volume fraction of the electrolyte in the electrode. Experimentally, it was found that graphite electrodes with a thickness of 250–350 micrometers and volume fractions of 0.48–0.55 are ideal for increasing lithium transport [32]. Hence, similar values were considered in this work for silicon anodes having a thickness of 55 micrometers. Our simulations have shown that the optimized values for the volume fraction of the electrolyte in the silicon electrode was between 0.40 and 0.55. When compared to Si, it was found that graphite electrodes show a higher potential drop across the SEI layer [19]. This corresponds to a larger change in the volume fraction of electrolyte in the graphite electrode compared to silicon [19].
Many operating variables influence the lifetime performance of a battery. Some of them are temperature and discharge rate [33]. According to reports, it was shown that the rate of capacity fade for NMC cells decreased with increasing temperature. However, NCA cells did not demonstrate a temperature dependence for certain ranges of temperature [33].
Generally, capacity fade in a battery accelerates with higher discharge rates which further lead to rapid volume changes in the electrode due to increased stresses [34,35,36]. In the case of NCA cells, it is observed that increased discharge rates lead to lower capacity fade [33] consistent with Figure 5 in comparison with NMC in Figure 9.
As mentioned, concurrent works [14,15,16] also suggest that irreversible capacity losses occur due to the loss of active lithium and increased impedance at both the electrodes. The current model is focused on role of negative electrode in capacity fade specifically in the case of silicon and present a solution by optimizing design variables. Silicon anode has problem of volume expansion leading to internal stresses, strains and further electrode fracture. Hence, this model proposes a possible answer on how to address such issues and also lays a foundation for experimental work.

5. Conclusions

This research has focused on a one-dimensional model which was developed using COMSOL version 5.5 to study capacity fade in silicon anode lithium-ion batteries. The impact of changes in the negative electrode active material particle sizes and electrolyte volume fractions on the performance of the battery were investigated. Neither cathode exhibits capacity fade for the optimized Si particle (150 nm or smaller). This is due to the influence of particle size on the solid diffusion polarization, whereby smaller values decrease capacity fade. Optimized values of the volume fraction of the electrolyte in the negative electrode led to minimal accumulation of lithium ions. Hence, these volume fraction values can prevent or minimize drastic volume expansion of the silicon anode typically observed in Li-ion batteries. The overall trends in available volume fraction in the negative electrode leading to minimal volume expansion values were the same for both NCA and NMC 111.
It was observed that silicon as an anode behaves differently in terms of cell lifetime with two different cathodes (NCA and NMC), and that when they are compared, NMC shows a better relative capacity than NCA when paired with a silicon anode.
It can be concluded from this research work that higher relative capacity of NMC cathode makes it a better working electrode for Silicon anode.
As discussed, temperature is also an important factor in determining the performance of a battery. A forthcoming work would be on how silicon anode would behave depending on different structural characteristics and different temperature conditions.

Author Contributions

Conceptualization, H.D. and E.E.; methodology, H.D.; software, E.E.; validation, E.E.; formal analysis, H.D.; investigation, E.E.; resources, E.E.; data curation, H.D.; writing—original draft preparation, H.D.; writing—review and editing, E.E.; visualization, E.E.; supervision, E.E.; project administration, E.E.; funding acquisition, E.E. All authors have read and agreed to the published version of the manuscript.

Funding

This research was partially funded by the State University of New York (SUNY) 2020 Strategic Investment Program.

Institutional Review Board Statement

Not applicable.

Informed Consent Statement

Not applicable.

Data Availability Statement

Not applicable.

Conflicts of Interest

The authors declare no conflict of interest.

Nomenclature

a s , i Specific surface area, m2/m3
i l Electronic current density in the solid phase (A m−2)
Q l Electrolyte current source
i total The sum of all electrochemical current sources
t + Li+ Transference number
c l Electrolyte salt concentration (mol m−3)
f Average molar activity coefficient
Q s Current source term
N l Flux of ions
R l Total Li+ source term in the electrolyte
rRadius distance variable of the solid particles (m)
i loc Local current density (A m−2)
i o Exchange current density (A m−2)
TBattery Temperature (K)
RGas constant, 8.314 (J mol−1 K−1)
σ l Electronic conductivity of solid phase (S m−1)
σ s Ionic conductivity of the electrolyte (S m−1)
ε 1 , s Solid phase volume fraction of the negative electrode
ε 2 , s Solid phase volume fraction of the positive electrode
ε 1 , e Electrolyte phase volume fraction negative electrode
ε 2 , e Electrolyte phase volume fraction positive electrode
ε l Electrolyte volume fraction
ε s Electrode volume fraction
t + Li+ Transference number
HOverpotential, V
αaαc Anodic and cathodic transfer coefficients
l Electrolyte Potential
s Electric Potential
TBattery Temperature (K)
RGas constant, 8.314 (J mol−1 K−1)
Subscripts:
lSolution Phase
sSolid Phase
effEffective value of transport property in porous medium

Appendix A

The following governing equations and boundary conditions are taken from comsol batteries and fuel cells module user guide [37].
The charge and mass conservation in the solution phase happen according to the following:
. i l = i t o t a l + Q l
i l = σ l , e f f l + 2 σ l , e f f R T F 1 + ln f ln c l 1 t + ln c l
ε l c l t + N l = R l
N l = D l , e f f c l + i l t + F
where,
σ l , e f f = σ l ε l γ
The specific interfacial area of the porous electrode, a s , i = 3 ε s , i r
Charge conservation in solid phase:
. i s = i t o t a l + Q s
where,
i s = σ s , e f f s σ s , e f f = σ s ε s γ
Electrochemical Kinetics:
i l o c = i o e x p α a F η R T e x p α c F η R T η = E c t E e q
where,
E c t = s + s , f i l m l s , f i l m = R f i l m i t o t a l

Appendix B

Diffusion   coefficient   of   electrolyte   f t × c × e 4000 R 1 T r e f 1 T 2
Electronic   conductivity   of   electrolyte   g t × c × e 165000 R 1 T r e f 1 T 2
* T r e f = 393.15   K
* T 2 = 298   K

References

  1. Yoshino, A. The Birth of the Lithium-Ion Battery. Angew. Chem. Int. Ed. 2012, 51, 5798–5800. [Google Scholar] [CrossRef] [PubMed]
  2. Lu, L.; Han, X.; Li, J.; Hua, J.; Ouyang, M. A review on the key issues for lithium-ion battery management in electric vehicles. J. Power Sources 2013, 226, 272–288. [Google Scholar] [CrossRef]
  3. Bruce, G.C.; Marcoux, L. Large lithium ion batteries for aerospace and aircraft applications. IEEE AESS Syst. Mag. 2001, 16, 24–28. [Google Scholar] [CrossRef]
  4. Smith, K.; Wang, C.-Y. Power and thermal characterization of a lithium-ion battery pack for hybrid-electric vehi-cles. J. Power Sources 2006, 160, 662–673. [Google Scholar] [CrossRef]
  5. Casimir, A.; Zhang, H.; Ogoke, O.; Amine, J.C.; Lu, J.; Wu, G. Silicon-based anodes for lithium-ion batteries: Effectiveness of materials synthesis and electrode preparation. Nano Energy 2016, 27, 359–376. [Google Scholar] [CrossRef] [Green Version]
  6. Horiba, T. Li-ion battery systems. Proc. IEEE 2014, 102, 939–950. [Google Scholar] [CrossRef]
  7. Miao, Y.; Hynan, P.; von Jouanne, A.; Yokochi, A. Current Li-Ion Battery Technologies in Electric Vehicles and Op-portunities for Advancements. Energies 2019, 12, 1074. [Google Scholar] [CrossRef] [Green Version]
  8. Zhou, W. Effects of external mechanical loading on stress generation during lithiation in Li-ion battery electrodes. Electrochim. Acta 2015, 185, 28–33. [Google Scholar] [CrossRef] [Green Version]
  9. Zhou, W.; Hao, F.; Fang, D. The effects of elastic stiffening on the evolution of the stress field within a spherical electrode particle of lithium-ion batteries. Int. J. Appl. Mech. 2013, 5, 1350040. [Google Scholar] [CrossRef]
  10. Teki, R.; Datta, M.K.; Krishnan, R.; Parker, T.C.; Lu, T.-M.; Kumta, P.N.; Koratkar, N. Nanostructured Silicon Anodes for Lithium Ion Rechargeable Batteries. Small 2009, 5, 2236–2242. [Google Scholar] [CrossRef]
  11. Agubra, V.A.; Fergus, J.W. The formation and stability of the solid electrolyte interface on the graphite anode. J. Power Sources 2014, 268, 153–162. [Google Scholar] [CrossRef]
  12. Verma, P.; Maire, P.; Novak, P. A review of the features and analyses of the solid electrolyte interphase in Li-ion bat-teries. Electrochim. Acta 2010, 55, 6332–6341. [Google Scholar] [CrossRef]
  13. Hannan, M.A.; Hoque, M.; Hussain, A.; Yusof, Y.; Ker, P.J. State-of-the-Art and Energy Management System of Lithium-Ion Batteries in Electric Vehicle Applications: Issues and Recommendations. IEEE Access 2018, 6, 19362–19378. [Google Scholar] [CrossRef]
  14. Arora, P.; White, R.E.; Doyle, M. Capacity Fade Mechanisms and Side Reactions in Lithium-Ion Batteries. J. Electrochem. Soc. 1998, 145, 3647–3667. [Google Scholar] [CrossRef] [Green Version]
  15. Spotnitz, R. Simulation of capacity fade in lithium-ion batteries. J. Power Sources 2003, 113, 72–80. [Google Scholar] [CrossRef]
  16. Christensen, J.; Newman, J. Effect of Anode Film Resistance on the Charge/Discharge Capacity of a Lithium-Ion Battery. J. Electrochem. Soc. 2003, 150, A1416. [Google Scholar] [CrossRef]
  17. Ramadesigan, V.; Northrop, P.W.C.; De, S.; Santhanagopalan, S.; Braatz, R.D.; Subramanian, V.R. Multiscale Modeling and Simulation of Lithium-Ion Batteries from Systems Engineering Perspective. J. Electrochem. Soc. 2012, 159, R31–R45. [Google Scholar] [CrossRef]
  18. Jin, Y.; Zhu, B.; Lu, Z.; Liu, N.; Zhu, J. Challenges and Recent Progress in the Development of Si Anodes for Lithium-Ion Battery. Adv. Energy Mater. 2017, 7, 1700715. [Google Scholar] [CrossRef] [Green Version]
  19. Capacity Fade of a Lithium-Ion Battery; COMSOL Multiphysics® v. 5.5; COMSOL AB: Stockholm, Sweden, 2018.
  20. Ekström, H.; Lindbergh, G. A Model for Predicting Capacity Fade due to SEI Formation in a Commercial Graph-ite/LiFePO4 Cell. J. Electrochem. Soc. 2015, 162, A1003–A1007. [Google Scholar] [CrossRef]
  21. Safari, M.; Delacourt, C. Aging of a Commercial Graphite/LiFePO4 Cell. J. Electrochem. Soc. 2011, 158, A1123–A1135. [Google Scholar] [CrossRef]
  22. Salaha, M.; Murphy, P.; Hall, C.; Francis, F.; Kerr, R.; Fabretto, M. Pure silicon thin-film anodes for lithium-ion bat-teries: A review. J. Power Sources 2019, 414, 48–67. [Google Scholar] [CrossRef]
  23. Liu, X.H.; Zhong, L.; Huang, S.; Mao, S.X.; Zhu, T.; Huang, J.Y. Size-Dependent Fracture of Silicon Nanoparticles During Lithiation. ACS Nano 2012, 6, 1522–1531. [Google Scholar] [CrossRef]
  24. McDowell, M.T.; Ryu, I.; Lee, S.W.; Wang, C.; Nix, W.D.; Cui, Y. Studying the Kinetics of Crystalline Silicon Nano-particle Lithiation with In Situ Transmission Electron Microscopy. Adv. Mater. 2012, 24, 6034–6041. [Google Scholar] [CrossRef]
  25. Ma, Z.; Li, T.; Huang, Y.L.; Liu, J.; Zhou, Y.; Xue, D. Critical silicon-anode size for averting lithiation-induced me-chanical failure of lithium-ion batteries. RSC Adv. 2013, 3, 7398. [Google Scholar] [CrossRef]
  26. Mc Dowell, M.T.; Lee, S.W.; Nix, W.D.; Cui, Y. 25th anniversary article: Understanding the lithiation of silicon and other alloying anodes for lithium-ion batterries. Adv. Mater. 2013, 25, 4966–4985. [Google Scholar] [CrossRef]
  27. Kim, H.; Seo, M.; Park, M.-H.; Cho, J. A critical size of silicon nano-anodes for lithium rechargeable batteries. Angew. Chem. 2010, 122, 2192–2195. [Google Scholar] [CrossRef]
  28. Chen, Y.; Huo, W.; Lin, M.; Zhao, L. Simulation of electrochemical behavior in Lithium-ion battery during dis-charge process. PLoS ONE 2018, 13, e0189757. [Google Scholar]
  29. Wang, Y.; Li, H.; He, P.; Hosono, E.; Zhou, H. Nano active materials for lithium-ion batteries. Nanoscale 2010, 2, 1294–1305. [Google Scholar] [CrossRef] [PubMed]
  30. Mukharjee, R.; Krishnan, R.; Luc, T.-M.; Koratkar, N. Nanostructured electrodes for high-power lithium-ion batteries. Nano Energy 2012, 1, 518–533. [Google Scholar] [CrossRef]
  31. Roy, P.; Srivastava, S.K. Nanostructured anode materials for lithium ion batteries. J. Mater. Chem. A 2015, 3, 2454–2484. [Google Scholar] [CrossRef]
  32. Singh, M.; Kaiser, J.; Hahn, H. Effect of Porosity on the Thick Electrodes for High Energy Density Lithium-Ion Bat-teries for Stationary Applications. Batteries 2016, 2, 35. [Google Scholar] [CrossRef] [Green Version]
  33. Yuliya, P.; Heather, M.B.; Armando, F.; Daniel, L.C.; Jessica, R.-K.; Summer, R.F.; Babu, C. Degradation of Com-mercial Lithium-Ion Cells as a Function of Chemistry and Cycling Conditions. J. Electrochem. Soc. 2020, 167, 120532. [Google Scholar]
  34. Bryden, T.S.; Holland, A.; Hilton, G.; Dimitrov, B.; Albarrán, C.P.D.L.; Cruden, A. Lithium-ion degradation at varying discharge rates. Energy Procedia 2018, 151, 194–198. [Google Scholar] [CrossRef]
  35. Dubarry, M.; Truchot, C.; Liaw, B.Y. Cell degradation in commercial LiFePO4 cells with high-power and high-energy designs. J. Power Sources 2014, 258, 408–419. [Google Scholar] [CrossRef]
  36. Sun, S.; Guan, T.; Cheng, X.; Zuo, P.; Gao, Y.; Du, C.; Yin, G. Accelerated aging and degradation mechanism of LiFePO4/graphite batteries cycled at high discharge rates. RSC Adv. 2018, 8, 25695–25703. [Google Scholar] [CrossRef] [Green Version]
  37. Batteries and Fuel Cells Module User’s Guide; COMSOL Multiphysics® v. 5.5; COMSOL AB: Stockholm, Sweden, 2018; pp. 265–271.
Figure 1. Two-dimensional representation of the five regions of the cell.
Energies 14 01448 g001
Figure 2. Simulated discharge curves comparing NCA cathodes for the first and 2000th cycle when the Si anode particle sizes are (a) 4   μ m, (b) 2   μ m, (c) 1   μ m, (d) 150 nm, (e) 100 nm.
Energies 14 01448 g002
Figure 3. Simulated discharge curves for different Si anode particle sizes after the 2000th cycle.
Energies 14 01448 g003
Figure 4. Simulated Electrolyte volume fraction at the two boundaries of the negative electrode at the interfaces with the current collector and the separator for porosity values of (a) 0.40; (b) 0.45; (c) 0.50; (d) 0.55.
Energies 14 01448 g004
Figure 5. Simulated Comparisons of the discharge curves of 2000 cycles at four rates of discharge (0.5C, 1C, 1.5C, 2C) for NCA cathodes.
Energies 14 01448 g005
Figure 6. Simulated Discharge curves comparing NMC cathodes for the first and 2000th cycle when the negative electrode particle sizes are (a) 4   μ m, (b) 3   μ m, (c) 1   μ m, (d) 150 nm, (e) 100 nm.
Energies 14 01448 g006
Figure 7. Simulated discharge curves at different particle sizes of Si of 2000th cycle.
Energies 14 01448 g007
Figure 8. Simulated Electrolyte volume fraction at the two boundaries of the negative electrode at the interfaces with the current collector and the separator for porosity values of (a) 0.40 (b) 0.45 (c) 0.50 (d) 0.55.
Energies 14 01448 g008
Figure 9. Simulated Comparisons of the discharge curves after 2000 cycles at four rates of discharge (0.5C, 1C, 1.5C,2C) for NMC cathodes.
Energies 14 01448 g009
Table 1. Aging Parameters.
NameValueUnits
α0.671
J8.4 × 10−41
f2 × 1021/s
H6.71
Table 2. Assumed parameters of solvent reduction side reaction.
ParameterSymbolValueUnits
SEI layer conductivity κ 5 × 10⁻⁶S/m
Molar mass of product of side reactionMP0.16Kg/mol
Density of product of side reaction ρ P 1.6 × 10³Kg/m3
Table 3. Electrochemical model parameters.
ParameterSymbolNMCNCASeparatorSilicon
Thickness ( μ m )L40403055
Particle size (nm)rP100assumed100assumed Varied
Volume fraction of the active material ε s , 1 , ε s , 2 VariedVaried
Volume fraction of the electrolyte ε 1 , l , ε 2 , l VariedVaried
Electrolyte phase volume fraction separator ε c 0.370
Maximum Lithium concentration in the solid phase (mol/m3)cs, max49,00048,000 278,000
Maximum electrode state of charge SOC max 0.9751-0.98
Minimum electrode state of charge SOC min 00.25-0
Diffusion coefficient of electrodes (m2/S) D s 5× 10−131.5× 10⁻¹⁵ 1× 10⁻¹³
Diffusion coefficient of electrolyte (m2/S) D l Equation (A1)
Transfer coefficient α 0.50.5 0.5
Transport number t + 0.363
Electrolyte Lithium concentration (mol/m3)ce, max 1200
Bruggeman coefficient for tortuosity γ 1.51.5 1.5
Electronic conductivity (S/m) σ 10091Equation (A2)0.1 [22]
Faraday’s Constant (C mole −1)F 96,487
Universal gas constant (J/mol/K)R 8.314
TemperatureT318.15 K
Table 4. Summary of the effect of particle sizes of the Si electrode (with NCA cathode) on the shape of the discharge curve after 2000 cycles.
Particle SizeEffect on the Discharge Curve
4   μ mPolarization persists
2   μ mPolarization persists
1   μ mPolarization persists
150 nmNo Polarization
100 nmNo Polarization
Table 5. Summary of the effect of particle sizes of the Si electrode (with NMC cathode) on the shape of the discharge curve after 2000 cycles.
Particle SizeEffect on the Discharge Curve
4   μ mPolarization persists
3   μ mPolarization persists
1   μ mPolarization persists
150 nmNo Polarization
100 nmNo Polarization
Publisher’s Note: MDPI stays neutral with regard to jurisdictional claims in published maps and institutional affiliations.

