Article

Biomass and Lipid Productivity by Two Algal Strains of Chlorella sorokiniana Grown in Hydrolysate of Water Hyacinth

1
Department of Civil Engineering, Indian Institute of Technology Roorkee, Uttakhand 247667, India
2
Department of Environmental Resources Engineering, SUNY College of Environmental Science and Forestry, Syracuse, NY 13210, USA
3
Department of Civil Engineering, SET, Sharda University, Greater Noida 201310, India
*
Author to whom correspondence should be addressed.
Energies 2021, 14(5), 1411; https://doi.org/10.3390/en14051411
Submission received: 20 January 2021 / Revised: 15 February 2021 / Accepted: 20 February 2021 / Published: 4 March 2021
(This article belongs to the Section A4: Bio-Energy)

Abstract

:
Hydrolysate prepared from the chemical hydrolysis of water hyacinth biomass contains a high amount of solubilised carbohydrate and nutrients. This hydrolysate was utilised as a medium for the cultivation of two strains of Chlorella sorokiniana, isolated from a municipal wastewater treatment plant using two different media, i.e., BG-11 and Knop’s medium. Different light intensities, light–dark cycles, and various concentrations of external carbon sources (monosaccharides and inorganic carbon) were used to optimise the microalgal growth. For the accumulation of lipids and carbohydrates, the microalgal strains were transferred to nutrient amended medium (N-amended and P-amended). It was observed that the combined effect of glucose, inorganic carbon, and a 12:12 h light–dark cycle proved to be the optimum parameters for high biomass productivity (~200 mg/L/day). For Chlorella sorokiniana 1 (isolated from BG-11 medium), the maximum carbohydrate content (22%) was found in P-amended medium (N = 0 mg/L, P: 3 mg/L), whereas, high lipid content (17.3%) was recorded in N-amended medium (N = 5 mg/L, P = 0 mg/L). However, for Chlorella sorokiniana 2 (isolated from the Knop’s medium), both lipid (17%) and carbohydrate accumulation (12.3%) were found to be maximum in the N-amended medium. Chlorella sorokiniana 2 showed a high saturated lipid accumulation compared to other strains. Kinetic modelling of the lipid profile revealed that the production rate of fatty acids and their various constituents were species dependent under identical conditions.

Graphical Abstract

1. Introduction

Water hyacinth (Eichhornia crassipes), a floating aquatic plant that grows on wastewater, could help remove nutrients from it and prove to be a cheap and widely available biomass for developing various chemicals and fuels [1]. An efficient hydrolysis procedure could be developed to treat the water hyacinth biomass recovered from municipal wastewater. The resultant hydrolysate could later be used as a growth medium for microbial strains to produce value-added products [2]. Water hyacinth biomass is amenable to chemical treatment, and may not require costly enzymatic hydrolysis for enhanced sugar recovery. Various acids and electrochemical treatments were used for treating the water hyacinth biomass [3,4]. Treatment conditions, such as pressure, temperature, and concentration of hydrolysing agents affected sugar recovery, varying from 130–155 mg of sugar/g of treated biomass.
Hydrolysate prepared from biomass has been demonstrated to produce various value-added chemicals, including fuels, using different microbial strains [5,6]. However, nutrient content also plays a vital role in the production of value-added products. Chowdhury and his co-workers [7,8,9] showed that nutrient recovery from biomass and its utilisation along with waste nutrients increased biofuel production considerably. The produced biofuel had reduced energy demands and GHG emissions. Hence, nutrient recovery from biomass should also be taken into account to evaluate the efficacy of a hydrolysis procedure.
Microalgae is one of the attractive routes for producing value-added products, by growing it on hydrolysate. Microalgae can accumulate various value-added products in the form of starch, protein, lipids, and various pigments that have high market value [10]. Types of value-added product depend on the algal species used, stress conditions applied, and various micronutrients present in the hydrolysate. In this study, an attempt was undertaken to study the formation of value-added products by algal strains isolated from a local oxidation pond used to treat municipal wastewater. Starch and lipids are stress-induced products, and during the production of such products growth of microalgae is reduced considerably. On the other hand, depending on the nitrogen (N) or phosphorus (P) limitation, the lipid profile also showed differences [11]. Saturated lipids provide better fuel quality compared to unsaturated lipids. Hence, it is desirable to have a high saturated lipid content in the cultured algae. Chu et al. [11] observed that nitrogen starvation enhanced unsaturated lipid concentration.
Hence, it was hypothesised that a two-step process in which a nutrient sufficient condition followed by either a nitrogen or phosphorus deficient condition would improve the lipid productivity and would change the lipid profile.
Therefore, in this study, an attempt was undertaken to study the formation of value-added products by two algal strains isolated (using different growth media) from a local oxidation pond (used to treat municipal wastewater). A hydrolysate containing a high amount of solubilised carbohydrate and nutrients (prepared from the water hyacinth biomass using chemical reagent) was used as a growth medium for these two algae. Different light intensities, light–dark cycles, and concentrations of external sugar addition were used as the parameters to optimise the growth of algae. Effects of nutrient starvation, i.e., either N or P starvation, were estimated on lipid accumulation and fatty acid composition. Furthermore, a kinetic model was developed to understand the kinetics and rate-limiting steps in fatty acid elongation and unsaturation.

2. Materials and Methods

2.1. Screening and Identification of Algal Strains

For the isolation of algal species, a water sample was collected from a municipal wastewater stabilisation pond situated near Lakkarghat, Rishikesh, Uttarakhand, India. The sample was serially diluted for screening and isolating pure colonies of algal cells. Algal colonies were grown in two different media, i.e., modified BG-11 medium and Knop’s medium, maintained at pH-9 and a constant temperature (25 °C), and supplemented with an antibiotic and antifungal. (The compositions of both media are given in the Supplementary information, Tables S1 and S2). Genomic DNA of the isolated algal strains was extracted by using a MB561 HiPurA™ Marine Algal DNA Purification kit. The selected algal strain was identified using the 18S ribosomal DNA (rDNA) sequence. The 18S rDNA isolated algae (BG-11) was characterised, and procedural details are presented in Rani et al. [12]. A fragment of the 18S rDNA region of the algal strain isolated from the Knop’s medium was amplified by PCR (polymerase chain reaction: a method used to rapidly make several copies of a specific DNA sample). Forward and reverse DNA sequencing reaction of PCR amplicon was carried out using NS1- GTAGTCATATGCTTGTCTC and NS4- CTTCCGTCAATTCCTTTAAG primers [13]. Sequencing was done using a Sanger sequence chromatogram to generate reverse sequence data, forward sequence data, reverse complement, and G consensus data. The resulting data sequence was aligned using the NCBI (National Center for Biotechnology Information) GenBank and calculated with BLAST (basic local alignment search tool: this program compares nucleotide sequences to sequence databases and calculates the statistical significance) hits, with respect to the query sequence. The evolutionary history was inferred by using UGENE software [14].

2.2. Biomass Growth

A synthetic growth medium was prepared with similar constituents to the hydrolysate obtained by hydrolysing the water hyacinth biomass with HNO3 (Supplementary information, Table S3). Treatment conditions for hydrolysate preparation are given in Appendix A. The isolated microalgae species were grown in the synthetic hydrolysate medium under different conditions (such as different light intensity, different carbon sources and forms of monosaccharide, metal ions, etc.). The study was conducted in three different phases. A detailed pictorial representation of the experimental design is given in the Supporting Information (Figure S1).
In the first phase, the enhancement of microalgae growth was investigated by varying light intensity and medium supplementation. Each of these runs was carried out for 10 days under continuous illumination. Nitrate (N) (75 mg/L) and phosphate (P) (15 mg/L) were kept constant for all the studies, given in Table 1. The growth pattern was checked every 24 h (Table 1).
In the second phase, different forms of monosaccharide were used to increase the algal biomass in a 12 h:12 h light–dark cycle for 10 days. The growth pattern was monitored every 12 h. Nitrate (N) (75 mg/L) and phosphate (P) (15 mg/L) concentrations were kept constant throughout the study. The light intensity was also kept constant at 221 µmol/s/m2, which was found to be optimum in the first phase of the study. Details of the parameters used in this study are presented in Table 2. The experiments were carried out in photobioreactor in duplicate (Figure S2).
The third phase was divided into two parts; first part: nutrient sufficient media (composition was derived from the optimum parameters obtained from the above two studies) was used to enhance the algal growth. Algae were grown in a 12 h:12 h light–dark phase for 6 days. The nutrient sufficient media contained glucose (50 mg/L), inorganic C (75 mg/L/day), nitrate-N (60 mg/L), NH4-N (15 mg/L) and phosphate-P (15 mg/L). The second part emphasised the enhancement of the lipid accumulation by transferring the algal biomass under the nutrient amended conditions. Two different media were prepared: (i) N-amended medium containing 5 mg/L of NH4-N, glucose (50 mg/L), and inorganic C-source (125 mg/L); (ii) P-amended medium containing 3 mg/L of PO4-P, glucose (50 mg/L), and inorganic C-source (125 mg/L).

2.3. Analytical Methods

2.3.1. Determination of Biomass Growth

To determine cell density, the optical density of algal cells was measured at 750 nm using a UV-VIS spectrophotometer (DR 6000, HACH). Algal biomass concentration was also measured as TSS (total suspended solids) using a standard gravimetric method [15].

2.3.2. FAME Analysis

Transesterification of lipids extracted from a culture grown in the hydrolysates was executed using a modified transesterification process. Lipids were transesterified in a mixture of solvents containing 0.5 mL methanol and 2.5 mL HCl. The solvent mixture and biomass were heated at 100 °C for 60 min. After cooling it to room temperature, its fatty acid methyl esters (FAMEs) were retrieved using hexane. The hexane phase was then transferred to a glass vial for gas chromatography (Shimadzu GC-2014), equipped with a Restek Rtx-5 MS capillary column (30 m, 0.25 mm, 0.25 μm) and a flame ionisation detector (FID). Other details of the analysis are given in Chowdhury et al. [9].

2.4. Kinetic Modeling

Two kinetic models were developed for the two strains used in this study. We needed to develop two kinetic models as one model may not fit well with another strain’s data. The fatty acid precursor and compositions were also different for each of the strains.
Chlorella sorokiniana (Knop’s media):
d P 1 d t = K 1
d P 2 d t = K 1 K 2 P 2
d P 3 d t = K 2 P 2 K 3 P 3
d P 4 d t = K 3 P 3 K 4 P 4
d P 5 d t = K 4 P 4
Chlorella sorokiniana (BG-11 media):
d P 2 d t = K 2
d P 3 d t = K 3 P 3 K 5 P 3 + K 2
d P 4 d t = K 3 P 3 K 4 / P 4
d P 5 d t = K 4 P 4
d P 6 d t = K 5 P 3
where P1 stands for C14:0, P2 stands for C16:0, P3 stands for C18:0, P4 stands for C18:1, P5 stands for C18:2, and P6 stands for C20:0. Where K1 to K5 are the kinetic parameters.
In Knop’s medium, K1: (mg/mg)/day, K2: per day, K3: per day, K4: (mg/mg)2/day.
In BG-11 medium, K2: (mg/mg)/day, K3: per Day, K4: (mg/mg)2/day, K5: per day.

2.5. Quality Control/Quality Assurance

All the experiments were carried out in duplicate. For quality assurance, a blank was incorporated whenever required. For statistical significance testing, one-way ANOVA followed by Tukey’s test for multiple comparison was undertaken [16]. Significance level was tested either at p = 0.05 or p = 0.01 level.

3. Results and Discussion

3.1. Identification and Characterisation of Microalgae

As described in Section 2.1 for the BG-11 medium, the algal species were characterised as Chlorella Sorokinana (Figure S3), and the details about the strain and its identification procedures are given in Rani et al. [12]. For the algal strain grown in Knop’s medium, the gel electrophoresis results showed a discrete PCR amplicon band of 1250 bp. The 18S rDNA fragment was amplified using primers NS1 and NS4 (detail procedure are given in Section 2.1) and then sequenced. Phylogenetic trees of the strains were constructed using UGENE software [14]. Both the strains were found to be genetically similar to Chlorella Sorokinana (Figure S4). Therefore, in the present study, the microalgal strains were represented as Chlorella sorokiniana 1 for the algae isolated using BG-11 medium, and Chlorella sorokiniana 2 for the algae isolated using Knop’s medium.

3.2. Coupled Effect of Light Intensity and Carbon Source on Biomass Productivity of C. sorokiniana

In this phase, microalgal growth was optimised using different parameters, as described in Section 2.2. Feng et al. [17] reported a decrease in biomass productivity at a high nitrate concentration. Nitrate in high concentrations may be toxic to microalgae species. Whereas, Blair et al. [18] observed no toxic effect of nitrate on the biomass productivity of Chlorella vulgaris. In the present study, nitrate was used as the sole source of nitrogen, and no such detrimental effect of nitrate on biomass productivity was observed. Six different combinations of the parameters used in this study are described in Table 1.
The biomass productivity of both the algal strains of C. sorokiniana was found to be dependent on the light intensity and carbon sources (Table 3a,b).
For the algal strain isolated from the modified BG-11 medium (C. sorokiniana 1): High biomass productivity of 39.8 mg/L/day was found in the growth medium containing 100 mg/L of glucose (Table 3a). It was observed that low intensity light might affect the growth rate. Hence, for the subsequent studies, the light intensity was increased to 221 µmol/s/m2 from 140 µmol/s/m2. According to Sacristan de Alva et al. [19], adequate light intensity contributes to enhanced cell growth, as the light energy increases CO2 assimilation and enhances the cell dry weight.
Biomass productivity of C. sorokiniana 1 increased with the increase in light intensity, and the estimated biomass productivity was 56 mg/L/day in a 50 mg/L glucose dose. Optimum light stimulates the synthesis of critical components required for the cell division of Chlorella strains [20].
Supplementation of growth media with the inorganic carbon dose of 75 mg/L/day increased the biomass productivity further to 153 mg/L/day. The growth rate and lipid production could be controlled via regulating the availability of essential nutrients and trace elements [21,22]. Various ions, such as iron and magnesium, are essential for cellular mechanisms, including photosynthesis, cell division, respiration, intracellular transportation, and protein synthesis in microalgae [23,24]. However, in the present study, supplementation of metal ions (iron) with organic and inorganic carbon had a detrimental effect on biomass productivity, as it decreased to 24 mg/L/day from 153 mg/L/day (Table 3a). Wan et al. [25] reported that if the iron concentration in a medium is more than 55 mg/L, it can reduce the biomass growth of Chlorella sp. However, in our study, we observed a toxic effect of iron at a much lower dose than the one reported by Wan et al. [25]. Besides iron, daily doses of inorganic carbon without the addition of organic carbon also reduced the biomass productivity to 43 mg/L/day from 153 mg/L/day (Table 3a). According to TSS measurements, the combined effects of the organic carbon and inorganic carbon in the presence of a high light intensity showed higher biomass productivity. Sun et al. [26] observed a positive effect of NaHCO3 on the biomass productivity of algae. However, the addition of CO2, along with NaHCO3 further improved biomass productivity. Hence, it is most likely that a supply of CO2 or organic carbon was the key behind the improved biomass productivity.
For the algal strain isolated from Knop’s medium (C. sorokiniana 2): This strain showed higher biomass productivity compared to C. sorokiniana 1. The highest biomass productivity of 160 mg/L/day was recorded in the growth medium containing 50 mg/L of glucose under a light intensity of 140 µmol/s/m2. In the 100 mg/L of glucose dose, the biomass productivity decreased to 106 mg/L/day, from 160 mg/L/day (Table 3b).
Light intensity was increased from 140 µmol/s/m2 to 221 µmol/s/m2 to improve biomass productivity. With a 50 mg/L glucose dose, the estimated biomass productivity was 163 mg/L/day. An increase in light intensity could not improve biomass productivity further. However, the addition of an inorganic carbon source along with organic carbon (glucose) enhanced biomass productivity by 10 mg/L (biomass productivity: 170 mg/L/day). On the other hand, daily doses of only inorganic carbon (75 mg/L/day) in the growth media resulted in a biomass productivity of 90 mg/L/day (Table 3b). Hence, both carbon sources (inorganic and organic) are required for enhanced biomass productivity. This observation indicates that organic carbon helps the algal cells to reduce their dependency on light for inorganic carbon assimilation, and to channel the harvested light energy in the form of ATP (adenosine triphosphate) and NADPH (nicotinamide adenine dinucleotide phosphate) for cell growth [27]. Lin and Wu [28] reported that glucose enhanced the acetyl CoA/malonyl CoA for cell synthesis. These observations also suggest that Chlorella sp. utilises the energy from light in the non-glucose added mode, and uses the organic carbon source available for cell anabolism to obtain a remarkably higher growth rate [29]. As carbon uptake is the main mechanism for energy conversion and utilisation by microalgae, the consumption rate of carbon would be directly affected by nutrient supply, and further controls microalgal biomass production [30,31].
In addition to the carbon source, various trace elements also affect cell metabolism. Various ions, such as Ca2+, Fe3+, and Cu2+ are key factors involved in the physiological metabolism of algae, and increase the biomass yield and oil content at low concentration [24,32]. However, in the present study (Table 3b), the addition of ferric ion showed a detrimental effect on biomass productivity (74 mg/L/day of biomass production).
The most common growth mode for microalgae is autotrophic cultivation using CO2 and light, while in the heterotrophic mode, algae only utilise organic compounds without light illumination [30,33]. However, according to the results observed in the present study, the combined effects of light intensity, and organic and inorganic carbon resulted in better algal biomass productivity for both the algal strains. Lin and Wu [28] also reported that the specific growth rate of C. vulgaris under mixotrophic growth conditions was significantly higher than the sum of those from photoautotrophic and heterotrophic growth, illustrating synergistic growth mechanisms. Mixotrophy comprises a dual system in which the autotrophic process utilises light energy and converts the light energy into chemical energy via photosynthesis. The heterotrophic process facilitates catabolism of organic compounds to obtain the energy essential for cell division [29,31]. On the other hand, carbon dioxide from cellular respiration becomes available for re-utilisation in photosynthesis under light conditions [30]. Therefore, the external CO2 supply is reduced.
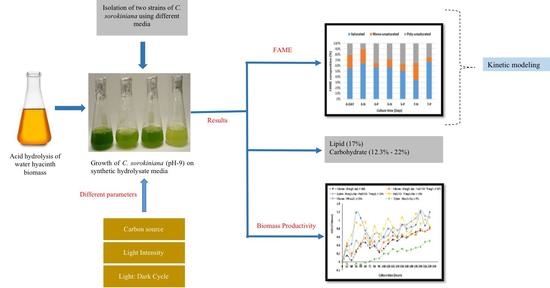
A comparative study of biomass productivity was carried out to evaluate the attractiveness of the present strain’s biomass productivity, compared to the other strains reported in the literature (Figure 1). The biomass productivity in this study was higher than the average biomass productivity of previous studies, which indicates that our study showed better results. If we evaluate only the biomass productivity of Chlorella sp., our study shows improved biomass production. It ultimately demonstrates that hydrolysate medium is an attractive growth medium for algal biomass production. One more advantage of using hydrolysate medium is that it is cheap compared to other growth media, and is produced from a waste source.

3.3. Effect of Monosaccharide Supplementation to the Hydrolysate Growth Medium on C. sorokiniana Biomass Productivity

In the previous experiment, various doses of organic and inorganic carbon were added to understand their effects on biomass productivity. The hydrolysate prepared from waste biomass contains organic carbon in the form of C5 and C6 sugars. The hydrolysate also contains various forms of nitrogen, especially ammonium nitrogen. Hence, the effects of C5 sugars (xylose) and ammonium–N were evaluated based on biomass productivity of the two algal strains.
Ammonium is a growth substrate for many oleaginous microalgae [34]. Microalgae usually prefer ammonium over other nitrogen sources for intracellular metabolic activities [46]. In general, when nitrogen is supplied as nitrate, conversion of nitrate to ammonium consumes a considerable amount of energy compared to the uptake of ammonium [9]. Hence, uptake of nitrogen as nitrate is energy intensive and may reduce algal growth. Moreover, Rani et al. [12] observed higher uptake of ammonium–nitrogen by Chlorella sorokiniana1 compared to nitrate. So, in further study, the growth medium was supplemented with two different nitrogen sources, i.e., Nitrate–N (60 mg/L) and Ammonium–N (15 mg/L). Phosphate–P was kept at 15 mg/L. A sufficient P supply ensures unhindered ATP production, which ultimately ensures algal growth [47,48,49].
Microalgae have a much higher growth potential when they use organic carbon for growth [50]. The use of exogenous carbon sources with either heterotrophic (without light) or mixotrophic (with light) culture modes has been reported to increase the biomass of several microalgal species [51,52,53]. The biomass growth rate and lipid content of Chlorella strains can be raised by supplementing the culture medium with organic carbon sources [35]. Various organic carbon sources, including polysaccharides, disaccharides, monosaccharides, starch, and ammonium acetate have been used for microalgal cultivation, but systematic comparisons of data between primary monosaccharides are limited. Hence, in this study, the effect of two different monosaccharides, i.e., glucose (C6 sugar) and xylose (C5 sugar) was analysed with respect to the optical density of media along with light/dark treatments to develop a cultivation mode that enhances biomass production. Monosaccharides and inorganic carbon sources were added every 24 h to the growth medium (with a concentration of 5 mg/L/day and 75 mg/L/day, respectively, details are given in Table 2). The light intensity was also kept constant at 221 µmol/s/m2, which was optimum according to the first phase of the study, as explained in Section 3.2.
For C. sorokiniana 1: The highest biomass productivity (38 mg/L/day) was observed in the growth medium supplemented with glucose along with an inorganic carbon source (Table 4a). Biomass productivity in the growth medium supplemented with xylose was found to be low (13 mg/L/day). In the absence of monosaccharides (control), the cultures displayed the typical green colour. Whereas, supplementation of xylose in the growth medium resulted in the discolouration of the culture, which could be due to the decline in the microalgal biomass. However, supplementation with glucose turned the microalgal culture to a deep green colour as compared to the control, which showed an increase in algal biomass and chlorophyll content (data not shown).
Some researchers, like Ribeiro et al. [54] and Derner et al. [55], have reported that the mixotrophic action of Chlorella sp. is possibly due to the photoperiod cycles, as the light availability is directly related to the inorganic carbon consumption. Similarly, in this study, the 12 h:12 h light–dark cycle was responsible for the uptake of NaHCO3. In the mixotrophy, organic carbon such as glucose, provides auxiliary energy in the form of Acetyl-CoA, NADPH and other intermediates for the cellular biosynthesis [26,54].
For C. sorokiniana 2: The highest biomass productivity (187 mg/L/day) was found in the growth medium supplemented with glucose (10 mg/L/day) along with an inorganic carbon source (Table 4b), whereas in the growth medium supplemented with xylose, the biomass productivity was found to be less (134 mg/L/day). Biomass productivity was estimated to be 150 mg/L/day when the growth media was supplemented with inorganic carbon (Na2CO3) only. The biomass productivity under inorganic carbon supplement was higher than the one reported in the presence of xylose + Na2CO3, and lower than that observed under the glucose + Na2CO3 supplement. Hence, from the different mixtures of organic and inorganic carbon, it was observed that C5 sugar reduced the growth of the algal strain, whereas C6 sugar increased the biomass productivity (Table 4b). Our results are corroborated by the findings of Chai et al. [35], who investigated the effect of glucose, galactose, fructose, and xylose on the growth of Chlorella sorokiniana UTEX 1230. They reported that supplementation with fructose promoted C. sorokiniana UTEX 1230 growth to a much lesser extent compared to glucose. Supplementation with galactose had no effect, and supplementation with xylose inhibited growth. Xylose supplementation had no effect on the growth of C. sorokiniana UTEX 1230 during the dark phase, whereas xylose significantly inhibited the algal growth under light conditions [35].
As compared to the strain isolated from the BG-11 medium (C. sorokiniana 1), algae isolated from Knop’s medium (C. sorokiniana 2) showed improved biomass productivity. After observing such an encouraging result, a one-time glucose dose was also tried, to check its role in biomass productivity. An initial dose of 200 mg/L glucose increased the biomass productivity of the strain to 204 mg/L. For a low glucose dose of 10 mg/L/day, the lower dry weight production suggested that a lower content of glucose might have been assimilated and converted into energy directly, leading to cell growth. A low glucose dose could not improve the production of the storage compounds that can increase biomass dry weight. Thus, both glucose and inorganic sources contributed to the algal growth, and likely had a cumulative effect. Whereas, xylose had a negative impact on algal growth.
Several researchers have evaluated the effect of monosaccharide supplementation on the biomass productivity of various strains of Chlorella sp. Woodworth et al. [56] found that the biomass productivity of C. vulgaris cultured under mixotrophic conditions (with glucose supplementation of 20 g/L) was higher compared to autotrophic and heterotrophic cultures. Similarly, Li et al. [57] investigated the impact of glucose on C. protothecoides, and applied a two-step process in which glucose was added in the first step and then removed in the second. Glucose addition in the process was found to influence biomass productivity and lipid accumulation, including the chlorophyll content, and protein and starch levels. Hawkins et al. [58] and Chai et al. [35] reported that C. sorokiniana utilised glucose as the primary monosaccharide compared to other sugars such as xylose, galactose, and fructose. Glucose, being the primary metabolic fuel, is more stable than other monosaccharides, and less susceptible to the formation of nonspecific glycol conjugates [35]. A perusal of the literature showed that the effect of glucose on biomass productivity of several Chlorella sp. matched with our results obtained in the present investigation. Therefore, between C5 and C6 sugars, C6 sugar (Glucose) was found to be the better monosaccharide for the growth of both Chlorella sorokiniana 1 and Chlorella sorokiniana 2, in terms of biomass productivity.

3.4. Effects of Different Parameters on C. sorokiniana Lipid Productivity and FAME Composition

After optimising the different cultivation conditions, the microalgal biomass was grown in a 3 L photobioreactor using the best parameters for growth obtained from our previous study, i.e., the combination of glucose (50 mg/L) and inorganic C-source (75 mg/L) at 221 μmol/s/m2 light intensity. As the N and P content was high in the growth medium, it is not possible to produce value-added products in the form of lipid and carbohydrate. However, increasing lipid accumulation by subjecting them to suboptimal conditions negatively affected lipid productivity due to the low growth [59]. Hence, in this study, after growth in a nutrient-sufficient condition (6 days), the algal biomass was transferred to a nutrient-amended medium for the value-added product formation (7 days). A similar strategy was also adopted previously by various researchers [60,61]. As described in Section 2.2, the nutrient-sufficient medium in this study consisted of glucose (50 mg/L), inorganic C-source (75 mg/L/day), nitrate-N (60 mg/L), NH4-N (15 mg/L), and phosphate -P (15 mg/L). The study was conducted under 12 h:12 h light–dark phase.
The biomass productivity in the photobioreactor under the nutrient sufficient condition was found to be 73 mg/L/day for C. sorokiniana 1 (Table 5), which was lower than the one obtained during our previous study (Table 3a). Nitrogen and phosphorus contents were measured on the 7th day, and the nitrate-N decreased to 0.082 mg/L from 60 mg/L. Ammonium–N content was found to be 0.019 from the initial amount of 15 mg/L, and phosphate-P content decreased to 0.837 mg/L from 15 mg/L. For C. sorokiniana 2, biomass productivity was found to be 267 mg/L/day (Table 5). The nitrogen and phosphorus contents were measured on the 7th day, and the nitrate-N decreased to 1.66 mg/L from 60 mg/L. Ammonium–N content decreased to 0 from the initial amount of 15 mg/L, and phosphate-P content decreased to 1.2 mg/L from 15 mg/L.
The second part of this study emphasises the enhancement of lipid accumulation by transferring the algal biomass into the nutrient amended conditions. Two different media were prepared (details are given in Section 2.3.2). The first nutrient amended medium (referred to as N amended) contained an initial amount of 5 mg/L ammonium–N, with no phosphate-P in the medium. The other nutrient amended medium (referred to as P- amended) had an initial amount of 3 mg/L phosphate-P, without a nitrogen source. The carbon sources were regularly added (5 mg/L of glucose and 125 mg/L NaHCO3).
The biomass productivity was found to be higher in the P-amended medium for both the algal strains. C. sorokiniana 1 registered an 82.9 mg/L/day biomass productivity (Table 5), and C. sorokiniana 2 showed a biomass productivity of 178 mg/L/day (Table 5). Whereas, in the N-amended medium, biomass productivity was found to be 58.5 mg/L/day (Table 5) and 94.3 mg/L/day, for C. sorokiniana 1 and C. sorokiniana 2, respectively. Contrary to biomass productivity, the lipid accumulation was higher in the N- amended medium than the P-amended medium for both the algal strains (Table 6 and Table 7).
For C. sorokiniana 1: lipid accumulation increased to its highest (17.2%) on the 5th day in the N-amended medium. Whereas, in the P-amended medium, the highest (9.9%) lipid production was observed on the 3rd day (Table 6).
Lipid productivity is one of the indicators for selecting an algal strain for biodiesel production. Hence, lipid productivity for both strains was estimated. It was observed that for C. sorokiniana 1, lipid productivity (taking into account biomass productivity in the nutrient sufficient condition) was 20 and 13 mg/L/day for the N- and P-amended media, respectively. On the other hand, C. sorokiniana 2, registered lipid productivity of 30 and 33 mg/L/day for the N- and P-amended media, respectively. Hence, although lipid production was low in the Knop’s medium strain, because of high biomass productivity in the P-amended medium, this strain showed higher lipid productivity than the other strain.
Shi et al. [62] studied the marine algae Micractinium inermum, which could grow in phototrophic, mixotrophic, and heterotrophic conditions, and showed lipid productivity as high as 0.68 g/L/day in the heterotrophic condition. Similarly, a Chlorella vulgaris strain studied by a research group at the University of Minnesota showed that the strain could grow in three modes, i.e., autotrophy, mixotrophy, and heterotrophy. The largest lipid productivity, however, was observed in the mixotrophic mode (0.23 g/L/day), and the largest lipid content was observed when the culture was fed solely by glucose (40% lipid content) [63]. In autotrophic and heterotrophic modes, the lipid content varied from 8–25%. Similarly, Gladue and Maxey [64] observed that in the presence of acetate, Chlorella vulgaris could produce 0.027 g/L/day lipid. Maurya et al. [36] used hydrolysate produced from algal biomass as a feed for producing algal biomass (
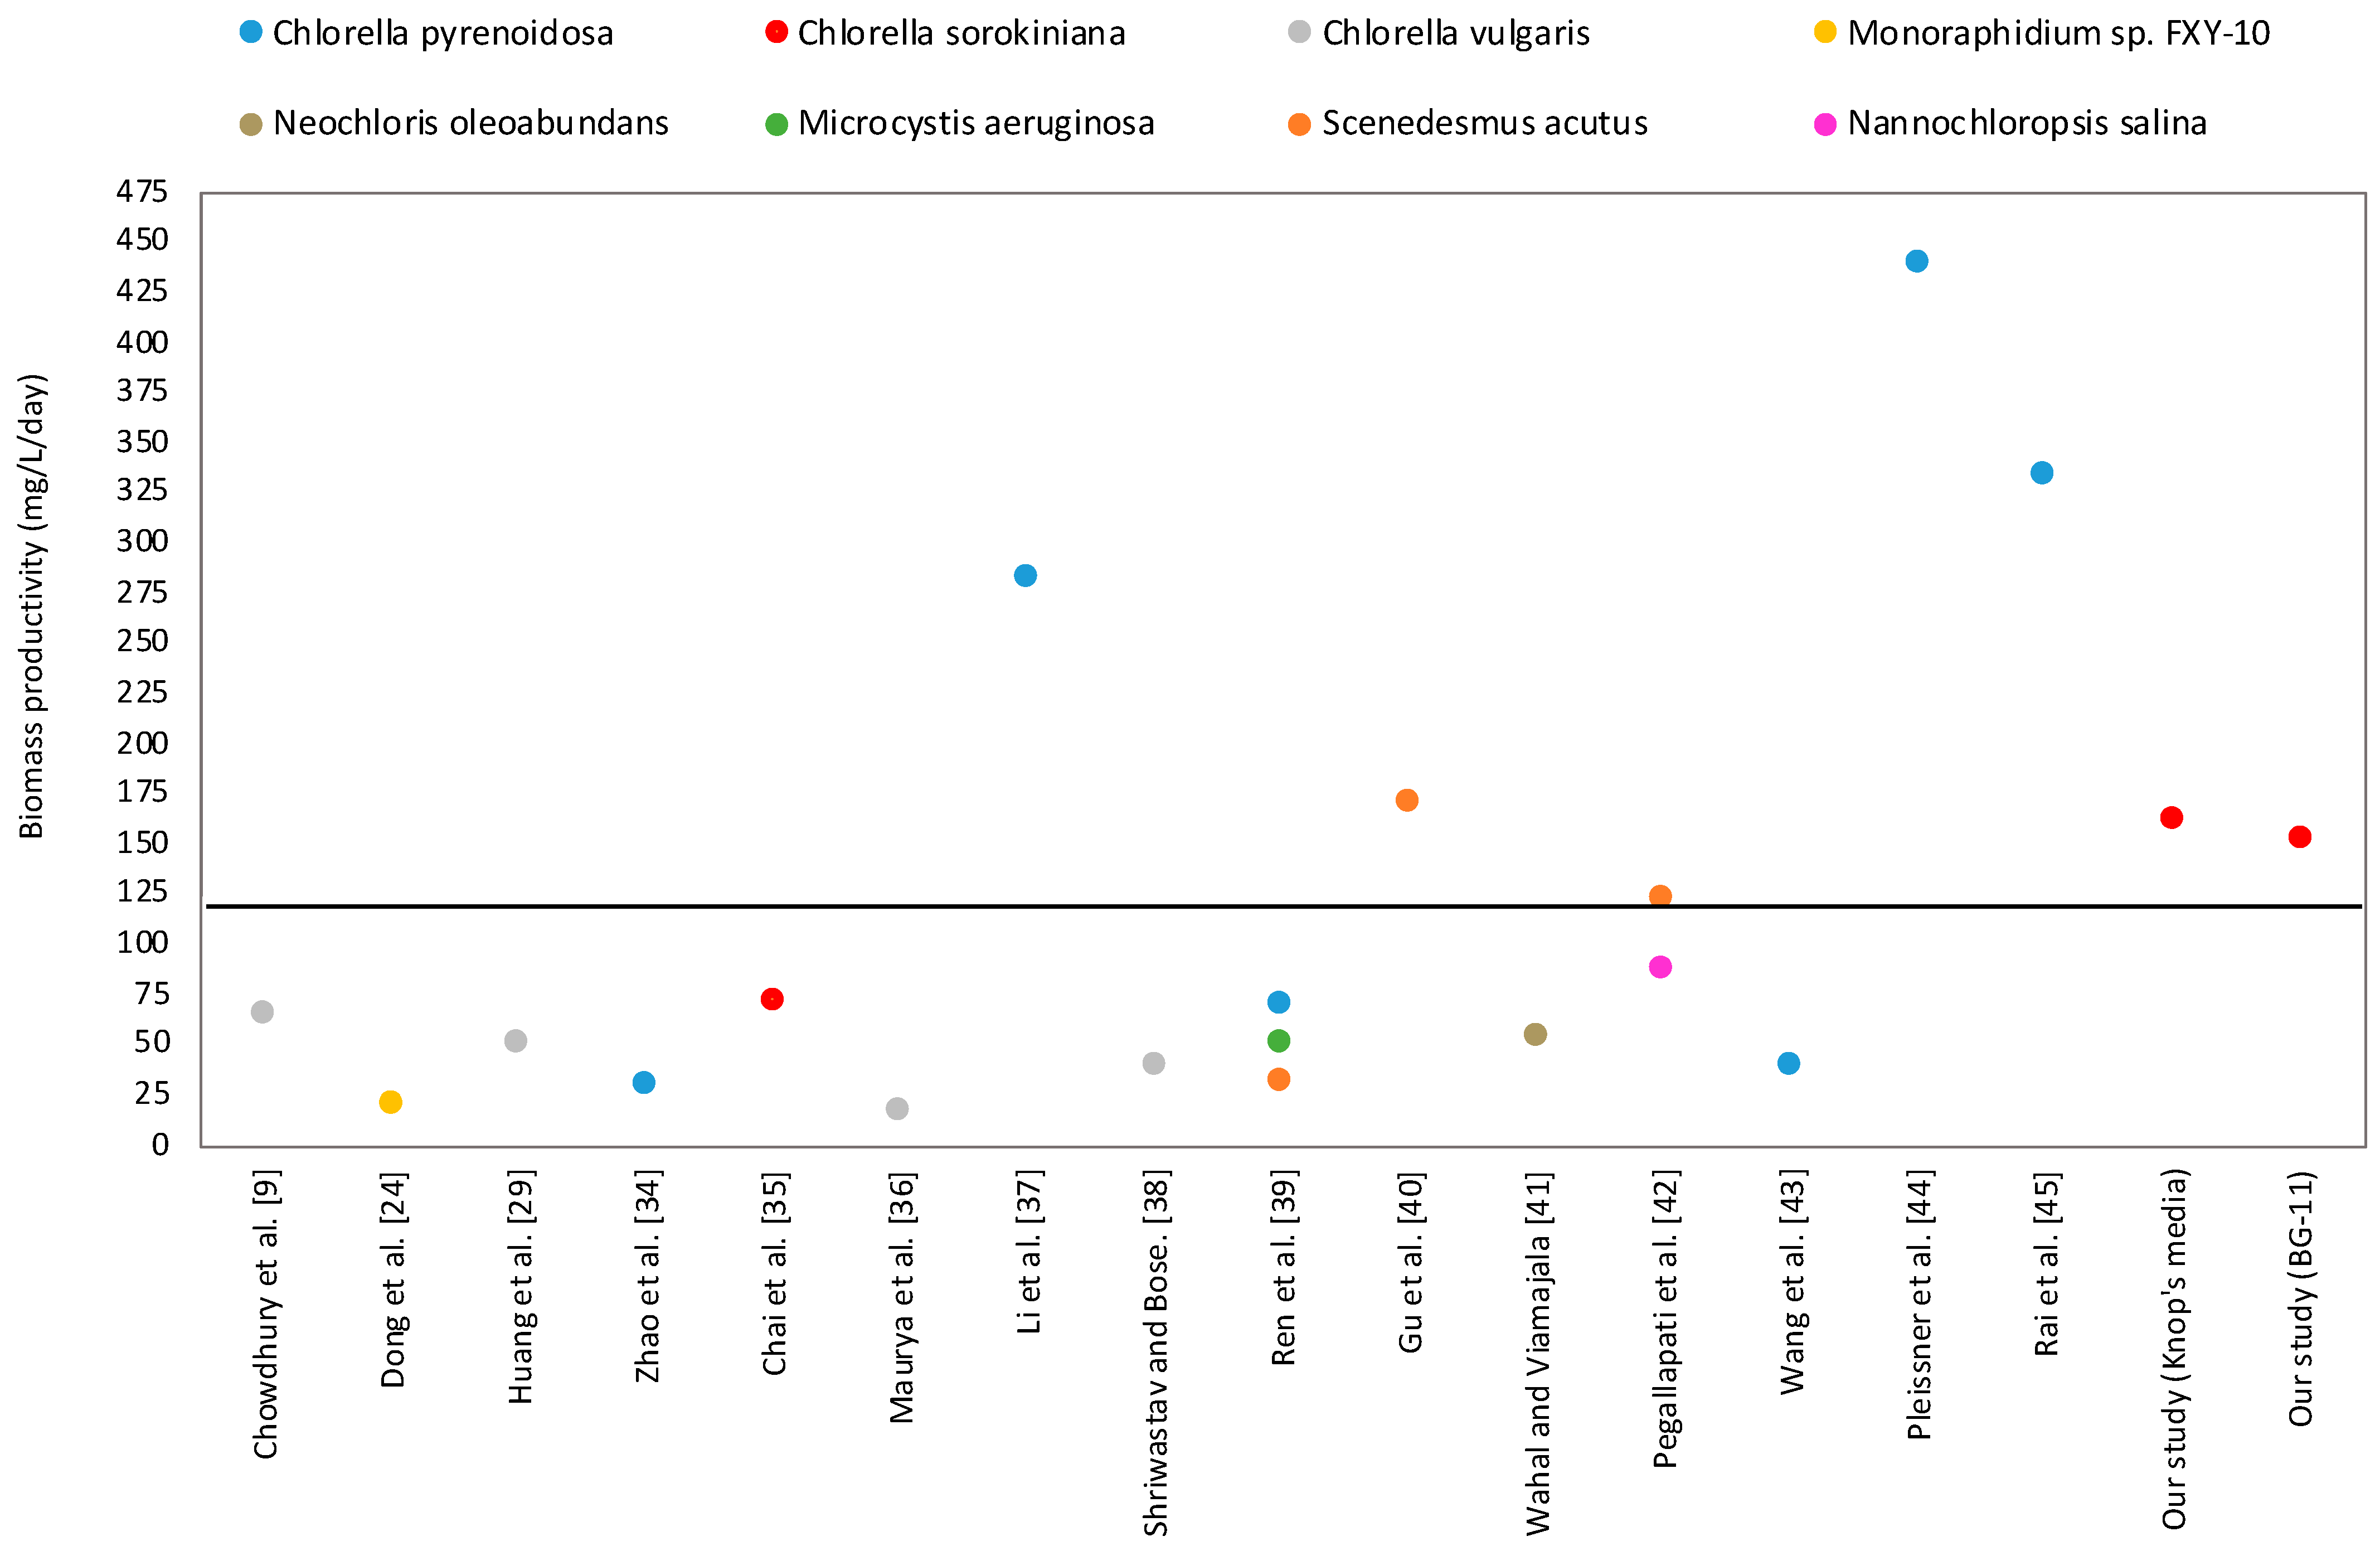
Chlorella vulgaris). In the present study, supplementation of algal hydrolysate increased the lipid content in the algal cells (depending on the concentration of algal hydrolysate in the synthetic media), and lipid content varied from 23% to 32%. However, lipid productivity (0.007 g/L/day) was very low compared to the other studies. To evaluate the attractiveness of the present strains, the lipid productivity of other species reported in the literature was collected, and is presented in Figure 2. An average productivity of 100 mg/L/day was estimated for the lipid productivity obtained from the literature. However, the high productivity was because of a few species of Scenedesmus and Micractinium. These species showed extremely high lipid productivity (500–2000 mg/L/day) [65]. However, if one considered only the species of Chlorella, the average lipid productivity was 49 mg/L/day, whereas species of Nannochloropsis registered lipid productivity of 120 mg/L/day. Various species of Botryococcus showed average lipid productivity of 32 mg/L/day. Hence, the strains used in this study showed below-average lipid productivity compared to the average lipid productivity observed in the literature (Figure 2). However, most of the species showed lipid productivity ranging between 5–50 mg/L/day. Hence, to understand the attractiveness of the present strain as a biodiesel feedstock, a frequency distribution of the lipid productivity was plotted (data are not shown). The frequency distribution revealed that the most common lipid productivity obtained from the literature was between 20 to 40 mg/L/day. Hence, the analysis showed that the present strains showed a lipid productivity that is frequently encountered for most of the species, and these species showed a higher than average biomass productivity.
Beside lipid productivity and lipid content, lipid composition and individual fatty acid components also affect biodiesel quality. Hence, fatty acid profiles of individual strains were also evaluated in detail.
For 
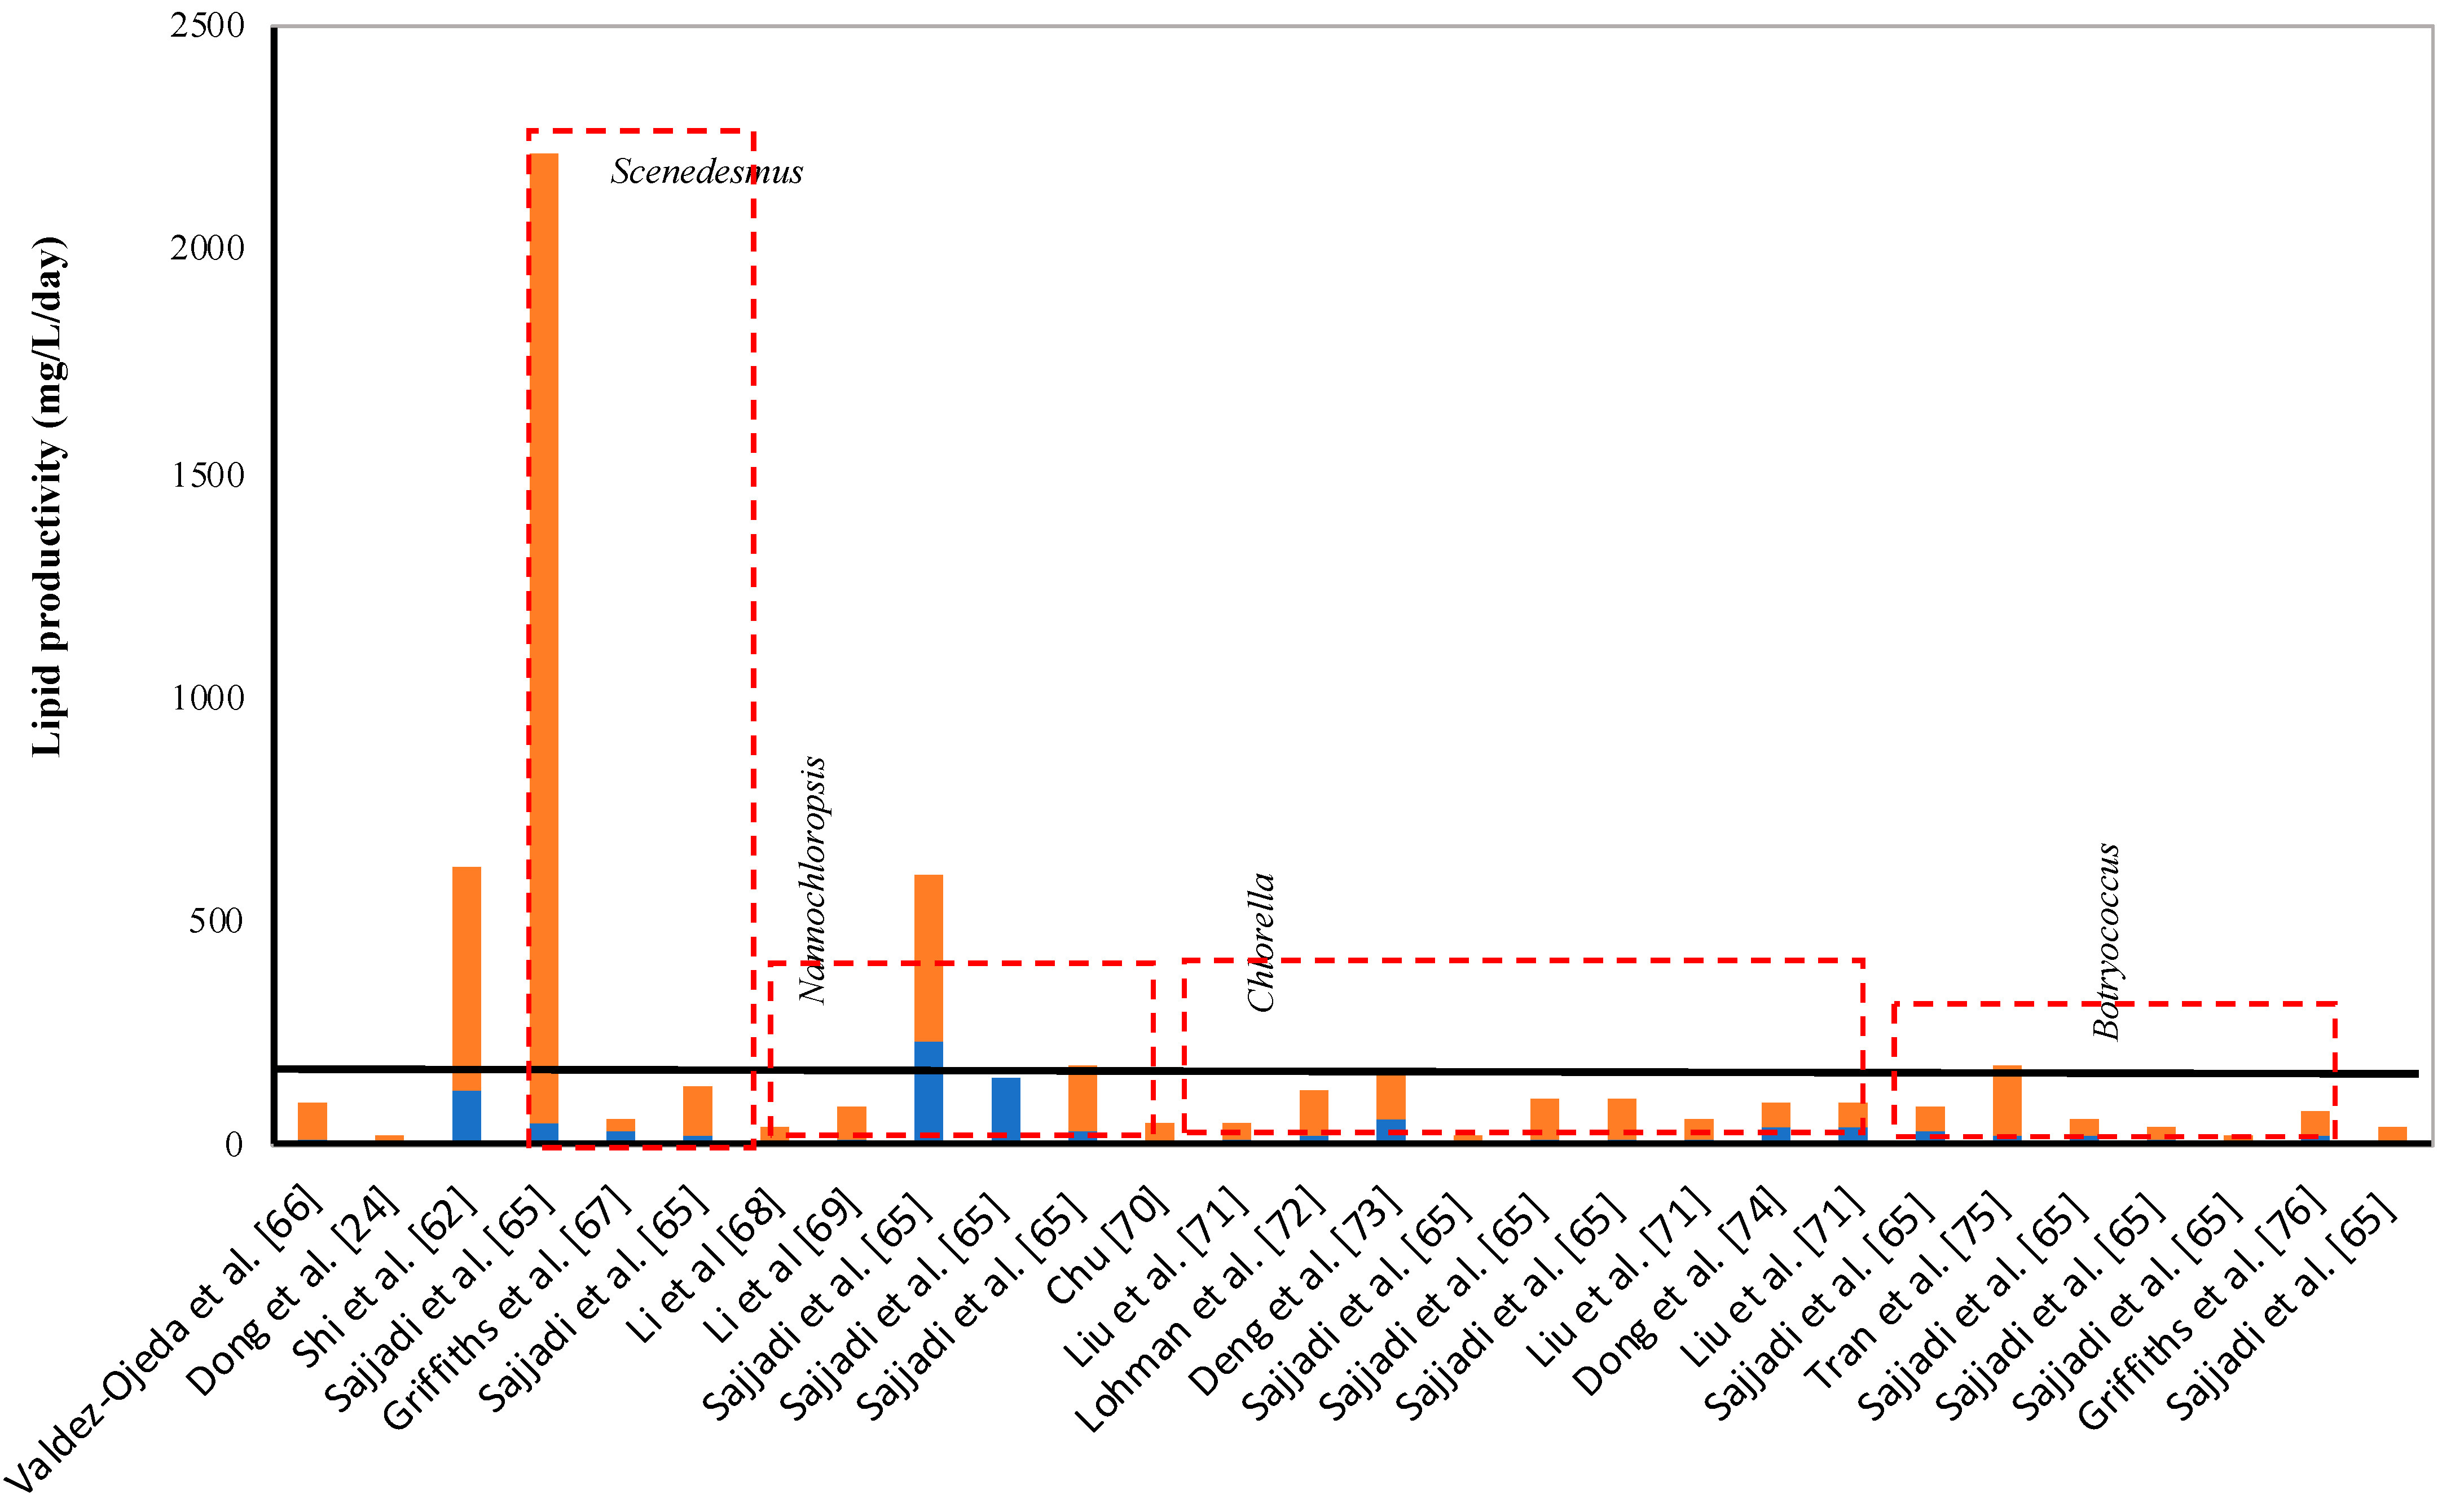
C. sorokiniana 1, in the N-amended medium (5-N), the highest saturated fatty acids (SFA) of 9.8%, and total FAME content of 11.56% were reported on the 5th day. The total FAME content increased by 5% as compared to day 0, amongst which polyunsaturated fatty acid (PUFA) increased by 3% (Table S4, Supplementary Information). Lipid content started decreasing after 5 days, as only 9.3% and 5% of lipid production was estimated on the 7th day in the N-amended medium (7-N) and P-amended medium (7-P), respectively (Figure 3). The SFA comprised C16:0 (Palmitic acid), C18:0 (Stearic acid), and C20:0 (Eicosanoic acid). In the present study, C16:0 constituted a significant fraction of SFA, whereas C18:1 and C18:2 were the major fractions of unsaturated fatty acid.
Contrary to lipid accumulation, the highest carbohydrate content was recorded in the P-amended medium at the end of the study (22%).
For C. sorokiniana 2: Lipid accumulation on the initial day (referred to as 0 day) was 10.87% (Figure 3) of which 72% represents the SFA. After that, the lipid accumulation increased in both the media. On the 3rd day, (referred to as 3-N and 3-P) accumulated lipid was 13.43% and 15.09% in the N-amended medium and P-amended medium, respectively (Table 7). While, 92% of the total FAME composition consisted of SFA (Table S5, supplementary information). The highest lipid content was observed on the 5th day, with 16.88% and 14.07% in the N-amended medium (referred as 5-N) and P-amended medium (referred as 5-P), respectively (Figure 3). In the N-amended medium (5th day), the content of PUFA was 42% of the total FAME composition, and was found to be the highest compared to the other days. SFA content was estimated to be 56% of the total FAME, and the rest was monounsaturated fatty acid (MUFA). However, in the P-amended medium, 88% of the total FAME was SFA, and the rest were MUFA and PUFA. Lipid content declined after 5 days as only 12.51% and 6.92% of lipid was estimated on 7th day in the N-amended medium (7-N) and P-amended medium (7-P), respectively (Table 7). In the N-amended medium (5th day), the total FAME content was the highest compared to the other days, but the composition of SFA alone was less. Whereas in the P-amended media, the SFA alone comprised the maximum FAME composition, whereas MUFA and PUFA were only about 1–2%. At the end of the study, the carbohydrate content was estimated to be higher in the N-amended medium (12.7 %) than the P-amended medium (3.13%). This result was found to be contrary to the algae isolated from the BG-11 medium.
According to the biodiesel standard EN 14214, IS 15607 and ASTM D-6751, the linolenic methyl ester (produced from C18:3 FA) content of biodiesel must be less than 12%, and the polyunsaturated methyl ester (at least four double bonds) content must be less than 1% [77]. In the present study, for both the algal strains, the proportion of linolenic acid was 0, which satisfied the standard of biodiesel. Compared to the present strains, Huang et al. [29] reported that marine algae Phaeodactylum tricornutum showed enhanced lipid productivity under nitrogen deprived conditions. Whereas, Isochrysis zhangjiangensis showed enhanced lipid productivity under phosphorus deficient conditions, which is in accordance with our observations. Fu et al. [78] observed that phosphorus supplementation enhanced the synthesis of saturated fatty acids, while curtailing the unsaturated fatty acid production pathways. Zhu et al. [79] and Singh et al. [80] also discussed in their work that all nitrogen limited conditions led to an increasing proportion of C18:1. Whereas, Chu et al. [11] observed that nitrogen deficiency increased unsaturated fatty acids, including mono and poly unsaturated fatty acids. Supplementing the media with P increased lipid production. Both N and P limitation affected the lipid productivity.
In the present study, it was observed that for the algal strain isolated from Knop’s medium, i.e., C. sorokiniana 2, when grown in nutrient amended medium, especially P-amended medium, the major fraction of the saturated fatty acid was C16:0. At the same time, a minor fraction of C14:0 was also observed. However, for the other strain (BG-11), no C14:0 fatty acid was detected (Table 6 and Table 7). C. sorokiniana 1 accumulated more unsaturated fatty acid in the N-amended media than that in the P-amended media. Whereas, C. sorokiniana 2 accumulated almost 80% saturated fatty acids in both media. A considerable portion of C18:0 was also detected in C. sorokiniana 2, making it more suitable for producing biodiesel compared to the other strain (BG-11).
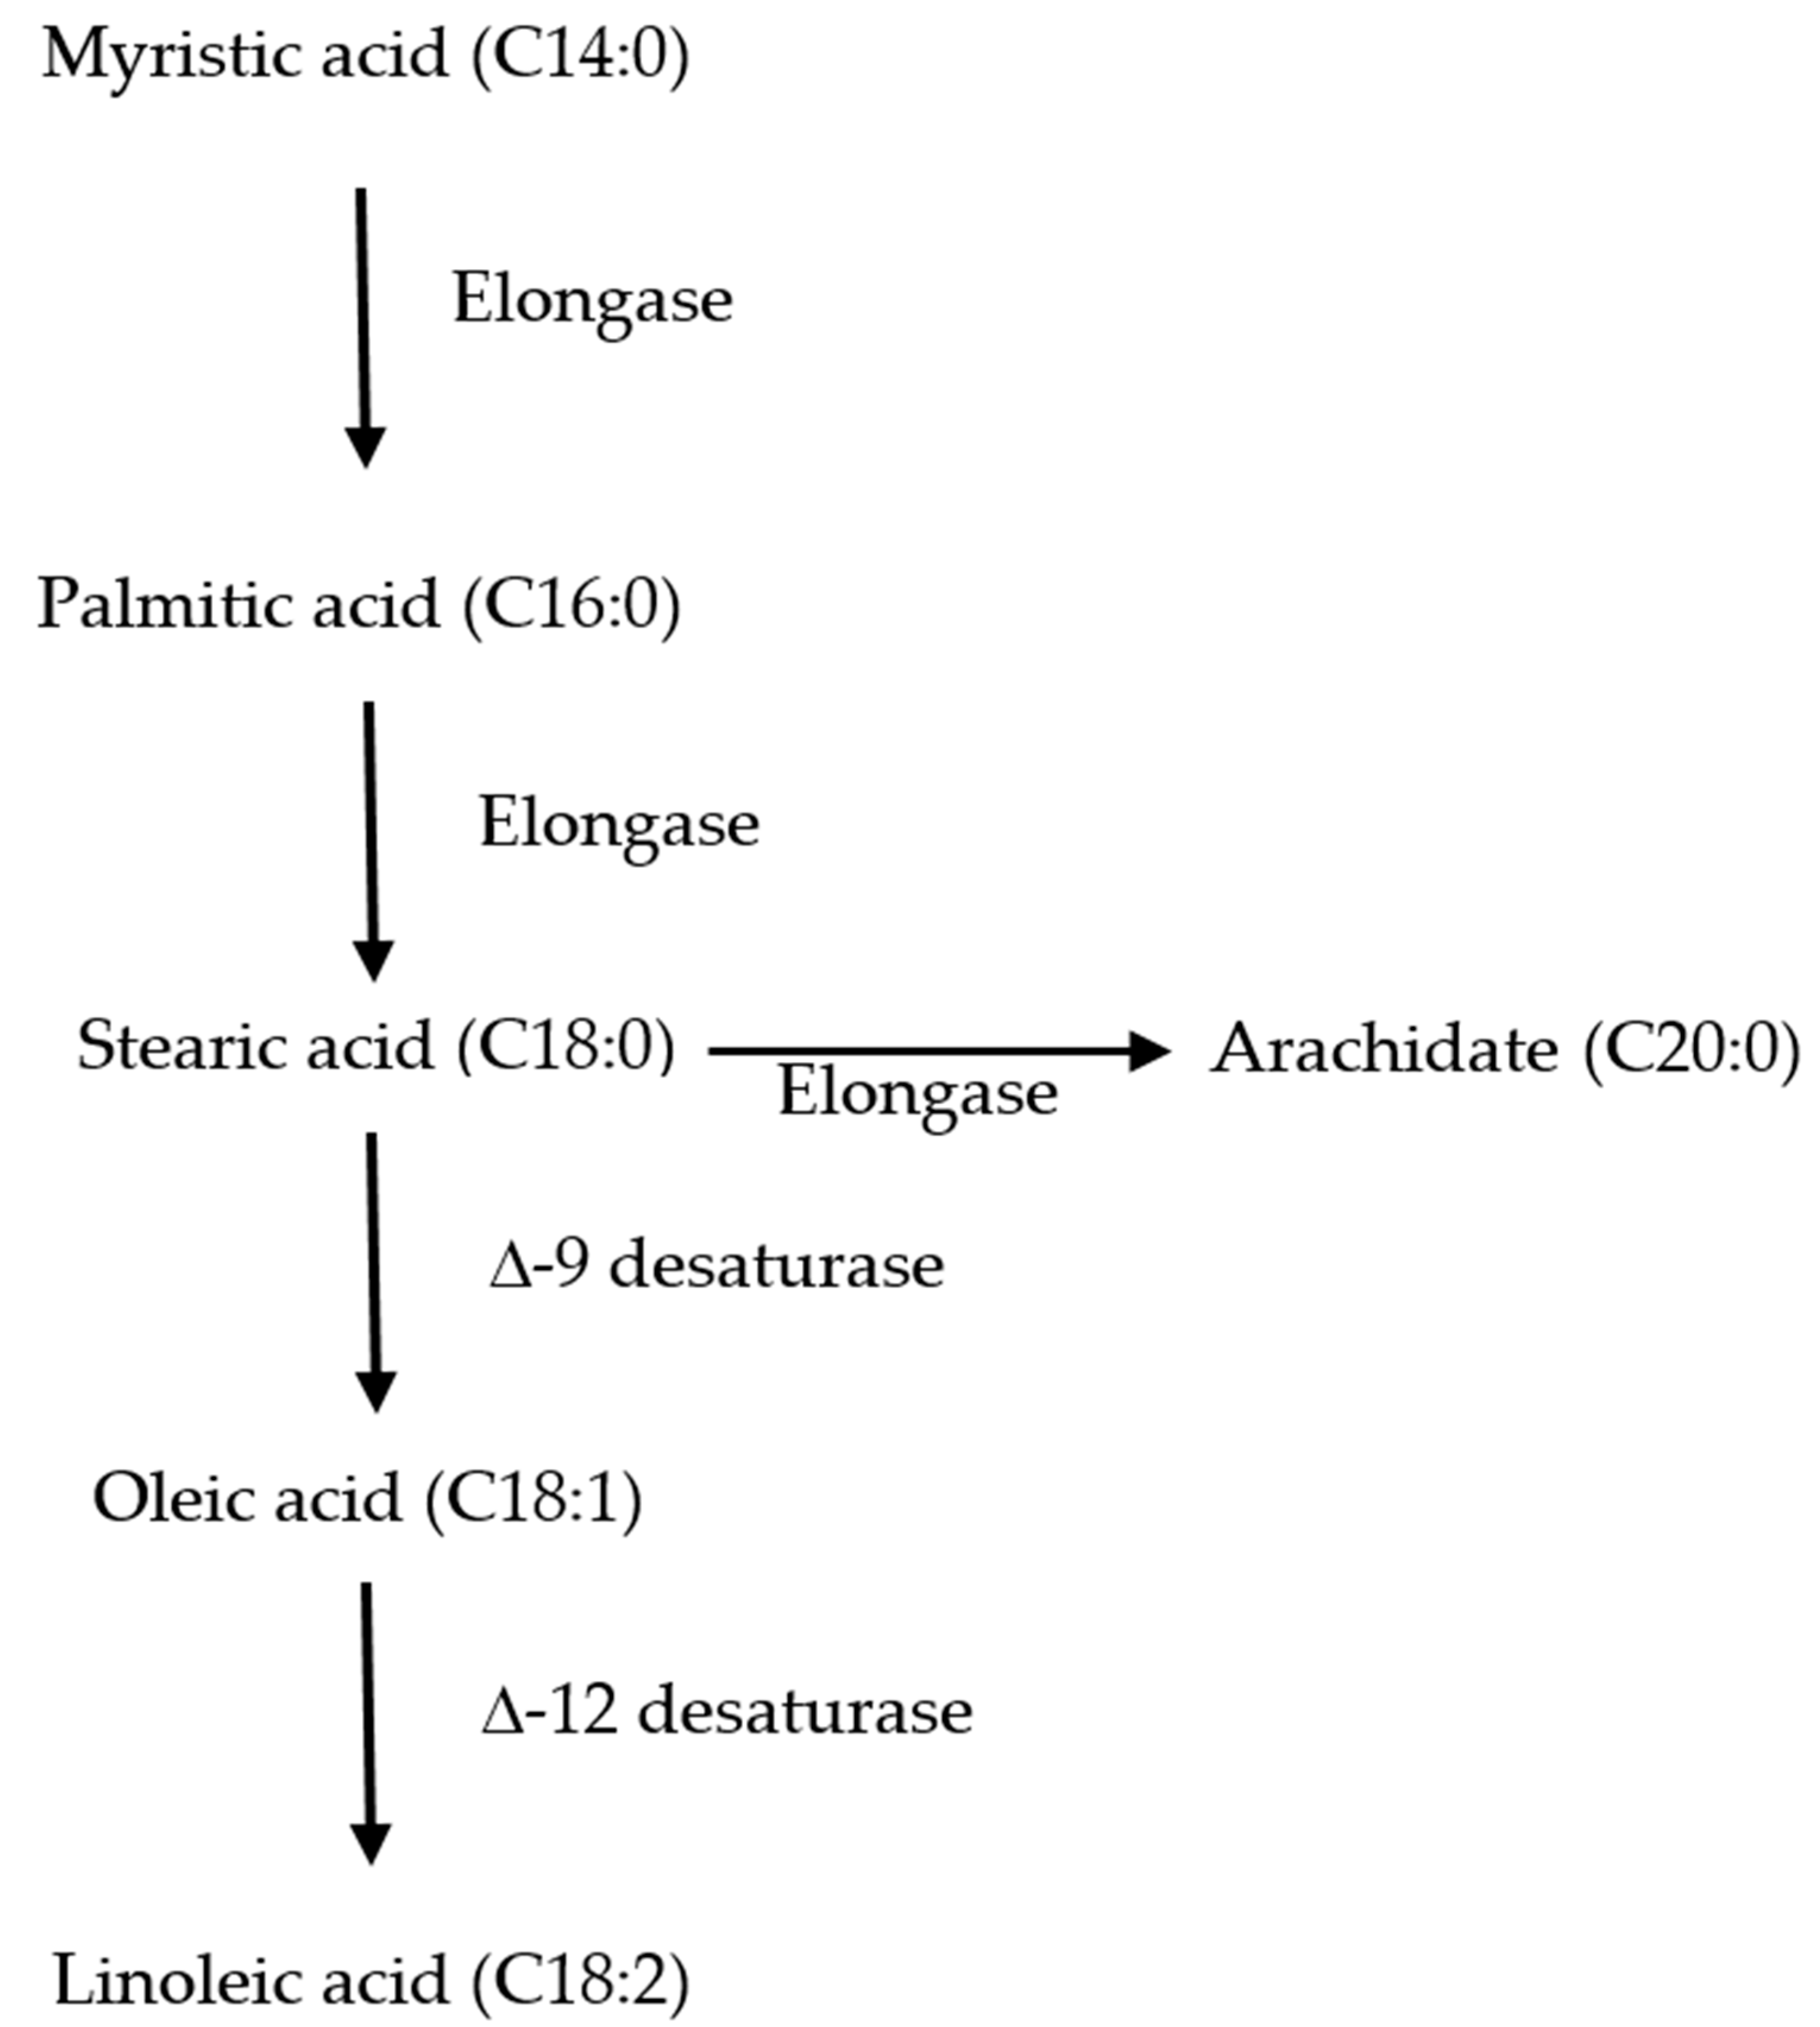
From a review of this study, it was observed that the constituents of FAME were different in the two strains, and the most striking difference was found with respect to the saturated and unsaturated fatty acids. To better understand the inherent difference in fatty acid production, kinetic modeling of the fatty acid profile of these strains was carried out. Before presenting a kinetic model, one needs to know the various fatty acids which are being used to produce neutral lipids and free fatty acids. In this study, C14:0 (myristic acid) was the first fatty acid produced, which later elongated to C16:0 and C18:0. These saturated fatty acids were produced from shorter chain fatty acids by the delta elongase enzyme (Figure 4). The saturated fatty acids were later converted to unsaturated fatty acids, and delta desaturase enzyme was used to catalyse the conversion. However, depending on the position of the unsaturated bond, different desaturase enzymes act on a particular fatty acid. For simulating such a conversion, it was assumed that the kinetics were first order (Section 2.4). C. sorokiniana 1 produced C16:0, C18:0, C 20:0 as SFA, and C18:1 and C18:2 as the unsaturated fatty acid. Hence, C16:0 worked as the precursor for the production of other fatty acids, and the rate of production of C16:0 was assumed as zero-order kinetics. Other rate constants were modeled as first order (details of the model are provided in Section 2.4.). For C.sorokiniana 2, C14:0 appeared to act as a precursor for producing other higher-order chain fatty acids.
From a perusal of the kinetic coefficients obtained from the models, no definite trend was observed. Some of the kinetic coefficients were higher in C. sorokiniana 1, compared to C. sorokiniana 2. The maximum kinetic coefficient for C. sorokiniana 1 and C. sorokiniana 2 was for the conversion of C16:0 to C18:0, and C18:0 to C18:1 (K3). Prima facie, it seems that the conversion was a bit higher in C. sorokiniana 1 compared to C. sorokiniana 2. Similarly, some of the kinetic coefficients were quite different in the N-amended medium compared to the P-amended medium. Therefore, to understand the statistical difference among the kinetic coefficients, one-way ANOVA followed by Tukey’s test for multiple comparison of means were undertaken [16]. From a perusal of the ANOVA, it was observed that the kinetic coefficients for C. sorokiniana 2 were statistically significant (p = 0.05). Later, Tukey’s test [16] revealed that K3 was statistically significant compared to other kinetic coefficients (Table 8). However, no such difference was observed between kinetic coefficients obtained using the N-amended and P-amended media. Similarly, no such statistical significance was observed between kinetic coefficients obtained for C. sorokiniana 1 and C. sorokiniana 2. Hence, the statistical analysis revealed that the kinetics of lipid production for the strains are the same, even though there were some differences observed in lipid quantity and lipid profile between the two strains. It can also be deduced that the C18:0 production and conversion to C18:1 were quite fast. Hence, the rate-limiting steps for lipid production were most likely the production of C14:0 and C16:0, and their conversion (for C. sorokiniana 2).
To better understand the lipid production, the biochemical processes responsible for lipid production were also examined. Lipid production is a stress-induced phenomenon. Under nitrogen depleted conditions, adenosine monophosphate (AMP) can be decomposed into inosine monophosphate (IMP) and NH4+, and catalysed by AMP deaminase as a way to release ammonia. The decrease of AMP, a co-substrate for isocitrate dehydrogenase catalysing the transformation of isocitrate to α-ketoglutarate, will disturb the Kreb’s cycle [81] and, as a result, the mitochondrion accumulates isocitrate that remains imbalanced with citrate. Excess non-metabolised citrate is then transported to the cytoplasm via the citrate–malate shuttle to be converted into acetyl-CoA by ATP-citrate lyase (ACL), which is an additional pathway in oleaginous microorganisms. Under conditions of nitrogen exhaustion, the flow of carbon in oleaginous microorganisms is transferred towards the accumulation of citric acid, which is later transformed to acetyl–CoA, a precursor for fatty acid synthesis. The present study appears to support these observations, as nitrogen amended media seemed to trigger the lipid accumulation in both the strains.
When the availability of nitrogen is restricted, the synthesis of proteins and nucleic acids is curtailed. Carbon is used for protein, and nucleic acid synthesis used for lipid synthesis, and its concentration increases. Therefore, enhancing the activity of acetyl-CoA synthetase (ACS) and reducing the activity of isocitrate dehydrogenase (ICDH), resulted in more acetyl–CoA to participate in the lipid biosynthetic pathway, which was suggested to be beneficial for lipid accumulation [26]. Acetyl–CoA carboxylase (ACCase) converts acetyl–CoA into malonyl-CoA, the first, and rate-limiting, step of fatty acid biosynthesis [26]. Phosphoenolpyruvate can be converted into oxaloacetate by phosphoenolpyruvate carboxylase (PEPC), which decreases the flow of carbon towards lipid biosynthesis in microalgae. Accordingly, the inhibition of PEPC may be beneficial for lipid production.
In the P-amended medium, phosphorus was stored in the form of Poly-P, providing energy to participate in the synthesis of cellular materials, which enhanced cell growth and lipid accumulation, similar to ATP provided in the anabolic processes under nitrogen starvation [11,79]. According to the previous literature, the following potential mechanisms may be involved during the presence of phosphorus: (1) nitrogen limitation causes upregulation of malic enzyme, generating NADPH, which leads to lipid accumulation [37]; (2) upregulated glutamate dehydrogenase promotes the tricarboxylic acid cycle that offers intermediates and energy for lipid biosynthesis [46]; and (3) abundant phosphorus intake causes the downregulation of the ADP (Adenosine diphosphate)–glucose pyrophosphorylase activity of Chlorella sp., inhibiting starch synthesis, and regulating carbon assimilation towards the lipid synthesis pathway [79].
In the present study, nitrogen deficiency certainly inhibited the TCA (Tri-carboxylic acid) cycle [81] for energy production, and a part of the organic carbon participated in the lipid and starch production. It was observed that the presence of phosphorus promotes the fatty acid synthesis, and restricts the conversion of saturated fatty acids to unsaturated fatty acids.

4. Conclusions

The combined effects of glucose, inorganic carbon, and a 12 h:12 h light–dark cycle were the optimum combination of parameters for high biomass productivity. N-deficiency enhanced the unsaturated lipid production in C. sorokiniana 1, whereas both N and P deficiency could not enhance the unsaturated lipid production in C. sorokiniana 2. Biodiesel produced from both the strains had a suitable quality, and which satisfied the biodiesel standards specified by various international regulating agencies. The biomass productivity of both the strains exceeded the average productivity of algal species reported in the previous literature. Hence, hydrolysate prepared from water hyacinth can be utilised as a cheap growth medium for growing different strains of Chlorella sorokiniana to accumulate a large amount of lipid.

Supplementary Materials

The following are available online at https://www.mdpi.com/1996-1073/14/5/1411/s1.

Author Contributions

Conceptualization, R.C.; Formal analysis, R.C.; Investigation, S.D.; Methodology, R.C.; Resources, W.T.; Writing—original draft preparation, S.D.; Writing—review & editing, S.D., R.C. and W.T.; Visualization, R.C.; Supervision, R.C. and P.K.; Project administration, P.K.; Funding acquisition, R.C. and P.K. All authors have read and agreed to the published version of the manuscript.

Funding

The research work is a collaborative study between the University of British Columbia, Canada (funding agency: IC-IMPACT) and Indian Institute of Technology, Roorkee, India, (Funding agency: Dept. of Biotechnology, Govt. of India; DBT-893-CED). Partial funding of this research was collected from a funding given by Dept. of Science and Technology (DST-1589-CED).

Institutional Review Board Statement

Not applicable.

Informed Consent Statement

Not applicable.

Data Availability Statement

Not applicable.

Acknowledgments

The authors are extremely thankful to Victor Lo and Asha Srinivasan (Dept. of Civil Engineering, University of British Columbia, Canada) for their support.

Conflicts of Interest

The authors declare no conflict of interest.

Abbreviations

PCRPolymerase Chain Reaction
NCBI National Center for Biotechnology Information
BLASTBasic Local Alignment Search Tool
ATPAdenosine triphosphate
NADPHNicotinamide adenine dinucleotide phosphate
IMPInosine monophosphate
ADPAdenosine diphosphate
TCATri-carboxylic acid cycle
ACSAcetyl-CoA synthetase
ICDHIsocitrate dehydrogenase
ACCaseAcetyl-CoA carboxylase
AMPAdenosine monophosphate
ACLATP citrate lyase
PUFAPolyunsaturated Fatty acid
MUFAMono-Unsaturated Fatty acid
SFASaturated Fatty acid
CO2Carbon dioxide
HNO3Nitric acid
Na2CO3 Sodium carbonate
NaHCO3Sodium bicarbonate
NO3Nitrate
NH4Ammonium
PO4Phosphate
PEPCPhosphoenolpyruvate carboxylase
FAMEFatty acid methyl ester

Appendix A

Appendix A.1. Biomass Used

Naturally available water hyacinth biomass was collected from the stagnant water bodies present near the campus of the Indian Institute of Technology Roorkee, India. Biomass was washed several times with distilled water and dried in a hot air oven at 80 °C for 24 h before converting it into a powdered form.

Appendix A.2. Hydrolysing Reagents

Acetic acid (CH3COOH, 100% purity, ACS grade), nitric acid (HNO3, 70% purity, reagent grade), ferric chloride anhydrous (FeCl3, 98% purity, powder) were used as the hydrolysing reagents. Sulphuric acid (H2SO4, 98% purity, reagent grade) was used as a reference hydrolysing reagent for the comparison. All the chemicals were purchased from Sigma Aldrich.

Appendix A.3. Hydrolysate Preparation

The powdered forms of water hyacinth biomass were hydrolysed separately using 1%, 2%, and 5% concentrations of CH3COOH, HNO3 and FeCl3 at 121 °C and 103.4 kPa (15 psi) for two time intervals, i.e., 30 min and 1 h. The concentration of the reference hydrolysing reagent, H2SO4 was 1%. The solid:liquid ratio was kept at 1:10 for all the experiments. All the hydrolysates prepared were neutralised and filtered before characterisation.

Appendix A.4. Analytical Methods

Appendix A.4.1. Characterisation of Water Hyacinth Biomass

The elemental composition of water hyacinth biomass was analysed before the hydrolysis of the biomass using a CHNS elemental analyser (Vario EL III, Elementar).

Appendix A.4.2. Characterisation of the Hydrolysates

Samples were first centrifuged at 4000 rpm for 10 min, and the supernatants were collected after passing through a 0.2 µm syringe filter. The filtered supernatants were analyzed for nitrate (Nitrate-N) and orthophosphate using an ion chromatograph (Metrohm, 850 Professional IC), equipped with a Metrosep A Supp 5- 100/4.0 anionic column. Chemical oxygen demand (COD) was measured using the closed reflux method prescribed in Standard Methods [15]. The phenol sulphuric acid method (Dubois et al., 1956) was used to analyse the total carbohydrates present in the hydrolysates. Absorbance was measured by a UV-VIS spectrophotometer (DR 6000, HACH).

Appendix A.4.3. Analysis of Reducing Sugars

The estimation of simple sugars (glucose, xylose and arabinose) was carried out using high performance liquid chromatography (HPLC). The analysis was done by injecting filtered hydrolysate into HPLC (Agilent) equipped with an Aminex HPX-87H Column at 55 °C. 0.005 M H2SO4 was used as a mobile phase (flow rate: 0.6 mL/min), and a refractive index detector was used for detection.

References

  1. Barua, V.B.; Kalamdhad, A.S. Effect of various types of thermal pretreatment techniques on the hydrolysis, compositional analysis and characterization of water hyacinth. Bioresour. Technol. 2017, 227, 147–154. [Google Scholar] [CrossRef]
  2. Amezcua-Allieri, M.A.; Durán, T.S.; Aburto, J. Study of Chemical and Enzymatic Hydrolysis of Cellulosic Material to Obtain Fermentable Sugars. J. Chem. 2017, 2017, 1–9. [Google Scholar] [CrossRef] [Green Version]
  3. Abdel-Fattah, A.F.; Abdel-Naby, M.A. Pretreatment and enzymatic saccharification of water hyacinth cellulose. Carbohydr. Polym. 2012, 87, 2109–2113. [Google Scholar] [CrossRef]
  4. Harun, M.Y.; Radiah, A.B.D.; Abidin, Z.Z.; Yunus, R. Effect of physical pretreatment on dilute acid hydrolysis of water hya-cinth (Eichhornia crassipes). Bioresour. Technol. 2011, 102, 5193–5199. [Google Scholar]
  5. Castro, Y.A.; Ellis, J.T.; Miller, C.D.; Sims, R.C. Optimisation of wastewater microalgae saccharification using dilute acid hydrolysis for acetone, butanol, and ethanol fermentation. Appl. Energy 2015, 140, 14–19. [Google Scholar] [CrossRef] [Green Version]
  6. Moon, M.; Kim, C.W.; Farooq, W.; Suh, W.I.; Shrivastav, A.; Park, M.S.; Mishra, S.K.; Yang, J.W. Utilisation of lipid extracted algal biomass and sugar factory wastewater for algal growth and lipid enhancement of Ettlia sp. Bioresour. Technol. 2014, 163, 180–185. [Google Scholar] [CrossRef]
  7. Chowdhury, R.; Freire, F. Bioenergy production from algae using dairy manure as a nutrient source: Life cycle energy and greenhouse gas emission analysis. Appl. Energy 2015, 154, 1112–1121. [Google Scholar] [CrossRef]
  8. Chowdhury, R.; Franchetti, M. Life cycle energy demand from algal biofuel generated from nutrients present in the dairy waste. Sustain. Prod. Consum. 2017, 9, 22–27. [Google Scholar] [CrossRef]
  9. Chowdhury, R.; Keen, P.L.; Tao, W. Fatty acid profile and energy efficiency of biodiesel production from an alkaliphilic al-gae grown in the photobioreactor. Bioresour. Technol. Rep. 2019, 6, 229–236. [Google Scholar] [CrossRef]
  10. Brennan, L.; Owende, P. Biofuels from microalgae—A review of technologies for production, processing, and extractions of biofuels and co-products. Renew. Sustain. Energy Rev. 2009, 14, 557–577. [Google Scholar] [CrossRef]
  11. Chu, F.-F.; Chu, P.-N.; Cai, P.-J.; Li, W.-W.; Lam, P.K.; Zeng, R.J. Phosphorus plays an important role in enhancing biodiesel productivity of Chlorella vulgaris under nitrogen deficiency. Bioresour. Technol. 2013, 134, 341–346. [Google Scholar] [CrossRef]
  12. Rani, S.; Chowdhury, R.; Tao, W.; Srinivasan, A. Tertiary treatment of municipal wastewater using isolated algal strains: Treatment efficiency and value-added products recovery. Chem. Ecol. 2019, 36, 48–65. [Google Scholar] [CrossRef]
  13. Carney, L.T.; Reinsch, S.S.; Lane, P.D.; Solberg, O.D.; Jansen, L.S.; Williams, K.P.; Trent, J.D.; Lane, T.W. Microbiome analysis of a microalgal mass culture growing in municipal wastewater in a prototype OMEGA photobioreactor. Algal Res. 2014, 4, 52–61. [Google Scholar] [CrossRef]
  14. Okonechnikov, K.; Golosova, O.; Fursov, M.; Ugene Team. Unipro UGENE: A unified bioinformatics toolkit Konstantin Okonechnikov. Bioinformatics 2012, 28, 1166–1167. [Google Scholar] [CrossRef] [PubMed] [Green Version]
  15. Federation, Water Environmental, and American Public Health Association. Standard Methods for the Examination of Water and Wastewater; American Public Health Association (APHA): Washington, DC, USA, 2005. [Google Scholar]
  16. Montgomery, D.C.; Elizabeth, A.P.; Vining, G.G. Introduction to Linear Regression Analysis; John Wiley & Sons.: Hoboken, NJ, USA, 2012; p. 821. [Google Scholar]
  17. Feng, D.; Chen, Z.; Xue, S.; Zhang, W. Increased lipid production of the marine oleaginous microalgae Isochrysis zhangjiangensis (Chrysophyta) by nitrogen supplement. Bioresour. Technol. 2011, 102, 6710–6716. [Google Scholar] [CrossRef]
  18. Blair, M.F.; Kokabian, B.; Gude, V.G. Light and growth medium effect on Chlorella vulgaris biomass production. J. Environ. Chem. Eng. 2014, 2, 665–674. [Google Scholar] [CrossRef]
  19. De Alva, M.S.; Pabello, V.M.L.; Ledesma, M.T.O.; Gómez, M.J.C. Carbon, nitrogen, and phosphorus removal, and lipid production by three saline microalgae grown in synthetic wastewater irradiated with different photon fluxes. Algal Res. 2018, 34, 97–103. [Google Scholar] [CrossRef]
  20. Killam, A.; Myers, J. A special effect of light on the growth of Chlorella vulgaris. Am. J. Bot. 1956, 43, 569–572. [Google Scholar] [CrossRef]
  21. Shin, Y.S.; Choi, H.I.; Choi, J.W.; Lee, J.S.; Sung, Y.J.; Sim, S.J. Multilateral approach on enhancing economic viability of lipid production from microalgae: A review. Bioresour. Technol. 2018, 258, 335–344. [Google Scholar] [CrossRef]
  22. Liu, Z.-Y.; Wang, G.-C.; Zhou, B.-C. Effect of iron on growth and lipid accumulation in Chlorella vulgaris. Bioresour. Technol. 2008, 99, 4717–4722. [Google Scholar] [CrossRef]
  23. Singh, P.; Kumari, S.; Guldhe, A.; Misra, R.; Rawat, I.; Bux, F. Trends and novel strategies for enhancing lipid accumulation and quality in microalgae. Renew. Sustain. Energy Rev. 2016, 55, 1–16. [Google Scholar] [CrossRef]
  24. Dong, X.; Huang, L.; Li, T.; Xu, J.W.; Zhao, P.; Yu, X. The enhanced biomass and lipid accumulation in algae with an inte-grated treatment strategy by waste molasses and Mg2+ addition. Energy Sources Part A Recovery Util. Environ. Eff. 2020, 42, 1183–1192. [Google Scholar] [CrossRef]
  25. Wan, M.; Jin, X.; Xia, J.; Rosenberg, J.N.; Yu, G.; Nie, Z.; Oyler, G.A.; Betenbaugh, M.J. The effect of iron on growth, lipid accumulation, and gene expression profile of the freshwater microalga Chlorella sorokiniana. Appl. Microbiol. Biotechnol. 2014, 98, 9473–9481. [Google Scholar] [CrossRef]
  26. Sun, S.; Chen, W.; Tang, J.; Wang, B.; Cao, X.; Sun, S.; Sun, R.C. Synergetic effect of dilute acid and alkali treatments on frac-tional application of rice straw. Biotechnol. Biofuels 2016, 9, 217. [Google Scholar] [CrossRef] [Green Version]
  27. Song, M.; Pei, H. The growth and lipid accumulation of Scenedesmus quadricauda during batch mixo-trophic/heterotrophic cultivation using xylose as a carbon source. Bioresour. Technol. 2018, 263, 525–531. [Google Scholar] [CrossRef]
  28. Lin, T.S.; Wu, J.Y. Effect of carbon sources on growth and lipid accumulation of newly isolated microalgae cultured un-der mixotrophic condition. Bioresour. Technol. 2015, 184, 100–107. [Google Scholar] [CrossRef]
  29. Huang, Y.; Luo, L.; Xu, K.; Wang, X.C. Characteristics of external carbon uptake by microalgae growth and associated effects on algal biomass composition. Bioresour. Technol. 2019, 292, 121887. [Google Scholar] [CrossRef]
  30. Gao, F.; Yang, H.-L.; Li, C.; Peng, Y.-Y.; Lu, M.-M.; Jin, W.-H.; Bao, J.-J.; Guo, Y.-M. Effect of organic carbon to nitrogen ratio in wastewater on growth, nutrient uptake and lipid accumulation of a mixotrophic microalgae Chlorella sp. Bioresour. Technol. 2019, 282, 118–124. [Google Scholar] [CrossRef] [PubMed]
  31. Li, X.; Li, W.; Zhai, J.; Wei, H. Effect of nitrogen limitation on biochemical composition and photosynthetic performance for fed-batch mixotrophic cultivation of microalga Spirulina platensis. Bioresour. Technol. 2018, 263, 555–561. [Google Scholar] [CrossRef] [PubMed]
  32. Fazal, T.; Mushtaq, A.; Rehman, F.; Khan, A.U.; Rashid, N.; Farooq, W.; Rehman, M.S.U.; Xu, J. Bioremediation of textile wastewater and successive biodiesel production using microalgae. Renew. Sustain. Energy Rev. 2018, 82, 3107–3126. [Google Scholar] [CrossRef]
  33. Safi, C.; Zebib, B.; Merah, O.; Pontalier, P.-Y.; Vaca-Garcia, C. Morphology, composition, production, processing and applications of Chlorella vulgaris: A review. Renew. Sustain. Energy Rev. 2014, 35, 265–278. [Google Scholar] [CrossRef] [Green Version]
  34. Zhao, X.-C.; Tan, X.-B.; Yang, L.-B.; Liao, J.-Y.; Li, X.-Y. Cultivation of Chlorella pyrenoidosa in anaerobic wastewater: The coupled effects of ammonium, temperature and pH conditions on lipids compositions. Bioresour. Technol. 2019, 284, 90–97. [Google Scholar] [CrossRef] [PubMed]
  35. Chai, S.; Shi, J.; Huang, T.; Guo, Y.; Wei, J.; Guo, M.; Li, L.; Dou, S.; Liu, L.; Liu, G. Characterisation of Chlorella sorokiniana growth properties in monosaccharide-supplemented batch culture. PLoS ONE 2018, 13, e0199873. [Google Scholar] [CrossRef] [PubMed] [Green Version]
  36. Maurya, R.; Paliwal, C.; Chokshi, K.; Pancha, I.; Ghosh, T.; Satpati, G.G.; Pal, R.; Ghosh, A.; Mishra, S. Hydrolysate of lipid ex-tracted microalgal biomass residue: An algal growth promoter and enhancer. Bioresour. Technol. 2016, 207, 197–204. [Google Scholar] [CrossRef]
  37. Li, Y.; Yuan, Z.; Mu, J.; Chen, D.; Feng, B. Proteomic analysis of lipid accumulation in Chlorella protothecoides cells by het-erotrophic N deprivation coupling cultivation. Energy Fuels 2013, 27, 4031–4040. [Google Scholar] [CrossRef]
  38. Shriwastav, A.; Bose, P. Algal growth in photo-bioreactors: Impact of illumination strategy and nutrient availability. Ecol. Eng. 2015, 77, 202–215. [Google Scholar] [CrossRef]
  39. Ren, L.; Wang, P.; Wang, C.; Chen, J.; Hou, J.; Qian, J. Algal growth and utilisation of phosphorus studied by combined mono-culture and co-culture experiments. Environ. Pollut. 2017, 220, 274–285. [Google Scholar] [CrossRef]
  40. Gu, H.; Nagle, N.; Pienkos, P.T.; Posewitz, M.C. Nitrogen recycling from fuel-extracted algal biomass: Residuals as the sole nitrogen source for culturing Scenedesmus acutus. Bioresour. Technol. 2015, 184, 153–160. [Google Scholar] [CrossRef] [Green Version]
  41. Wahal, S.; Viamajala, S. Maximizing Algal Growth in Batch Reactors Using Sequential Change in Light Intensity. Appl. Biochem. Biotechnol. 2010, 161, 511–522. [Google Scholar] [CrossRef] [PubMed]
  42. Pegallapati, A.K.; Nirmalakhandan, N. Internally illuminated photobioreactor for algal cultivation under carbon diox-ide-supplementation: Performance evaluation. Renew. Energy 2013, 56, 129–135. [Google Scholar] [CrossRef]
  43. Wang, H.; Xiong, H.; Hui, Z.; Zeng, X. Mixotrophic cultivation of Chlorella pyrenoidosa with diluted primary piggery wastewater to produce lipids. Bioresour. Technol. 2012, 104, 215–220. [Google Scholar] [CrossRef]
  44. Pleissner, D.; Lau, K.Y.; Lin, C.S.K. Utilisation of food waste in continuous flow cultures of the heterotrophic microalga Chlorella pyrenoidosa for saturated and unsaturated fatty acids production. J. Clean. Prod. 2017, 142, 1417–1424. [Google Scholar] [CrossRef]
  45. Rai, M.P.; Nigam, S.; Sharma, R. Response of growth and fatty acid compositions of Chlorella pyrenoidosa under mixotrophic cultivation with acetate and glycerol for bioenergy application. Biomass Bioenergy 2013, 58, 251–257. [Google Scholar] [CrossRef]
  46. Liu, T.; Li, Y.; Liu, F.; Wang, C. The enhanced lipid accumulation in oleaginous microalga by the potential continuous nitro-gen-limitation (CNL) strategy. Bioresour. Technol. 2016, 203, 150–159. [Google Scholar] [CrossRef] [PubMed]
  47. Procházková, G.; Brányiková, I.; Zachleder, V.; Brányik, T. Effect of nutrient supply status on biomass composition of eukar-yotic green microalgae. J. Appl. Phycol. 2014, 26, 1359–1377. [Google Scholar] [CrossRef]
  48. Beuckels, A.; Smolders, E.; Muylaert, K. Nitrogen availability influences phosphorus removal in microalgae-based wastewater treatment. Water Res. 2015, 77, 98–106. [Google Scholar] [CrossRef]
  49. Aravantinou, A.F.; Manariotis, J.D. Effect of operating conditions on Chlorococcum sp. growth and lipid production. J. Environ. Chem. Eng. 2016, 4, 1217–1223. [Google Scholar] [CrossRef]
  50. Li, Y.-R.; Tsai, W.-T.; Hsu, Y.-C.; Xie, M.-Z.; Chen, J.-J. Comparison of Autotrophic and Mixotrophic Cultivation of Green Microalgal for Biodiesel Production. Energy Procedia 2014, 52, 371–376. [Google Scholar] [CrossRef] [Green Version]
  51. Lowrey, J.; Brooks, M.S.; McGinn, P.J. Heterotrophic and mixotrophic cultivation of microalgae for biodiesel production in agricultural wastewaters and associated challenges—A critical review. Environ. Boil. Fishes 2015, 27, 1485–1498. [Google Scholar] [CrossRef]
  52. Zhan, J.; Rong, J.; Wang, Q. Mixotrophic cultivation, a preferable microalgae cultivation mode for biomass/bioenergy pro-duction, and bioremediation, advances and prospect. Int. J. Hydrogen Energy 2017, 42, 8505–8517. [Google Scholar] [CrossRef]
  53. Paranjape, K.; Leite, G.B.; Hallenbeck, P.C. Strain variation in microalgal lipid production during mixotrophic growth with glycerol. Bioresour. Technol. 2016, 204, 80–88. [Google Scholar] [CrossRef] [Green Version]
  54. Ribeiro, D.M.; Zanetti, G.T.; Julião, M.H.M.; Masetto, T.E.; Gelinski, J.M.L.; Fonseca, G.G. Effect of different culture media on growth of Chlorella sorokiniana and the influence of microalgal effluents on the germination of lettuce seeds. J. Appl. Biol. Biotechnol. 2019, 7, 006–010. [Google Scholar]
  55. Derner, R.B.; Ohse, S.; Villela, M.; Carvalho, S.M.; Fett, R. Microalgae, products and applications. Ciência Rural 2006, 36, 1959–1967. [Google Scholar] [CrossRef]
  56. Woodworth, B.D.; Mead, R.L.; Nichols, C.N.; Kolling, D.R. Photosynthetic light reactions increase total lipid accumulation in carbon-supplemented batch cultures of Chlorella vulgaris. Bioresour. Technol. 2015, 179, 159–164. [Google Scholar] [CrossRef] [PubMed]
  57. Li, Y.; Xu, H.; Han, F.; Mu, J.; Chen, D.; Feng, B.; Zeng, H. Regulation of lipid metabolism in the green microalga Chlorella protothecoides by heterotrophy–photoinduction cultivation regime. Bioresour. Technol. 2015, 192, 781–791. [Google Scholar] [CrossRef] [PubMed]
  58. Hawkins, L.R. Utilisation of xylose for growth by the eukaryotic alga, Chlorella. Curr. Microbiol. 1999, 38, 360–363. [Google Scholar] [CrossRef]
  59. Chen, B.; Wan, C.; Mehmood, M.A.; Chang, J.; Bai, F.; Zhao, X. Manipulating environmental stresses and stress toler-ance of microalgae for enhanced production of lipids and value-added products—A review. Bioresour. Technol. 2017, 244, 1198–1206. [Google Scholar] [CrossRef]
  60. Roleda, M.Y.; Slocombe, S.P.; Leakey, R.J.; Day, J.G.; Bell, E.M.; Stanley, M.S. Effects of temperature and nutrient regimes on biomass and lipid production by six oleaginous microalgae in batch culture employing a two-phase cultivation strategy. Bioresour. Technol. 2013, 129, 439–449. [Google Scholar] [CrossRef] [PubMed]
  61. Yoon, S.Y.; Hong, M.E.; Chang, W.S.; Sim, S.J. Enhanced biodiesel production in Neochloris oleoabundans by a semi-continuous process in two stage photobioreactors. Bioprocess. Biosyst. Eng. 2015, 38, 1415–1421. [Google Scholar] [CrossRef] [PubMed]
  62. Shi, M.; Wei, H.; Chen, Q.; Wang, X.; Zhou, W.; Liu, J. Exploring an isolate of the oleaginous alga Micractinium inermum for lipid production: Molecular characterisation and physiochemical analysis under multiple growth conditions. J. Appl. Phycol. 2019, 31, 1035–1046. [Google Scholar] [CrossRef]
  63. Heredia-Arroyo, T.; Wei, W.; Ruan, R.; Hu, B. Mixotrophic cultivation of Chlorella vulgaris and its potential application for the oil accumulation from non-sugar materials. Biomass Bioenergy 2011, 35, 2245–2253. [Google Scholar] [CrossRef]
  64. Gladue, R.M.; Maxey, J.E. Microalgal feeds for aquaculture. Environ. Boil. Fishes 1994, 6, 131–141. [Google Scholar] [CrossRef]
  65. Sajjadi, B.; Chen, W.-Y.; Raman, A.A.A.; Ibrahim, S. Microalgae lipid and biomass for biofuel production: A comprehensive review on lipid enhancement strategies and their effects on fatty acid composition. Renew. Sustain. Energy Rev. 2018, 97, 200–232. [Google Scholar] [CrossRef]
  66. Valdez-Ojeda, R.A.; Serrano-Vázquez, M.G.D.R.; Toledano-Thompson, T.; Chavarría-Hernández, J.C.; Barahona-Pérez, L.F. Effect of Media Composition and Culture Time on the Lipid Profile of the Green Microalga Coelastrum sp. and Its Suitability for Biofuel Production. BioEnergy Res. 2021, 14, 241–253. [Google Scholar] [CrossRef]
  67. Griffiths, J.M.; Hille, R.P.V.; Harrison, S.T.L. Lipid productivity, settling potential and fatty acid profile of 11 microalgal species grown under nitrogen replete and limited conditions. J. Appl. Phycol. 2012, 24, 989–1001. [Google Scholar] [CrossRef]
  68. Li, T.; Wang, W.; Yuan, C.; Zhang, Y.; Xu, J.; Zheng, H.; Xiang, W.; Li, A. Linking lipid accumulation and photosynthetic efficiency in Nannochloropsis sp. under nutrient limitation and replenishment. Environ. Boil. Fishes 2020, 32, 1619–1630. [Google Scholar] [CrossRef]
  69. Li, Y.; Horsman, M.; Wang, B.; Wu, N.; Lan, C.Q. Effects of nitrogen sources on cell growth and lipid accumulation of green alga Neochloris oleoabundans. Appl. Microbiol. Biotechnol. 2008, 81, 629–636. [Google Scholar] [CrossRef]
  70. Chu, W.L. Strategies to enhance production of microalgal biomass and lipids for biofuel feedstock. Eur. J. Phycol. 2017, 52, 419–437. [Google Scholar] [CrossRef]
  71. Liu, A.-Y.; Chen, W.; Zheng, L.-L.; Song, L.-R. Identification of high-lipid producers for biodiesel production from forty-three green algal isolates in China. Prog. Nat. Sci. 2011, 21, 269–276. [Google Scholar] [CrossRef] [Green Version]
  72. Lohman, E.J.; Gardner, R.D.; Pedersen, T.; Peyton, B.M.; Cooksey, K.E.; Gerlach, R. Optimised inorganic carbon regime for enhanced growth and lipid accumulation in Chlorella vulgaris. Biotechnol. Biofuels 2015, 8, 82. [Google Scholar] [CrossRef] [Green Version]
  73. Deng, X.; Chen, B.; Xue, C.; Li, D.; Hu, X.; Gao, K. Biomass production and biochemical profiles of a freshwater microalga Chlorella kessleri in mixotrophic culture: Effects of light intensity and photoperiodicity. Bioresour. Technol. 2019, 273, 358–367. [Google Scholar] [CrossRef]
  74. Dong, L.; Li, D.; Li, C. Characteristics of lipid biosynthesis of Chlorella pyrenoidosa under stress conditions. Bioprocess. Biosyst. Eng. 2020, 43, 877–884. [Google Scholar] [CrossRef]
  75. Tran, H.L.; Kwon, J.S.; Kim, Z.H.; Oh, Y.; Lee, C.G. Statistical optimisation of cluture media for growth and lipid production of Botryococcus braunii LB 572. Biotechnol. Bioprocess. Eng. 2010, 15, 277–284. [Google Scholar] [CrossRef]
  76. Griffiths, M.J.; Harrison, S.T.L. Lipid productivity as a key characteristic for choosing algal species for biodiesel production. Environ. Boil. Fishes 2009, 21, 493–507. [Google Scholar] [CrossRef]
  77. Stephenson, P.G.; Moore, C.M.; Terry, M.J.; Zubkov, M.V.; Bibby, T.S. Improving photosynthesis for algal biofuels: Toward a green revolution. Trends Biotechnol. 2011, 29, 615–623. [Google Scholar] [CrossRef]
  78. Fu, L.; Cui, X.; Li, Y.; Xu, L.; Zhang, C.; Xiong, R.; Zhou, D.; Crittenden, J.C. Excessive phosphorus enhances Chlorella reg-ularis lipid production under nitrogen starvation stress during glucose heterotrophic cultivation. Chem. Eng. J. 2017, 330, 566–572. [Google Scholar] [CrossRef]
  79. Zhu, S.; Wang, Y.; Xu, J.; Shang, C.; Wang, Z.; Xu, J.; Yuan, Z. Luxury uptake of phosphorus changes the accumulation of starch and lipid in Chlorella sp. under nitrogen depletion. Bioresour. Technol. 2015, 198, 165–171. [Google Scholar] [CrossRef]
  80. Singh, P.; Guldhe, A.; Kumari, S.; Rawat, I.; Bux, F. Investigation of combined effect of nitrogen, phosphorus and iron on lipid productivity of microalgae Ankistrodesmus falcatus KJ671624 using response surface methodology. Biochem. Eng. J. 2015, 94, 22–29. [Google Scholar] [CrossRef]
  81. Bodner, G.M. The Tricarboxylic Acid (TCA), Citric Acid or Krebs Cycle. J. Chem. Educ. 1986, 63, 673–677. [Google Scholar] [CrossRef]
Figure 1. Comparison of biomass productivity of different algal species [9,24,29,34,35,36,37,38,39,40,41,42,43,44,45] with the present study (dashed line represents the average value).
Energies 14 01411 g001
Figure 2. Lipid productivity of various species reported in the literature [24,62,65,66,67,68,69,70,71,72,73,74,75,76]. Two data bars (blue and orange) show the lowest and highest productivity of a particular species as given in that reference. The horizontal black line shows the average lipid productivity.
Energies 14 01411 g002
Figure 3. FAME composition of Chlorella sorokiniana isolated from BG-11 and Knop’s media (at pH-9) cultured in nutrient amended media.
Energies 14 01411 g003
Figure 4. Pathway involved in the present study for lipid formation.
Energies 14 01411 g004
Table 1. Different parameters used in Phase 1. (24 h:0 h light–dark cycle, nitrate: N = 75 mg/L, phosphate: P = 15 mg/L, 140 rpm, initial biomass concentration: 400 mg/L, temperature: 25 °C, Light source: fluorescent tube lights).
S. No.Medium Supplement (mg/L)Light Intensity (µmol/s/m2)
1.Only Glucose (50)140
2.Only Glucose (100) 140
3.Only Glucose (50)221
4.Inorganic-C source (75/day) + Glucose (50)221
5.Only Inorganic-C source (75/day)221
6.Inorganic-C (75/day) + Glucose (50) + FeCl3 (10)221
Table 2. Different medium supplements and their concentrations used in Phase 2. (12 h:12 h light–dark cycle, nitrate: N = 75 mg/L, phosphate: P = 15 mg/L, light intensity = 221 µmol/s/m2, 140 rpm, initial biomass concentration: 400 mg/L, temperature: 25 °C, light source: fluorescent tube lights).
S. No.Medium Supplement (mg/L)
1.Only Glucose (5/day)
2.Only Xylose (5/day)
3.Glucose (5/day) + Inorganic-C (75/day)
4.Xylose (5/day) + Inorganic-C (75/day)
5.Only Inorganic-C source (75/day)
Table 3. Change in cell density of (a) Chlorella sorokiniana 1 (isolated from BG-11 at pH-9); (b) Chlorella sorokiniana 2 (isolated from Knop’s medium at pH-9), grown in synthetic hydrolysate under different light intensities and carbon sources.
S. No.Medium Supplement (mg/L)Light Intensity (µmol/s/m2)Biomass Productivity (mg/L/Day)
(a)
1.Only Glucose (50)14031.49 ± 0.03
2.Only Glucose (100)14039.81 ± 0.03
3.Only Glucose (50)22156.77 ± 0.02
4.NaHCO3 (75/day) + Glucose (50)221153.46 ± 0.04
5.Only NaHCO3 (75/day)22143.55 ± 0.03
6.NaHCO3 (75/day) + Glucose (50) + FeCl3 (10)22124.13 ± 0.01
(b)
1.Only Glucose (50)140106.26 ± 0.01
2.Only Glucose (100) 140160.31 ± 0.03
3.Only Glucose (50)221163.57 ± 0.01
4.Na2CO3 (75/day) + Glucose (50)221170.14 ± 0.01
5.Only Na2CO3 (75/day)22190.65 ± 0.04
6.Na2CO3 (75/day) + Glucose (50) + FeCl3 (10)22174.72 ± 0.01
Table 4. Change in cell density of (a) Chlorella sorokiniana 1 (isolated from BG-11 medium pH-9); (b) Chlorella sorokiniana 2 (isolated from Knop’s medium pH-9), when grown in synthetic hydrolysate supplemented with different monosaccharides under 12 h:12 h light–dark cycle (light intensity: 221 µmol/s/m2).
S. No.Medium Supplement (mg/L)Biomass Productivity (mg/L/Day)
(a)
1.Glucose (5/day) + NaHCO3 (75/day)38.36 ± 0.02
2.Xylose (5/day) + NaHCO3 (75/day)13.42 ± 0.05
3.Only NaHCO3 (75/day)27.13 ± 0.01
(b)
1.Only Glucose (10/day)160.28 ± 0.04
2.Only Xylose (10/day) 92.15 ± 0.09
3.Glucose (10/day) + Na2CO3 (75/day)187.08 ± 0.06
4.Xylose (10/day) + Na2CO3 (75/day)134.61 ± 0.03
5.Only Na2CO3 (75/day)150.43 ± 0.02
6.Glucose (200)204.32 ± 0.04
Table 5. Change in cell density of C. sorokiniana isolated from BG-11 and Knop’s media (pH-9) grown in synthetic hydrolysate growth medium with supplementation of N and P to accumulate a large amount of lipid.
S. No.Growth MediaBiomass Productivity (mg/L/day)
C. sorokiniana 1C. sorokiniana 2
1.Nutrient Sufficient medium73.08 ± 0.02267.11 ± 0.03
2.N-medium58.52 ± 0.0194.37 ± 0.02
3.P-medium82.97 ± 0.01178.12 ± 0.03
Table 6. FAME composition of Chlorella sorokiniana 1 (isolated from BG-11 at pH-9) cultured in nutrient amended media. (3, 5, and 7 denote the culture time in days, and N and P represent the N-amended medium and P-amended media, respectively).
FAME Component (%)0-Day3-N3-P5-N5-P7-N7-P
C16:03.062 ± 0.0054.822 ± 0.0043.990 ± 0.0016.738 ± 0.0083.325 ± 0.0052.682 ± 0.0012.019 ± 0.004
C18:12.7 ± 0.32.9 ± 0.10.7 ± 0.32.5 ± 0.11.0 ± 0.22.9 ± 0.20.4 ± 0.1
C18:22.3 ± 0.11.2 ± 0.23.5 ± 0.25.0 ± 0.23.1 ± 0.23.3 ± 0.31.23 ± 0.09
C18:00.42 ± 0.042.2 ± 0.21.1 ± 0.12.11 ± 0.040.66 ± 0.090.31 ± 0.040.32 ± 0.03
C20:000.45 ± 0.040.59 ± 0.030.9 ± 0.10.183 ± 0.0060.144 ± 0.0061.0 ± 0.2
Total8.7 ± 0.511.6 ± 0.59.9 ± 0.717.2 ± 0.48.3 ± 0.59.3 ± 0.65.0 ± 0.4
Table 7. Fatty acid methyl ester (FAME) composition of Chlorella sorokiniana 2 isolated from Knop’s medium, pH-9 in nutrient-amended media. (3, 5, and 7 denote the culture time in days, and N and P represent the N-amended medium and P-amended medium, respectively).
FAME Component (%)0-Day3-N3-P5-N5-P7-N7-P
C14:00.32 ± 0.031.1 ± 0.81.01 ± 0.090.54 ± 0.051.1 ± 0.20.6 ± 0.20.31 ± 0.01
C16:05.1 ± 0.77.8 ± 0.710 ± 17 ± 18 ± 17.6 ± 0.73.8 ± 0.3
C18:10.78 ± 0.040.057 ± 0.00800.22 ± 0.020.16 ± 0.010.36 ± 0.040.13 ± 0.02
C18:22.3 ± 0.21.0 ± 0.41.1 ± 0.37 ± 141.66 ± 0.091.87 ± 0.081.27 ± 0.02
C18:02.3 ± 0.43.48 ± 0.033.4 ± 0.42.1 ± 0.62.9 ± 0.52.1 ± 0.21.43 ± 0.08
Total10 ± 113 ± 115 ± 217 ± 314 ± 212 ± 16.9 ± 0.4
Table 8. Kinetic coefficients of the interconversion of various fatty acids.
Kinetic Parameters (d−1)C. sorokiniana 2C. sorokiniana 1
N AmendedP AmendedN AmendedP Amended
K10.28 ± 0.02 **0.34 ± 0.04 **NANA
K20.15 ± 0.050.27 ± 0.020.25 ± 0.01 **0.14 ± 0.01 **
K30.7 ± 0.50.5 ± 0.11.0 ± 0.30.9 ± 0.2
K44 × 10−5 ± 1 × 10−5 *7 × 10−6 ± 2 × 10−6 *2.77 × 10−4 ± 5.06 × 10−6 *5.1 × 10−5 ± 0.4 × 10⁻⁵ *
K5NANA0.19 ± 0.050.4 ± 0.1
* (mg-mg−1)2/day ** (mg-mg−1)/day.
Publisher’s Note: MDPI stays neutral with regard to jurisdictional claims in published maps and institutional affiliations.

