1. Introduction
The elbow draft tube is a key component of the reaction hydraulic turbines (e.g., Francis, Kaplan and propeller turbines) with medium and low head. The elbow draft tube includes three main components [
1,
2]: (i) cone, (ii) elbow and (iii) diffuser. The geometry of each elbow draft tube is uniquely selected for each hydropower plant. Therefore, the influence of the elbow draft tube geometry on both efficiency and cavitational performances of the hydraulic turbines were extensively investigated in the twentieth century [
2]. As a result, the elbow draft tube geometries have been changed over time with the implementation of various technical solutions and/or different technological constraints. The main goal of a hydraulic turbine draft tube is to decelerate the flow exiting the runner in order to convert the residual kinetic energy into static pressure [
1]. The residual kinetic energy can reach almost 50% of the entire energy supplied to the turbine [
2]. In addition, it allows to place the turbine above the tail water without losing head [
3,
4,
5] and it reduces the total civil costs of the powerhouse, primarily in excavation and concreting [
6]. The shape and dimensions of the elbow draft tube depend on the turbine type and size [
2,
7]. The shape and geometry of the draft tubes have been changed over time from a cone to an elbow draft tube [
1,
2,
3,
4,
5,
6,
7]. Despite all these changes applied over time to the draft tubes, the most significant hydraulic losses in the reaction hydraulic turbines are still associated with decelerated swirling flows in the elbow draft tube under off-design conditions [
8,
9]. Therefore, numerous investigations have been carried out on the flow in the elbow draft tubes to increase the efficiency of the reaction hydraulic turbines on a wide, operating range [
10,
11,
12,
13,
14,
15,
16].
The elbow draft tubes with sharp heel are quite common in old hydropower plants (HPPs) commissioned in the first five decades of the previous century. This design of the elbow draft tubes was selected due to the reduction of both construction time and investment [
17]. The extensive flow investigations performed by Gubin [
2] on this type of elbow draft tubes revealed an efficiency loss of 0.3–2.3% due to the sharp heel geometry. Particular attention was paid to the flow in the sharp heel draft tube in the Turbine-99 test case [
18,
19,
20,
21,
22]. The numerical flow optimization technique developed and applied by Maarjavara and Lunström [
23] to an existing sharp heel draft tube leads to an optimal elbow shape with rounded geometry. Investigations performed on the hydraulic turbine model and on the prototype of the 50 MW hydropower unit with rounded elbow geometry of the draft tube showed an efficiency improvement higher than 0.5% from part load to full load conditions [
17]. An efficiency improvement around 1–1.5% from part load to full load conditions has been reported by Dahlbäck [
17] rounding the geometry of the draft tube elbow to the 9 MW hydropower unit.
Nowadays, the hydropower sector is the only one able to provide the flexibility required by the grid to integrate power fluctuations provided by other renewable sources (e.g., wind and solar) [
24,
25,
26]. This flexibility is ensured by the hydraulic turbine fleet operating over a wide range of discharge and head values [
27,
28,
29]. However, the operation of reaction of the hydraulic turbines at off-design conditions is accompanied by pressure fluctuations [
29,
30,
31,
32] induced by the hydrodynamic instabilities in the draft tube due to the residual swirling flow delivered downstream by the runner [
33]. The hydrodynamics of the draft tube is complex due to the overlap of a decelerated swirling flow with the change of flow direction. A qualitative model of the decelerated swirling flow in the cone of the draft tube was suggested by Nishi et al. [
34,
35] based on their experimental investigations [
36,
37]. They have suggested that the circumferentially averaged velocity profiles in the cone could be represented by a model comprising a dead (quasi-stagnant) water region surrounded by the swirling main flow. These considerations led to the conclusion that the flow instabilities at part load conditions observed in the draft tube cone is a rolled-up vortex sheet which originates between the central stalled region and the swirling main flow [
38]. These hydrodynamic instabilities lead to severe pressure fluctuations [
39], strong vibrations and noises [
40,
41] which in some cases are accompanied by the power swings [
42] preventing the stable and safe operation of the turbine [
43]. These phenomena may produce failures on the mechanical elements of the machine [
44,
45,
46] diminishing the lifetime of the hydraulic turbines [
47]. Different technical solutions have been proposed to mitigate their effects (e.g., fins [
48,
49,
50], air injection/admission [
51,
52], water injection [
53], air-water injection [
54] and so on [
55]).
The pressure fluctuations found in the draft tube of the hydraulic turbines operated at partial, operating conditions are generally called draft tube surge [
56]. The power swing phenomenon as a consequence of the draft tube surge was first reported by Rheingans in 1940 [
42]. Valuable investigations of the draft tube surge phenomena have been conducted by US Bureau of Reclamation in connection with the design of the Grand Coulee Third HPP [
57,
58,
59,
60]. Two types of pressure fluctuations (asynchronous/rotating and synchronous/plunging components) associated with the draft tube surge were discriminated in the investigations carried out on the draft tube models by Nishi et al. [
35,
61]. The purely rotating component is a local consequence of the precession motion of the swirling flow instabilities (e.g., vortex rope) being trapped in the cone of the draft tubes [
62]. The plunging component is generated in a cross section acting as a pressure excitation source along the whole hydraulic system [
63]. The plunging component is a consequence of the swirling flow interaction with the geometry of the elbow draft tube according to Nishi et al. [
35,
61]. In other words, this component is associated with the response of the hydraulic passage to the excitation source of self-induced flow instabilities [
62,
63].
As a result, the aim of these experimental investigations are to evaluate the influence of the elbow geometry of the draft tube on the unsteady pressure field under different part load conditions. The test rig and experimental setup are presented in
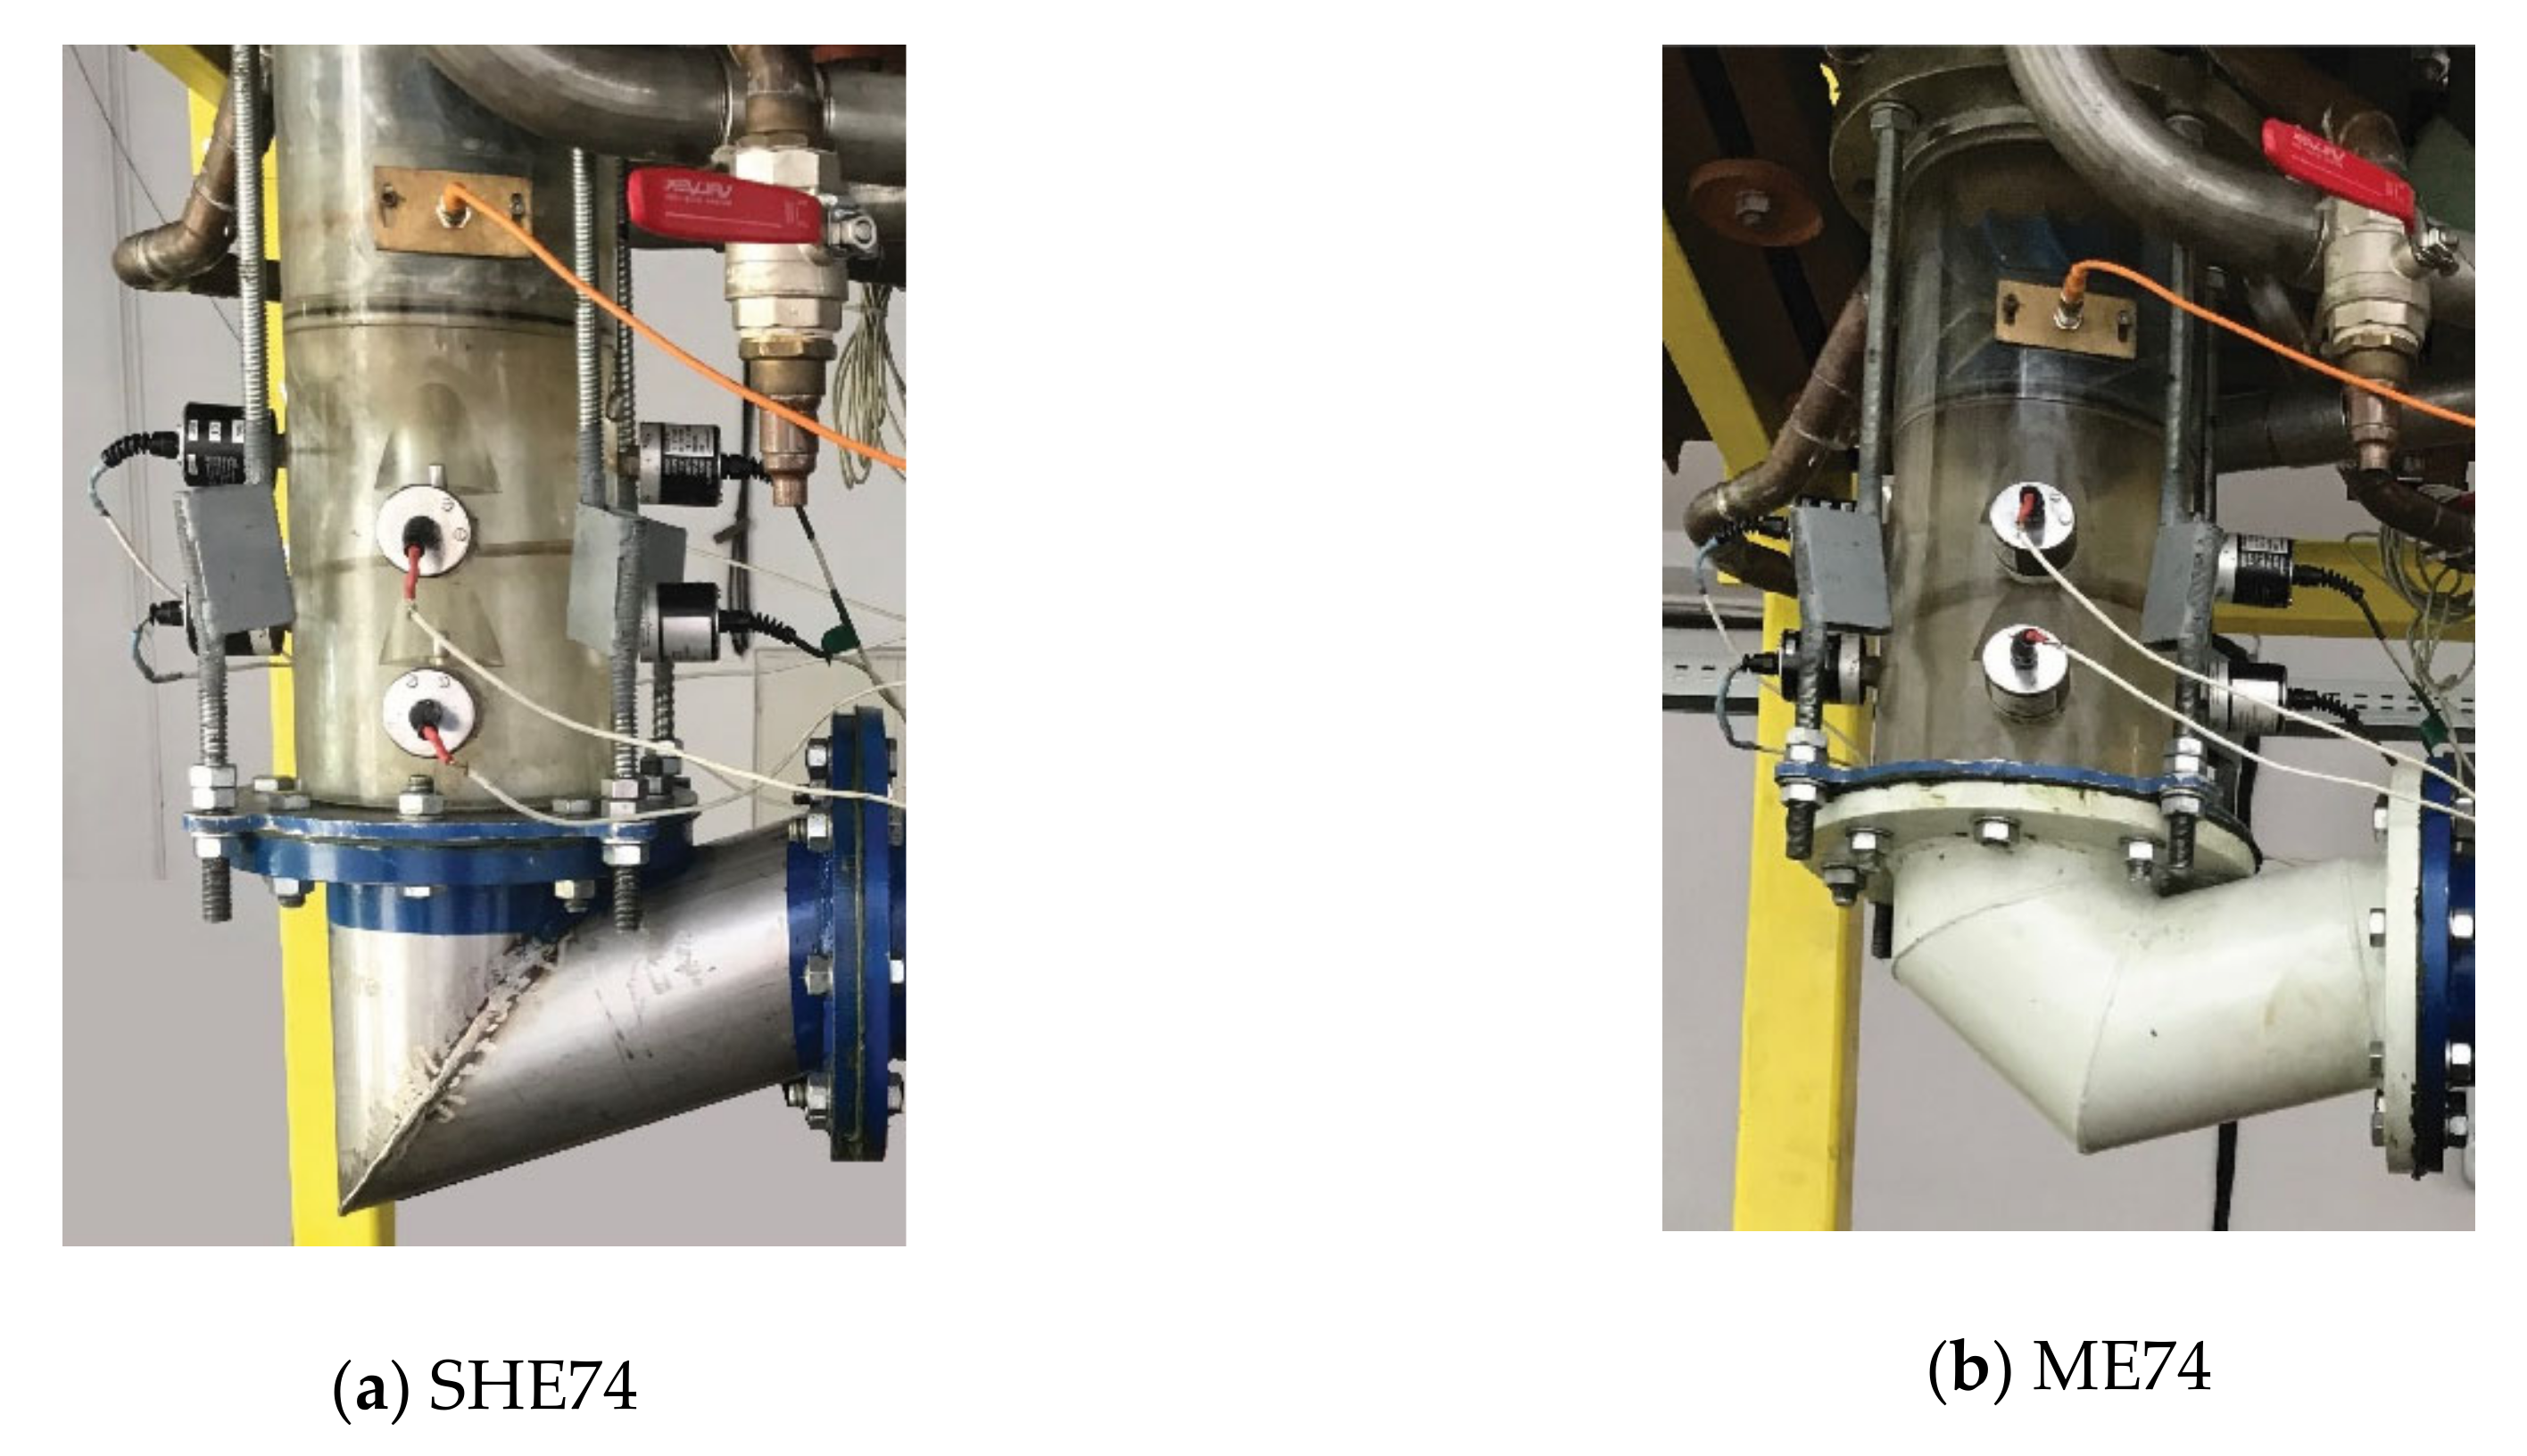
Section 2. In this case, a swirl generator is used instead of a hydraulic turbine runner. Two elbow geometries of a simplified draft tube are designed. A 74° sharp heel draft tube (SHE74) is first investigated, being considered only as a reference. Then a 74° draft tube with modified elbow geometry (ME74) similar to an underground hydropower plant is examined. In
Section 3, several partial load conditions are selected slowing down the rotor speed with a magneto-rheological brake. The experimental data obtained for each elbow geometry of the draft tube are presented in
Section 4. The fundamental frequencies and equivalent amplitudes for both plunging and rotating components are determined against the rotor speed. The Strouhal numbers associated with the fundamental frequencies of both components and the dimensionless equivalent amplitudes of their power spectra under variable partial load conditions for two elbow draft tubes are compared in
Section 5. The conclusions are drawn in last section.
3. Variable Operating Conditions
The influence of two elbow draft tube geometries detailed in the previous section is obtained under variable operating conditions. A magneto-rheological brake (MRB) with a cylindrical configuration has been designed and installed in the rotor hub to slow down its speed [
70,
71]. As a result, variable operating conditions are obtained in this case modifying the apparent viscosity of the magneto-rheological fluid (MRF) under variable magnetic fields generated by the coil of the MRB [
72]. The variable operating conditions are provided by the different speed values of the rotor. A cylindrical magnet is installed on each blade of the rotor and a magnetic sensor was mounted on the test section to measure the rotor speed [
73]. The rotor movement generates a train of pulses (ten of them corresponding to one complete rotation). The pulse train frequency is acquired by using the experimental setup to determine the rotor speed. Seven speed values of the rotor covering the range from 984 rpm to 780 rpm have been selected in our investigations. The uncertainty of the rotor speed increases from 1.4% at 984 rpm to 2.5% at 780 rpm. The standard deviation corresponding to the random uncertainties of the experimental data increases with the reduction of the rotor speed. This effect is the consequence of the behavior of the magneto-rheological fluid under the influence of the magnetic field installed in the braking device [
70,
71].
The dimensionless flux of moment of momentum for the swirling flow delivered by the swirl flow apparatus is plotted versus the discharge coefficient in
Figure 3. The discharge coefficient defined, according to IEC standard [
74], is computed by following equation:
where, Q = 30 l/s is the flow rate, ω [rad/s] is the angular speed of the rotor given in
Table 1 and
Rref = 0.045 m is the tip radius of the rotor. The dimensionless flux of moment of momentum for the swirling flow configuration delivered by the rotor is determined by using the next equation
where
[kg/m
3] is the density of the working fluid and M [kg m
2/s
3] is the dimensional flux of moment of momentum determined, based on our experimental investigations [
72].
One can distinguish in
Figure 3 that the variable operating conditions associated with selected rotor speeds given in
Table 1 correspond to different pairs of (
q,
m) as in Francis turbines operation [
33]. The highest level of the flux of moment of momentum is obtained at the rotor’s runaway speed of 984 rpm when no voltage is applied to the MRB coil. The powerful unsteady flow phenomena are developed in the cone at this operating condition leading to the strongest pressure pulsation. It has been observed in experimental investigations that self-induced flow phenomena diminish as the swirling flux of the moment of momentum is smaller. The weakest unsteady flow phenomena are expected to be reached at the rotor speed of 780 rpm, corresponding to the largest value of the discharge coefficient.
The influence of two draft tube elbow geometries (SHE74 and ME74) on the unsteady pressure field is determined for variable operating conditions in the next section. The Reynolds number around 3.8 × 10⁵ is associated with the operating points investigated in this research. All experimental investigations included in the article are obtained considering single-phase flow.
4. Experimental Data
Usually, two quantities (e.g., fundamental frequency and its associated amplitude) associated with the unsteady flow phenomena are identified in the power spectrum. This approach provides a good assessment of the unsteady pressure field where all other contributions in the power spectrum are negligible. This situation is a particular case that is rarely found in reality. However, this approach is easily applied to a power spectrum with wide range contributions, but it is limited in quantifying other contributions from the spectrum when they exist.
Both fundamental frequency and its associated equivalent amplitude were considered to partially avoid the limitations underlined above [
75]. The equivalent amplitude was used instead of the maximum amplitude value identified in the power spectrum. The equivalent amplitude collected other contributions found in the power spectrum. This method was successfully applied to quantify all contributions induced in the power spectrum by a vortex rope developed in a discharge cone. To be more specific, this method was applied to quantify the contributions induced in the power spectrum by a vortex rope with a dominant frequency.
The method developed by Bosioc et al. [
75] was not designed to take into account two or more significant frequencies identified in the power spectrum. This is the purpose of the methodology developed in this article. As a result, the present methodology extends the capabilities of collecting separately the contributions of different flow phenomena (e.g., self-induced flow instabilities, flow interaction with the elbow and so on) developed in the elbow draft tube. This new capability is an important feature to quantify contributions associated with different flow phenomena identified in the power spectra measured on the wall of the elbow draft tubes. The methodology developed and applied to analyze the influence of the elbow draft tube geometry on the unsteady pressure field has been presented in this article (see
Appendix A). Another methodology that takes into account the RMS value as a measure of the difference between the two flow fields has been developed by Akkermans et al. [
76].
The above methodology is further applied on the experimental data acquired for different operating regimes (e.g., 984, 966, 936, 900, 870, 834, 780 rpm) to identify the influence of the elbow draft tube geometry on the unsteady pressure field.
4.1. Analysis of the Unsteady Pressure Field Induced by 74° Sharp Heel Elbow (SHE74) Draft Tube
Two unsteady pressure signals (e.g.,
S1(
t),
S2(
t)) are acquired with a sampling rate of 256 samples/second during 32 s on the wall at the same level of the test section using the experimental setup shown in
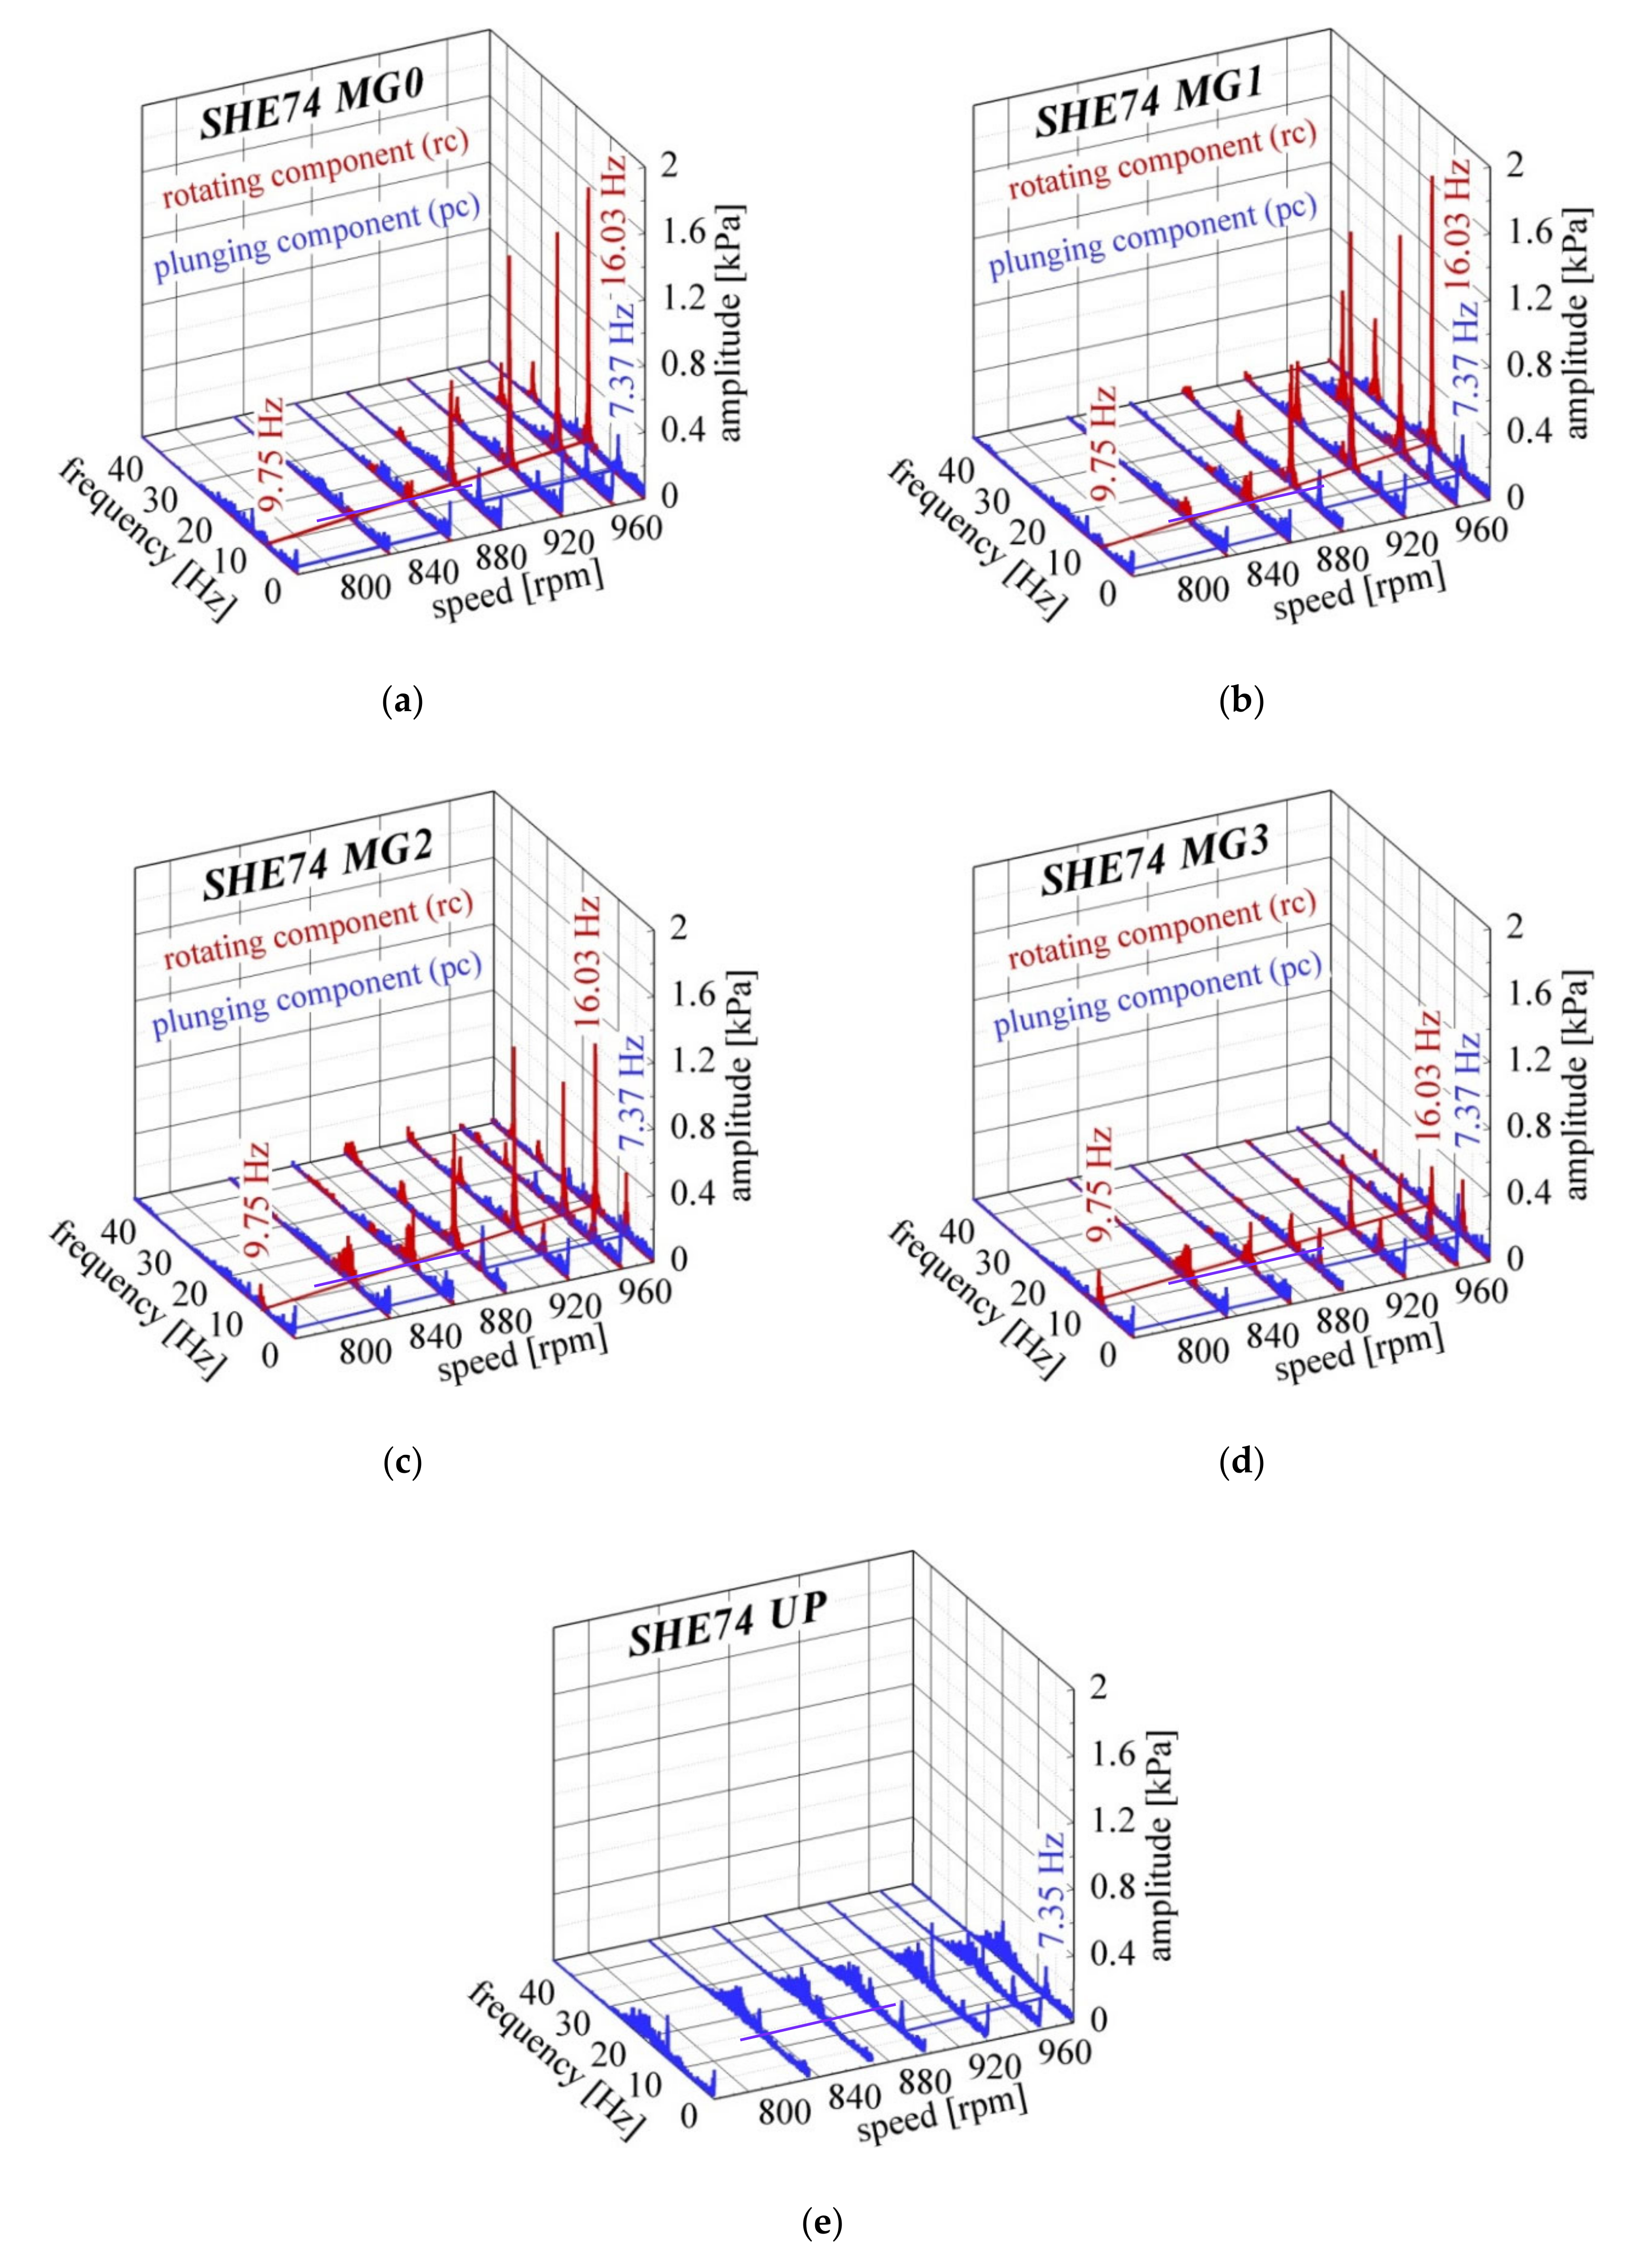
Figure 1. Then, the power spectra of the decomposed unsteady pressure signals measured on four levels located along the cone (e.g., MG0, MG1, MG2, MG3) and UP level with SHE74 draft tube are obtained. The three-dimension waterfall diagrams with decomposed power spectra determined on all levels with SHE74 at different rotor speeds are shown in
Figure 4.
Both plunging (blue) and rotating (red) components are plotted from the runaway speed of 984 rpm to 780 rpm after SHE74 was installed. It must be noted that the fundamental frequencies corresponding to both plunging and rotating components decrease as the rotor speed slows down. The same tendency can be noticed for the amplitudes associated with the fundamental frequencies.
The fundamental frequency of the rotating component (fr) associated with the processing motion of the flow instability is identified around 16 Hz at the runaway speed of 984 rpm, while the amplitude reaches maximum values of 1.58 kPa and 1.65 kPa on the first two levels denoted MG0 (
Figure 4a) and MG1 (
Figure 4b). This means that the vortex structure is closest to the wall in the first part of the cone. The second harmonic of the rotation frequency (2xfr = 32 Hz) can be noticed at all levels. The largest amplitude of 0.44 kPa of the second rotating harmonic is determined at the MG1 level.
The swirling flow interaction with SHE74 geometry leads to draft tube surge phenomena according to Nishi et al. [
61]. This fundamental frequency of 7.37 Hz corresponding to the plunging component is identified at all levels at rotor speed of 984 rpm. The largest amplitudes of 0.405 kPa and 0.359 kPa corresponding to this plunging frequency have been found on MG2 and MG3 levels, respectively. Thus, the maximum amplitudes of the plunging component are obtained in the second part of the cone due to the interaction of the swirling flow with SHE74 geometry. The fundamental frequency of 7.37 Hz corresponding to the plunging component is propagated upstream being found on the UP level. The amplitude of this plunging component is half on the UP level in relation to its value on MG3 level. The flow is only axial without any swirling component on the UP level. Therefore, only the plunging component is available on this level. A broadband plunging component from 15 Hz to 23 Hz with maximum amplitude around 19 Hz can be noticed on this level. This broadband plunging component is induced by the axial flow that crosses the honeycomb section of the second tank arranged upstream to the test section [
77], see
Figure 1. This broadband plunging component is transported downstream by the flow. It is found on all levels of the cone in a distribution with diminished amplitudes.
Both fundamental frequencies of the plunging and rotating components as well as the equivalent amplitude of the power spectra determined on each level using the Equation (A3) are plotted in
Figure 5 in order to quantify their distributions against the rotor speed.
The fundamental frequency of the rotating component associated with the processing motion of the flow instabilities (e.g., vortex rope) developed in the cone decreases monotonically with more than 40% from the runaway speed of 984 rpm to 780 rpm. The fundamental frequency of the plunging component associated with the interaction of the swirling flow with SHE74 geometry shows two regions,
Figure 5a. One region extends from the rotor runaway speed of 984 rpm to 900 rpm, while the second region covers values with lower speed values up to 780 rpm.
The equivalent amplitudes of the power spectra determined on all levels of the test section against the rotor speed are plotted in
Figure 5b. It can be seen that the equivalent amplitudes decrease steeper or slower with the rotor speed on all five levels. The highest value of the equivalent amplitude around 3.5 kPa is determined for the largest rotor speeds. This means that the highest degree of the root mean square (RMS) induced by the flow instabilities to the cone wall corresponds to the rotor speeds of 984 rpm and 966 rpm, respectively. The highest value of the equivalent amplitude is found on MG1 level for the two rotor speeds mentioned above and the next speed value of 936 rpm. High values of equivalent amplitudes are obtained at the neighboring MG0 and MG2 levels supporting the statement that flow instabilities are developed in the first part of the cone for these speeds. The equivalent amplitudes on the last MG3 level of the cone and the UP level are 50% lower than the values on the other levels. The lower degree of RMS at MG3 level suggests that flow instabilities are at a distance from the cone wall and most likely weaker than upstream levels.
The highest value of the equivalent amplitude moves at MG2 level for the next three rotor speed values (e.g., 900, 870 and 834 rpm). This remark indicates that the flow instabilities developed at these rotor speeds are closer to the cone wall in its middle section [
65].
All equivalent amplitudes developed on the levels displayed along the cone are smaller than the value obtained on UP level at the rotor speed of 780 rpm. This case leads to the conclusion that there are no self-induced flow instabilities at this rotor speed.
The equivalent amplitudes for both plunging and rotating components of the decomposed power spectra are determined at each level to understand how the instabilities developed in the swirling flow evolve with rotor speed. The equivalent amplitudes for both plunging and rotating components discriminated from the unsteady pressure field induced by the decelerated swirling flow and its interaction with SHE74 draft tube against rotor speed are shown in
Figure 5c,d. The experimental data fit with a linear function to reveal trends. The statement underlined above is applied to both plunging and rotating components of the decomposed power spectra. The equivalent amplitudes of the plunging components (
Figure 5c) decrease slowly with the rotor speed on all five levels. The highest equivalent amplitudes around 2 kPa have been found on MG2 and MG3 levels for the largest rotor speeds of 984 rpm and 966 rpm, respectively. As a result, the strongest interaction of the swirling flow with the SHE74 geometry corresponds to the largest rotor speeds. We remember that the two cases mentioned above are those in which the flux of moment of momentum reaches the highest values (see
Figure 3). The equivalent amplitudes of the plunging component decrease by to 30% on the cone levels at a rotor speed of 780 rpm. The smallest 15% decrease of the equivalent amplitudes of this component with the rotor speed is identified on the UP level. It is reminded that the UP level is located upstream the test section (see
Figure 1).
The equivalent amplitudes of the rotating component (
Figure 5d) decrease sharply on the first three levels (MG0, MG1 and MG2) of the cone and slowly on the last level (MG3), as the rotor speed slows down. It can be observed that the equivalent amplitudes of the rotating component are significantly higher than the equivalent amplitudes of the plunging components for the largest rotor speeds where the flow instabilities are developed. Therefore, the equivalent amplitudes of the rotating component define the trends for the distribution of the equivalent amplitudes of the full power spectra shown in
Figure 5b.
4.2. Analysis of the Unsteady Pressure Field Induced by 74° Modified Elbow (ME74) Draft Tube
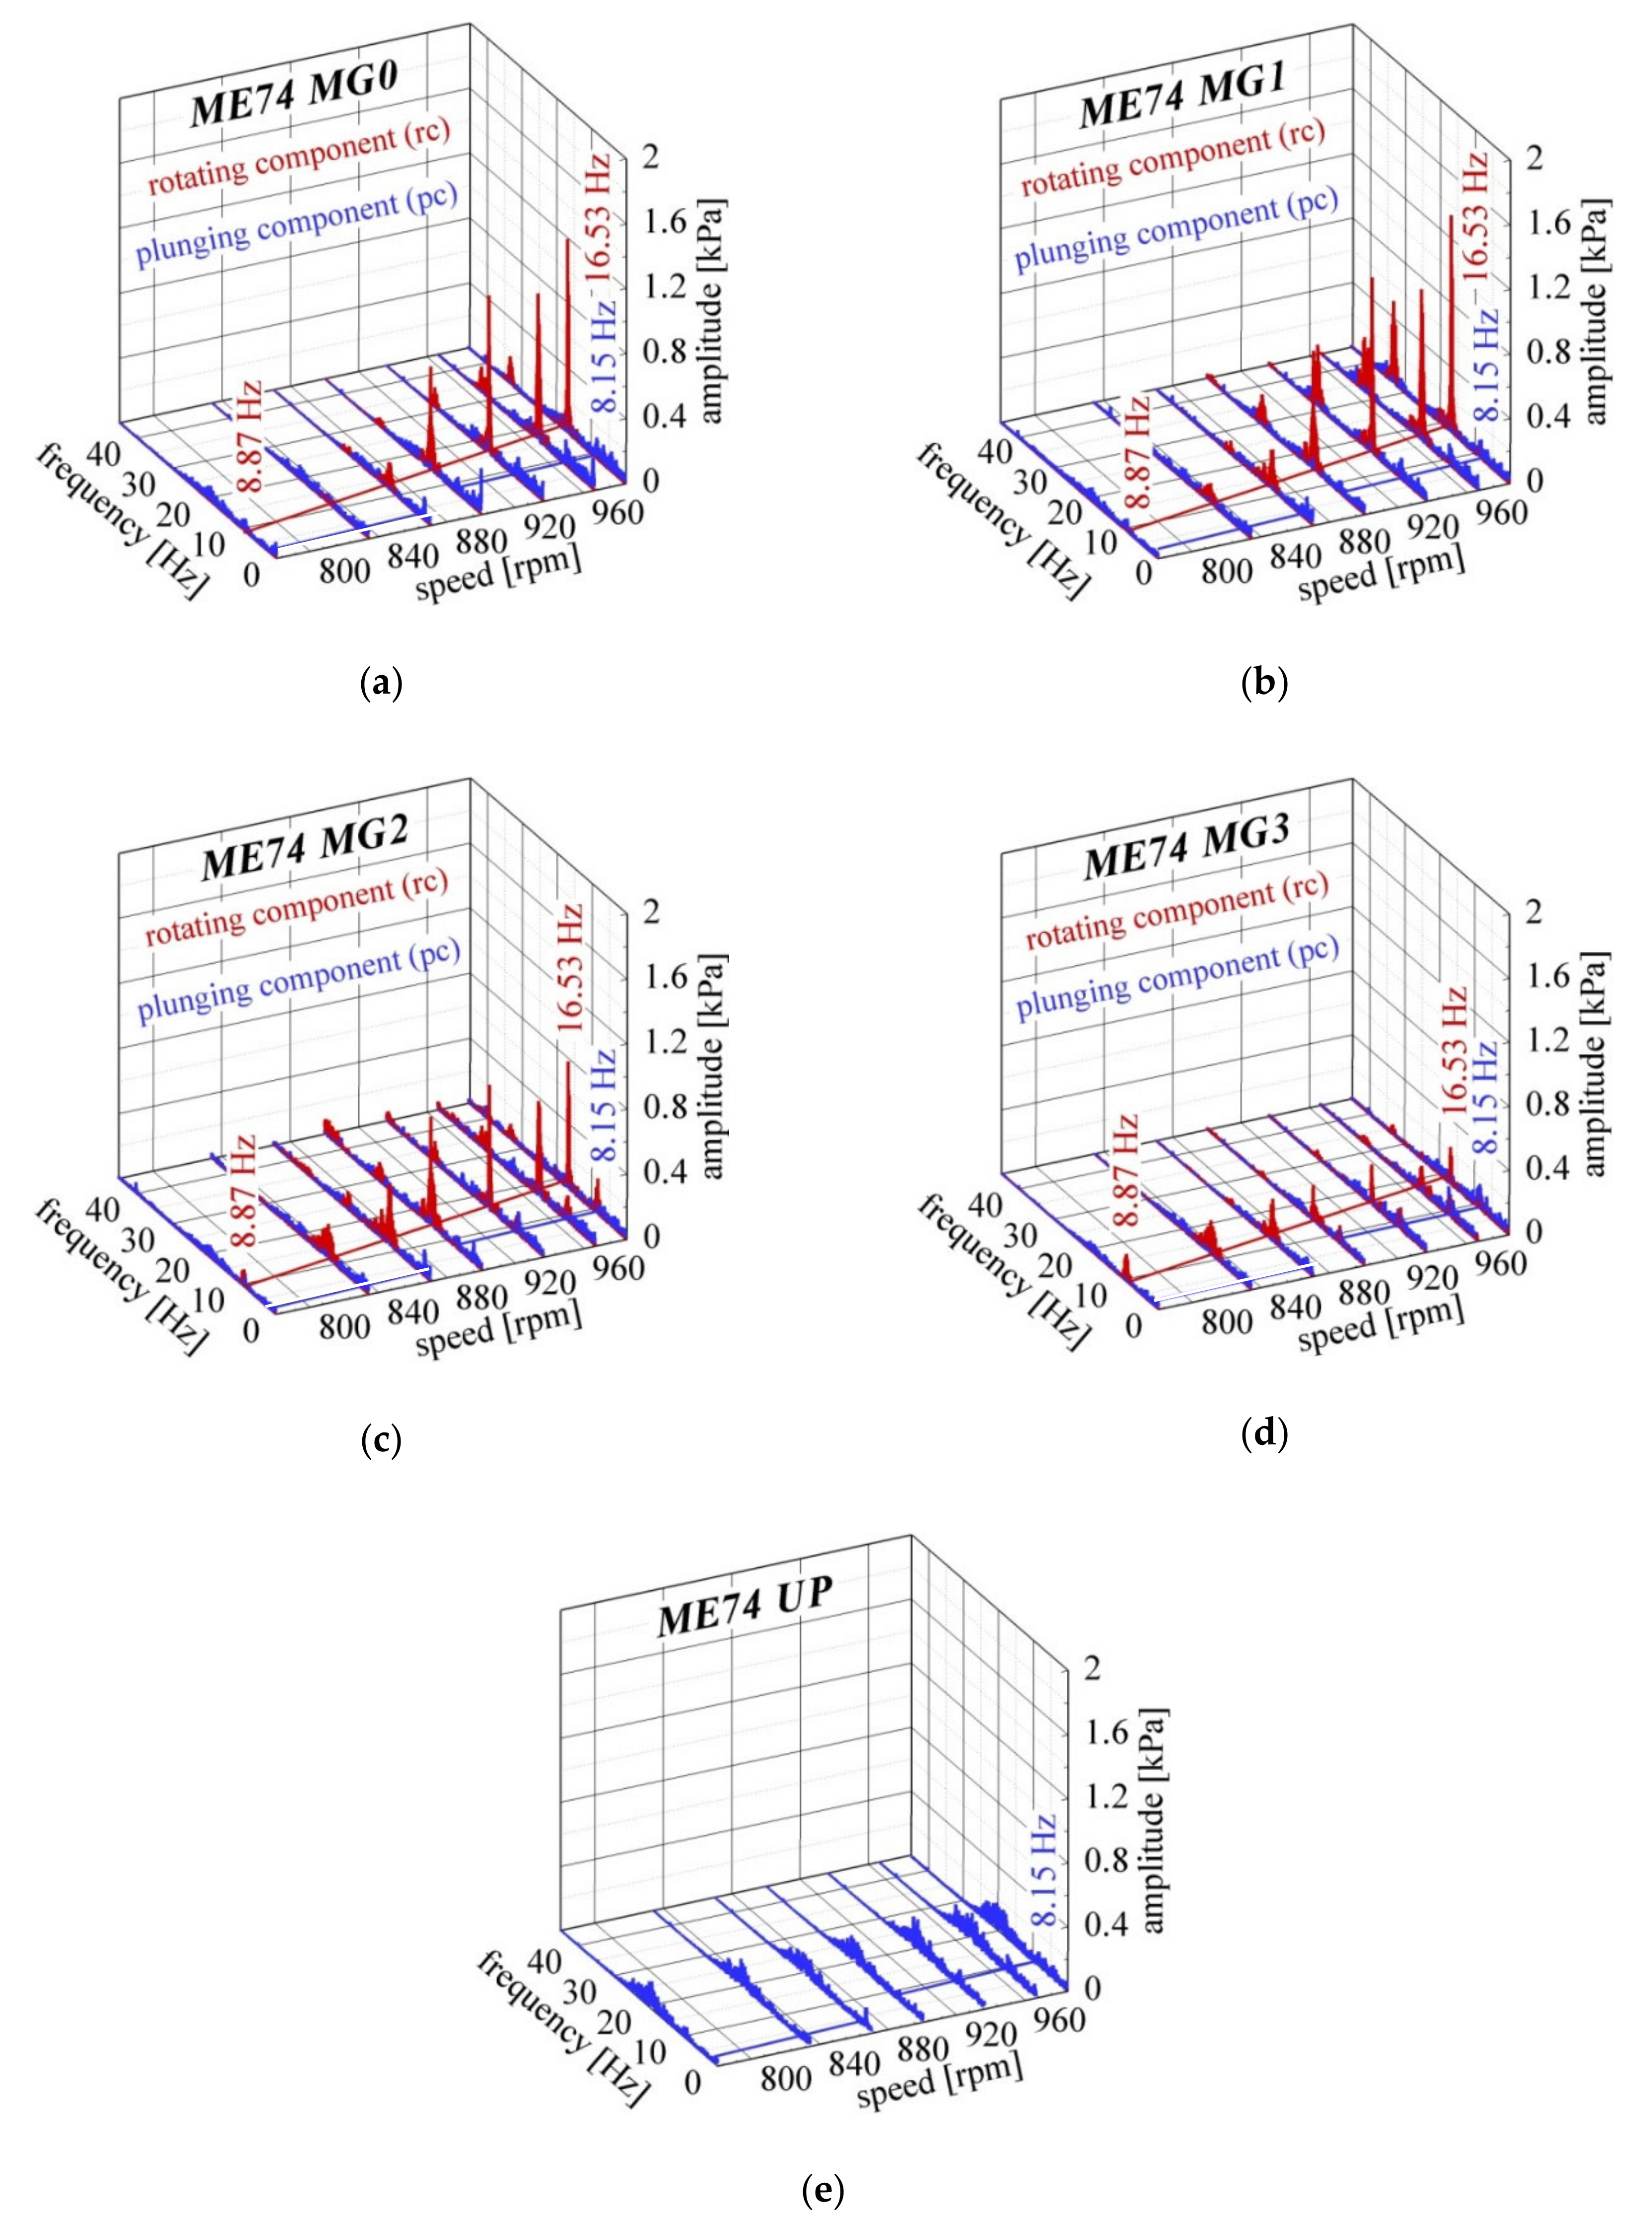
The same procedure applied to previous investigations has been selected. The swirling flow interaction with ME74 draft tube is further studied selecting the same rotor speed values as for SHE74 draft tube. As a result, three-dimension waterfall diagrams of the decomposed power spectra of the pressure signals obtained on the wall of the test section together with ME74 draft tube are presented in
Figure 6. The detailed features generated by self-induced swirling flow instabilities on the wall are revealed in these plots. It can be noticed that the fundamental frequency of the rotating component decreases monotonously as the rotor speed slows down. On the contrary, the fundamental frequency of the plunging component decreases sharply at speeds of less than 900 rpm. Maximum amplitude of the rotating component is found on the MG1 level for the largest speed values of the rotor. The amplitudes of the plunging component are significantly smaller than the amplitudes of the rotating one for these rotor speeds. On the other hand, the amplitudes of the rotating component are mitigated at lower speed values of the rotor reaching the same order of magnitude as the plunging one. The distribution of the plunging component supports the statement that its source is located in the ME74 geometry. The frequency of this plunging component is found on the UP level (
Figure 6e) proving that it propagates upstream along the test section.
The distribution of the fundamental frequencies associated with both plunging and rotating component in relation to the rotor speed is plotted in
Figure 7a. The fundamental frequency of the rotating component induced by precession motion of the flow instabilities diminishes monotonically with more than 40% from the runaway speed of 984 rpm to 780 rpm. The fundamental frequency of the plunging component corresponding to the interaction of the swirling flow with ME74 geometry reveals two distinct zones separated by speed value of 900 rpm.
The equivalent amplitude of the full power spectra determined on each level are plotted in
Figure 7b quantifying their tendencies in relation to the rotor speed. The equivalent amplitude of the full power spectra on all levels mitigates as the rotor speed decreases. The highest equivalent amplitude of the full power spectra around 3.6 kPa is reached on the MG1 level at the largest rotor speed of 984 rpm. The largest equivalent amplitude remains on the MG1 level for next two rotor speed values of 966 rpm and 936 rpm, then it moves on the MG2 level for the speed values from 900 rpm to 834 rpm. The equivalent amplitude values below 1 kPa are obtained on all levels displaced along the cone at the rotor speed of 780 rpm. It can be concluded that the level of the flow unsteadiness acquired on the cone wall mitigates with more than 70% as the rotor speed is slow down. Moreover, the largest value of the flow unsteadiness moves downstream along the cone as the rotor speed is decreased.
Further, the equivalent amplitudes of the plunging and rotating components are presented in
Figure 7c,d. The data obtained on each level relative to the rotor speed fit with linear regression to highlight trends. The highest equivalent amplitude of the plunging component around 1.9 kPa was found on MG1 level at the largest speed of 984 rpm. The equivalent amplitude of the plunging component decreases about 65% from 984 rpm to 780 rpm.
The highest equivalent amplitude around 4.9 kPa of the rotating component is found on the MG1 level at the largest rotor speed of 984 rpm. The values of the rotating component monotonically decrease on all levels as the rotor speed is slowing down. The values of the rotating component on all levels fall below 1 kPa at the rotor speed of 780 rpm which means a decrease of over 75%. The maximum value of the rotating component moves downstream from the MG1 level at the first four largest speeds of 984 rpm, 966 rpm, 936 rpm and 900 rpm at the MG2 level at 870 rpm and 834 rpm and up to the MG3 level at 780 rpm. The above observations suggest that the parameters (e.g., eccentricity, intensity) associated with the self-induced flow instabilities defined by Kuibin et al. [
78] are diminished as the rotor speed is slower.
5. Discussion
The influence of the elbow geometry on the unsteady pressure field under variable operating conditions is performed comparing the data obtained for both SHE74 and ME74 draft tubes. As a result, the influence on the components (e.g., the fundamental frequencies, the equivalent amplitude of the full spectra and the equivalent amplitude of both plunging and rotating components) of the unsteady pressure field is quantified for several operating conditions. All further comparisons are performed considering the dimensionless form of the quantities defined by Equations (A4)–(A6), respectively.
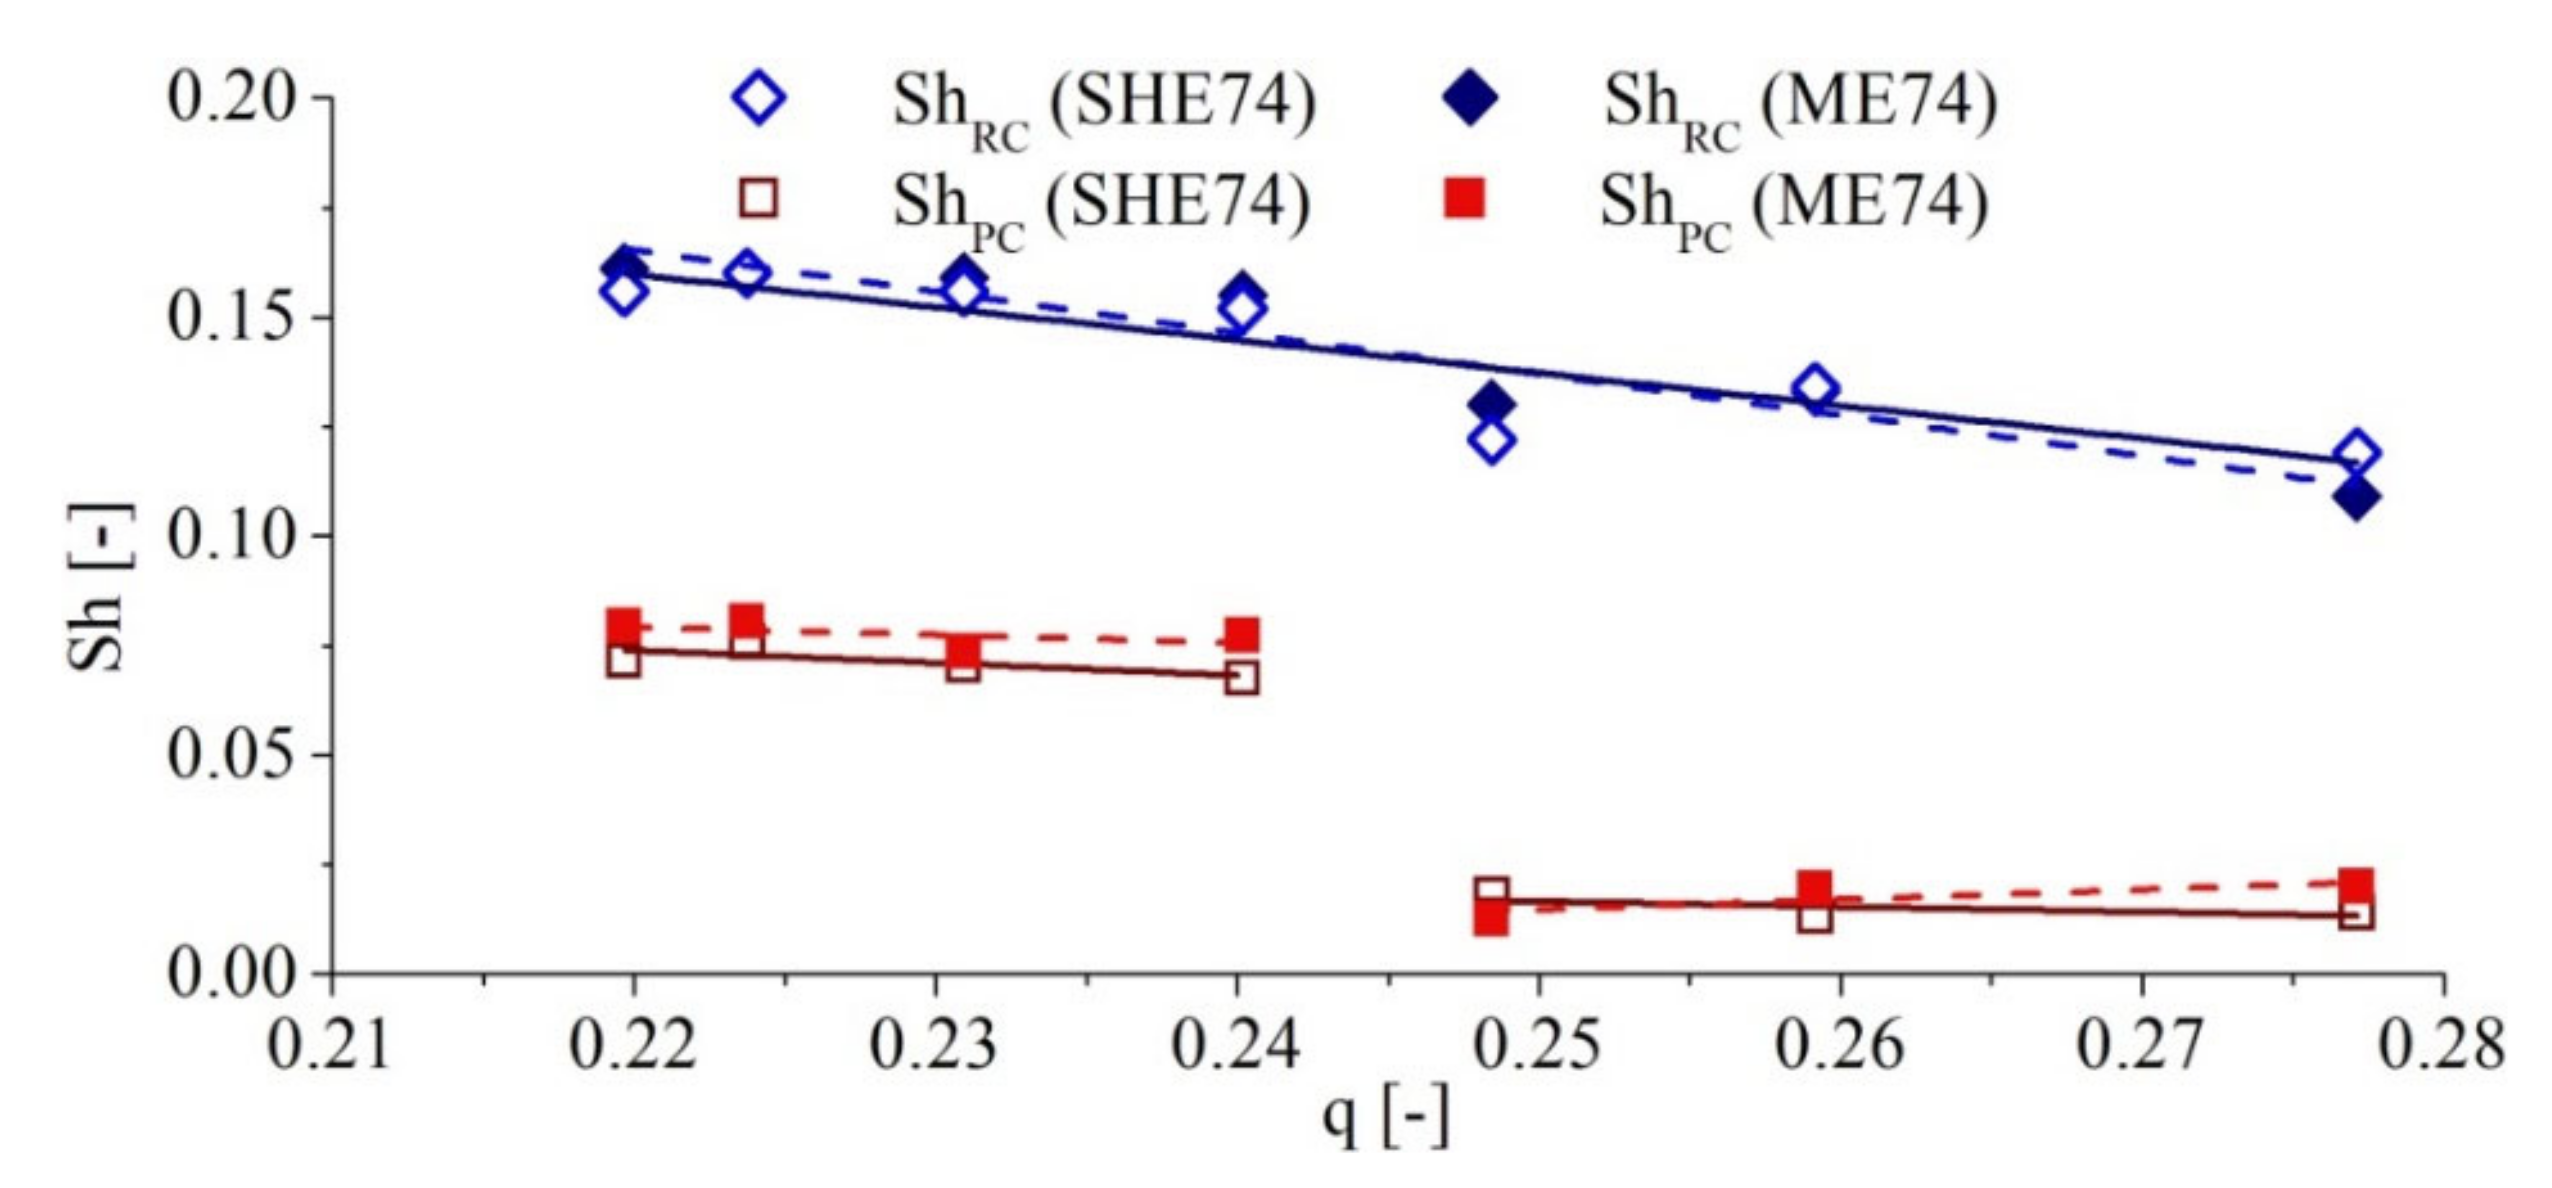
The Strouhal number defined by Equation (A5) has been selected as a dimensionless criterion for both fundamental frequencies of the plunging and rotating components. The distribution of the Strouhal numbers of both fundamental frequencies of the plunging (red) and rotating (blue) components in relation to the discharge coefficient defined by Equation (1) for two SHE74 (◊ □) and ME74 (♦ ■) geometries is given in
Figure 8.
The Strouhal number of the rotating component monotonically decreases from 0.16 to 0.11 for both SHE74 and ME74 geometries as the discharge coefficient increases. It can be noted that, practically, there is the same tendency of the rotating component with the discharge coefficient for both geometries of the draft tube. The differences between the two sets of data are due to the random uncertainties associated with the measurements. A different situation is revealed by the Strouhal number distribution of the fundamental frequency corresponding to the plunging component in relation to the discharge coefficient. Two plateaus are identified in the distribution of the Strouhal number corresponding to the fundamental frequency of the plunging component on the discharge coefficient range from 0.22 to 0.277. The first plateau of the Strouhal number associated with the fundamental frequency of the plunging component around 0.07–0.08 corresponds to a lower discharge coefficient range from 0.22 to 0.24, while the second one around 0.015–0.025 covers the discharge coefficients values above 0.245. The differences between the two series of measurements are attributed to the random uncertainties of the experimental investigations. It can be concluded that the change of the elbow geometry from configuration SHE74 to ME74 does not influence the Strouhal numbers distributions.
The dimensionless equivalent amplitude of the full power spectra (
aRMS) obtained on all levels against the discharge coefficient for both SHE74 and ME74 draft tubes are shown in
Figure 9. A linear regression is applied on each level in relation to the discharge coefficient to highlight its trend. The trend on each level corresponding to the ME74 configuration (dashed lines) is below the trend associated with the same level of SHE (solid line) geometry. This observation suggests that the effects of the self-induced flow instabilities are lower on the test section walls for ME74 geometry than for SHE one. Therefore, a deep analysis is conducted to identify the components of the unstable pressure field influenced by the elbow geometry of the draft tube.
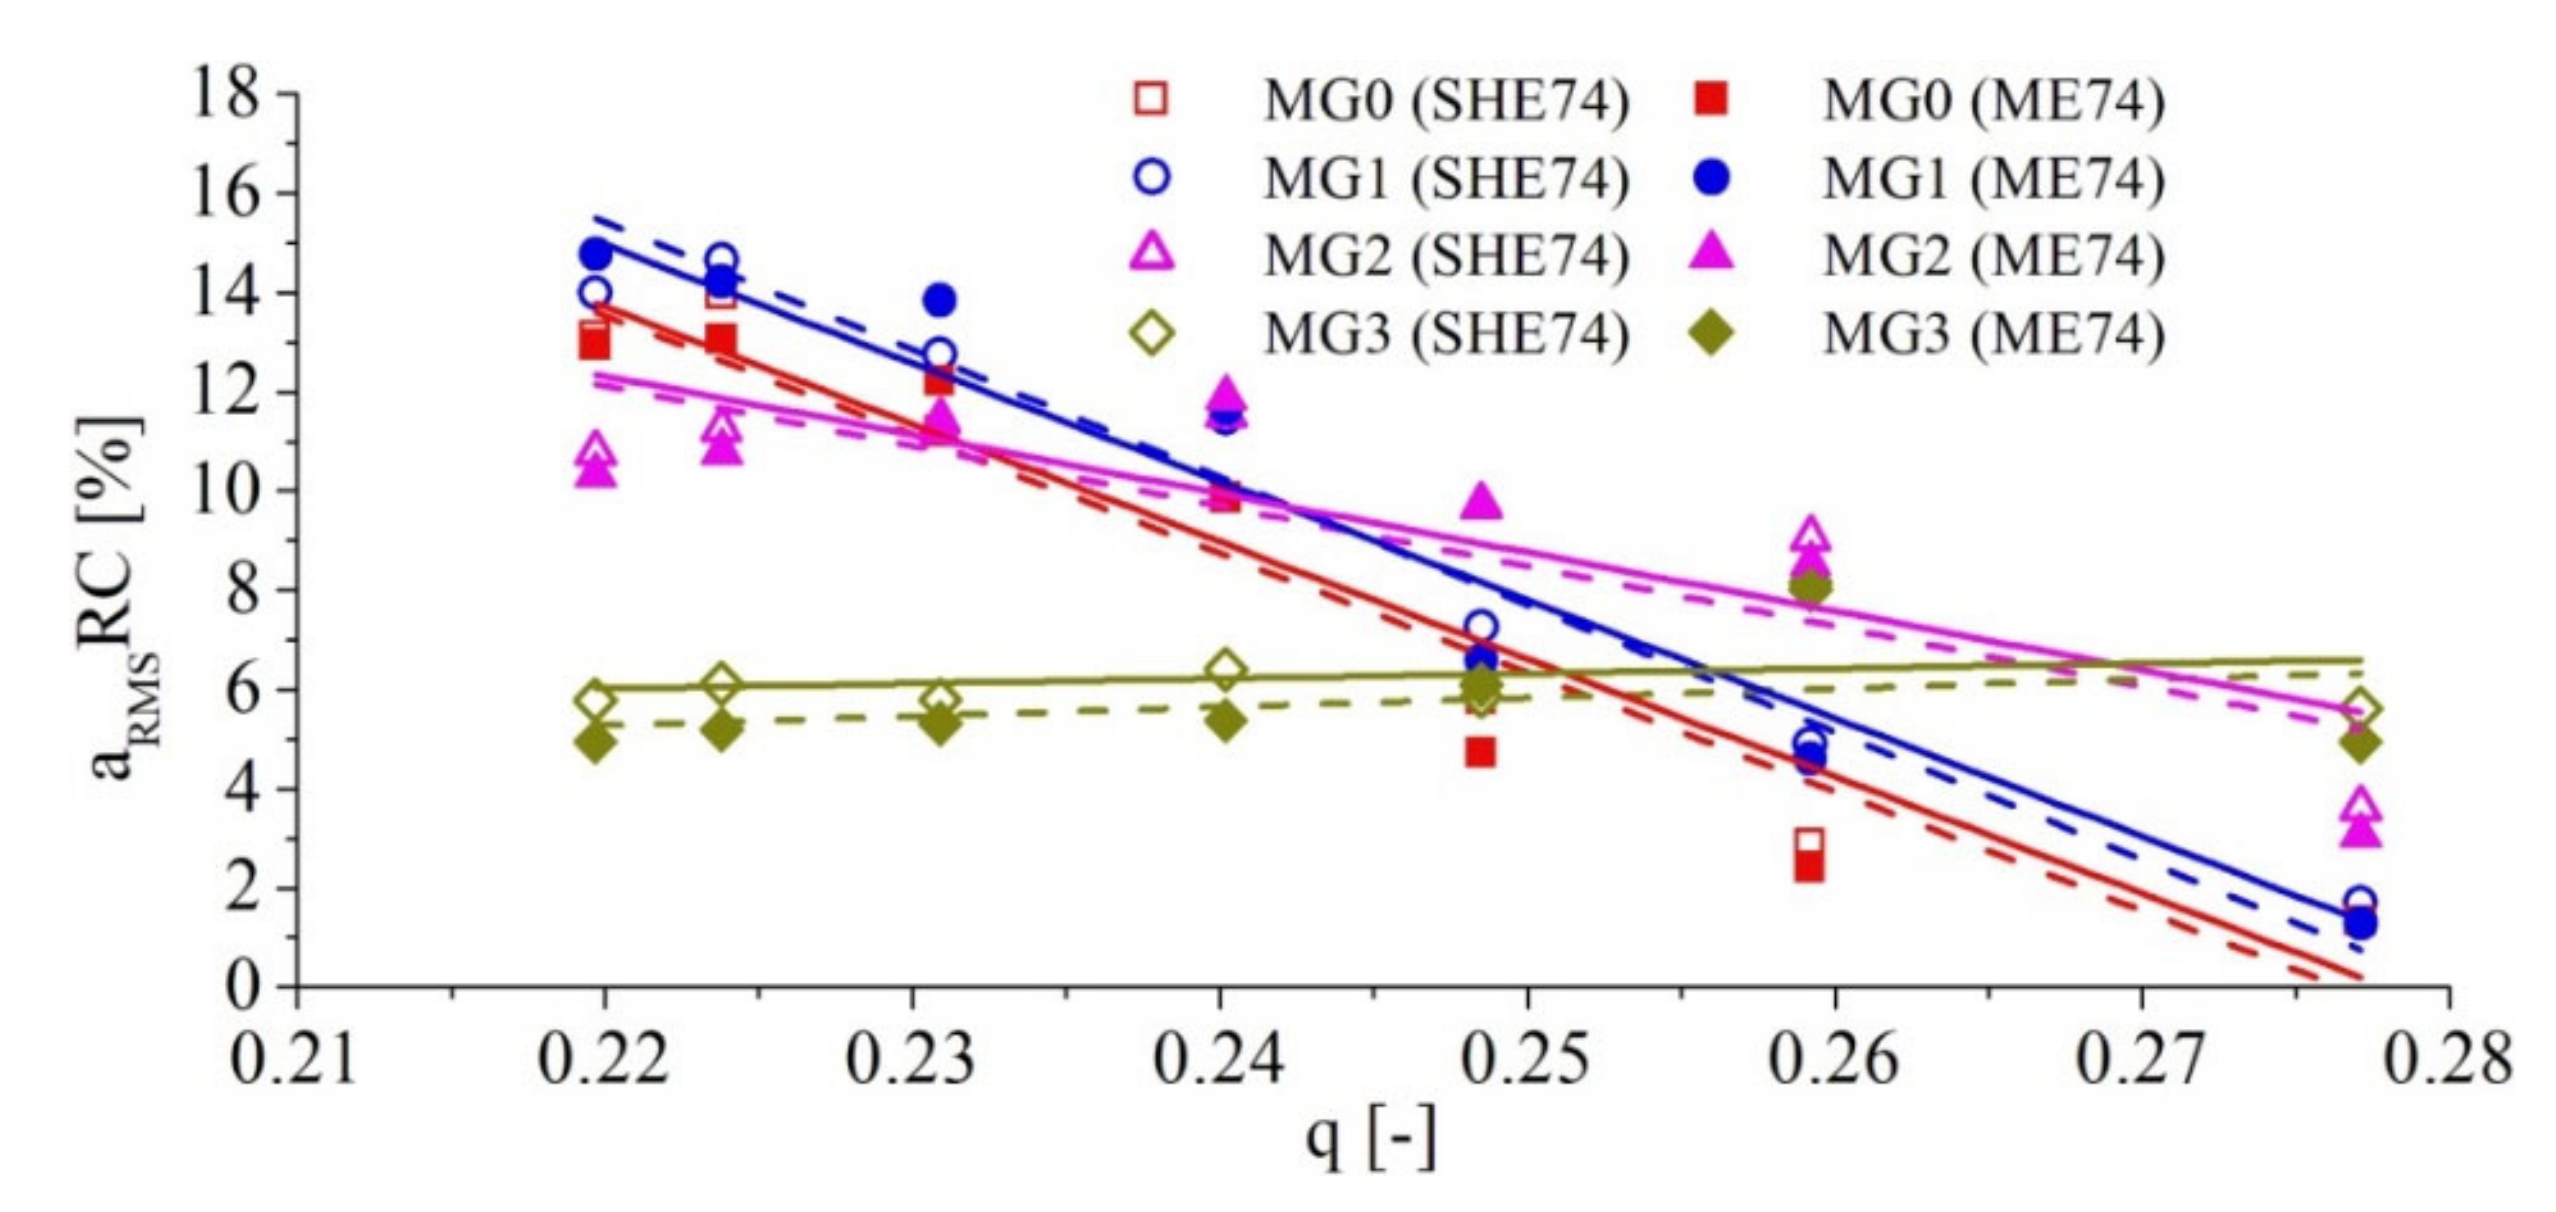
The dimensionless equivalent amplitudes of the discriminated components (rotating and plunging components) of the power spectra are further examined in relation with the discharge coefficient to identify the influence of the elbow geometry. The dimensionless equivalent amplitude of the rotating component (
aRMS_
RC) determined on the levels available along the cone against the discharge coefficient for both SHE74 and ME74 draft tubes are plotted in
Figure 10 together with their linear regressions in order to capture the trends. The rotating component at the upper level (UP) is negligible because the flow is only axial. As a result, the trend on each level corresponding to the ME74 configuration (dashed line) is practically the same as the one obtained on the similar level of SHE geometry (solid line).
As expected, a smaller influence of the modified elbow (ME74) compared to the sharp elbow geometry (SHE74) is found at the MG3 level. Note that the MG3 level is located in the cone closer to the elbow geometry. This influence is explained by the fact that the ME74 geometry limits the development of the self-induced flow instabilities in the last part of the cone compared to the SHE74 geometry, slightly mitigating the unsteadiness level acquired on the wall. In conclusion, the influence of the elbow geometry on the rotating component determined at the test section wall is rather negligible. Further, the influence of the elbow geometry on the plunging component (PC) is examined. The dimensionless equivalent amplitudes of the plunging component (
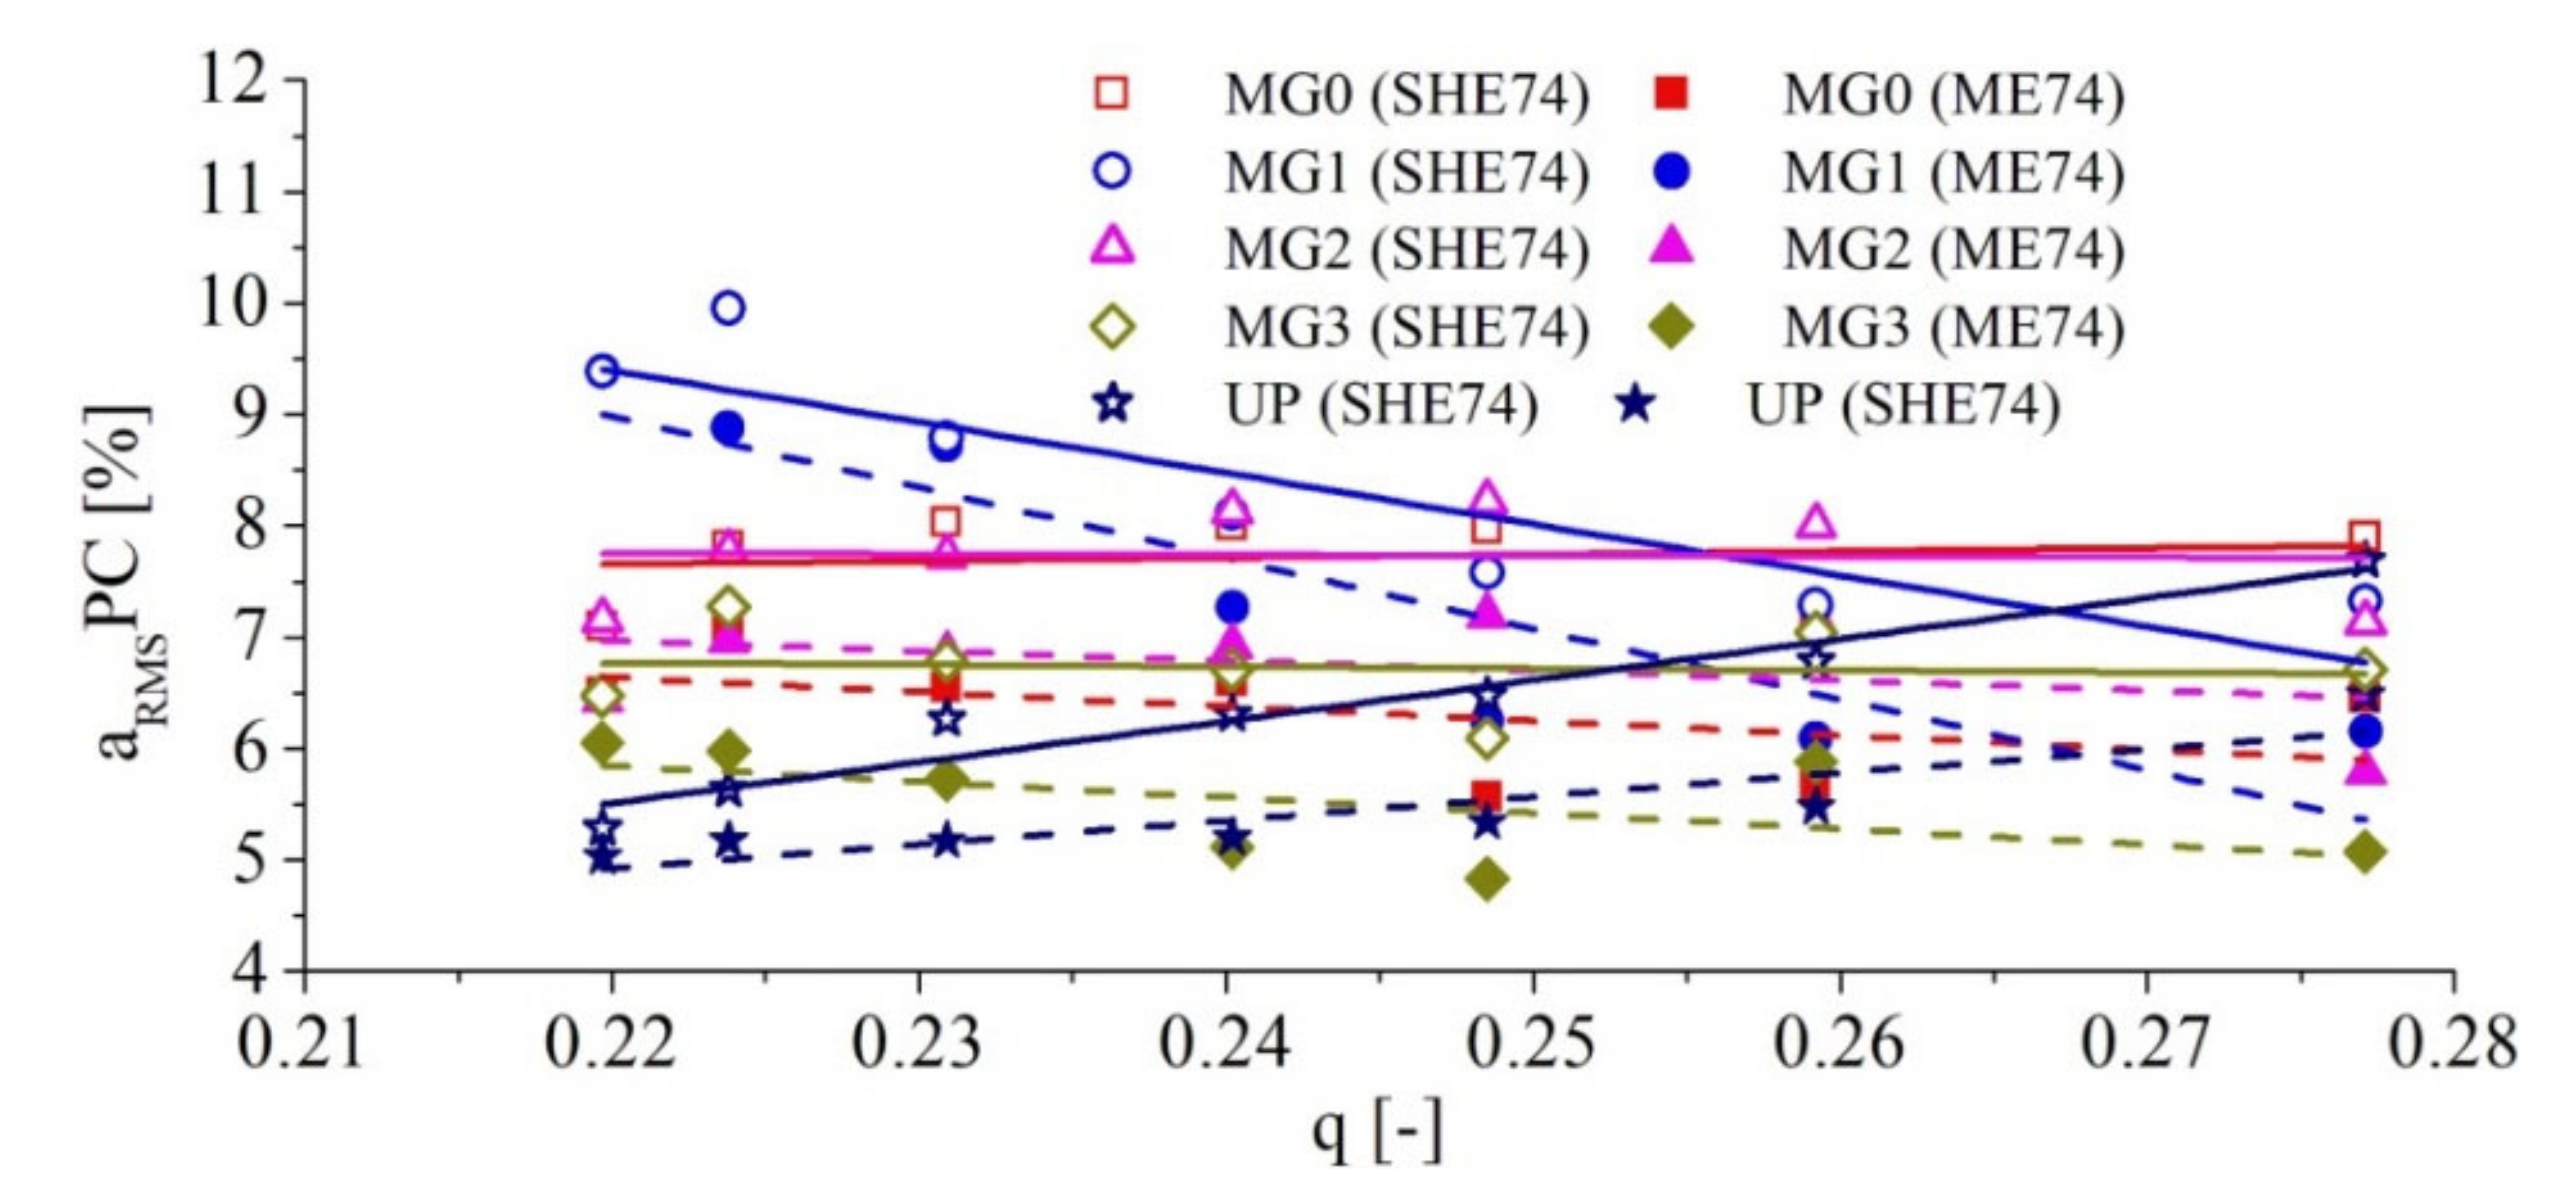
aRMS_
PC) determined on all levels of the test section in regard to the discharge coefficient for both SHE74 and ME74 draft tubes are plotted in
Figure 11 together with their linear regressions to highlight the trends.
The trends marked with solid lines corresponding to the SHE74 draft tube are on all levels above those associated with the ME74 draft tube with dashed lines. The previous statement leads to the conclusion that the self-induced flow instabilities effects are mitigated up to 15–20% on the test section wall for ME74 geometry than for SHE74 geometry. It is important to note that the plunging component on the UP level is diminished up to 10–15% by reshaping of the draft tube elbow. In conclusion, the amplitude of the plunging component that propagates along the hydraulic passage is influenced by the shape of the elbow of the draft tube.
The dimensionless equivalent amplitude of the plunging component (
aRMS_
PC) includes all contributions discriminated in the plunging power spectrum using the Equation (A4) plotted with blue in
Figure 4 and
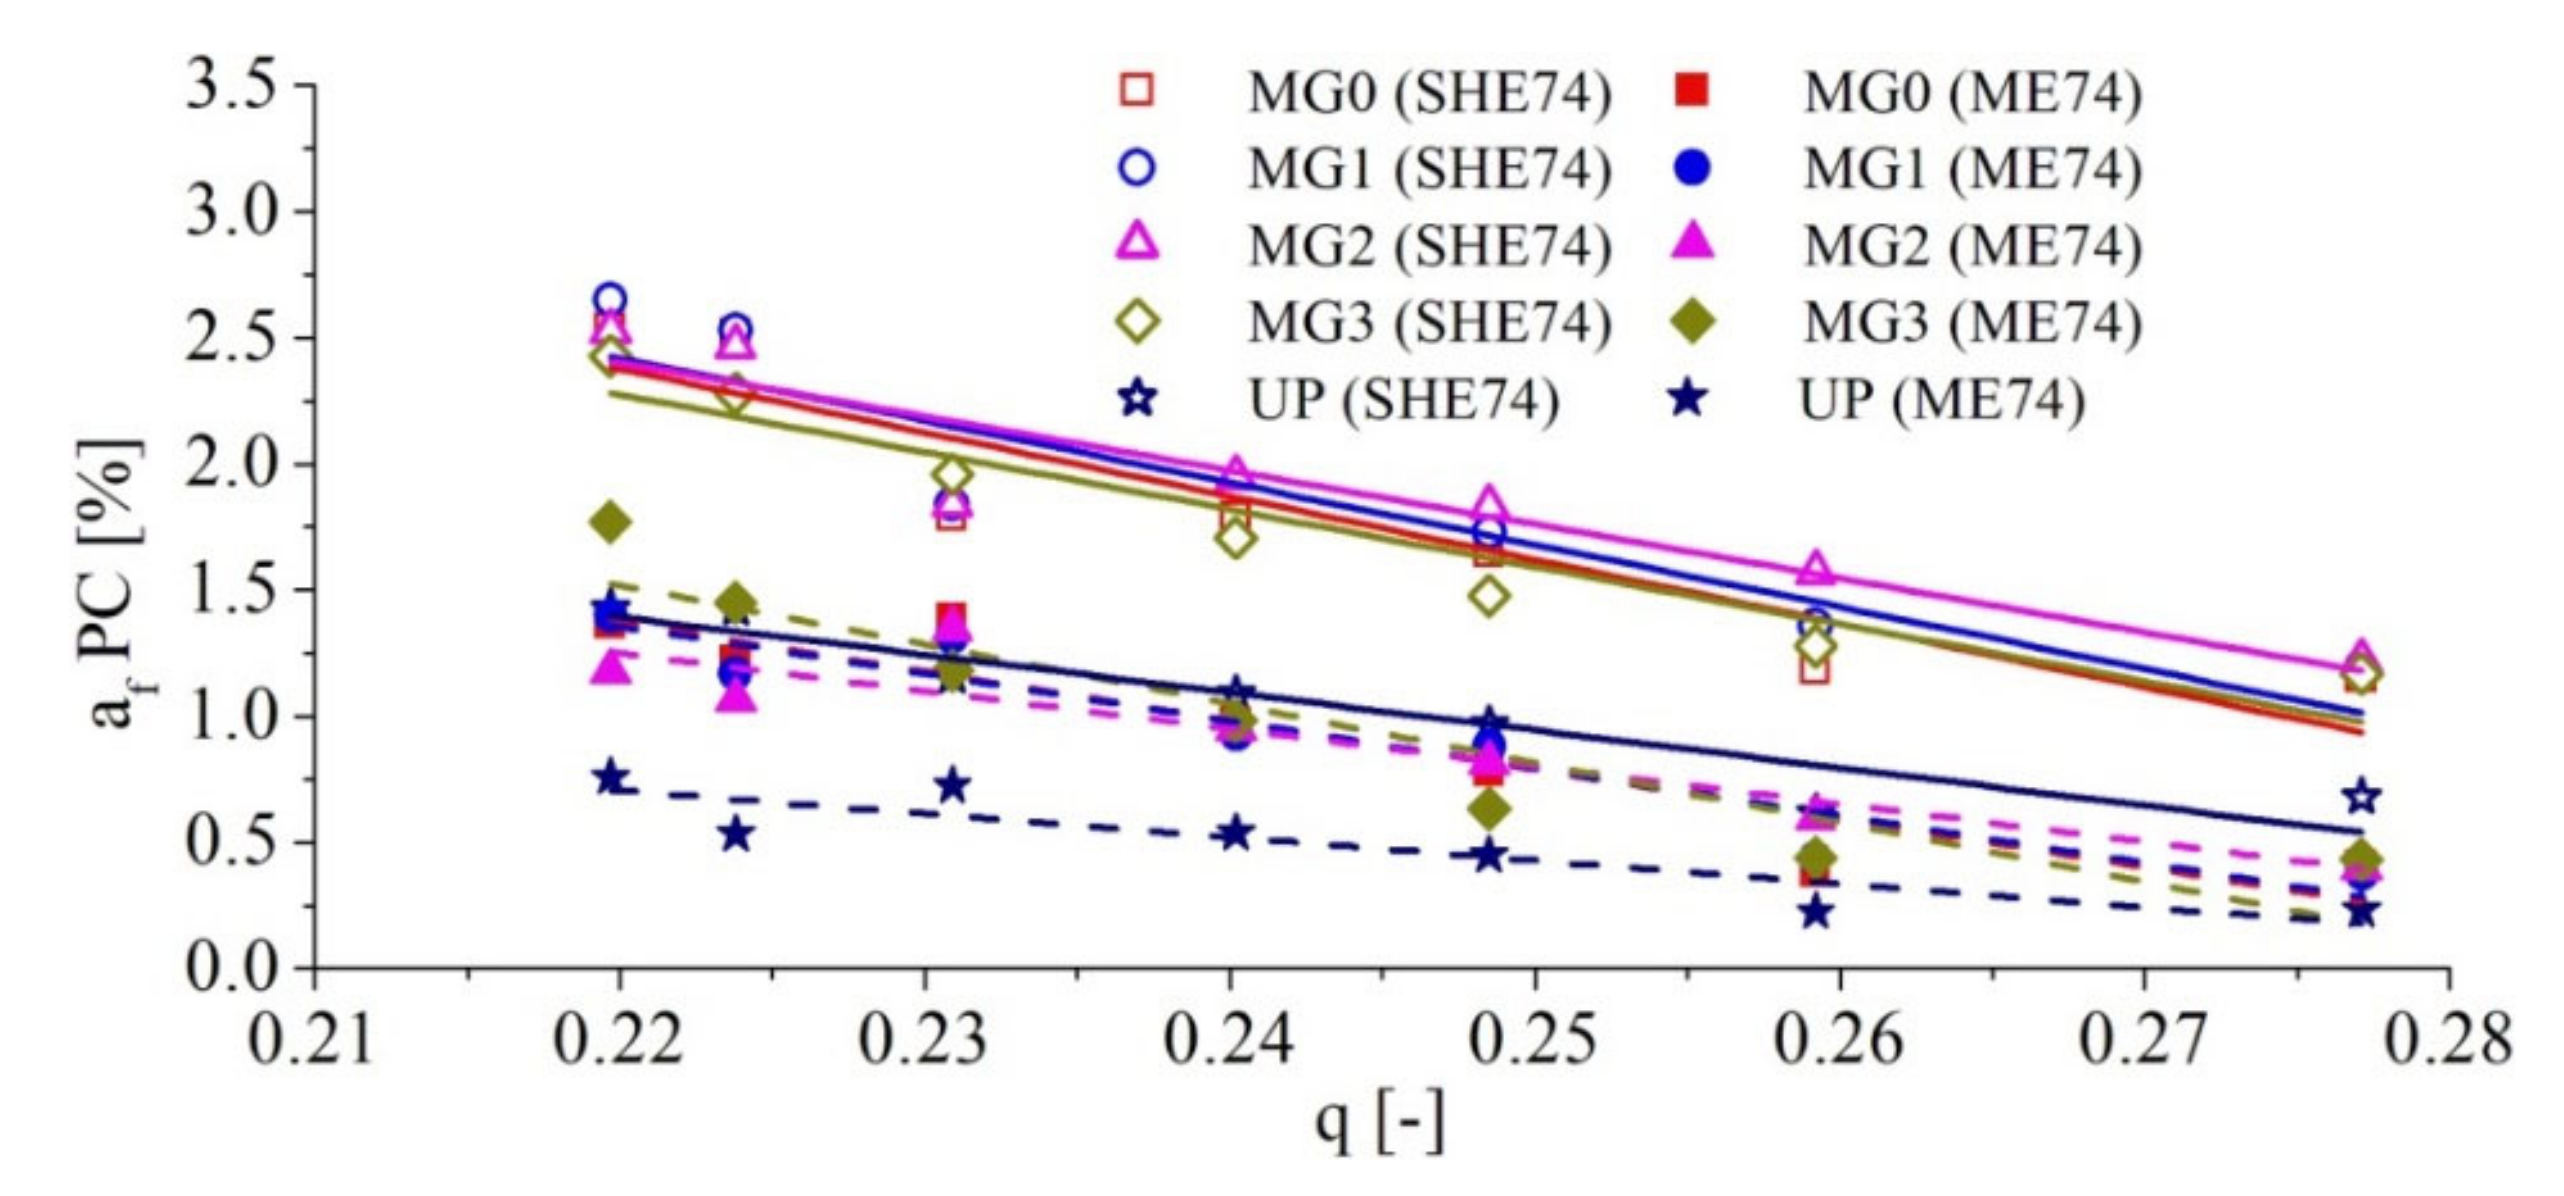
Figure 6. The equivalent amplitude of the contributions on the narrow band around the fundamental plunging frequency (
af_
PC) found in the plunging power spectrum quantity the significant part of the swirling flow interaction with the elbow geometry. This dimensionless equivalent amplitude of the contributions on the narrow band around the plunging fundamental frequency is determined by using Equation (A6). These dimensionless equivalent amplitudes on the narrow band around the fundamental plunging frequency determined on all levels of the test section in relation to the discharge coefficient for both SHE74 and ME74 draft tubes are depicted in
Figure 12. One can observe in this figure that the dimensionless equivalent amplitudes on the narrow band around the fundamental plunging frequency are diminished with 40–50% by reshaping the elbow geometry of the draft tube.
6. Conclusions
The paper focuses on the experimental investigations of the self-induced flow instabilities in the simplified geometries of two draft tubes. The influence of reshaped elbow geometry of the draft tube on the unsteady pressure field is quantified at different operating conditions. The close loop test rig and the experimental setup of the test section together with two simplified geometrical configurations of the draft tubes (74° sharp heel elbow labeled SHE74 and 74° modified elbow denoted ME74) have been detailed. Different operating conditions with self-induced instabilities similar to the partial load operation of the hydraulic turbines have been obtained slowing down the rotor speed of the swirl generator.
The power spectra are determined on five levels (four levels located along the cone and one level positioned in the upper side of the test section) for seven operating conditions corresponding to different speed values of the rotor. The discriminated power spectra are presented for all investigated operating points for SHE74 and ME74 draft tubes. First, the fundamental frequency of the rotating component corresponding to the processing motion of the flow instability has been pointed out. This quantity decreases monotonically with more than 40% from the runaway speed of 984 rpm to 780 rpm. Second, the fundamental frequency of the plunging component due to the interaction between the swirling flow and the elbow geometry has been identified revealing two distinct zones separated by speed value of 900 rpm. Next, the equivalent amplitudes of full and discriminated power spectra have been determined on all levels in relation to the rotor speed values. All equivalent amplitude values on all levels are diminished as the rotor speed slows down.
The dimensionless quantities (e.g., Strouhal number, equivalent amplitude and discharge coefficient) have been selected to quantify the influence of the reshaped geometry on the unsteady pressure field. The Strouhal number associated with the fundamental frequency of the rotating component monotonically decreases for both SHE74 and ME74 geometries as the discharge coefficient increases. A different situation is revealed by the Strouhal number corresponding with the fundamental frequency distribution of the plunging component in relation to the discharge coefficient. Two plateaus are identified in the distribution of the frequency corresponding to the plunging component delimited by the threshold discharge coefficient of q = 0.2475. The Strouhal number associated with the fundamental frequency of the plunging component is around 0.45–0.5 from the Strouhal number associated with the fundamental frequency of the rotating component over the first plateau corresponding to the discharge coefficient lower than the threshold. The second plateau of the Strouhal number corresponding to the fundamental frequency of the plunging component is around 0.12–0.15 for the discharge coefficients larger than the threshold. It can be concluded that the reshape of the elbow geometry from configuration SHE74 to ME74 does not influence the distributions of the Strouhal numbers.
The dimensionless equivalent amplitude (aRMS) of the full power spectra acquired on all levels against the discharge coefficient for both SHE74 and ME74 draft tube geometries have been determined. The trend on each level corresponding to the ME74 configuration is below the trend associated with the same level of SHE geometry. This observation suggests that the effects of the self-induced flow instabilities are lower on the test section walls for ME74 geometry than for the SHE74 one. Therefore, the dimensionless equivalent amplitudes of the discriminated components (rotating and plunging) of the power spectra are examined in relation to the discharge coefficient to identify the influence of the elbow geometry.
The trends of the dimensionless equivalent amplitudes of the rotating component (RC) obtained on three levels displaced in the cone in relation to the discharge coefficient reveal a negligible change between the ME74 geometry and the SHE74 one. It seems that there is a small influence at MG3 level located closer to the elbow. This influence is explained by the fact that the ME74 limits the development of the self-induced flow instabilities in the last part of the cone. In conclusion, the influence of the elbow geometry on the amplitude of the rotating component determined at the test section wall is rather negligible.
The dimensionless equivalent amplitudes of the plunging component corresponding to the SHE74 draft tube are on all levels above those associated with the ME74 draft tube. This statement leads to the conclusion that the self-induced flow instabilities effects are mitigated up to 15–20% on the test section wall for ME74 geometry that for SHE one. It is important to note that the plunging component on the UP level is diminished up to 10–15% by the reshaping of the draft tube elbow. In conclusion, the amplitude of the plunging component that propagates along the hydraulic passage is mitigated by the reshape of the elbow of the simplified draft tube.
The dimensionless equivalent amplitude of the contributions on the narrow band (af) around the plunging fundamental frequency is determined on all levels of the test section in relation to the rotor speed. One concludes that this dimensionless equivalent amplitude of the contributions on the narrow band is diminished by 40–50% by reshaping the elbow geometry of the simplified draft tube.
The conclusions drawn based on the investigations performed in this research are the following: (i) the reshape of the elbow of the draft tube is negligible on both fundamental frequencies of the plunging and rotating components; (ii) the reshape of the elbow of the draft tube acts on the plunging component while its influence is negligible on the rotating component. In conclusion, the rounded or even chamfered geometry of the elbow of the draft tube mitigates the amplitude of the plunging component in relation to the sharp heel configuration of the elbow. As a result, the compact draft tubes lead to diminished plunging components induced by the self-induced instabilities at partial load conditions.

