
Combination of Thermal Modelling and Machine Learning Approaches for Fault Detection in Wind Turbine Gearboxes


Abstract
1. Introduction
- Applying a thermal network modelling approach to a WT gearbox failure identification.
- Comparing the output of thermal network modelling with temperature measurements to determine what has the greatest effect on gearbox health classification.
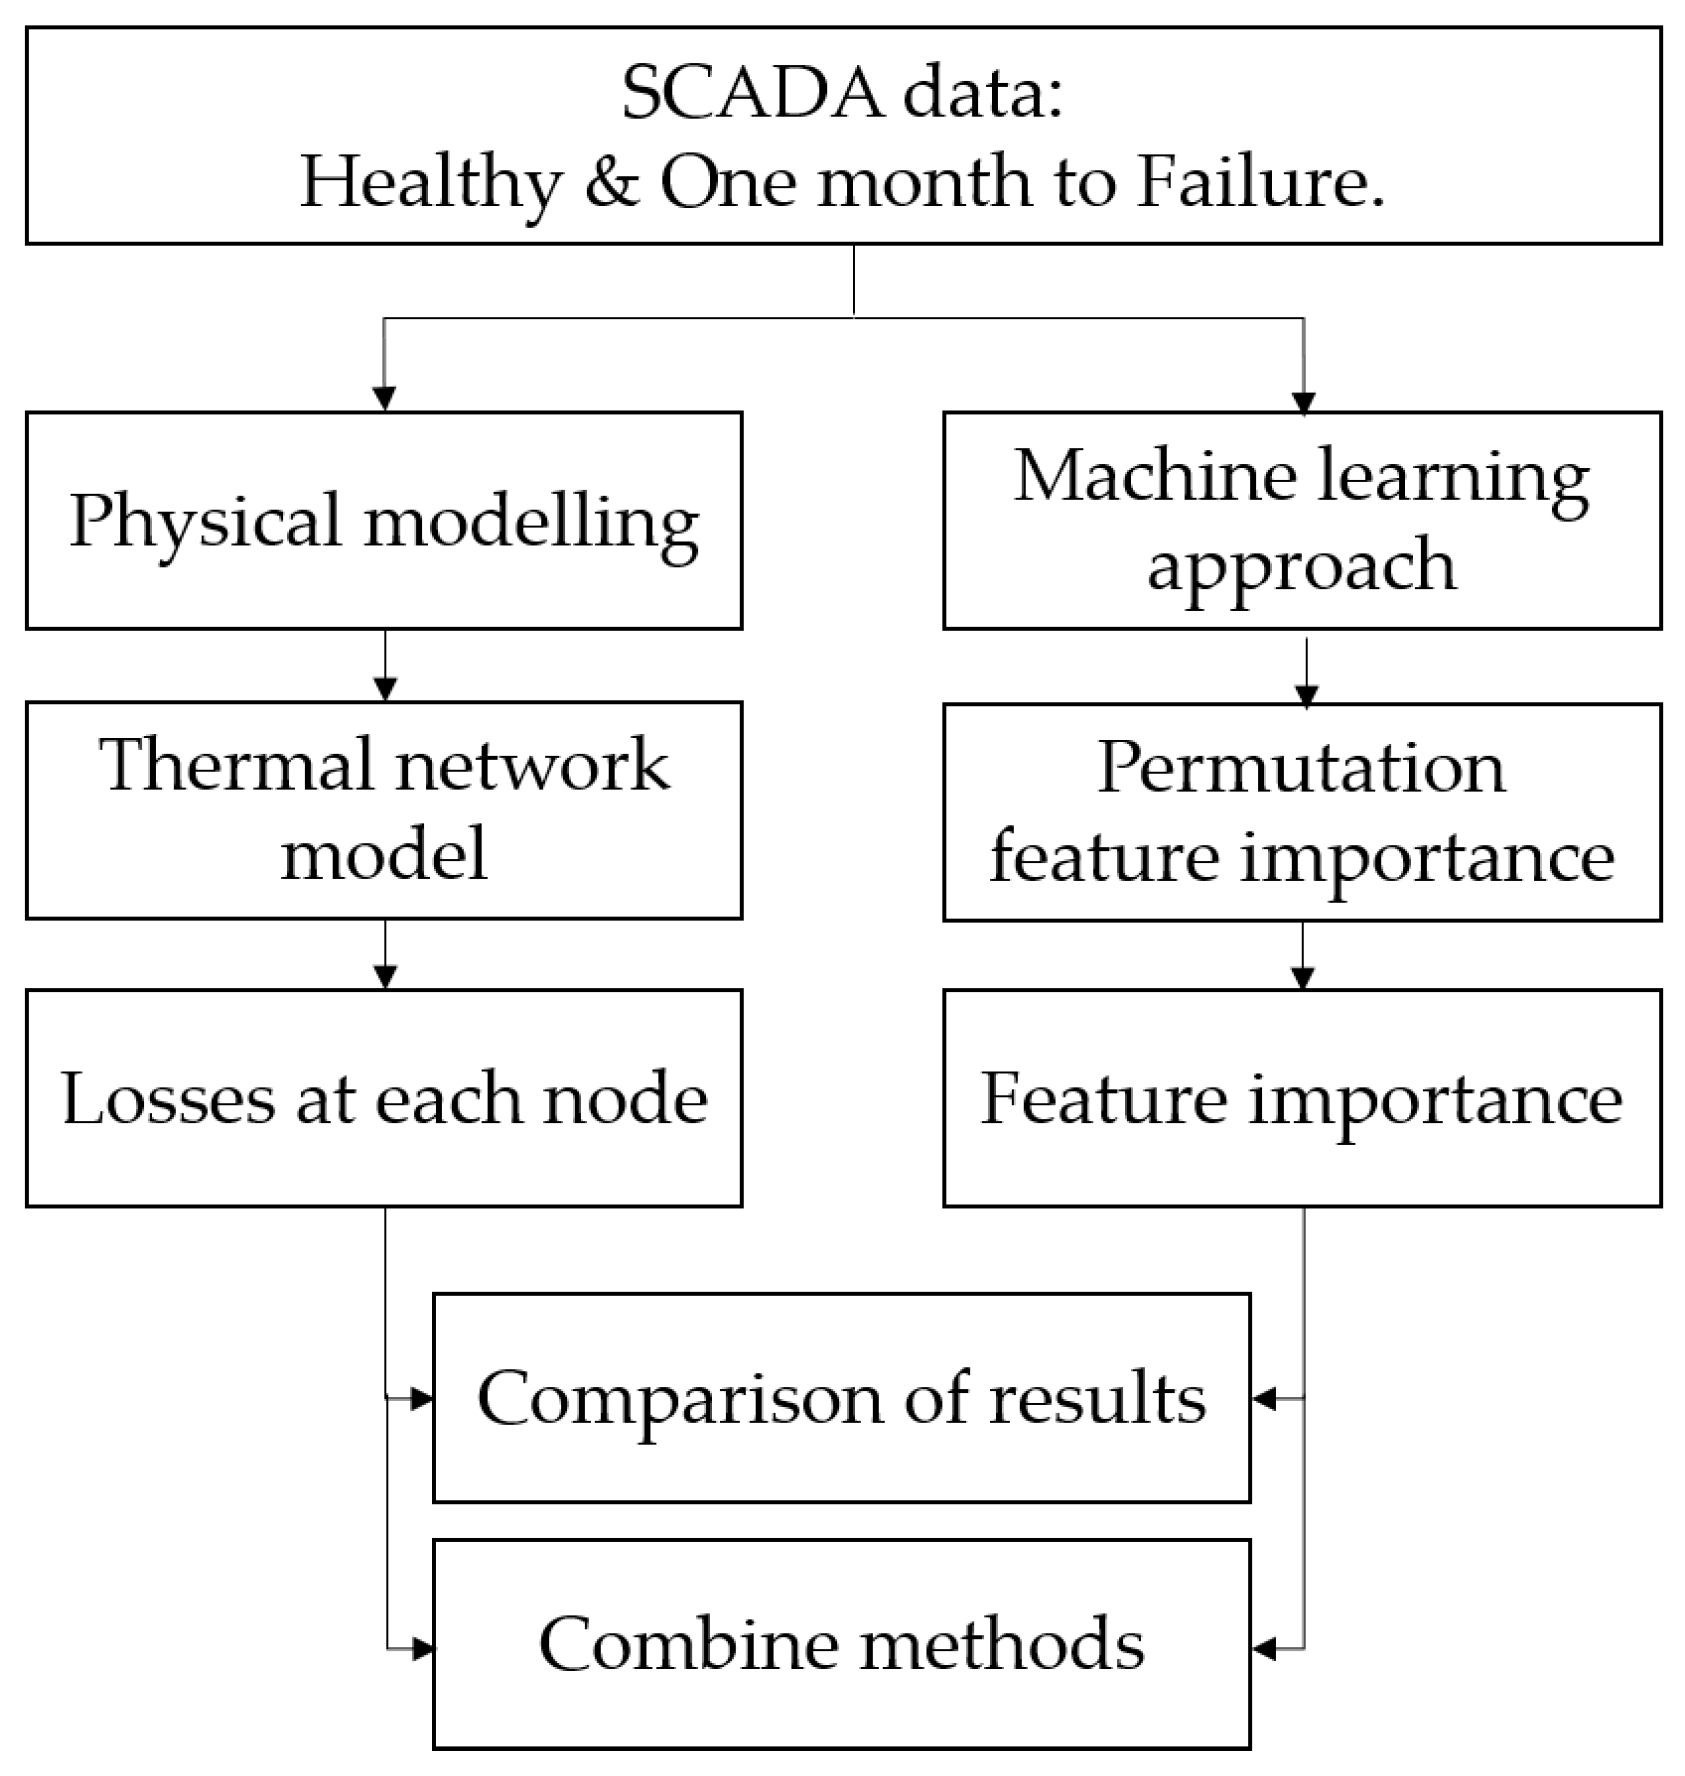
- Using and combining both physical modelling and machine learning approach through feature engineering to improve understanding of WT gearbox thermal behaviour for failure prediction.
2. Literature Review: Existing Fault Detection Methods
2.1. SCADA and CMS Data Analysis Techniques
2.1.1. Vibration for Condition Monitoring
2.1.2. Temperature for Condition Monitoring
3. Methodology
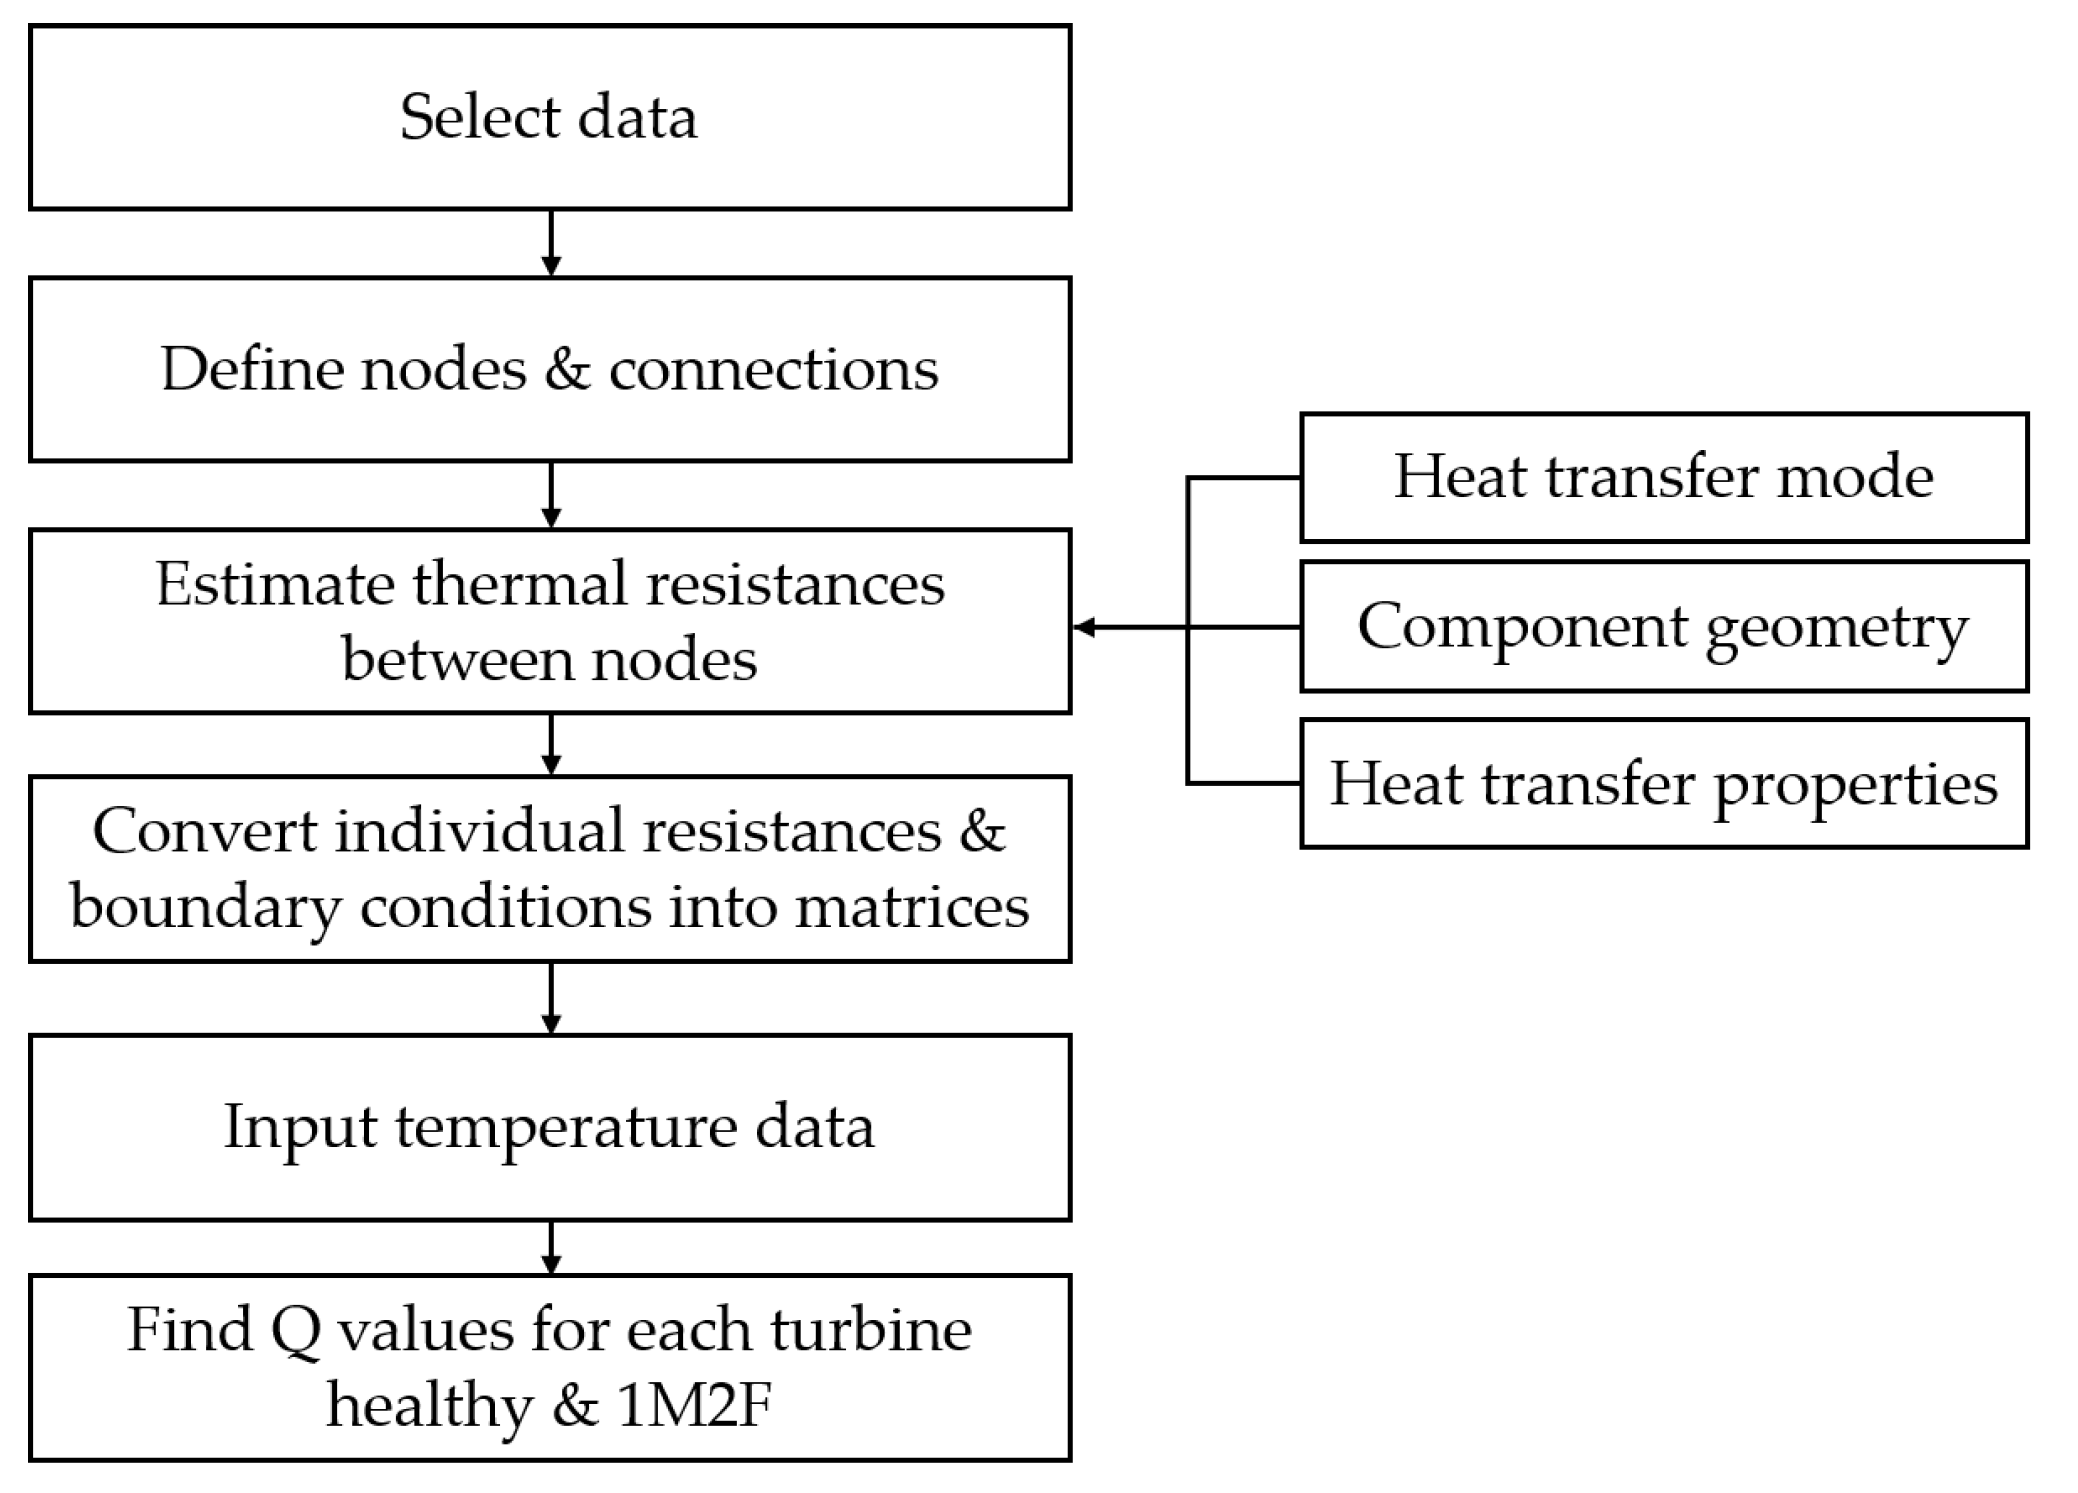
3.1. Thermal Network Modelling
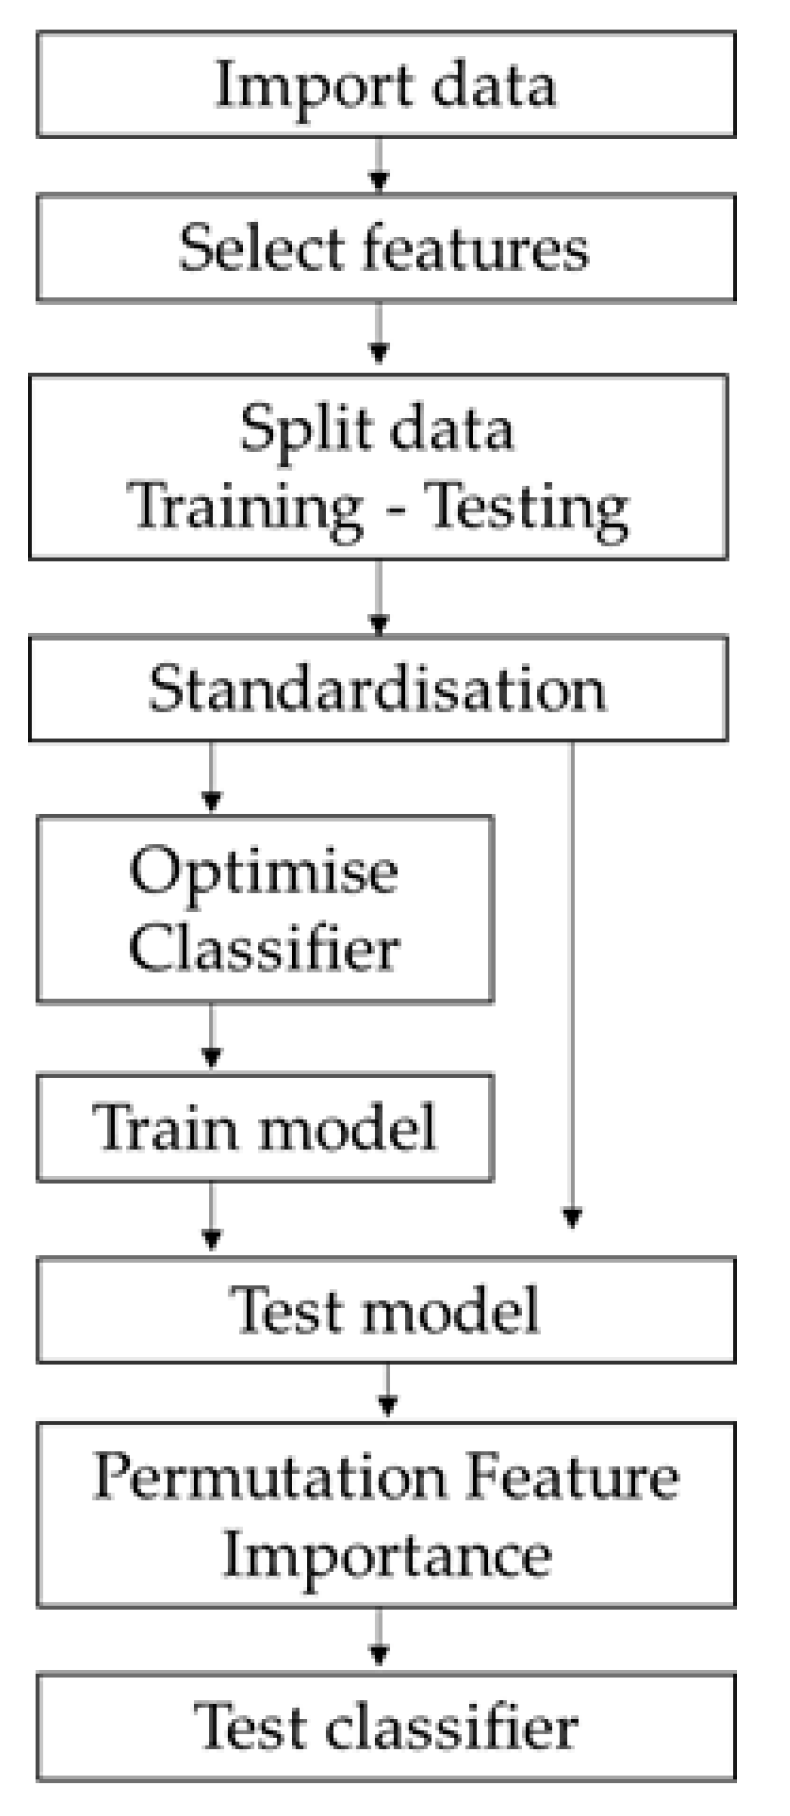
3.2. Permutation Feature Importance
4. Results
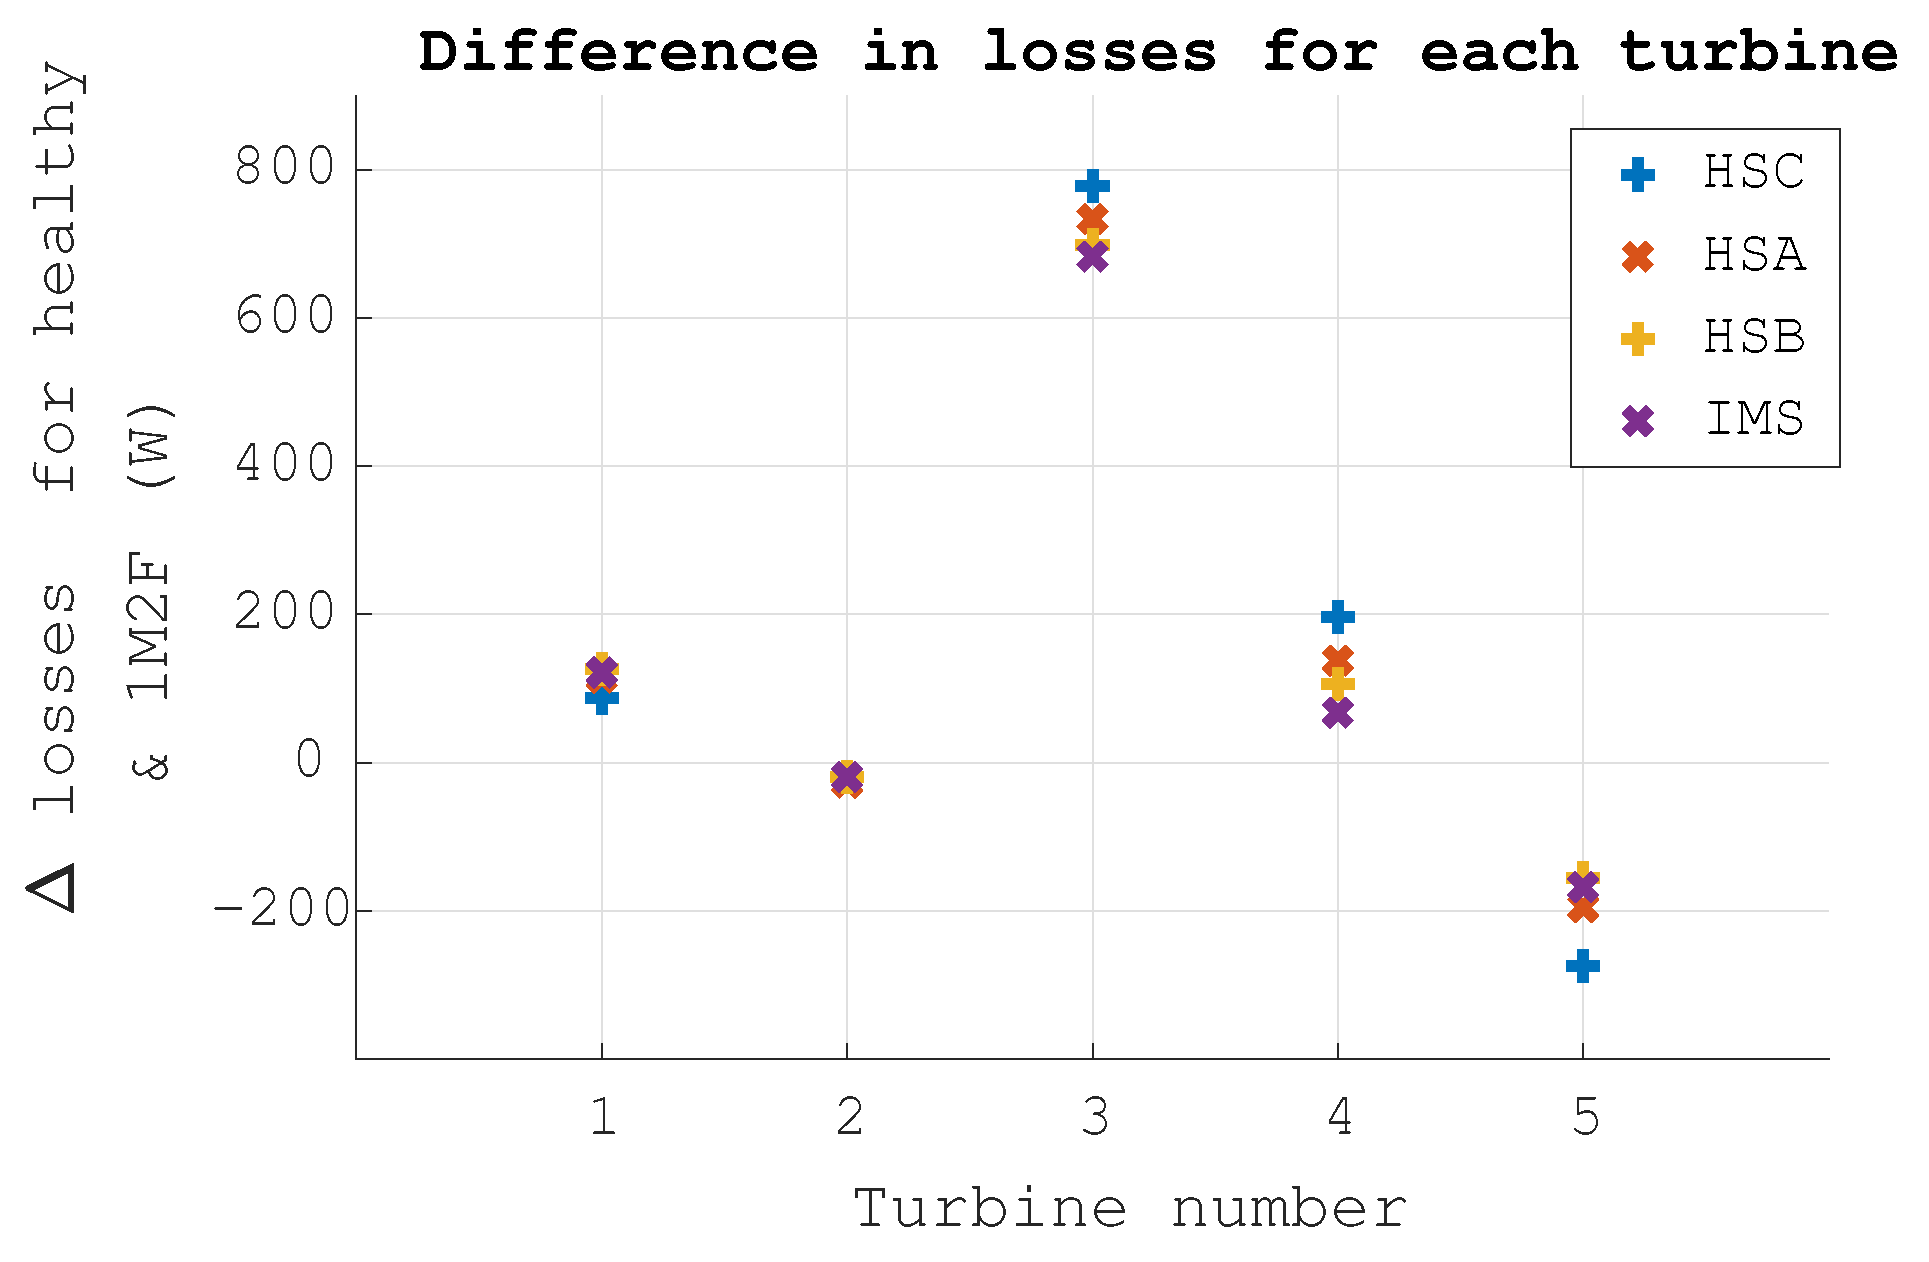
4.1. Dataset 1
4.1.1. Thermal Network Model
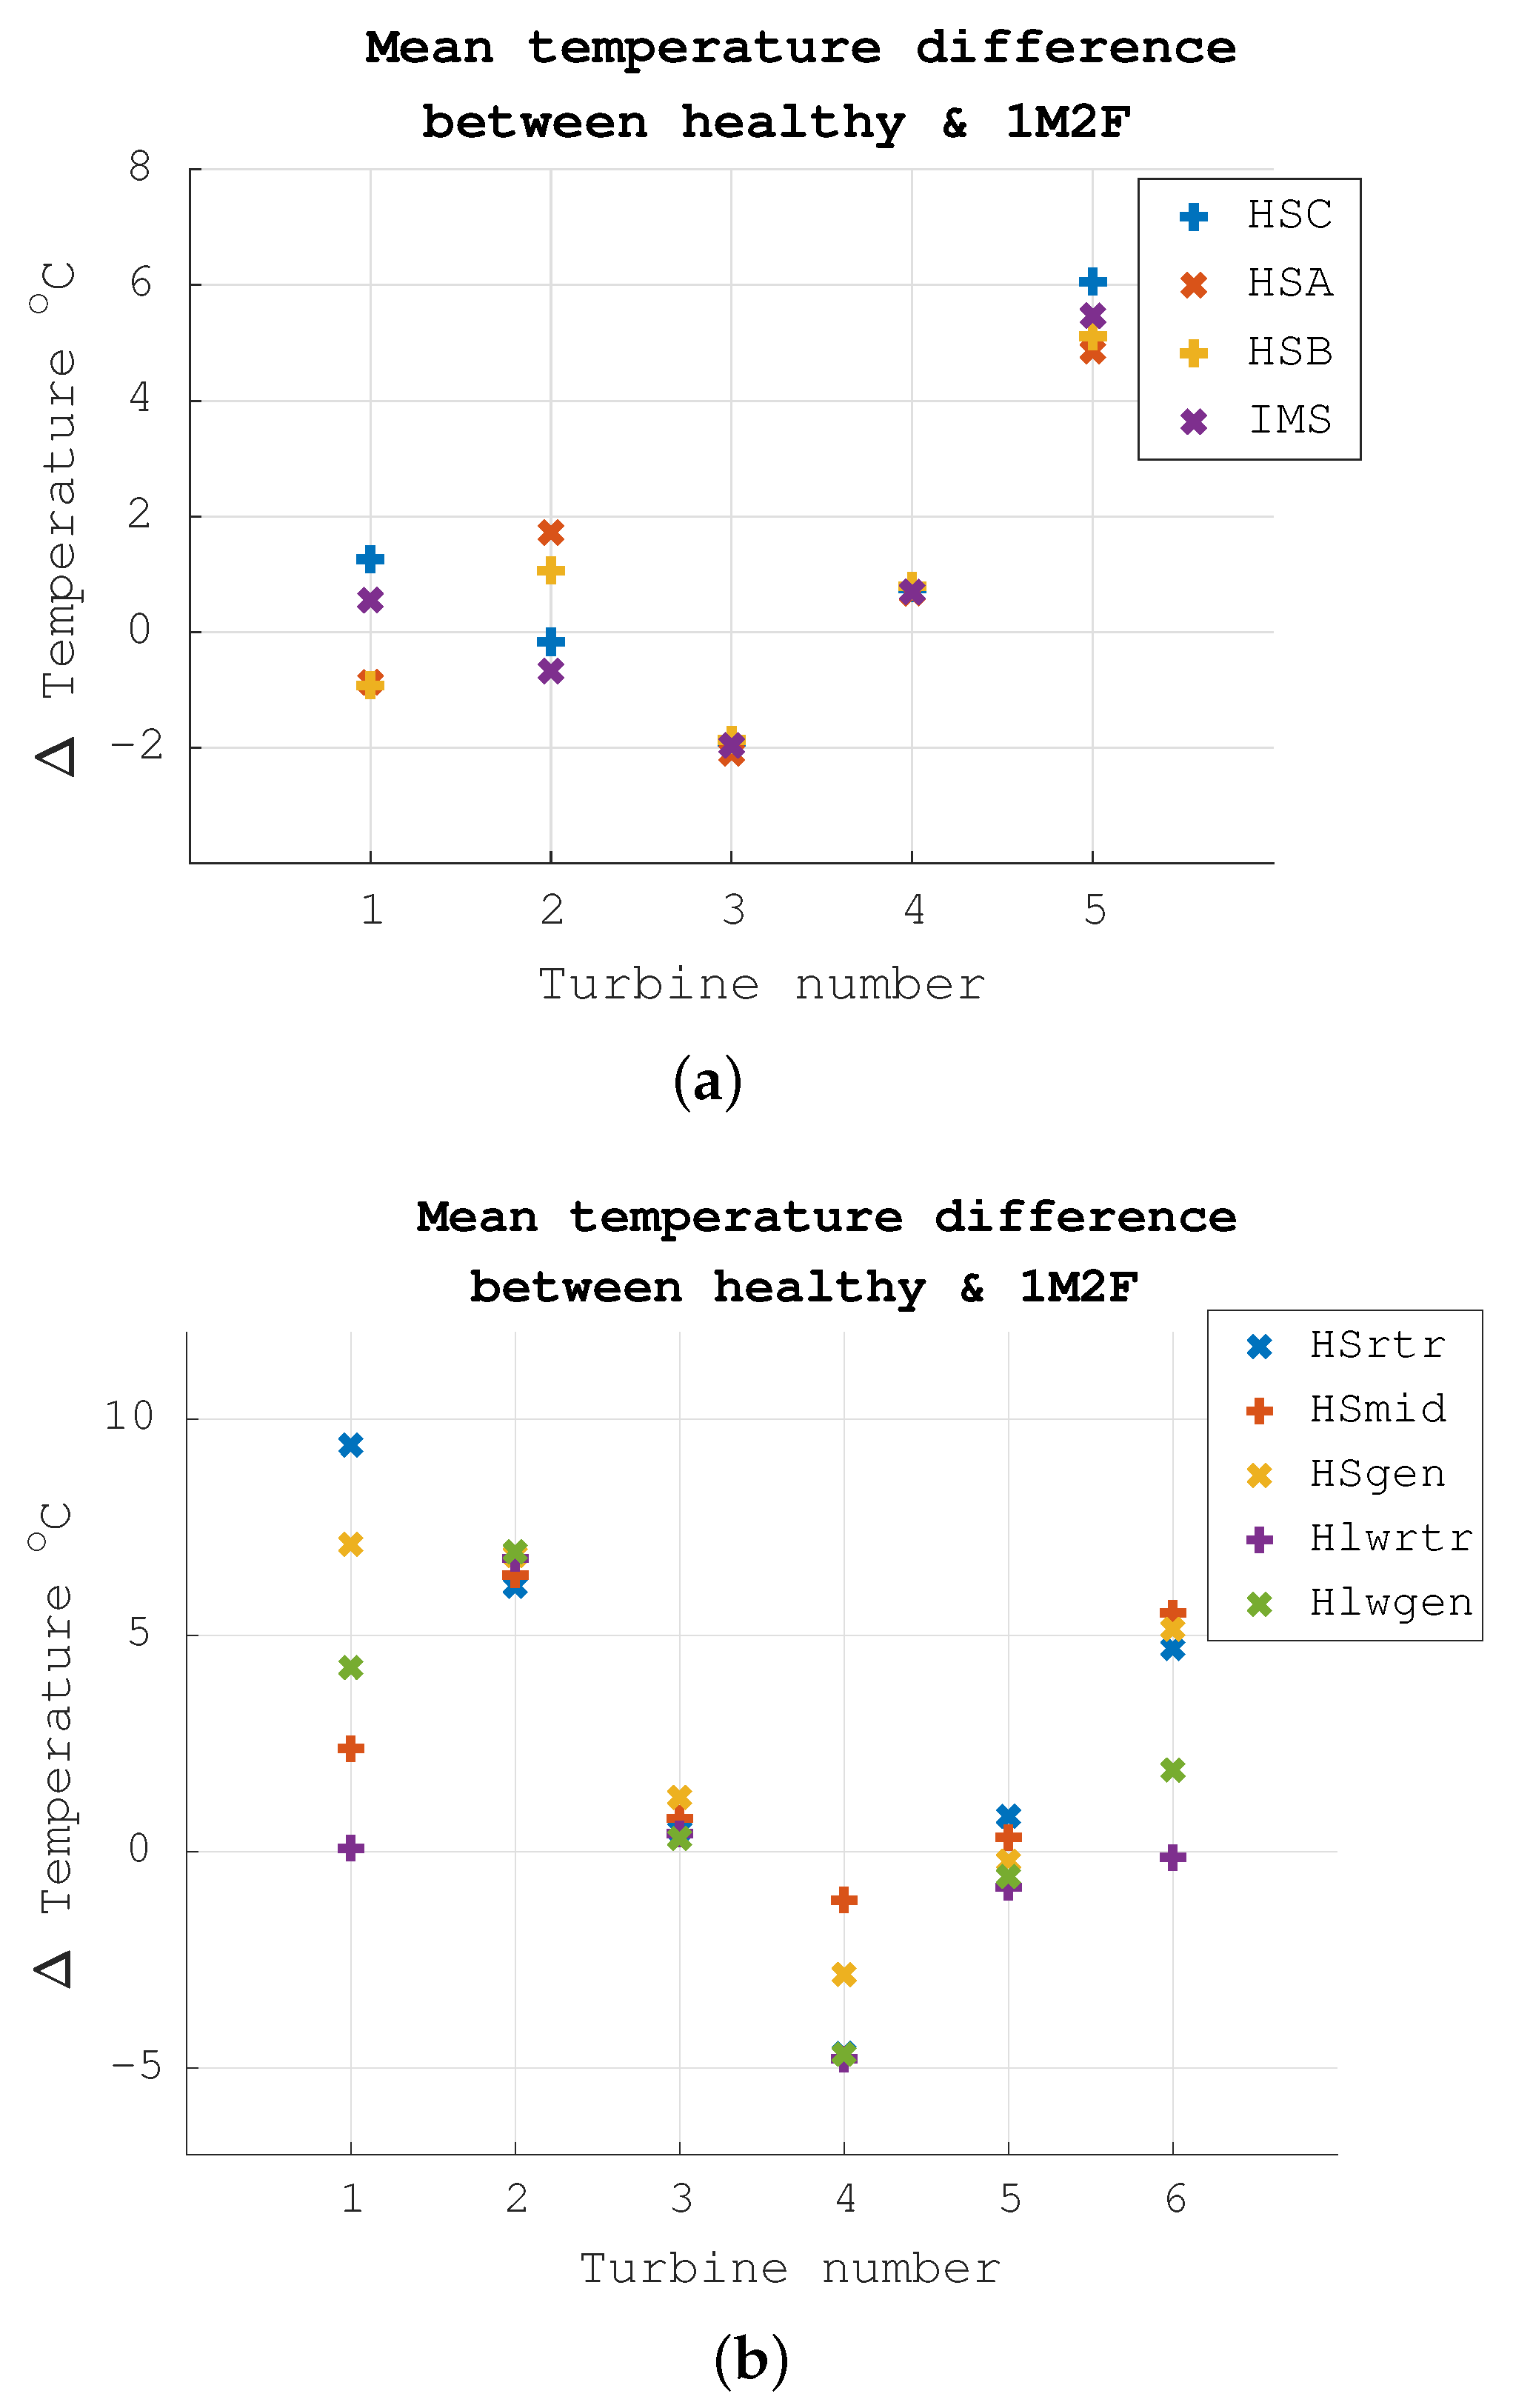
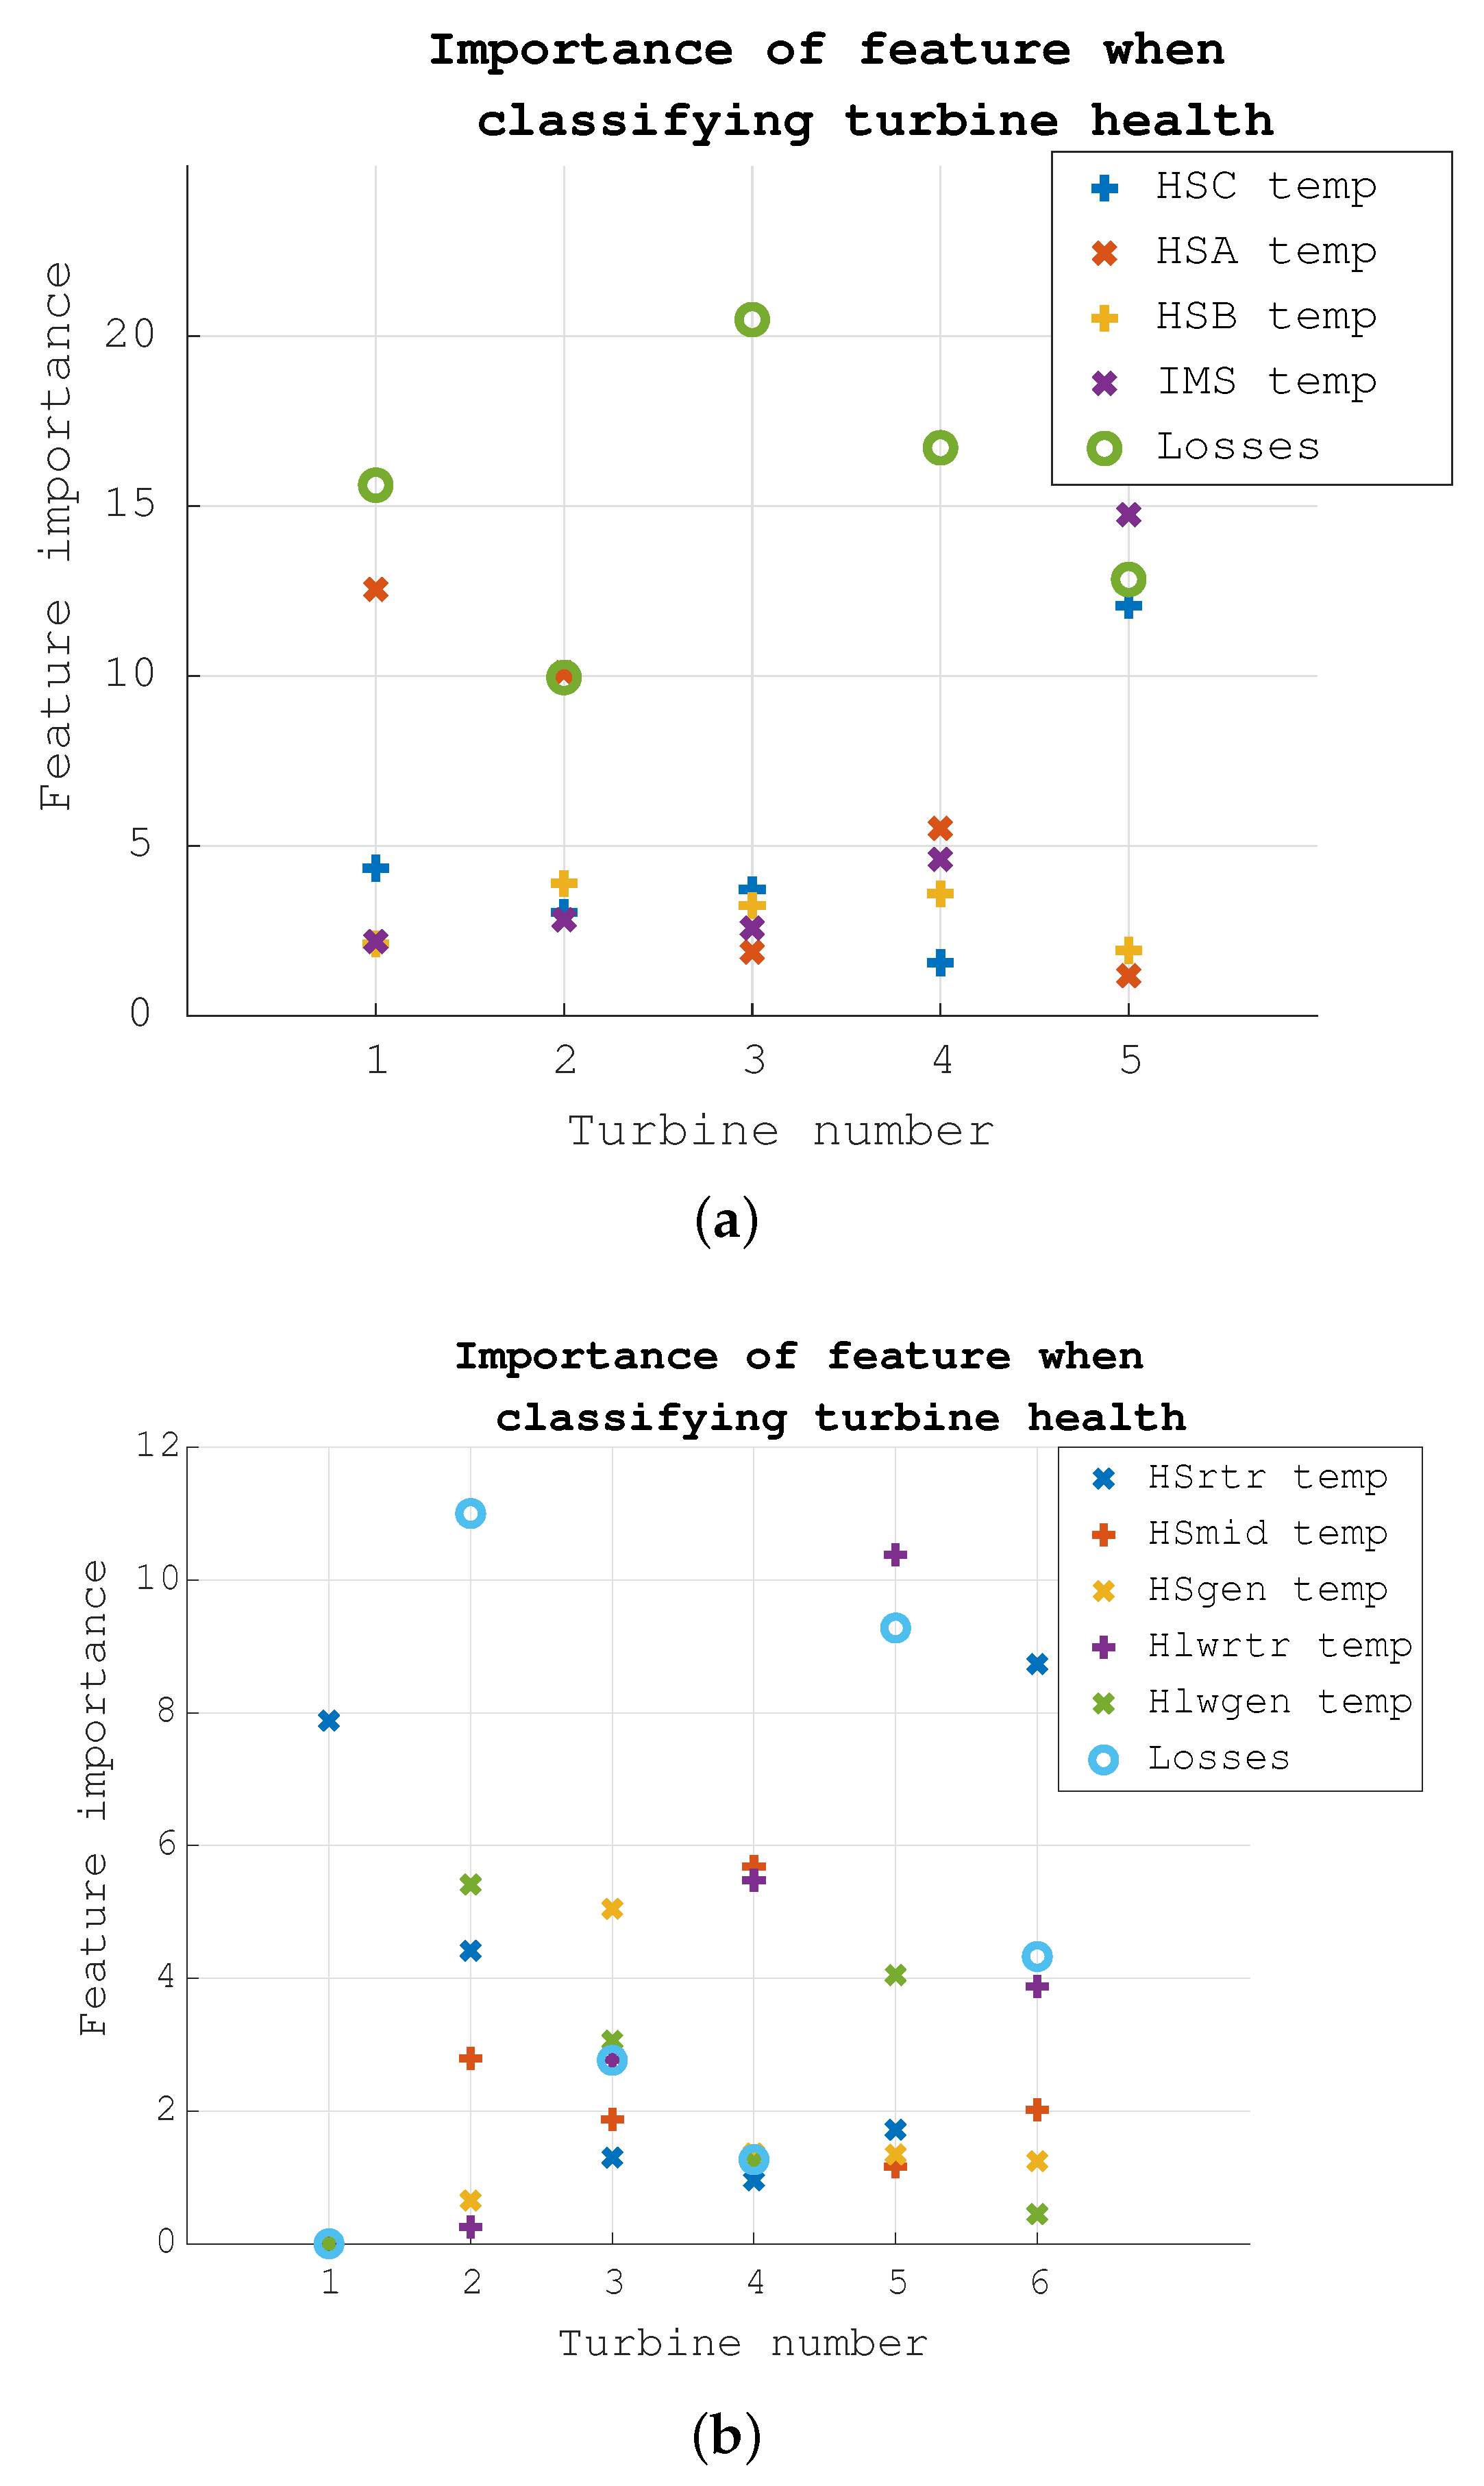
4.1.2. PFI
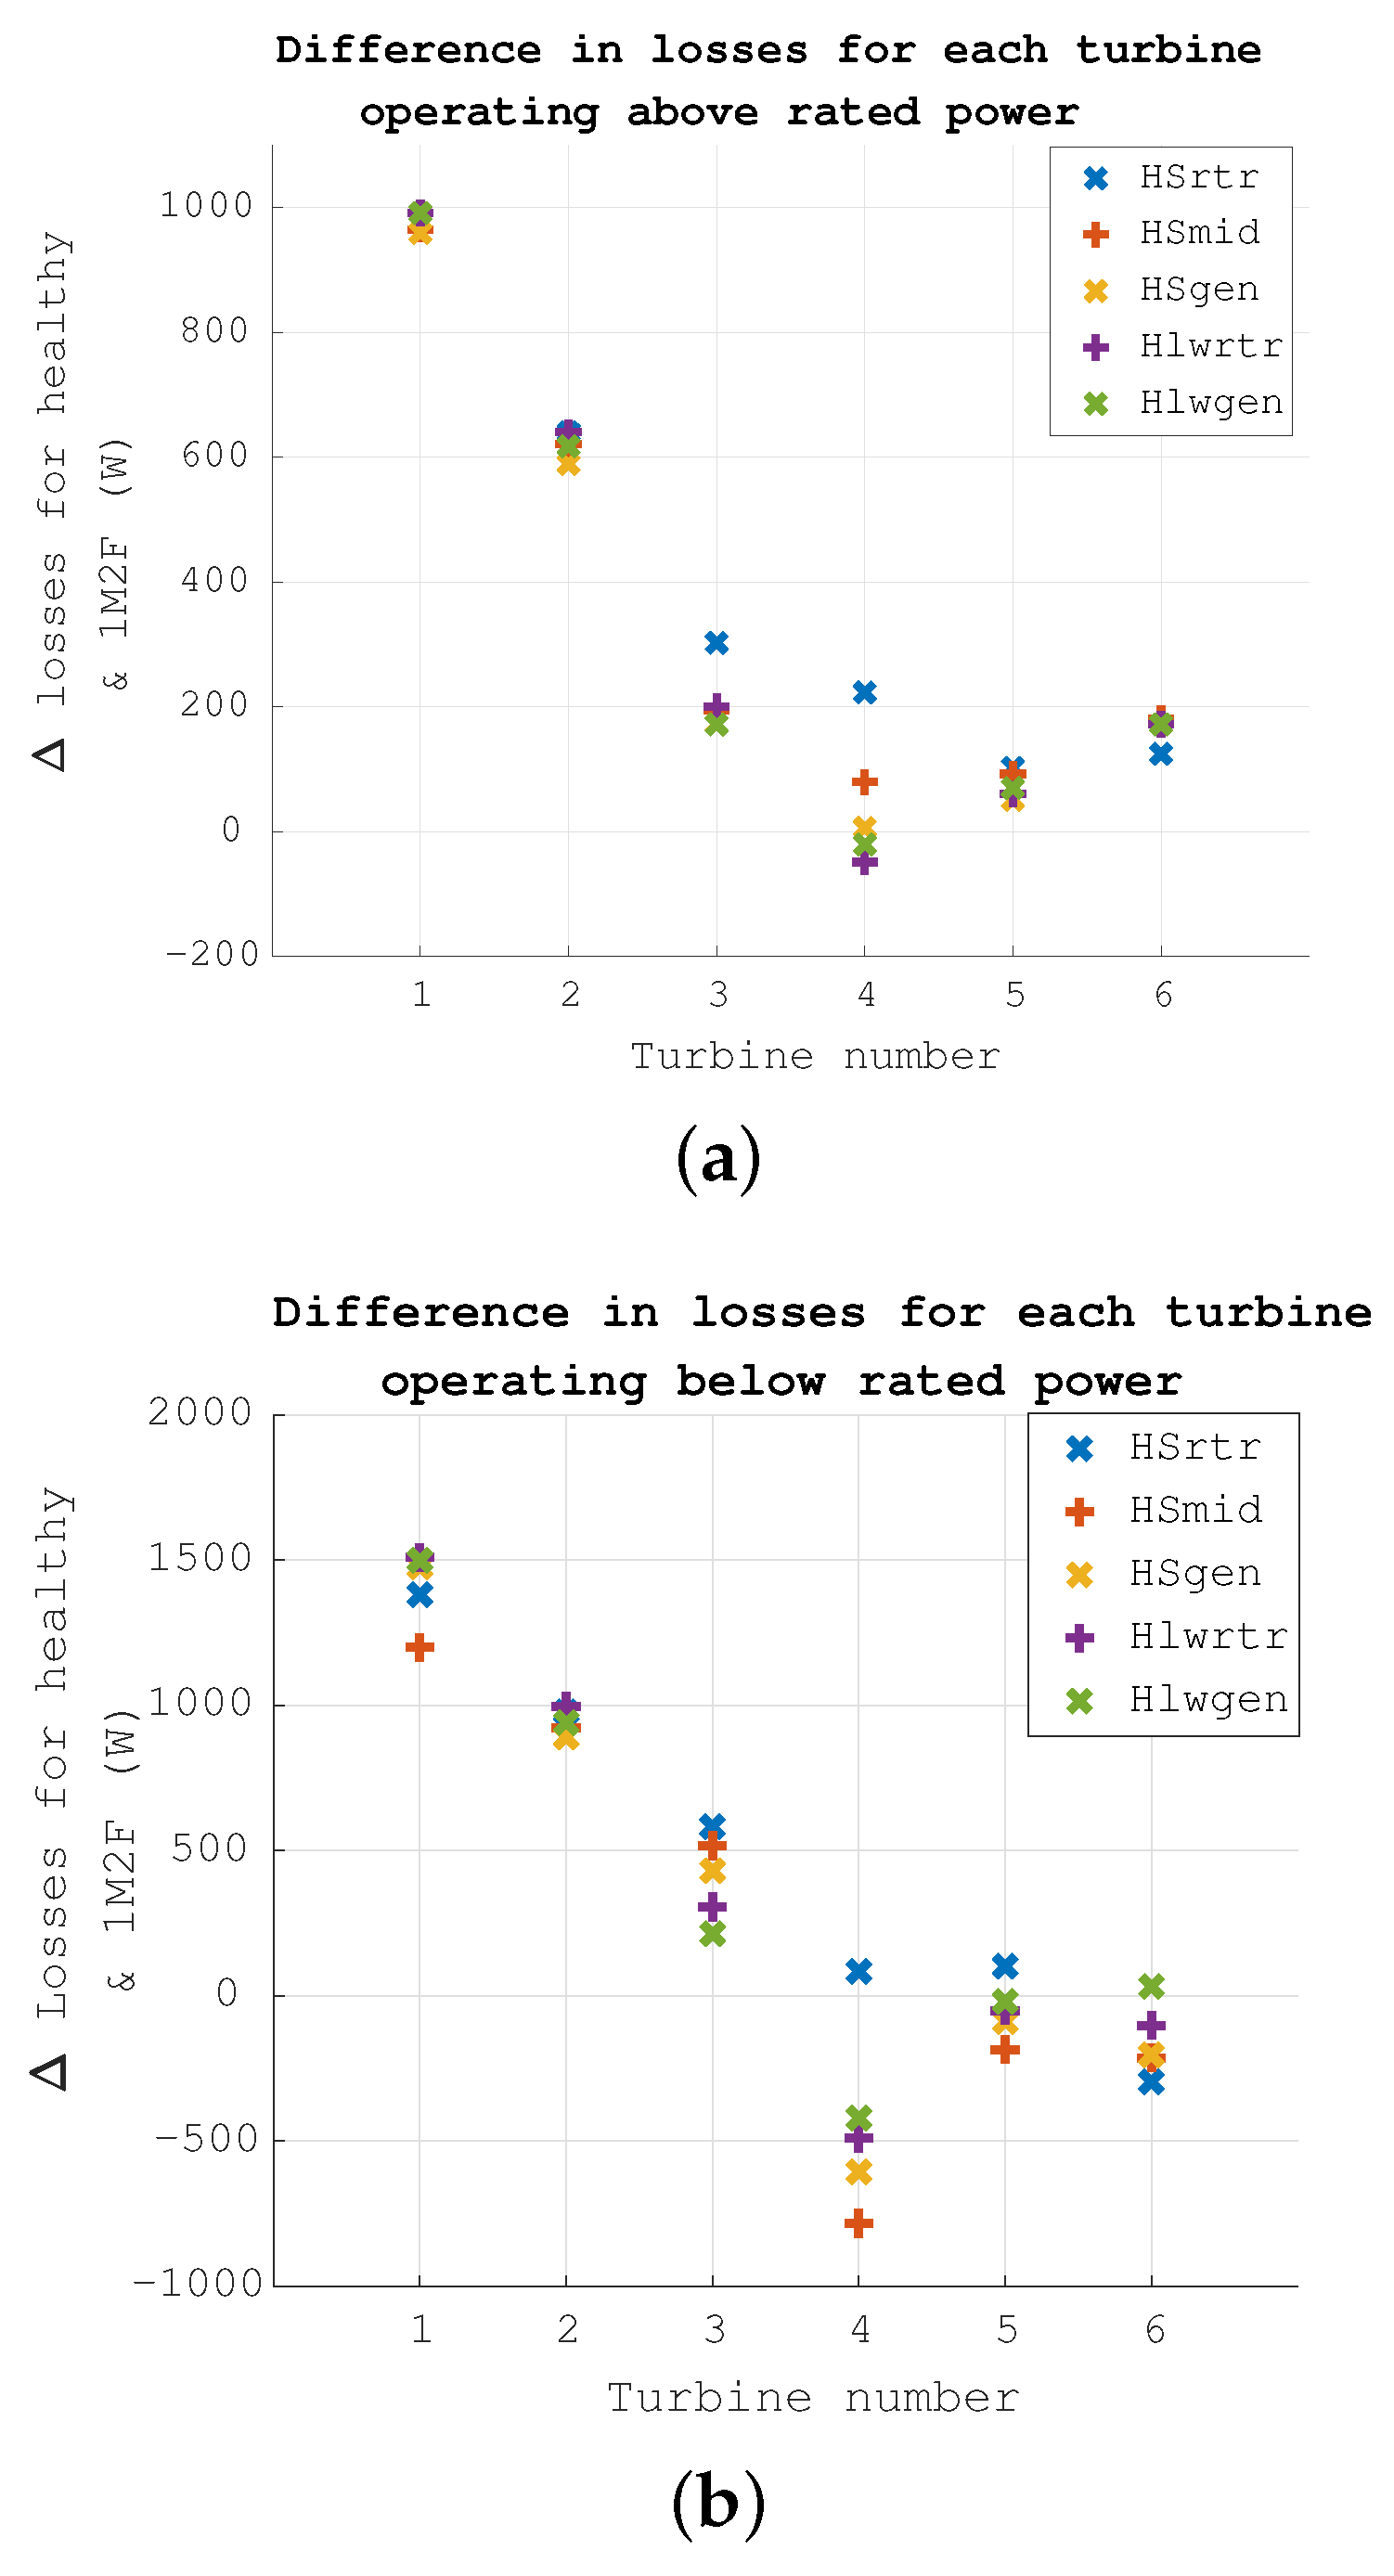
4.2. Dataset 2
4.2.1. Thermal Network Model
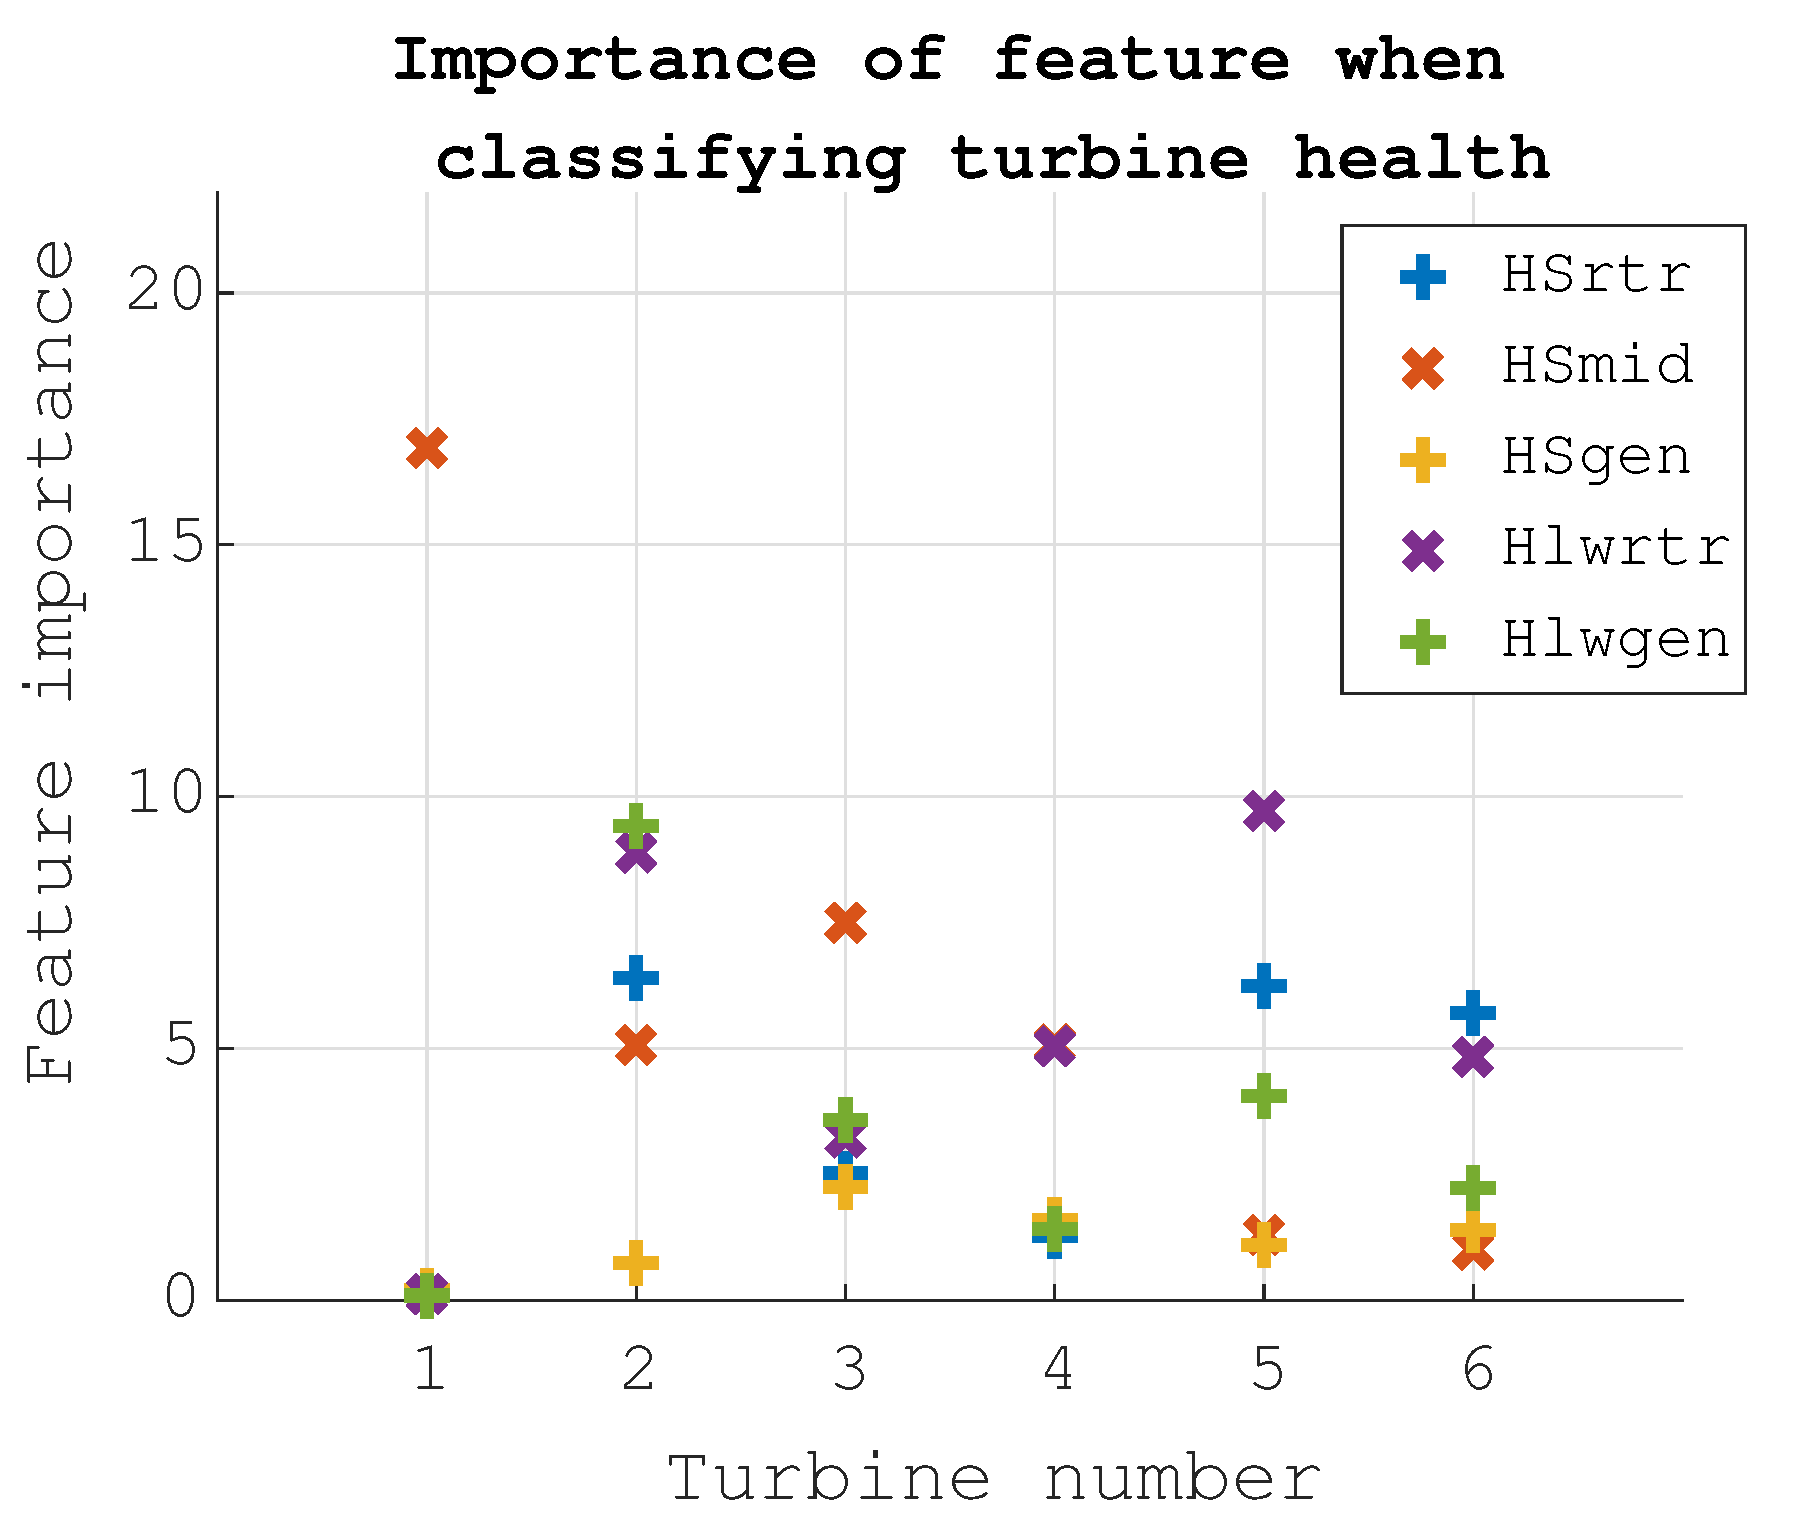
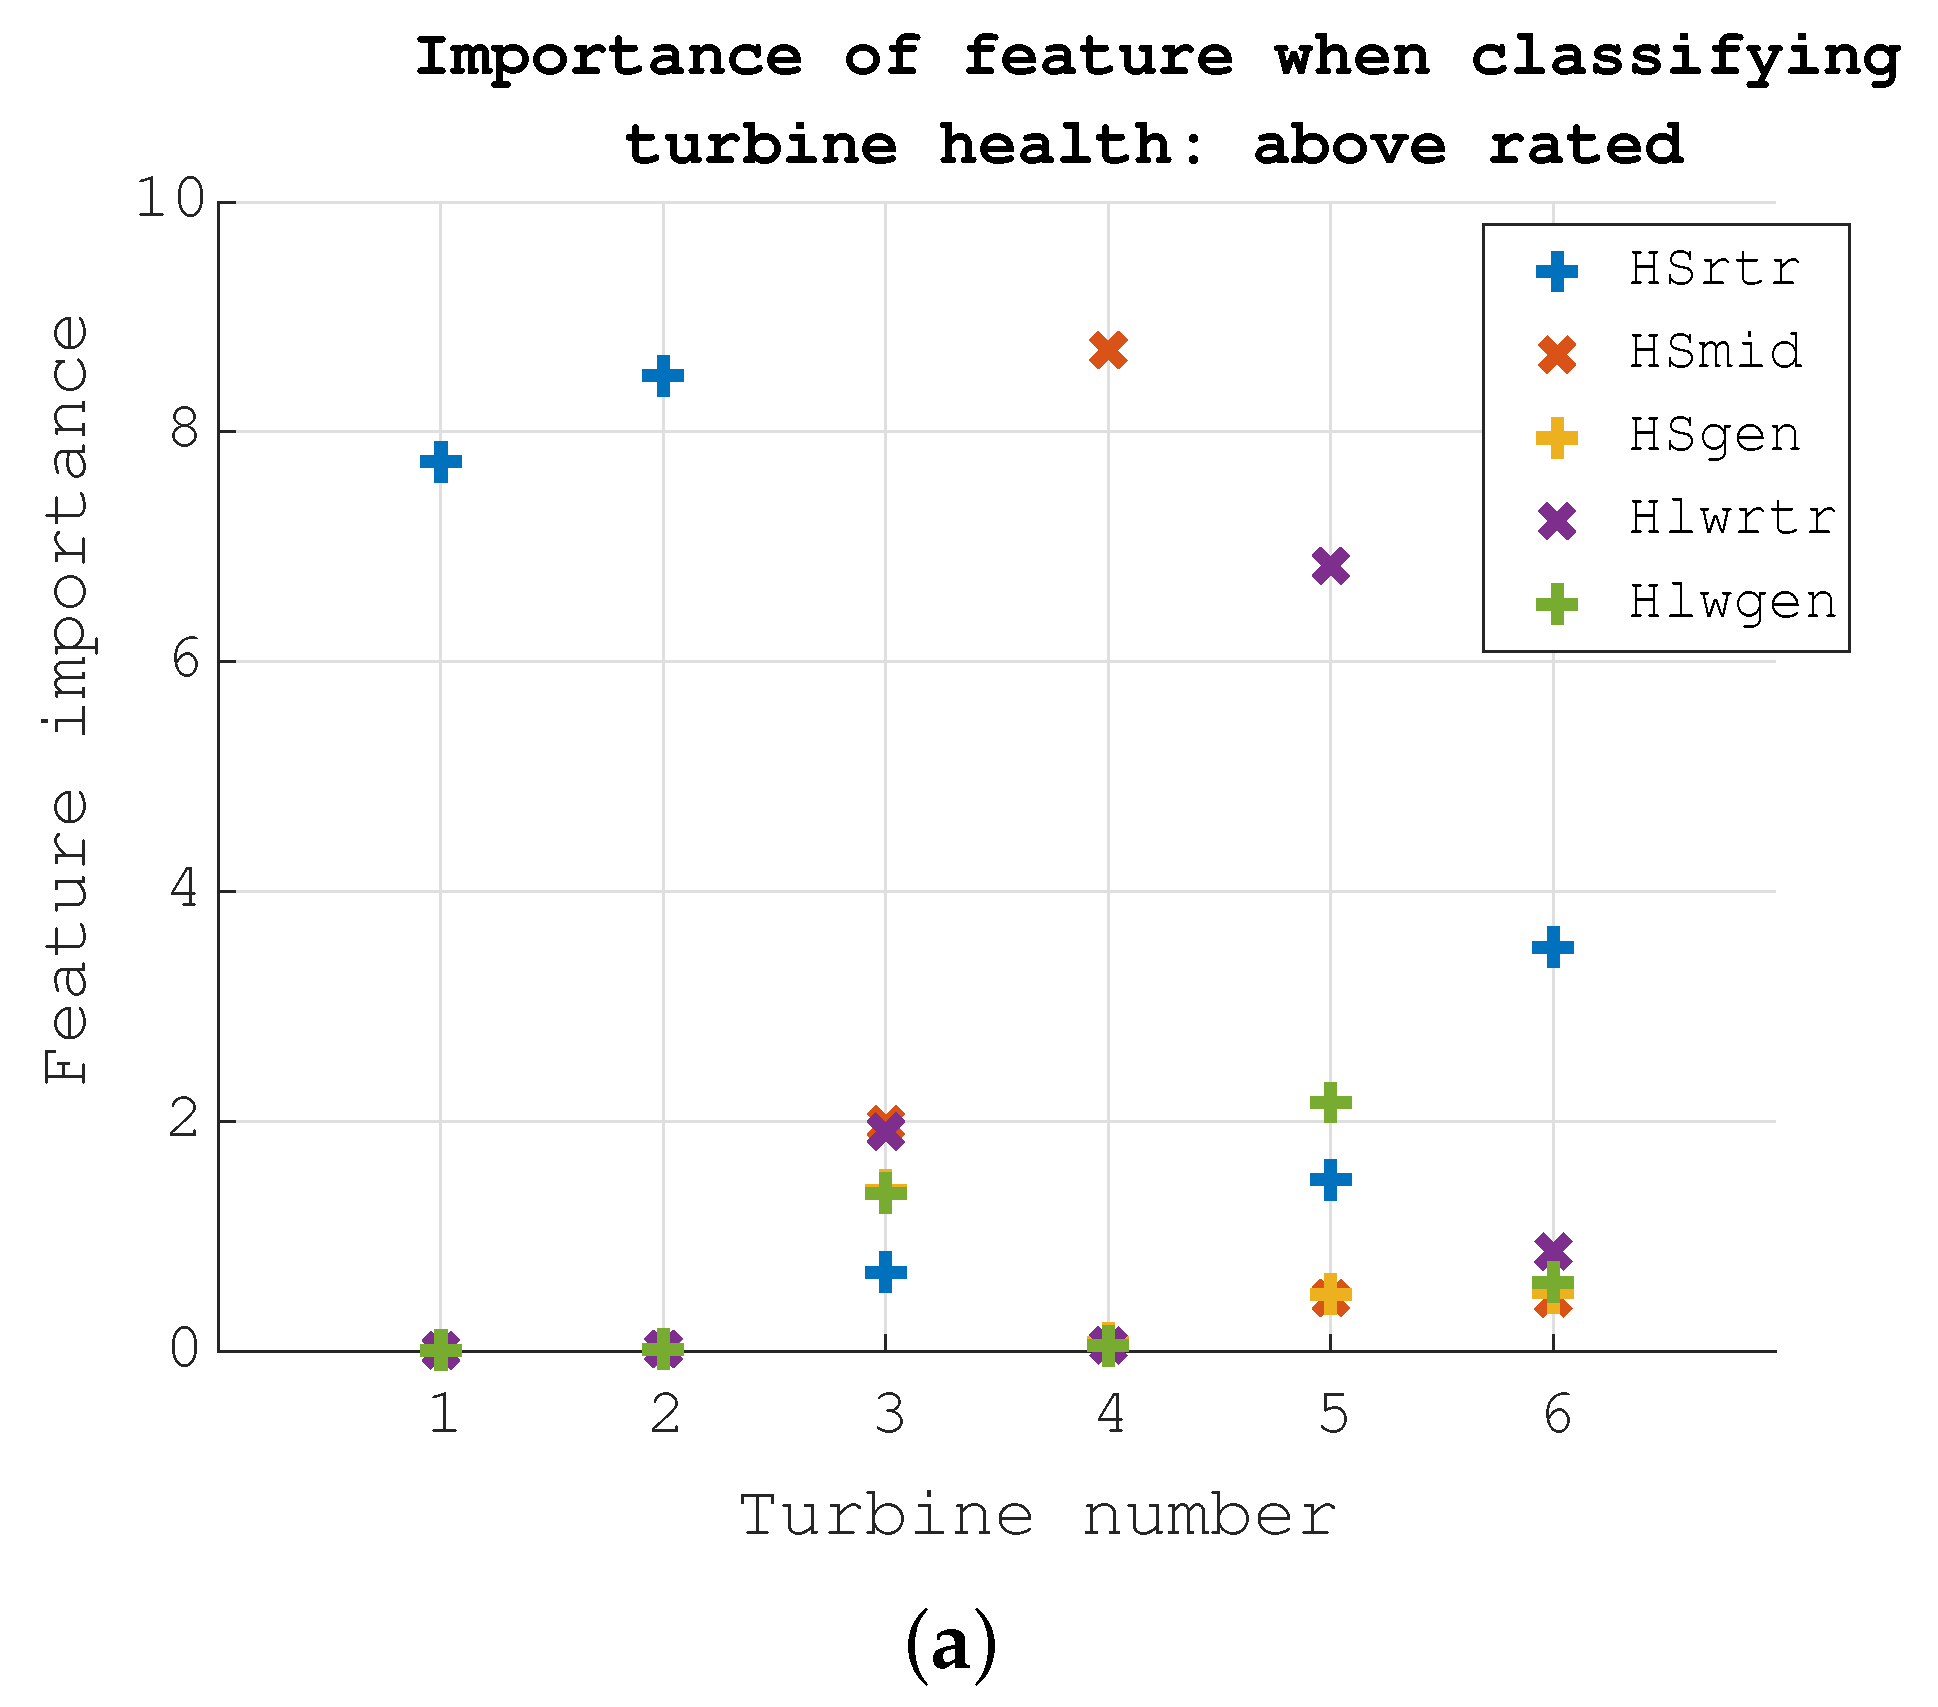
4.2.2. PFI
5. Discussion and Combining Approaches
Combining Thermal Modelling and Machine Learning Approach
6. Future Work
7. Conclusions
Author Contributions
Funding
Conflicts of Interest
Nomenclature
| Q | Heat flow (W) | h | Heat transfer coefficient (W m−2 K−1) |
| T | Temperature (K) | k | Thermal conductivity (W m−1 K−1) |
| R | Thermal resistance (K W−1) | L | Length (m) |
| C | Thermal conductance (K W−1) | A | Area (m−2) |
References
- World Energy Outlook. Available online: https://www.iea.org/weo/ (accessed on 15 October 2018).
- Renewable Energy Directive | Energy. Available online: https://ec.europa.eu/energy/en/topics/renewable-energy/renewable-energy-directive/overview (accessed on 21 November 2019).
- Jantara, V.L.; Papaelias, M. Non-Destructive Testing and Condition Monitoring Techniques for Renewable Energy Industrial Assets, 1st ed.; Butterworth-Heinemann: Oxford, UK, 2020; pp. 69–90. [Google Scholar]
- Crabtree, C.J.; Feng, Y.; Tavner, P.J. Detecting Incipient Wind Turbine Gearbox Failure: A Signal Analysis Method for On-line Condition Monitoring. In Proceedings of the European Wind Energy Conference, Warsaw, Poland, 20–23 April 2010. [Google Scholar]
- Nie, M.; Wang, L. Review of Condition Monitoring and Fault Diagnosis Technologies for Wind Turbine Gearbox. Procedia CIRP 2013, 11, 287–290. [Google Scholar] [CrossRef]
- Zaher, A.; McArthur, S.D.J.; Infield, D.G.; Patel, Y. Online wind turbine fault detection through automated SCADA data analysis. Wind Energy 2009, 12, 574–593. [Google Scholar] [CrossRef]
- Maldonado-Correa, J.; Martín-Martínez, S.; Artigao, E.; Gómez-Lázaro, E. Using SCADA Data for Wind Turbine Condition Monitoring: A Systematic Literature Review. Energies 2020, 13, 3132. [Google Scholar] [CrossRef]
- Colone, L.; Dimitrov, N.; Straub, D. Predictive repair scheduling of wind turbine drive-train components based on machine learning. Wind Energy 2019, 22, 1230–1242. [Google Scholar] [CrossRef]
- Tautz-Weinert, J.; Watson, S.J. Using SCADA data for wind turbine condition monitoring—A review. IET Renew. Power Gener. 2017, 11, 382–394. [Google Scholar] [CrossRef]
- Bangalore, P.; Letzgus, S.; Karlsson, D.; Patriksson, M. An artificial neural network-based condition monitoring method for wind turbines, with application to the monitoring of the gearbox. Wind Energy 2017, 20, 1421–1438. [Google Scholar] [CrossRef]
- Schlechtingen, M.; Ferriera Santos, I. Comparative analysis of neural network and regression based condition monitoring approaches for wind turbine fault detection. Mech. Syst. Signal Process. 2011, 25, 1849–1875. [Google Scholar] [CrossRef]
- Zhang, Z.Y.; Wang, K.S. Wind turbine fault detection based on SCADA data analysis using ANN. Adv. Manuf. 2014, 2, 70–78. [Google Scholar] [CrossRef]
- Astolfi, D.; Scappaticci, L.; Terzi, L. Fault Diagnosis of Wind Turbine Gearboxes through Temperature and Vibration Data. Int. J. Renew. Energy Res. 2017, 7, 965–976. [Google Scholar]
- Qiu, Y.; Feng, Y.; Sun, J.; Zhang, W.; Infield, D. Applying thermophysics for wind turbine drivetrain fault diagnosis using SCADA data. IET Renew. Power Gener. 2016, 10, 661–668. [Google Scholar] [CrossRef]
- Gray, C.S.; Watson, S.J. Physics of Failure approach to wind turbine condition based maintenance. Wind Energy 2009, 13, 395–405. [Google Scholar] [CrossRef]
- Koukoura, S.; Carroll, J.; McDonald, A.; Weiss, S. Comparison of wind turbine gearbox vibration analysis algorithms based on feature extraction and classification. IET Renew. Power Gener. 2019, 13, 2549–2557. [Google Scholar] [CrossRef]
- Feng, Z.; Zuo, M.J. Vibration signal models for fault diagnosis of planetary gearboxes. J. Sound Vib. 2021, 331, 4919–4939. [Google Scholar] [CrossRef]
- Liu, Z.; Zhang, L. A review of failure modes, condition monitoring and fault diagnosis methods for large-scale wind turbine bearings. Meas. J. Int. Meas. Confed. 2020, 149, 107002. [Google Scholar] [CrossRef]
- Zhao, H.S.; Zhang, X.T. Early fault prediction of wind turbine gearbox based on temperature measurement. In Proceedings of the IEEE International Conference on Power System Technology (POWERCON), Auckland, New Zealand, 30 October–2 November 2012. [Google Scholar]
- Cheng, Y.; Wang, Z.; Zhang, W. A Novel Condition-Monitoring Method for Axle-Box Bearings of High-Speed Trains Using Temperature Sensor Signals. IEEE Sens. J. 2019, 19, 205–213. [Google Scholar] [CrossRef]
- Touret, T.; Changenet, C.; Ville, F.; Lalmi, M.; Becquerelle, S. On the use of temperature for online condition monitoring of geared systems—A review. Mech. Syst. Signal Process 2018, 101, 197–210. [Google Scholar] [CrossRef]
- Mana, M.; Piccioni, E.; Terzi, L. Wind Turbine Fault Diagnosis Through Temperature Analysis: An Artificial Neural Network Approach. Diagnostyka 2017, 18, 9–16. [Google Scholar]
- Feng, Y.; Qui, Y.; Crabtree, C.J.; Long, H.; Tavner, P.J. Use of SCADA and CMS signals for failure detection and diagnosis of a wind turbine gearbox. In Proceedings of the European Wind Energy Conference, Brussels, Belgium, 14–17 March 2011. [Google Scholar]
- Astolfi, D.; Castellani, F.; Terzi, L. Fault prevention and diagnosis through SCADA temperature data analysis of an onshore wind farm. Diagnostyka 2014, 15, 71–78. [Google Scholar]
- Carroll, J.; Koukoura, S.; McDonald, A.; Charalambous, A.; Weiss, S.; McArthur, S. Wind turbine gearbox failure and remaining useful life prediction using machine learning techniques. Wind Energy 2019, 22, 360–375. [Google Scholar] [CrossRef]
- Lv, M.; Liu, S.; Su, X.; Chen, C. General Log-Linear Weibull Model Combining Vibration and Temperature Characteristics for Remaining Useful Life Prediction of Rolling Element Bearings. Shock Vib. 2020, 2020, 1–17. [Google Scholar] [CrossRef]
- Zeng, X.; Yang, M.; Bo, Y. Gearbox oil temperature anomaly detection for wind turbine based on sparse Bayesian probability estimation. Int. J. Electr. Power Energy Syst. 2020, 123, 1062332. [Google Scholar] [CrossRef]
- Rashid, H.; Khalaji, E.; Rasheed, J.; Batunlu, C. Fault Prediction of Wind Turbine Gearbox Based on SCADA Data and Machine Learning. In Proceedings of the 10th International Conference on Advanced Computer Information Technologies (ACIT), Deggendorf, Germany, 16–18 September 2020. [Google Scholar]
- Orozco, R.; Sheng, S.; Phillips, C. Diagnostic Models for Wind Turbine Gearbox Components Using SCADA Time Series Data. In Proceedings of the IEEE International Conference on Prognostics and Health Management (ICPHM 2018), Seattle, WA, USA, 11–13 June 2018. [Google Scholar]
- Glowacz, A. Fault diagnosis of electric impact drills using thermal imaging. Meas. J. Int. Meas. Confed. 2021, 171, 108815. [Google Scholar] [CrossRef]
- Janssens, M.; Loccufier, M.; Van Hoecke, S. Thermal Imaging and Vibration-Based Multisensor Fault Detection for Rotating Machinery. IEEE Trans. Ind. Inform. 2019, 15, 434–444. [Google Scholar] [CrossRef]
- Durand de Gevigney, J.; Changenet, C.; Ville, F.; Velex, P. Thermal modelling of a back-to-back gearbox test machine: Application to the FZG test rig. Proc. Inst. Mech. Eng. Part J J. Eng. Tribol. 2012, 226, 501–515. [Google Scholar] [CrossRef]
- Corley, B.; Carroll, J.; McDonald, A. Fault detection of wind turbine gearbox using thermal network modelling and SCADA data. J. Phys. Conf. Ser. 2020, 1618, 022042. [Google Scholar] [CrossRef]
- Koukoura, S. Wind Turbine Gearbox Diagnostics Using Artificial Intelligence. Ph.D. Thesis, University of Strathclyde, Glasgow, UK, 2019. [Google Scholar]
- Nembhard, A.D.; Sinha, J.K.; Pinkerton, A.J.; Elbhbah, K. Combined vibration and thermal analysis for the condition monitoring of rotating machinery. Struct. Health Monit. Int. J. 2014, 13, 281–295. [Google Scholar] [CrossRef]
- Nguyen Phuc, P.; Vansompel, H.; Bozalakov, D.; Stockman, K.; Crevecoeur, G. Inverse Thermal Identification of a Thermally Instrumented Induction Machine Using a Lumped-Parameter Thermal Model. Energies 2019, 13, 37. [Google Scholar] [CrossRef]
- British Standard. BS ISO/TR 14179-2:2001 Gears-Thermal Capacity-Part 2: Thermal Load Carrying Capacity; The British Standards Institution (BSI): London, UK, 2001. [Google Scholar]


| Dataset 1 | Dataset 2 | |
|---|---|---|
| Number of turbines | 5 | 6 |
| Fault location | HS bearing | Planetary bearing |
| Sensor locations | IMS bearing (IMS) | HS Rotor End (HSrtr) |
| HS bearing (HSA) | HS Mid (HSmid) | |
| HS bearing (HSB) | HS Generator End (HSgen) | |
| HS bearing (HSC) | HS-lower speed Shaft Rotor End | |
| Oil inlet | (Hlwrtr) | |
| HS-lower speed Shaft Generator End | ||
| (Hlwgen) | ||
| Oil inlet |
Publisher’s Note: MDPI stays neutral with regard to jurisdictional claims in published maps and institutional affiliations. |
© 2021 by the authors. Licensee MDPI, Basel, Switzerland. This article is an open access article distributed under the terms and conditions of the Creative Commons Attribution (CC BY) license (http://creativecommons.org/licenses/by/4.0/).
Share and Cite
Corley, B.; Koukoura, S.; Carroll, J.; McDonald, A. Combination of Thermal Modelling and Machine Learning Approaches for Fault Detection in Wind Turbine Gearboxes. Energies 2021, 14, 1375. https://doi.org/10.3390/en14051375
Corley B, Koukoura S, Carroll J, McDonald A. Combination of Thermal Modelling and Machine Learning Approaches for Fault Detection in Wind Turbine Gearboxes. Energies. 2021; 14(5):1375. https://doi.org/10.3390/en14051375
Chicago/Turabian StyleCorley, Becky, Sofia Koukoura, James Carroll, and Alasdair McDonald. 2021. "Combination of Thermal Modelling and Machine Learning Approaches for Fault Detection in Wind Turbine Gearboxes" Energies 14, no. 5: 1375. https://doi.org/10.3390/en14051375
APA StyleCorley, B., Koukoura, S., Carroll, J., & McDonald, A. (2021). Combination of Thermal Modelling and Machine Learning Approaches for Fault Detection in Wind Turbine Gearboxes. Energies, 14(5), 1375. https://doi.org/10.3390/en14051375