1. Introduction
Global warming is a complex phenomenon caused by, among other things, rising CO
2 concentrations in the atmosphere due to human activities [
1]. To counteract it, substantial reductions in emissions are critical, especially in the energy sector [
2]. Improving energy system efficiency, lowering energy demand, and transitioning from fossil fuels to renewable energy sources on the electrical supply side are essential [
3]. This transition will also enable an increased electrification of technologies that, as of today, remain dependent on fossil fuels on the demand side, such as the transportation sector [
4]. In 2019, the European Commission presented the European Green Deal with the target of being the first climate-neutral continent by 2050 [
5]. This deal covers all sectors of the economy, notably the transport and energy sectors.
Renewable energy sources, such as solar and wind, have transient properties due to weather and seasonal conditions [
6]. In parallel, demand patterns are hard to predict, especially for the transportation sector with the uncontrolled charging of electric vehicles [
7]. The resulting fluctuations do not necessarily match the generation on the supply side [
8]. Therefore, additional buffer capacities in the form of energy storage systems are needed to ensure grid operation [
9]. Grid imbalances are traditionally atoned for by large infrastructures such as hydropower plants. Such large solutions remain expensive and cannot be installed everywhere due to territorial limitations [
10]. Storing energy in stationary buffers such as battery energy storage systems (BESSs) in combination with modern computational methods for flexibility control is a promising avenue, since BESSs can be implemented almost anywhere in the grid. Such storage systems can be used autonomously, mostly as a small-scale unit such as in [
11,
12], or in an aggregated form, clustered, for example, in a virtual power plant in combination with other distributed energy resources [
13,
14]. In the case of autonomous optimization, the storage systems are individually controlled on-site, while in the case of a virtual power plant, the storage systems in the cluster are controlled centrally. In the latter case, BESSs would require a two-way communication to upload control commands and download measuring data [
15]. Autonomous control requires only unidirectional communication where an incentive is transmitted. This control method has been shown to be a robust and cost-effective alternative to centrally controlled approaches [
16]. BESSs in general have been proven to be a suitable measure for grid balancing purposes [
17,
18,
19] but remain expensive [
20].
To reduce BESS costs, second use batteries decommissioned from electric vehicles (EVs) could play an essential role in future grid management. With the rising deployment of EVs, a considerable number of decommissioned batteries will become available in the near future. Thus, technology reusing discarded batteries will become attractive. As an example, the market share of passenger EVs in Europe, including full battery electric vehicles and plug-in hybrid electric vehicles, already exceeded 3% in 2019 [
21]. Different scenarios and forecasts predict a substantial increase of EVs up to a 30% global market share by 2030 [
22]. Among various battery technologies, lithium-ion batteries are currently regarded as the most desirable for EVs, due to high power and energy capacities, as well as a long lifetime [
23]. With age and use, lithium-ion batteries reach a limit at which they are no longer suitable for electrified transportation. This limit is typically at 70–80% of the initial capacity [
24,
25,
26], which occurs after a service time of about eight years, depending on the utilization [
27,
28]. Although these batteries are no longer suitable for powering vehicles, the remaining capacity is sufficient for less demanding applications, such as in stationary storage applications for grid management purposes. Extending their life cycle by second use will also reduce their environmental footprint [
29]. Researchers estimated that repurposed EV batteries could be used for a minimum of ten years in stationary storage applications, depending on the service [
24,
27]. To further optimize costs, the optimal storage design in terms of battery capacity-to-power ratio remains to be identified. Unfortunately, knowledge is limited since this ratio strongly depends on the application that requires novel battery control algorithms.
To address this challenge and find the optimal storage design and economic potential of BESSs in Europe (independent of first or second use batteries), a simulation study was performed. To this end, a battery control algorithm for grid balancing was developed based on previous work [
30,
31]. The algorithm is based on autonomous optimization minimizing an incentive which determines the battery operation, resulting in a charged, discharged, or idle mode. As previous research has shown [
32], BESSs as grid-balancing measures in low-voltage distribution grids need to be controlled by local, grid-motivated, and consumer-motivated incentives (as their energy demand or renewable fed-in) to compensate for residential imbalances between demand and supply. Thus, such incentives are appropriate for specific grid sections. BESSs balancing higher voltage grids need to be controlled by incentives that reflect more general conditions, such as supraregional markets like the day-ahead stock market price for electricity. The day-ahead price is determined for the upcoming day by offers from supply units and bids from consumers resulting in a supply and demand equilibrium price. It is traded on different time intervals, mostly on an hourly basis, reflecting the supply−demand situation for each interval. The day-ahead stock market prices vary among different countries and/or regions in Europe. By using different day-ahead prices, the varying economic potential of autonomously controlled, grid-connected BESSs among different European countries can be investigated.
To simulate the battery dynamics, a battery model was developed. This model makes it possible to constrain the optimization routine to ensure that the BESS will not be undercharged or overcharged. There are various possibilities to model the battery dynamics. According to [
33], three different types of models are used for specific purposes ranging from battery design and performance estimation to circuit simulation: (1) electrochemical models to understand the battery fundamentals and optimize the design aspects, (2) mathematical models for system designers, and (3) electrical models (equivalent circuit models), which are mainly used in electrical system simulation studies. The battery model used in this study is based on an equivalent circuit model. The parameters used in the model are based on real and available battery data from a stationary, second use BESS using spent Nissan Leaf batteries [
34].
2. Approach
The simulation study is based on the BESS setup, including auxiliary, electrical components, cf.
Figure 1. The battery is connected to the electrical grid via an AC/DC converter. This allows transforming AC power,
, to DC power,
, to charge the battery, and vice versa for discharging. The converter efficiency,
, is the AC/DC power conversion efficiency, while
is the battery efficiency.
The battery charges, discharges, or stays idle based on a decision function,
. The decision function is the result of an optimization routine. The optimization routine relies on an incentive,
, as well as information about the battery’s state of charge (SOC). As an incentive, various historic day-ahead stock market prices for electricity among different countries in Europe are used. Those prices depict electricity prices at an hourly rate. The optimization routine uses the daily published day-ahead prices. The optimization is carried out daily at noon, and it is assumed that the prices are known 36 h in advance. As indicated in
Section 1, the day-ahead price indicates the equilibrium between supply and demand and therefore reflects the present grid load. The incentive
may, however, be any constant incremental stepwise function.
2.1. Model
A mathematical battery model was developed in order to simulate battery dynamics in terms of SOC, cf.
Figure 1. Further, the model is needed to constrain the optimization routine, described in
Section 2.2, and to ensure that the BESS will not be undercharged or overcharged. The battery model is based on a stationary, second use BESS using spent Nissan Leaf batteries [
34]. In general, the battery dynamics are non-linear and are affected by various factors such as aging, ambient temperature, and battery chemistry [
35]. Non-linear characteristics are particularly noticeable when studying battery dynamics on a short-term scale, e.g., when starting to discharge a battery. However, when considering long-term studies as in grid balancing investigations with time scales from hours to years, they showed that linear battery models describe the battery dynamics with sufficient accuracy [
31]. Therefore, a linear battery model is used to describe the change in electrical energy content,
, also referred to as a change in SOC
where
is the DC charging/discharging power at a given time
, and
is the linear battery losses.
is dependent on the maximum DC charging/discharging power,
, by
where
represents the battery efficiency which needs to be divided by two since it comprises the losses for charging and discharging.
2.2. Optimization
As shown in
Figure 1, the battery operation is controlled by a decision function,
. The values of this function are floating values where the maximum charge power is applied if
, the maximum discharge power is applied if
, while the system is in idle mode if
. Thus, the DC charging/discharging power can be described by
An optimization routine searches for the optimal
by minimizing the incentive
. For a given time interval,
, the optimization is expressed as
for all times considered, i.e.,
The optimization problem is formulated with respect to AC power since the day-ahead stock market prices for electricity used as incentive function,
, are given for AC power. Since the battery is a DC system, cf. Equation (1), the battery model has to be modified to represent AC power by taking the converter efficiency,
, into consideration. During charging, AC power is drawn from the grid and converted to DC power. Due to conversion losses, the corresponding DC power must be lower than the AC power. This is described as
which in terms of AC power can be expressed as
During discharging, DC power is drawn from the battery. Thus, the corresponding AC power is lower than the DC power due to conversion losses. This is described as
Converters perform inefficiently—below 20% of their maximum power range [
36,
37]. Therefore, the floating values of the decision function,
, are limited to
for charging and
for discharging. To this end, the decision function,
, is expressed by
and
, describing charging and discharging separately. By introducing the AC power conversion and converter efficiency expressions, the optimization is formulated as
Constraints ensure that the SOC of the battery does not exceed the minimal or maximal operational energy limit,
and
, respectively, by
The energy content at a given time
, with the initial energy content
, can be calculated by
By accounting for operational limitations of the used converter, the decision variables,
and
, are constrained by
and
Both
and
can be 0, representing battery idle mode. Since
and
are floating values, additional Boolean variables inspired from the work in [
11] are used to ensure charging/discharging exclusion where
represents charging selected and
represents discharging selected
The resulting decision function,
, is calculated by
The economic potential is finally calculated based on the resulting AC power of the BESS (optimization result), and day-ahead stock market price for electricity for the same period
3. Results
The BESS operation is simulated by optimization using historic hourly day-ahead stock market prices. The optimization routine minimizes the day-ahead stock market price (objective function), resulting in the decision function (charge, discharge, or idle) of the battery.
Figure 2 shows an exemplary simulation study based on the day-ahead stock market price for the United Kingdom (N2EX) published by Nord Pool [
38]. The resulting decision function, floating between −1 and 1, represents the charging/discharging power, where −1 indicates maximum discharging power, 1 indicates maximum charging power, and 0 idling for the battery, cf.
Figure 2a. The simulation study emulates the battery operation based on daily day-ahead prices, which are published daily at noon. Thus, the optimization uses the corresponding 36 h of prices ahead (12 remaining intraday, and 24 h of new day-ahead price). The overlap of 12 h allows for a forecast of the day-ahead price development for the next day. Thus, it is ensured that the BESS is prepared in terms of its SOC, cf.
Figure 2b, to react optimally to the subsequent day-ahead price. In the exemplary case of
Figure 2, the day-ahead price after noon (indicated by the dashed line) is high compared to the previous 24 h. Thus, the battery pre-charges within the first 24 h to be able to sell energy the following day, resulting in economic benefits. The usable battery capacity in terms of SOC is limited between 10% and 90% of the available capacity, cf.
Figure 2b, to ensure that the battery is operated within safe conditions, avoiding undercharging or overcharging.
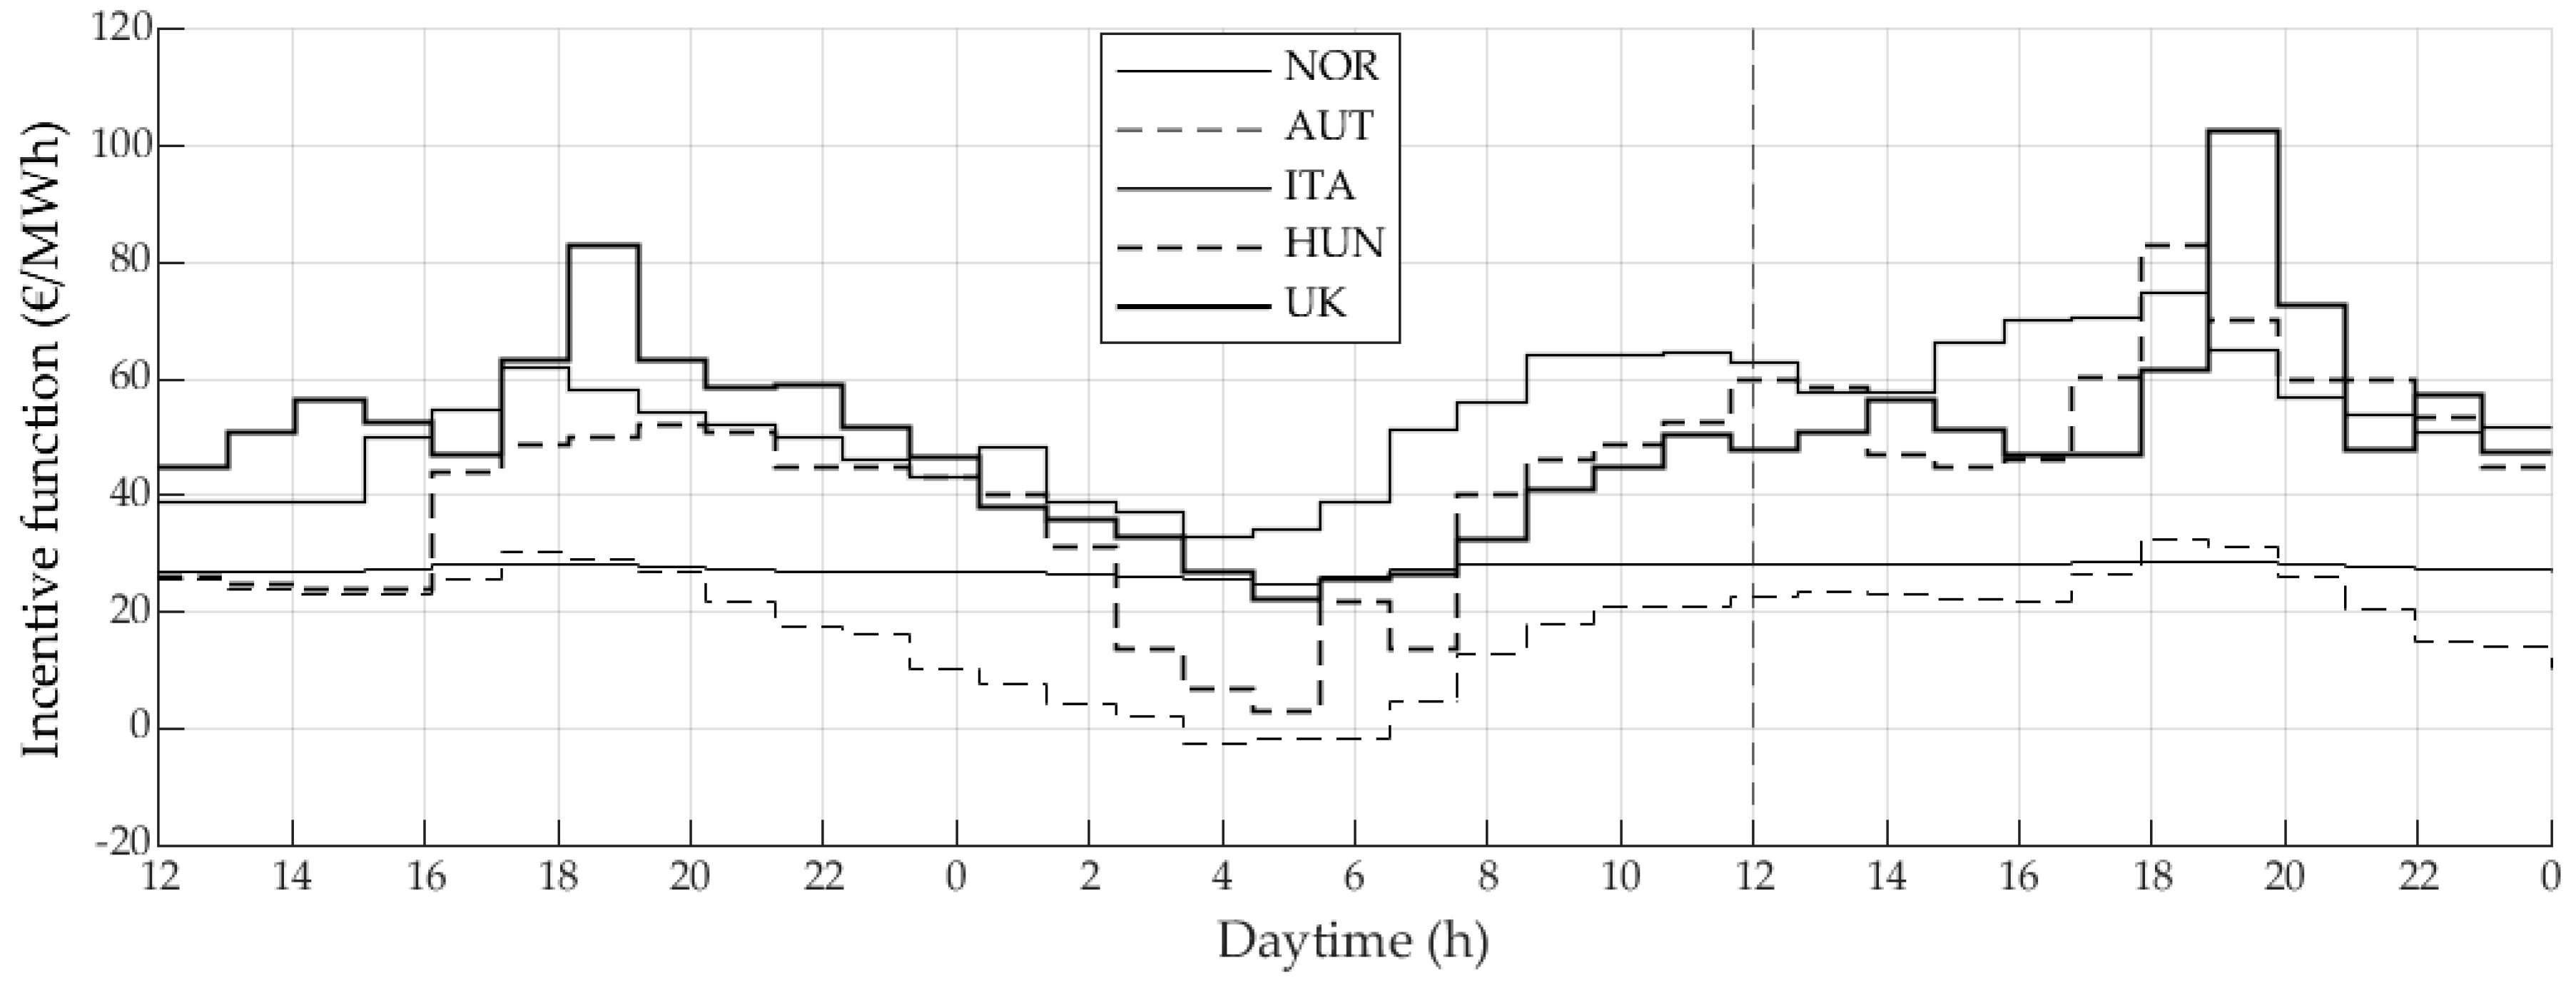
BESSs need to be optimized in terms of their capacity-to-power ratio to be optimally utilized to achieve economic benefits. This challenge has already been discussed in [
31] for historic day-ahead stock market prices in Austria. Whether the findings, in terms of capacity-to-power ratio, also apply to other countries, has however not been investigated. Therefore, the optimal capacity-to-power ratios among five different European countries from different cardinal directions are examined in this study: a northern country (Oslo, Norway), an eastern country (Hungary), a southern country (Italy, center-north), a western country (N2EX, United Kingdom), and a Central European country (Austria). The historic hourly day-ahead prices of those countries were received from the Nord Pool platform [
38], the European Network of Transmission System Operators for Electricity (ENTSO-E) platform [
39], and the Energy Exchange Austria (EXAA) platform [
40]. This study covers the period between 2015 and 2019. Exemplary hourly day-ahead stock market prices for electricity for the different countries are shown in
Figure 3.
The BESS model used in this simulation study is based on an existing BESS [
34]. This storage system is based on the first-generation Nissan Leaf batteries using lithium–manganese–oxide with nickel oxide [
41]. The battery capacity is given with
kWh with an assumed battery efficiency of
[
42]. Due to safety considerations, the battery operation is limited to 10–90% of
(10–90% SOC). The converter efficiency is given with
. Within the simulation study, the battery capacity remains constant. while the charging/discharging power is adjusted to investigate different capacity-to-power ratios. For the given historic hourly day-ahead prices, the capacity-to-power ratios are 0.5, 1, 1.5, 2, 2.5, 3, 3.5, 4, 5, 6, 8, 10, and 12. To assess the economic potential for different capacity-to-power ratios, two criteria are used: (1) the mean standard deviation (MSD) as already discussed by the authors in [
31] and (2) the mean relative change (MRC) within the 24 h optimization period for the respective year. The daily price fluctuations are assessed with the MSD, while the speed of the fluctuations is reflected in the MRC. The MSD is calculated by
The incentive
corresponds to the day-ahead price at the
jth hour of the
ith day, while
is the average day-ahead price of the
ith day. The MRC, which is the mean value of the absolute hourly differences between all daily hourly day-ahead prices divided by the mean value of the daily day-ahead prices, is calculated by
In the evaluation of this study, only 364 days were used since the simulation starts with the first day-ahead price published on 1 January at noon and ends with the last one published within the same year at noon on 31 December.
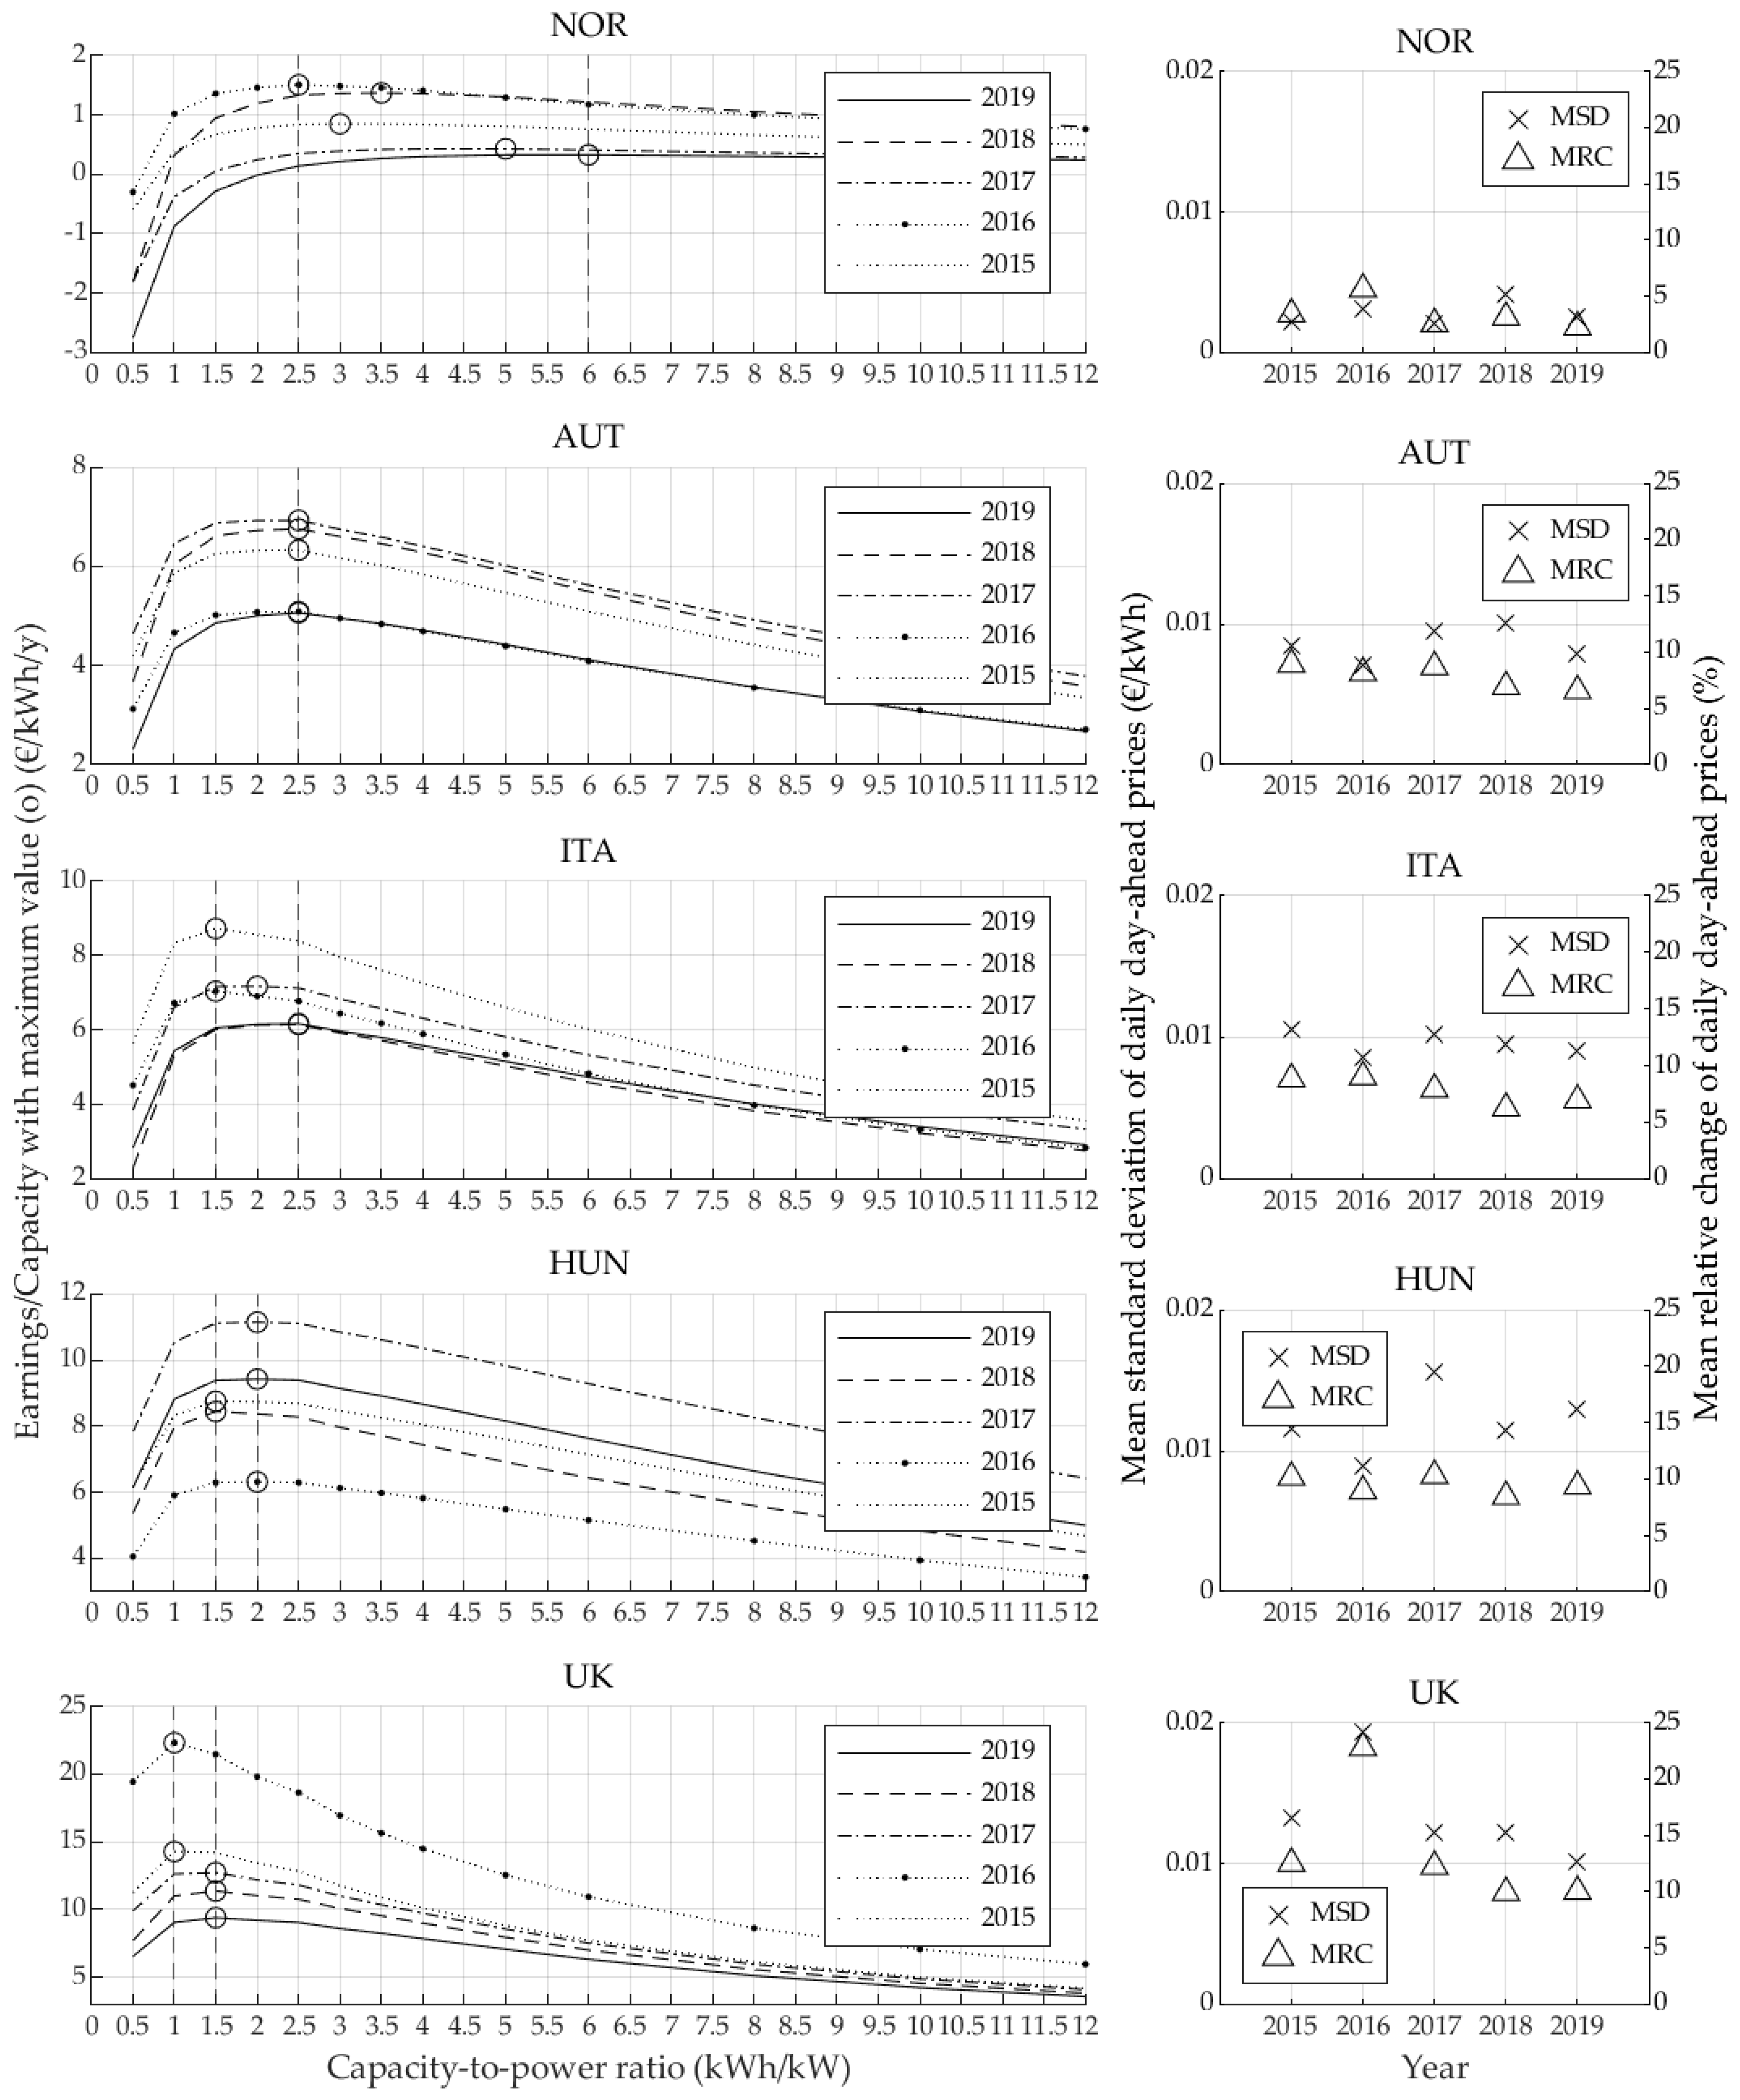
Figure 4 shows the simulation results in terms of earnings/capacity (€/MWh) for various capacity-to-power ratios among the different European countries for the years 2015–2019, the MSD, and the MRC. In addition, the maximum earnings/capacity for each country and year, depending on a specific capacity-to-power ratio, is indicated with (o).
4. Discussion and Conclusions
In this article, the optimal battery energy storage system design in terms of its capacity-to-power ratio, as well as the resulting economic potential among different European countries (Norway, Austria, Italy, Hungary, and the United Kingdom), were investigated. To this end, a simulation study based on autonomous optimization of historic hourly day-ahead stock market prices from 2015 to 2019 of the different countries was developed and performed. The battery model used is based on a real battery energy storage system using second use lithium-ion batteries. It is limited to a linear battery model, as described in
Section 2.1, since it has been shown that, for long-term studies (as in grid-balancing investigations), such models describe battery dynamics with sufficient accuracy. Further, battery degradation for optimal storage design and economic potential is not considered, since an appropriate model is dependent on the different capacity-to-power ratios, which were unknown before this study.
The simulation results, cf.
Figure 4, reveal a clear maximum for the earnings per battery capacity for the different capacity-to-power ratios for each year and country indicated by (o). In general, at low capacity-to-power ratios, the battery storage system does not have adequate capacity to function at the relevant timescale; at large capacities, the capacity is never fully exploited, resulting in lower economic potential. The economic potential varies significantly, ranging from a few Euro Cents in Norway for the year 2019, to more than 22 € in the United Kingdom for the year 2016. Further, the optimal capacity-to-power ratio varies significantly, ranging from 1 for day-ahead prices in the United Kingdom for the years 2015 and 2016, and up to 6 in Norway for the year 2019. To assess the economic potential for different capacity-to-power ratios, the mean standard deviation and the mean relative change were introduced.
A correlation between the mean standard deviation and the maximum economic potential, as well as between the mean relative change and the optimal capacity-to-power ratio could be observed. Small mean standard deviations of the historic hourly day-ahead prices lead to small earnings. This is especially the case for all Norwegian day-ahead stock market prices. It shows that with mean standard deviations of about 0.5 Euro Cents per kWh battery capacity, only earnings of about 1 €/kWh per year are possible. The mean standard deviations of the Austrian, Italian, and Hungarian hourly day-ahead stock market price indicate that with deviations of about 1 Euro Cent per kWh battery capacity, earnings of about 10 €/kWh per year can be achieved. The mean standard deviation of the historic day-ahead stock market price of the United Kingdom for the year 2016 indicates that with deviations of about 2 Euro Cents per kWh battery capacity, earnings of about 20 €/kWh per year can be realized. The simulation results also reveal that small mean relative changes lead to high capacity-to-power ratios. Small changes, lower than 5%, lead to capacity-to-power ratios which are greater than 3, as can be seen for the battery energy storage systems of Norway. For changes around 10%, the optimal capacity-to-power is between 1.5 and 3, as shown for battery energy storage systems simulated for Austria, Italy, and Hungary. For changes which are greater than 10%, such as for the changes in the United Kingdom’s day-ahead price for 2015 and 2016, capacity-to-power ratios of 1 are optimal. To conclude, high potential earnings can only be achieved by optimal system design optimized for the individual day-ahead price performance. Improperly designed systems could even lead to economic loss—as is the case for small capacity-to-power ratios for the Norwegian day-ahead stock market price.
The results achieved reveal that it is important to investigate the incentives used in autonomous battery optimization routines since they have a significant influence on the optimal battery energy storage system design. To operate battery energy storage systems profitably and maximize economic gain, the optimal capacity-to-power ratio must be identified, and measures must be taken to guarantee the reduction of the initial energy storage system cost by, e.g., using second use batteries. The simulation study indicated differences in earnings/capacity between the selected European countries. The investigation was limited by the restricted availability of the historic day-ahead stock market data. Future research should thus focus on different European and non-European countries and concentrate on developing algorithms, taking the capacity-to-power ratio into account to further improve the economic gains of BESSs. In addition, battery degradation should be modeled based on the different capacity-to-power ratios in order to account for the loss of usable capacity and power.


