Abstract
The article deals with the problem of detecting moisture in the walls of historical buildings. As part of the presented research, the following four methods based on mathematical modeling and machine learning were compared: total variation, least-angle regression, elastic net, and artificial neural networks. Based on the simulation data, the systems for the reconstruction of “pixel by pixel” tomographic images were trained. In order to test the reconstructive algorithms obtained during the research, images were generated based on real measurements and simulation cases. The method comparison was performed on the basis of three indicators: mean square error, relative image error, and image correlation coefficient. The above indicators were applied to four selected variants that corresponded to various parts of the walls. The variants differed in the dimensions of the tested wall sections, the number of electrodes used, and the resolution of the 3D image meshes. In all analyzed variants, the best results were obtained using the elastic net algorithm. In addition, all machine learning methods generated better tomographic reconstructions than the classic Total Variation method.
1. Introduction
Research teams all over the world have long been interested in investigating the level of moisture in the walls of historic buildings. Over the years, the issue of preserving valuable, old architectural objects in good condition for future generations becomes more important. Porous materials were used in the construction of most historic buildings. Usually, it was a ceramic brick that is very susceptible to the phenomenon of capillary leakage, otherwise known as rising damp. Capillary leakage is a physical phenomenon in which water in a porous material moves upward by capillary forces. There are many elements in the building through which moisture can penetrate the walls. In the case of historical buildings, the most common cause of moisture is faulty waterproofing of foundations or its complete absence. Defective insulation of foundations may cause long-term dampness of the walls, which in turn leads to the appearance of fungi, microorganisms, and molds that are harmful to health [1,2].
The water that penetrates the foundations contains various chemical compounds, such as sulfates, nitrates, chlorides and carbonates. The salt contained in the water in particular has a destructive effect on plaster and the appearance of facades. The condition for effective drying of walls and their restoration is the correct location of the damp places and elimination of the cause of the problem by making appropriate repairs.
1.1. The Impact of Damp Walls on Energy Consumption and Costs
Moisture in walls of historical monuments is of great importance for economic reasons. Damp external walls limit the thermal insulation of the building. In practice, this means that the external walls will cool down faster, and thus increase the demand for thermal energy of the building. The level of dampness in walls is determined using the percentage of moisture by weight (Um). The permissible level of mass humidity of the U-value brick wall should not exceed Um = 3%. If the moisture content by weight exceeds Um = 5%, it is absolutely necessary to take steps to reduce it to the acceptable level [3].
Previous studies have shown that the increase in wall humidity increases the thermal transmittance (U-value (W/m2K)) by 30% to 50% or even by 50% to 100% [4,5,6,7]. The U-value indicator has a strong influence on the energy performance of residential buildings [8], which is especially important for buildings located in colder climates. In the case of negative temperatures, the water contained inside the walls may freeze, which results in the destruction of the walls, their bursting and erosion. Rising dampness in walls is usually accompanied by their salinity. Salt transported deep into the walls together with moisture has a negative effect on the plaster structure, the aesthetics of the facade and the appearance of the walls inside the rooms. In extreme situations, excessive salinity may disturb the internal structure of construction materials.
Damp and saline walls accelerate the degradation of the facade, which increases the frequency of renovation. Apart from the foundations, moisture can penetrate the walls of the building through air vents, external timbers like windows and doors, roof, chimneys and flashings, high ground levels, cracks in masonry, etc.
The need to automate the processes of monitoring various-purpose facilities – including industrial, military, medical or public facilities—necessitates the use of advanced IT techniques [9,10,11]. Due to declining costs and better availability of computing power, the cost-effectiveness of methods based on machine learning and other artificial intelligence techniques is increasing [12,13]. Monitoring the dampness in the walls of historic buildings is in line with the above needs of process automation.
1.2. Dampness-Related Health Risks in Buildings
Building wall humidity is usually correlated with indoor air humidity. In turn, the air quality, measured by the presence of fungi, bacteria and microorganisms, as well as the musty smell, affects the well-being and health of people staying indoors. This means that the level of humidity inside the building walls is clearly and strongly associated with an increased likelihood of negative health effects for residents, which include conditions such as asthma, rhinitis, rhinoconjunctivitis or other allergies. It should be noted that no specific humidity thresholds have been established and not all people are equally susceptible to the adverse effects of indoor humidity.
1.3. Methods of Measuring Humidity in Walls
The basic division of all methods of examining the moisture content of building walls concerns the criterion of the effects on the appearance and structure of the tested object, which the application of a given method brings. Taking into account the above criterion, the methods can be divided into destructive and non-destructive or invasive and non-invasive. Direct measurements are characterized by no need to perform additional calculations. As a result, the value of the measurand is obtained directly. However, it is impossible to make such measurements without physically separating the sample, which involves the necessity to violate the integrity of the tested object. Destructive, direct methods, i.e. gravimetry, are considered the most reliable.
For obvious reasons, when examining the walls of historical buildings, the use of destructive methods is highly undesirable. Any interference that affects the structure and appearance of historical buildings requires a special permit from the conservator of monuments or specific government institutions.
In the case of indirect measurements, the value of the measured quantity is obtained by appropriate recalculation of the results of direct measurements of other physical quantities correlated with the measured quantity [14]. As shown in Figure 1, the group of indirect, non-destructive methods is the most numerous. The reason is that this group of methods, although the most desirable because there is no need to damage the test object, is also the least effective. Determining the boundaries and levels of moisture inside a building wall is very difficult without the ability to physically separate and test the sample. For this reason, the known and currently used non-destructive methods have a number of shortcomings, which means that research into their improvement and development of new methods is constantly being conducted.
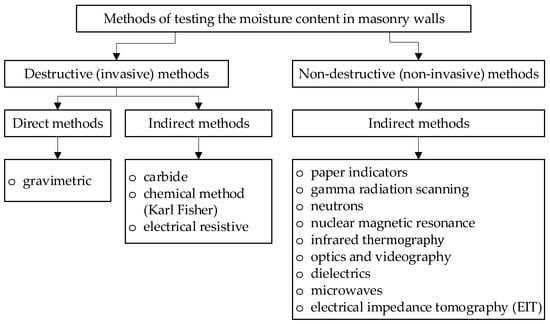
Figure 1.
Classification of methods for measuring humidity inside walls [1].
Electrical tomography includes impedance, resistance [15,16,17], and capacitance tomography [18,19,20,21]. Electrical impedance tomography (EIT) is a dynamically developing non-destructive method, successfully used to detect moisture inside the walls of buildings [22,23]. It is an indirect method in which the voltage values between multiple pairs of electrodes are measured [24]. The set of measurements obtained in this way is used to solve the so-called inverse problem. To do this, appropriate mathematical models, statistical methods or machine learning algorithms can be applied [25,26]. The methods based on mathematical modeling include total variation (TV). Algorithms such as least-angle regression (LARS), elastic net, and artificial neural networks (ANN) belong to the group of machine learning methods. There are several main advantages of the EIT method over other known methods:
- (1)
- It is a non-invasive method, and the supervisors of monuments do not allow the examination of historical buildings with invasive methods.
- (2)
- Using the EIT method, it is possible to visualize wall humidity in 3D space, which is not possible with other methods. For example, the thermographic method shows only the moisture of the visible wall, not the changes inside the object.
- (3)
- EIT is not influenced by salt and other chemicals present in masonry walls and bricks. Metallic components are also not a problem.
- (4)
- Inhomogeneities of the tested object (cracks, voids, presence of different materials in the wall) complicates the calibration but does not preclude the EIT method.
- (5)
- EIT can identify spatial areas with different moisture content.
- (6)
- EIT method allows to perform multiple reconstructions in a second. Measurements can be carried out in the same place continuously, which enables continuous monitoring of changes in moisture.
- (7)
- EIT allows deep penetration.
1.4. Objective of Research and Novelties
The aim of the research described in this article was to compare the efficiency of machine learning methods in applications related to tomographic detection of moisture in the walls of historical buildings. In particular, the algorithms performing tasks related to solving the inverse problem in electrical tomography were compared.
The major contribution of this paper is the verification of the effectiveness of detecting moisture in the walls of historical buildings using EIT by comparing selected algorithmic methods. The results of the research increase the current state of knowledge in two aspects. First, they provide reliable information on the effectiveness of electrical tomography in detecting moisture in the walls of historic buildings. Secondly, by applying strict quantitative criteria for each of the methods, the research paper provides the knowledge to evaluate and compare selected statistical and machine learning methods in the field of tomographic imaging.
An important element that distinguishes the presented approach to the inverse EIT problem is the use of many functions that simultaneously transform the measurements into individual pixels of the output image [27]. The number of these functions depends on the number of pixels that make up the image. Such an approach increases the overall computational complexity of the model but simplifies the partial computation by dividing the main problem into many sub-problems. In classic models, on the basis of a certain number of m measurements, an image with a resolution of n-pixels is created, where m << n. The applied solution makes n = 1 for each partial sub-problem, therefore m >> 1. As a result, the obtained tomographic reconstructions are more accurate compared to the classic EIT models.
1.5. Structure of the Paper
The article consists of four sections. Section one, Introduction, is theoretical. It describes the current state of knowledge in the field of moisture detection methods in the walls of historical buildings and the classification of these methods. The second section titled Materials and Methods describes the research object, which was a historical building. This section characterizes the tomographic hardware used in the research, the procedure of obtaining measurement data, and describes the mathematical and machine learning methods used in the research. The third section contains the research results obtained thanks to the use of particular algorithms in order to obtain the best quality tomographic reconstructions. The last chapter contains a discussion of the results obtained and conclusions preceded by an analysis of the key aspects of the research work carried out.
2. Materials and Methods
This section describes the historical building as a research object. The tomographic hardware used and the way of taking measurements was also included. The last part of this section presents the methodological basis of the statistical and machine learning methods used to solve the inverse problem in electrical tomography.
2.1. Historical Building as a Research Object
The object of research, i.e. the place where the research was carried out, were historic buildings located in the Partisan Hill area in Wroclaw, Poland. The first traces of buildings in this area date back to the Middle Ages when the city gate was built in the area of the hill, which was then called Sakwowy. Along with the expansion and strengthening of Wrocław’s city fortifications, in 1591, a bastion designed by Hans Schneider was erected on the hill. During the dismantling of the city fortification system in the first decade of the 19th century, the Sawkowy Bastion was one of the few buildings not pulled down. It was only deprived of military equipment and transformed into an observation hill of a park complex called the Old Town Promenade, which was created in the area of the former fortifications. In the 1860s, the hill was built over with a complex of entertainment and recreational buildings founded by Adolf Liebich and designed by architect Carl Schmidt. The complex consisted of a belvedere with an observation tower, a colonnade, and a peristyle pavilion on the plateau of the hill, which was integrated with a terrace arrangement into the western slope of the hill (Figure 2). The colonnade building shown in Figure 3 is two-story, one floor of which is underground.
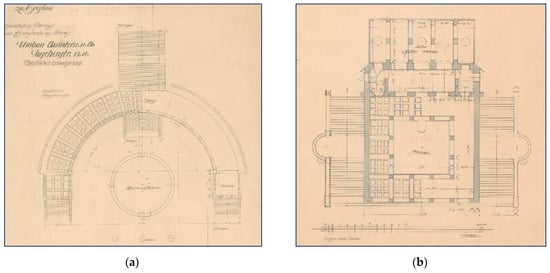
Figure 2.
Extract from the original documentation of buildings existing to this day: (a) colonnades; (b) peristyle pavilion (source: archives of the Museum of Architecture in Wrocław, Poland).
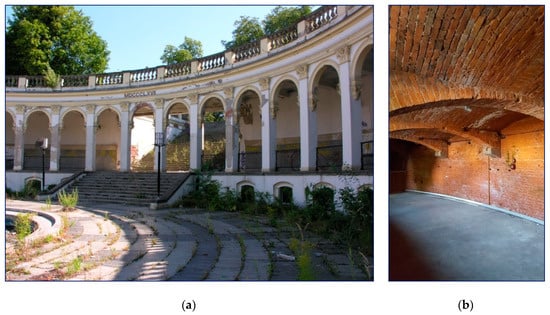
Figure 3.
View of the colonnade building from the outside (a) and underground (b).
On the other hand, the peristyle pavilion is one-story, partially recessed into the ground, as shown in Figure 4. The supporting structure of the buildings, i.e. the foundations, external and internal walls, and internal pillars, are brick walls made of solid ceramic bricks on a lime mortar. There are also brick vaults. The thickness of the brick walls is in the range of 50–90 cm. The walls are preserved in relatively good condition, they are not cracked or deformed, but they are strongly damp and are covered with salt blooms and mold fungi (Figure 3b and Figure 4b). These statements concern both the walls sunk into the ground and the walls above the ground level up to a height of about 2 m. In the joints between bricks, the lime mortar has crumbled to a depth of several centimeters due to moisture destruction and salt crystallization. The strong dampness of the walls is the result of the lack of horizontal and vertical anti-damp insulation.
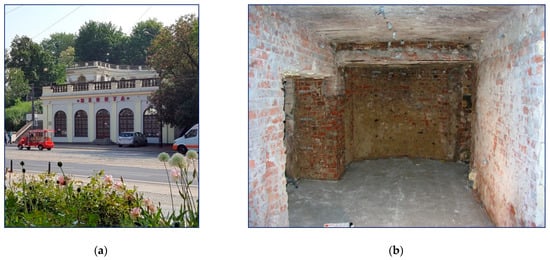
Figure 4.
View of the peristyle pavilion: outer facade (a) and the internal surface of the brick wall covered with crystallized salts and mold fungi (b).
2.2. Measuring System
Impedance tomography is based on imaging voltage drops measured between individual pairs of electrodes. Dry walls have lower electrical conductivity than wet walls, which affects the differences in voltages between different points of the walls. Solving the inverse problem, the tomograph creates an image of the internal dampness in the walls.
The measuring system used in the described experiments consisted of electrodes placed on metal rails and an EIT tomograph enabling imaging of the obtained measurement data. Measurements were made using a single rail containing 16 electrodes or a set of two rails containing a total of 32 electrodes. The simultaneous use of two rails extends the examined area of the walls, which speeds up the analysis of their moisture and improves the quality of imaging.
Figure 5 demonstrates the method of mounting the electrodes on a damp wall and shows the structure of the electrode rail. Metal electrode rails were designed to ensure the best adhesion of the electrodes to the walls even in the case of a rough surface. All devices, from electrodes to the prototype tomographic device, have been designed and manufactured in our own research laboratory. The number of measurements of a single case, making up the so-called measurement vector depends on the number of electrodes. If the measurement is performed using a single rail with 16 electrodes, then the measurement vector has 96 measurements. This is due to the adopted method of applying a voltage to successive pairs of electrodes and measuring the voltages on the remaining electrode pairs. Suppose the number of all electrodes is n = 16. Since the electrodes to which the voltage is applied are excluded from the measurement, n − 2 = 14 electrodes remain. The order and duration of measurements are controlled by the multiplexer. Since a pair of electrodes is used for a single measurement, we obtain the final number of electrodes participating in the measurement cycle n − (2 + 2) = 12.
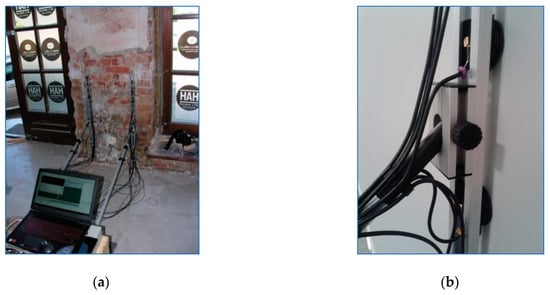
Figure 5.
The method of carrying out humidity measurements with the EIT tomograph: (a) tomograph with electrodes placed on special rails, (b) design of the rail with electrodes.
Each of the selected pairs of electrodes to which we apply voltage is called the projection angle. In this case, the number of projection angles is n/2 = 8. Finally, the formula for making the number of electrodes dependent on the number of measurements in a single measurement cycle takes the form (1):
where m is the number of measurements and n is the number of electrodes.
Taking into account the above Equation (1), the number of measurements for 16 electrodes is 96, and for 32 electrodes the measurement vector consists of 448 values. In the case of machine learning-based tomographic methods, it is necessary to provide a large number of measurement cases. When the measurements are performed manually, it is not possible to obtain several or tens of thousands of measurement vectors necessary for the iterative optimization procedure. In this situation, a measurement data simulator is used. To generate reliable measurement data, a very dense finite element mesh with a defined conductivity distribution was developed (Figure 6). Then, the simple problem thus defined was solved using the generalized Laplace Equation (2) [28].
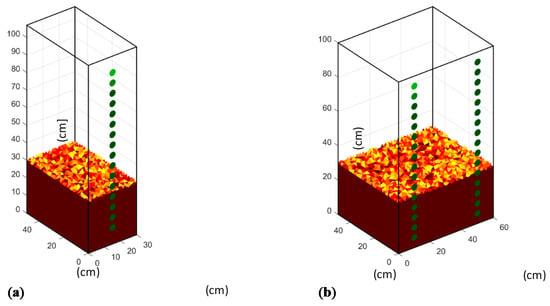
Figure 6.
Conductivity distributions defined for the purpose of creating simulation data frames on the very dense finite element mesh: (a) for 16 electrodes, (b) for 32 electrodes.
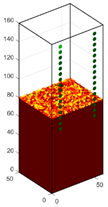
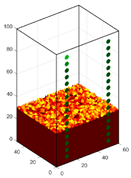
Figure 6 shows conductivity distributions defined for the purpose of creating simulation data frames. Using 16 electrodes, a part of the wall measuring 50 × 30 × 100 cm was examined. Using two rails with 16 electrodes each, a wall section with dimensions of 50 × 60 × 100 was tested. In this way, we obtain simulation measurement data. Pixels in the 3D images are tetrahedra. In the mathematical sense, we have a boundary between the dry and wet areas. The transition color applies to tetrahedra located on this border. Colors are set by volume—the greater the volume of the wet (lower) part of the tetrahedron, the darker its color.
2.3. Compared Methods of Creating a Tomographic Image
Taking measurements is very important because noisy data reduces the amount of information it contains, which in turn makes it unhelpful. However, data collection is only the first step in the tomography process. The next step is to transform the data into an image, which entails the need to solve the inverse problem.
The classic approach to formulating mathematical models takes into account forward problems, which in the case of electrical tomography would mean determining the values of voltage measurements made on the wall surface based on the known electrical conductivity of the tested object. However, the purpose of tomography is quite the opposite. It is the determination of the electrical conductivity of individual parts inside the monitored object based on measurements made on the surface of the tested object. This is called the ill-posed problem because due to too little or too much data, it may not be possible to find a real solution. Inverse problems are often ill-posed problems, and to solve them, regularization methods or machine learning are used. The EIT forward problem can be represented by the generalized Laplace Equation (2):
where —electrical conductivity, —electric potential, —angular frequency, —permittivity.
Equation (2) describes a potential distribution in a heterogeneous, isotropic area. If is the operator that takes the Dirichlet to Neumann map , where n is the outward normal vector then the inverse problem is to find σ from . Solving the inverse problem, we obtain the distribution of material coefficients inside the tested wall. Figure 7 shows the concept of generating a tomographic image "pixel by pixel" using the full vector of input variables to create single pixels.
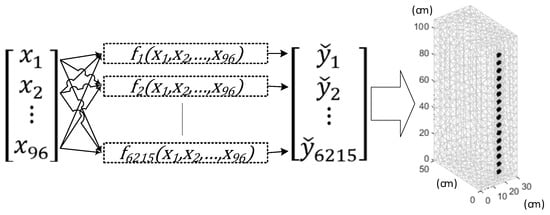
Figure 7.
The concept of transforming the measurement vector x into a set of individual pixels of the reconstructed images by using a multifunctional approach.
In the presented research, the effectiveness of four selected methods were compared: total variation (TV), least-angle regression (LARS), elastic net (EN), and artificial neural networks (ANN). Each of the compared methods is briefly characterized below.
2.3.1. Total Variation (TV)
Suppose the test object can be divided into a finite number of piecewise constant conductivity sub-areas. The reconstruction of the inside image of such an object, obtained by means of generalized Tikhonov regularization, contains a characteristic blur that does not allow for a precise indication of the border between sub-areas with different specific conductivities. Regularization by total variation regularization can be an effective way to avoid this effect. For these studies, the objective function was defined as follows:
where —electrical conductivity as a column vector (), —numerically calculated voltages as a column vector (), —voltages obtained with a tomograph as a column vector (), —number of finite element mesh edges (excluding edge boundaries), number of finite elements, —number of elements in the test voltage table . is a line vector in i-th iteration that represents the discrete approximation of a gradient operator. When a given edge belongs to two different finite elements, then this vector is given by Equation (4):
where is the length of the i-th edge. The vector has M elements, with only two components assuming values other than zero. Note that the regularization term defined as above is not differentiable at the points where the expression under the absolute value is zero.
In the case considered, the idea of image reconstruction is based on the application of the primal dual-interior point method. The primal problem is defined as:
The matrix is of the type and has elements other than zero only in the i-th row where is the Kronecker symbol.
2.3.2. Least-Angle Regression (LARS)
LARS is a method that allows the elimination of correlated input variables. The methods of converting measurements into tomographic images are the more effective the clearer are the relationships between individual independent variables (inputs) and dependent variables (outputs). If there are mutual correlations between the measurements, then the correlated input fields should be eliminated as they unnecessarily complicate the calculation model. The excessive complexity of the model results in lower imaging efficiency. The LARS algorithm is based on a linear model and takes into account only causal variables. In other words, the LARS method selects from the set of predictors only those exogenous variables that have a direct impact on the endogenous variable. The a linear model is built using stepwise regression. In each subsequent iteration, a variable of the highest quality is added to the model. Let’s assume that the considered system is described by Equation (6):
where is a matrix of input variables, denotes the matrix of responses, is a vector of unknown parameters, is a sequence of disturbances, n is the number of observations, i is the number of LARS predictors. If the linear model (11) contains the point of intersection with the axis, then the first column consists of 1’s. The variable is usually defined as a vector of random, independent, similar distributed variables with normal distribution, where is a vector of zeros, is a variance of disturbances in linear model and is an identity matrix. The typical LARS method relays on the identification of unknown parameters in (7) by meeting the condition (8):
The best unbiased linear estimator of unknown parameters , provided that , can be determined by Equation (8).
The above problem is often accompanied by a situation where is singular. The simplified workflow of the described LARS problem can be described in four basic steps [29].
Step one involves standardizing the predictors. The intercept in Equation (11) is equal to a mean of the response variables so we set . The active set of predictors T is empty.
In the second step, the residuals r for the linear model are calculated according to the formula . The calculation takes into account all predictors from active set T. Determine the predictor outside the active set T that is most correlated with the residuals of r. Let’s add it to the active set T.
In the third step, the values of the coefficients are iteratively shifted from 0 to its least squares coefficient . The condition for terminating the iteration loop is that the other competitor will have a strong correlation with the current residuals, similar to .
In the last fourth step, move the values of the coefficients and in the direction determined by their joint least square factor of the current residual on until some other competitor has a strong correlation with the present residual. Steps 2 through 4 should be repeated until all the number i predictors have been included.
2.3.3. Elastic Net (EN)
As mentioned above, the inverse problem is usually ill-placed, meaning that the solution does not meet the criteria of uniqueness, existence, and stability at the same time. Noise in the EIT electric field measurement can lead to a large error in the calculation results of the test object. Moreover, the number of discretized current elements is usually much bigger than the number of measuring points. Due to these features, measurement results are usually insufficient to obtain accurate reconstructions.
Therefore, in order to solve the above problems, regularization is used, which makes it possible to approximate the solution to the exact solutions. Elastic network regulation has proved to be a viable approach to solving a misplaced inverse problem in mathematics and avoiding over-fitting in statistics. Elastic net is a compromise between and norms or in other words between the least absolute shrinkage and selection operator (LASSO) introduced by Roberta Tibshirani and ridge regression called Tikhonov regularization. The method is also effective in situations where there are many correlated predictors or the number of discretized current elements is much larger than the number of measurement points [30].
The problem that determines the elastic net can be represented by Equation (9)
where are the residuals of the linear model, is the vector of measurements, is the vector of reference values, is the intercept equal a mean of the response variable parameter, denotes unknown parameters, is the penalty coefficient, is an Elastic Net penalty clarified by Equation (10):
From Equation (15) it follows that the elastic net penalty is a summary combination of the and norms of unknown parameters . Parameter represents a trade-off between LASSO and ridge regression. If then it is pure ridge regression but when then it is pure LASSO.
2.3.4. Artificial Neural Networks (ANN)
ANNs were the last of the machine learning methods compared. A set of shallow neural networks was used, of which each ANN had one hidden layer containing 20 neurons for 2 × 16 = 32 electrodes and 448 measurements, and 10 neurons for 16 electrodes and 96 measurements. Each single ANN generated the value of one pixel on the tomographic image mesh. The output value visualized with color corresponds to the value of the electrical conductivity of a given finite element. The structure of a single ANN dedicated to a single image point is 96→10→1 or 448→20→1.
The system of all ANNs for the case when the measurement vector has 96 values and the output image mesh consists of 6215 pixels, has the following structure: (96→10→1)×6215. Neural networks were trained using the scaled conjugate gradient backpropagation. This algorithm requires less memory and enables parallel training on GPU, which is not possible with e.g. the Levenberg-Marquardt method. The hidden layer uses the hyperbolic tangent sigmoid transfer function, and the output layer uses the linear transfer function. The set of cases used to train ANNs was 35,000 cases. It was divided in the proportion of 70:15:15 into training, validation and test sets. Table 1 shows the results of the ANN learning process along with the division of data into sets for a randomly selected, single pixel of an image.

Table 1.
The results of the learning process along with the division of data into sets.
For the analysis of the results included in Table 1 (especially MSE), it is important that the reference conductivity values in the test object were 1 for a dry object and 10 for a wet object. In order to protect the network against overfitting, the early stopping method was used. This is also the purpose of extracting the validation set. The rule is that if the MSE error for the validation set does not decrease for six consecutive iterations, then the neural network training process is completed.
Figure 8 shows the course of the ANN learning process for a single pixel. The best validation performance is 2.1239 at epoch 27. The shape of the MSE slope curve is hyperbolic and has no significant fluctuation. A trained network obtains the best results for the training set, slightly worse for the validation set and the worst for the test set. It is worth noting that the differences in MSE for all three sets are not large. All this, combined with high R regression values, proves that a trained neural network has great generalization potential.
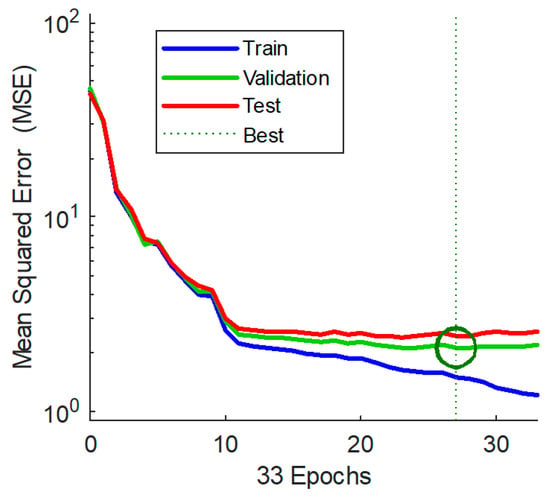
Figure 8.
ANN—best training performance.
Figure 9 shows the states of the ANN during individual epochs of the learning process. Scaled conjugate gradient backpropagation is an optimization algorithm that searches for the minimum of the objective function. Learning rate measures how much your current state affects your next step, while momentum measures how past steps affect your next step. The simultaneous, appropriate selection of the gradient and momentum values guarantees good training of the neural network. Figure 8 also shows the number of consecutive validations without the improvement effect. After six such epochs without reducing the validation error, the learning process is interrupted.
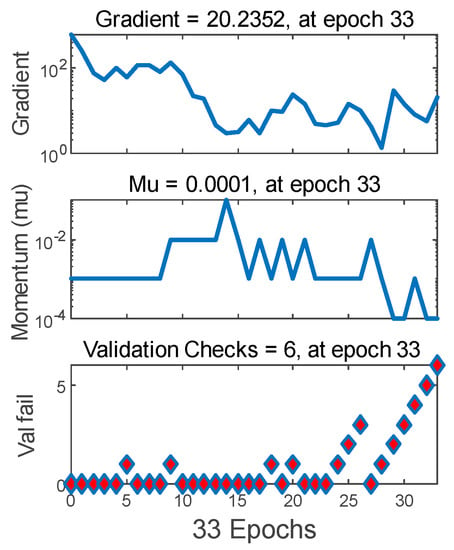
Figure 9.
ANN training state.
The real measurements allowed for the effective validation of the script, thanks to which a large number of simulation cases were generated. Based on the simulation data produced in this way, the model of ANNs was trained. In order to make the generated cases more realistic, the script simulating the measurements also introduced noise of several percent. The final verification of the ANN model, like all other methods, was based on real data. Numerical analysis of the problem was presented on the basis of EIT and finite element method (FEM). MatLab software with the Eidors toolbox was used to develop the numerical models [31].
2.4. Result Validation Methods
In the wall tomography of historical buildings, as in the soil tomography, the basic problem is the validation of the methods. There is no non-destructive method to determine the exact moisture distribution in the wall. Since it is not possible to obtain learning data (voltages and conductivity distributions) from direct measurements and observations of a real historical object, simulation algorithms are used to generate the learning sets. Physical masonry models are used to validate the performance of the EIT models trained on the simulation data. By performing tomographic measurements on models of brick walls, after examining them with the EIT method, the model is tested using the most accurate destructive (direct) methods. By comparing the results of the EIT test with e.g. a gravimetric method, the tomographic methods are effectively validated. Both the direct and indirect methods were used to validate the tomographic algorithms presented in this paper. Figure 10 shows how to perform measurements using two standard methods—dielectric, microwave and gravimetric.
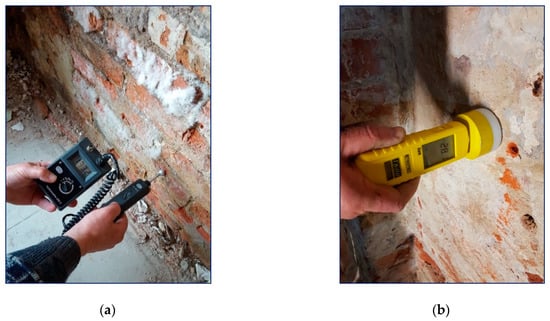
Figure 10.
Validation of humidity tests carried out with the use of: (a) the dielectric method; (b) microwave method.
The following approaches were used as comparative methods for testing the humidity of brick walls in a historical building: non-destructive dielectric with the use of a UNI GANN 2 meter (GANN Mess- u. Regeltechnik GmbH, Stuttgart, Germany) equipped with a B50 ball probe, the research range of which is up to about 50 mm into the wall, non-destructive microwave using the meter T 600 (TROTEC GmbH & Co. KG, Heinsberg, Germany) with a test range up to about 300 mm into the wall and a destructive gravimetric method. The above traditional methods of measuring the moisture content of masonry have been used to validate the concept of EIT based on machine learning algorithms.
To match single point measurements with EIT measurements using two rails with 16 electrodes each, the locations of the individual measurements have been carefully defined. The distribution of measurement points for individual validation measurements is shown in Figure 11.
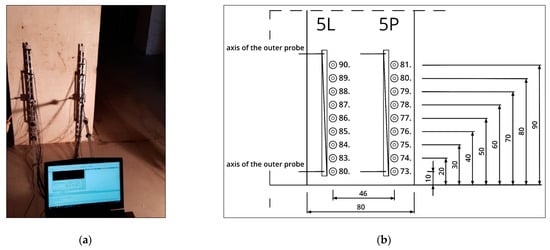
Figure 11.
Moisture tests of an internal brick pillar: (a) view of the pillar with the EIT electrodes applied; (b) distribution of measurement points for comparative dielectric, microwave and gravimetric methods.
2.5. Preliminary Evaluation of Algorithmic Methods through Voltages
In order to pre-evaluate the EIT algorithmic methods used in the research, Algorithm 1 was used. Employing a very dense finite elements mesh, a set of training cases was generated, including independent variables (voltages) and output variables (conductivity distribution). Using a coarse finite elements mesh, four algorithmic models were trained for all tested tomographic methods (TV, LARS, Elastic Net, and ANN).
| Algorithm 1. Generation of training data and preliminary evaluation of the effectiveness of EIT algorithmic methods |
|
Then conductivity distributions were reconstructed using each of the methods. Finally, by solving a forward problem using the same algorithm that was used to generate the training cases, a set of reconstructed measurement voltages was obtained. By comparing the reference with the reconstructed voltages, a preliminary assessment of the quality of the compared tomographic methods was achieved. Algorithm 1 shows an ordered sequence of operations described above.
Figure 12 shows a comparison of 96 measurements consisting of reference voltages and voltages reconstructed after applying the artificial neural networks (ANN) algorithm. For ANN the mean percentage error is PE = 11.6358%, while the Pearson’s correlation coefficient PCC = 0.9993 [32].
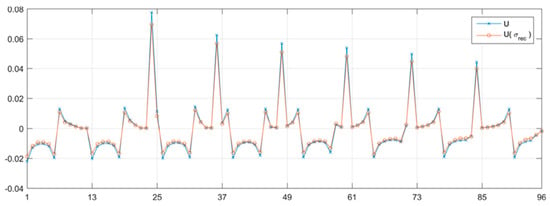
Figure 12.
Electric voltages validation with ANN method.
In this way, simulation measurements were performed for the purposes of this comparative study. High correlation coefficients and low percentage deviations of the voltages prove that the measurement voltage values obtained from the conductance distribution reconstructed with a given method as a result of solving a forward problem are correct. Table 2 shows the values of PE and PCC voltage indicators for all tested methods.

Table 2.
Preliminary evaluation of algorithmic methods through voltages.
The analysis of Table 2 leads to the conclusion that the best values for both indicators were obtained by the TV method, and the worst were obtained by the LARS method. The ICC indicators for all methods are similar and very high.
When using the above algorithm of assessing the quality of the methods, based on comparing voltages, it should be taken into account that the main goal of tomography is to obtain a reliable image illustrating the interior of the tested object. It may happen that, despite minimal differences in the voltages, and even in the conductances, the tomographic image will be blurry, noisy or inaccurate. Another weakness of the PE and ICC indicators is that they average the measurement values. In total, for all measurements, the PE percentage error may be close to zero but the inverse, ill posed problem has no unequivocal solution. This means that despite the high compliance of the reconstructed voltages with the reference voltages, there is no guarantee that the reconstructive images will be of high quality. Therefore, in these studies, the evaluation of methods based on the comparison of electrical voltages was treated as auxiliary. The main evaluation of the results of the four tested methods is presented in the next section of this paper.
3. Results
This section presents the results of the previously described tests of electrical tomography divided into the methods used to create reconstructive images. Obtaining high-quality tomographic images in the examined case was extremely difficult because the examined wall fragments are mostly insulators. This fact made it very difficult to select the appropriate current-voltage parameters. Moreover, the reconstructions made with the methods described were spatial (3D) and not cross-sectional (2D), which significantly increases the resolution of the tomographic image and at the same time deepens the ill-posedness of the problem. It is obvious that due to the impossibility of separating the examined fragment of the historical object, it was not possible to unequivocally and presuppose the actual distribution of moisture inside the wall.
To objectively assess the quality of the reconstructions obtained with each of the tested methods, three well-known indicators were used: mean square error (MSE), relative image error (RIE), and image correlation coefficient (ICC). The MSE metric was evaluated according to Equation (11):
where N—number of finite elements or image resolution, —reference conductivity of i-th pixel, —reconstruction conductivity of i-th pixel.
The second measure of reconstruction quality RIE was calculated according to Equation (12)
where is the ground-truth (pattern) conductivity distribution, is the reconstructed conductivity distribution.
The third measure of reconstruction quality ICC was calculated according to Equation (13):
where is the mean ground-truth conductivity distribution of pattern image, and is the mean conductivity distribution of the reconstructed image. ICC is based on Pearson’s correlation coefficient. It is used to determine the correlation between the reference image and the reconstruction image. The smaller the values of the MSE and RIE metrics, the better the quality of the tomographic image. The closer the ICC to 1, the better the correlation of the output image with the reference image, which translates into a more accurate reconstruction.
3.1. Visualization of Real Measurements
Figure 13a and Figure 14a show spatial tomographic images illustrating the moisture distribution in the wall of the historic building located in the Partisan Hill in Wroclaw, Poland. The analyzed part of the wall was 50 × 30 × 100 cm. With the use of 16 electrodes, a set of 96 measurements was generated, which allowed for the reconstructions. Both figures demonstrate the same fragment of the wall, however, they differ in the method of reconstruction. Figure 13 was made using the ANN method, while Figure 14 was made using the Elastic Net.
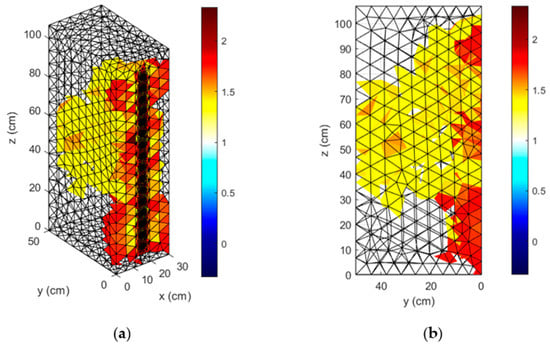
Figure 13.
Reconstruction of real measurements made in a historical building located on the Partisan Hill in Wroclaw, Poland using the ANN method: (a)—spatial view, (b)—side view.
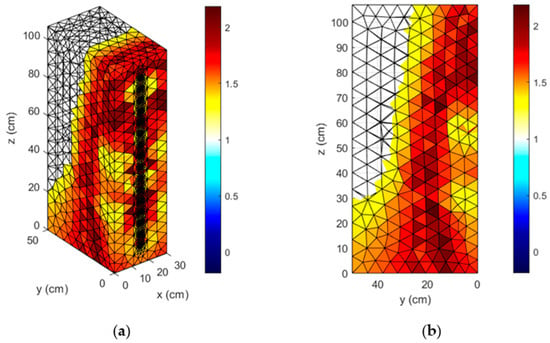
Figure 14.
Reconstruction of real measurements made in a historical building located on the Partisan Hill in Wroclaw, Poland using the Elastic Net method: (a)—spatial view, (b)—side view.
Figure 13a and Figure 14a are analogous to Figure 13b and Figure 14b. The difference is that in order to better represent the imaging depth, the images have been rotated so that the electrodes are on the right side of each of the figures. As all the electrodes are on the same side of the tested object, it should be expected that the imaging depth is limited. This is confirmed by tomographic images, which in both methods show a similar level of moisture at a distance up to about 15 cm from the electrodes.
The further away from the electrodes, the greater the differences. The further away from the electrodes, the less certain the reconstruction is, hence the differences in mapping the same fragment of the wall with different methods. As the distance from the electrodes increases, the electric field intensity decreases, and thus the measurement accuracy drops.
The color bar has been calibrated so that the value of 1 indicates a dry wall. Values greater than 1 indicate internal moisture. The higher the values, the higher the moisture level. Although Figure 13 and Figure 14 are slightly different, there is a significant correlation between them. In addition, the use of other methods also confirmed a comparable level and distribution of moisture, which proves the efficiency of the reconstruction based on real measurements.
There is no easy way to verify reconstructions made on a real object such as a historical building. Therefore, the validation of methods based on algorithms trained with simulation data was performed mainly on the basis of physical models tested with destructive (invasive) methods in laboratory conditions.
3.2. Comparison of Methods
As mentioned before, the comparison of EIT tomographic reconstruction methods was carried out on the basis of three indicators – MSE, RIE, and ICC. All indicators require comparing the results of the reconstruction with the pattern. Due to this fact, it was necessary to generate simulation cases that were used to train the EIT systems and to evaluate their effectiveness. Table 3 and Table 4 present the parameters of the 4 tested variants (wall sections), which were reconstructed using all methods compared. Parameters such as number of electrodes, type of electrodes, number of nodes, and number of finite elements refer to the sparse meshes, i.e. those that have been used for imaging tomographic reconstructions.

Table 3.
Parameters of the finite element mesh—variants No. #1 and #2.

Table 4.
Parameters of the finite element mesh—variants No. #3 and #4.
In variant No. #1, 16 electrodes were used to analyze a cuboid with dimensions of 50 × 20 × 160 cm, imaged on a grid consisting of 6408 pixels. Variant No. #2 included a wider 50 × 60 × 160 cm fragment of the wall. It used 32 electrodes and a mesh containing 13,004 pixels. Variants No. #3 and #4 refer to the part of the wall with dimensions of 60 × 20 × 100 cm and 60 × 60 × 100 cm, respectively, they contain 16 and 32 electrodes, and their meshes have a resolution of 5102 and 10.752 pixels.
Figure 15, Figure 16, Figure 17 and Figure 18 show 4 variants for which the individual EIT algorithmic methods of electrical tomography were tested. The color bars for figures marked with (e) also apply to (c) and (d). Figure 15 shows a variant with 16 electrodes placed on a single, vertical rail. The dimensions of the tested section (cuboid) of the wall are 50 × 20 × 160 cm. In this variant, the TV visualization is definitely the worst. The EN method best reflects the shape of the pattern, but the conductance value is too low. Conductivity is best represented by the ANN method, but the area of moisture is incomplete. In the variant presented in Figure 16, a wall segment with dimensions of 50 × 60 × 160 was examined with the use of 32 electrodes. The TV method indicates moisture up to 60 cm, while the pattern is wet up to 80 cm. Also, the intensity of moisture is much lower than the reference one. A subjective feeling indicates that also in this variant, the EN method worked best.
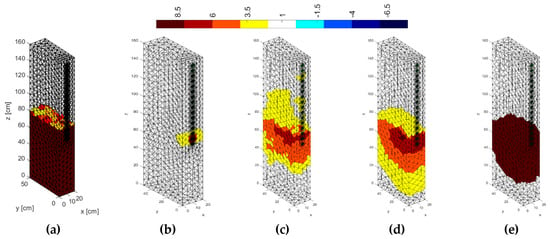
Figure 15.
Reconstructions for variant #1: (a)—Pattern, (b)—Total Variation, (c)—LARS, (d)—Elastic Net, (e)—ANN.
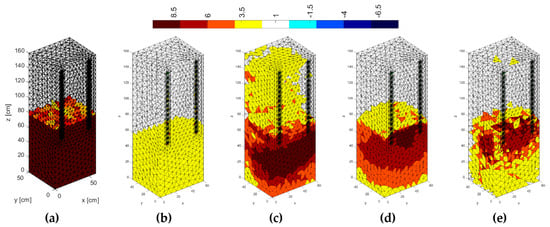
Figure 16.
Reconstructions for variant #2: (a)—Pattern, (b)—Total Variation, (c)—LARS, (d)—Elastic Net, (e)—ANN.
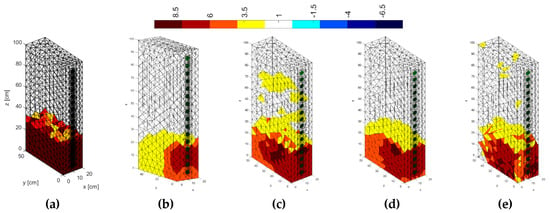
Figure 17.
Reconstructions for variant #3: (a)—Pattern, (b)—Total Variation, (c)—LARS, (d)—Elastic Net, (e)—ANN.

Figure 18.
Reconstructions for variant #4: (a)—Pattern, (b)—Total Variation, (c)—LARS, (d)—Elastic Net, (e)—ANN.
Figure 17 concerns variant #3, in which a section of the wall with dimensions of 50 × 20 × 100 cm was examined with the use of 16 electrodes.
In variant #4 (Figure 18), the section examined in the previous variant was extended three times (x-axis), at the same time doubling the number of electrodes from 16 to 32. In variants 3 and 4, the EN method is also the best, although the classic TV method is not as significantly inferior to the methods of machine learning as seen in variant 1. It is worth noting that the ANN method in Figure 16, Figure 17 and Figure 18 is the only one to reveal faint, non-existent artifacts visible in the upper part of the spatial image. The evaluation of 4 tomographic methods (TV, LARS, Elastic Net, and ANN) was carried out on the basis of 4 simulation cases (variants). The pattern image of the variant #1 is shown in Figure 15a, while the pattern images of the variants #2, #3 and #4 are shown in Figure 16a, Figure 17a and Figure 18a, respectively.
Table 5 presents the results of the above reconstructions in numerical form. The MSE, RIE and ICC metrics were used for this purpose.

Table 5.
Indicators characterizing the quality of reconstruction for individual methods and variants.
The reconstructions presented in Figure 15 and Figure 16 are similar to each other because the pattern images for variants #1 and #2 have a similar moisture distribution (up to 80 cm high), identical height (160 cm) and the same depth (50 cm) of the investigated area of the masonry wall. The difference concerns the width of the tested wall section and the number of electrodes. In the variant #1, the width of the tested wall is 20 cm and the number of electrodes is 16. In the variant #2, the width of the wall is 60 cm and the number of electrodes is 32 (2 × 16). A similar analogy holds for variants #3 and #4 (Figure 17 and Figure 18). For both variants the pattern parts of the wall have the same level of moisture distribution (30 cm), the same height (100 cm) and depth (50 cm) of the tested wall section. In the variant #3, 16 electrodes were placed on the wall 20 cm wide. In the variant #4, 32 (2 × 16) electrodes were used for the wall 60 cm wide.
A visual comparison of some images, e.g. Figure 15b and Figure 16b, may appear to be in contradiction with the indicator values in Table 5. This apparent contradiction has the following reasons:
- (1)
- Figure 15b and Figure 16b are examples of how misleading an assessment of a reconstruction based solely on deviation (e.g. MSE or RIE) can be. A cursory visual observation is insufficient to conclude that the values of the tetrahedra (pixels) for Figure 15b contain as many as 216 elements for which the conductance is maximum (i.e. 10). It turns out that these "wet" pixels are concentrated around the electrodes, where the finite elements are much more densely packed (and therefore smaller) than in other areas of the wall section under study. It should also be noted that in 3D images only the outer pixels are visible, while many pixels are still hidden. Of the 6408 mesh elements total, the values of 316 pixels are greater than 3 and less than 10, which should give some colors. Unfortunately, they are mostly invisible. To see them, many cross-sections of the spatial part of the wall should be analyzed.
- (2)
- In Figure 15b many pixels have values greater than 1 and smaller than 2 and they are all transparent. The reason is that a gradual (not continuous) color scale was used. In fact, the entire output band (conductances) has been divided into 9 categories, as shown in the color bars for Figure 15, Figure 16, Figure 17 and Figure 18.
- (3)
- In the case of variants with 32 electrodes, the tested part of the wall is much larger than in the case of 16 electrodes. The width of the wall section in Figure 15 is 20 cm, and in Figure 16 it is 60 cm. It means that doubling the number of electrodes (from 16 to 32) is accompanied by tripling the width of the wall section being tested (from 20 cm to 60 cm). This is the reason why the reconstruction errors for larger wall sections (#2 and #4) are bigger than in variants #1 and #3.It follows from the above considerations that the ICC indicator that reflects the regression of pixel values, not their deviation, is better suited for the comparative analysis of the variants shown in Figure 15, Figure 16, Figure 17 and Figure 18. “Mean” (right column of Table 5) is also a good indicator as it combines all four variants into one metric, which overcomes the disadvantages of MSE and RIE.
As mentioned before, Table 5 shows the objective, numerical results of the reconstructions. For all four variants, the best results were obtained by the Elastic Net algorithm. It is worth noting that in each case this method obtained the best scores for all three indicators: MSE, RIE, and ICC. Corresponding values - mean of all variants - for the Elastic Net method were underlined as the best. The results, based on the objective criteria of the mathematical indicators, are valuable because when comparing the reconstructive images one cannot draw such unambiguous and unbiased conclusions.
Examples of validation of tomographic methods in laboratory conditions can be found in our publications [2,33,34,35]. However, it should be taken into account that due to the spot nature of traditional methods, it is not possible to physically verify the moisture of each tetrahedron (pixel) visible on the reconstruction tomographic image.
4. Conclusions
The article presents the results of the research in which, using an electrical tomography, an attempt was made to detect moisture inside the walls of a historic building. The main objective of the research was to compare the efficiency of spatial tomographic reconstructions for four algorithms using mathematical modeling and machine learning. The following methods were compared: total variation (TV), least-angle regression (LARS), elastic net (EN), and artificial neural networks (ANN). Three measures of the quality of the reconstruction were adopted—mean square error (MSE), relative image error (RIE), and image correlation coefficient (ICC). All the mentioned above methods: TV, LARS, EN, and ANN were applied to four independent variants, differing in the dimensions of the analyzed section of the wall, the number of electrodes, and the number of finite elements used to design the 3D mesh of the tomographic image. The obtained results undoubtedly indicate that for the examined object, which was the historical building, the best results were obtained using elastic net. The results in Table 5 clearly show that the classic TV method is the worst and is only a background for machine learning based methods. All machine learning algorithms perform better than the TV method taking into account all the evaluation criteria used (MSE, RIE, and ICC).
In order to check the effectiveness of the reconstruction methods in real conditions, a section of the wall with dimensions of 50 × 30 × 100 cm was reconstructed using mutually the elastic net and ANN methods. Both obtained images showed similar moisture distribution and intensity. Since the reconstruction results presented in Table 5 indicate that the best images were obtained with the elastic net, it should be assumed that the reconstructions of the real measurements in Figure 14 (elastic net) are more reliable than in Figure 13 (ANN). The acquired real measurement reconstructions were validated using traditional methods—dielectric and microwave. Top left part of images are empty, most likely because the applied methods and measuring devices did not register any moisture in this area. Recognizing that the elastic net method has been properly validated and obtained the best results of the MSE, RIE and ICC indicators (Table 5), it can be concluded with high probability that the real distribution of moisture and dry areas inside the tested part of the building wall are as shown in Figure 14.
Noteworthy is the general concept of reconstructing EIT images that were used for all four methods. It is a “pixel by pixel” approach, that consists of using all input variables to reconstruct a single pixel. This methodology requires training as many independent subsystems as the resolution of the output image, but the high quality of the reconstruction compensates for this inconvenience. Taking into account the dynamic development of information technologies, which results in a decrease in computing power costs, such an approach seems to be justified. Future research will focus on differentiating tomographic methods depending on the reconstructed pixel. It will be a special kind of hybrid approach defining the association of the method with the pixel (“method to pixel”).
Author Contributions
Development of the system concept, measurement methodology, image reconstruction and supervision, T.R.; Development of the numerical methods and techniques, G.K. and P.T.; Development of the concept of measurements in a historical building, preparation of measurement stations, measurements, development of measurement methodology, preparation of descriptions in the article and measurement documentation, A.H. and J.H.; Development of the software for mathematical models and the measurement concept of electrical impedance tomography for the study of dampness in walls, J.S.; Literature review, formal analysis, general review, and editing of the manuscript, Ł.S. All authors have read and agreed to the published version of the manuscript.
Funding
This research was funded by The National Centre for Research and Development, grant number POIR.01.01.01-00-0167/15.
Institutional Review Board Statement
Not applicable.
Informed Consent Statement
Not applicable.
Data Availability Statement
Not applicable.
Conflicts of Interest
The authors declare no conflict of interest.
References
- Hola, A. Measuring of the moisture content in brick walls of historical buildings—the overview of methods. In IOP Conference Series: Materials Science and Engineering, Proceedings of the 3rd International Conference on Innovative Materials, Structures and Technologies (IMST 2017), Riga, Latvia, 27–29 September 2017; Institute of Physics Publishing: Bristol, UK, 2017; Volume 251. [Google Scholar]
- Rymarczyk, T.; Kłosowski, G.; Kozłowski, E. A Non-Destructive System Based on Electrical Tomography and Machine Learning to Analyze the Moisture of Buildings. Sensors 2018, 18, 2285. [Google Scholar] [CrossRef] [PubMed]
- Hoła, A. Methodology for the in situ testing of the moisture content of brick walls: An example of application. Arch. Civ. Mech. Eng. 2020, 20, 3. [Google Scholar] [CrossRef]
- Andreotti, M.; Bottino-Leone, D.; Calzolari, M.; Davoli, P.; Dias Pereira, L.; Lucchi, E.; Troi, A. Applied Research of the Hygrothermal Behaviour of an Internally Insulated Historic Wall without Vapour Barrier: In Situ Measurements and Dynamic Simulations. Energies 2020, 13, 3362. [Google Scholar] [CrossRef]
- Lucchi, E.; Dias Pereira, L.; Andreotti, M.; Malaguti, R.; Cennamo, D.; Calzolari, M.; Frighi, V. Development of a Compatible, Low Cost and High Accurate Conservation Remote Sensing Technology for the Hygrothermal Assessment of Historic Walls. Electronics 2019, 8, 643. [Google Scholar] [CrossRef]
- Litti, G.; Khoshdel, S.; Audenaert, A.; Braet, J. Hygrothermal performance evaluation of traditional brick masonry in historic buildings. Energy Build. 2015, 105, 393–411. [Google Scholar] [CrossRef]
- Rye, C.; Scott, C.; Hubbard, D. THE SPAB RESEARCH REPORT 2 The SPAB Building Performance Survey 2012 Interim Report. 2012. Available online: https://bit.ly/3r04xUt (accessed on 28 December 2020).
- Bikas, D.; Chastas, P. The Effect of the U Value in the Energy Performance of Residential Buildings in Greece. J. Sustain. Arch. Civ. Eng. 2014, 6, 6. [Google Scholar] [CrossRef]
- Kosinski, T.; Obaid, M.; Wozniak, P.W.; Fjeld, M.; Kucharski, J. A fuzzy data-based model for Human-Robot Proxemics. In Proceedings of the 25th IEEE International Symposium on Robot and Human Interactive Communication, RO-MAN, New York, NY, USA, 26–31 August 2016; pp. 335–340. [Google Scholar]
- Daniewski, K.; Kosicka, E.; Mazurkiewicz, D. Analysis of the correctness of determination of the effectiveness of maintenance service actions. Manag. Prod. Eng. Rev. 2018, 9, 20–25. [Google Scholar]
- Kłosowski, G.; Rymarczyk, T.; Wójcik, D.; Skowron, S.; Cieplak, T.; Adamkiewicz, P. The use of time-frequency moments as inputs of lstm network for ecg signal classification. Electronics 2020, 9, 1452. [Google Scholar] [CrossRef]
- Karabacak, Y.E.; Gürsel Özmen, N.; Gümüşel, L. Worm gear condition monitoring and fault detection from thermal images via deep learning method. Eksploat. Niezawodn. 2020, 22, 544–556. [Google Scholar] [CrossRef]
- Rodrigues, J.; Costa, I.; Farinha, J.T.; Mendes, M.; Margalho, L. Predicting motor oil condition using artificial neural networks and principal component analysis. Eksploat. Niezawodn. 2020, 22, 440–448. [Google Scholar] [CrossRef]
- Korzeniewska, E.; Sekulska-Nalewajko, J.; Gocawski, J.; Droż Dż, T.; Kiebasa, P. Analysis of changes in fruit tissue after the pulsed electric field treatment using optical coherence tomography. EPJ Appl. Phys. 2020, 91, 30902. [Google Scholar] [CrossRef]
- Rymarczyk, T.; Kłosowski, G.; Tchórzewski, P.; Cieplak, T.; Kozłowski, E. Area monitoring using the ERT method with multisensor electrodes. Prz. Elektrotechniczny 2019, 95, 153–156. [Google Scholar] [CrossRef]
- Chen, B.; Abascal, J.; Soleimani, M. Extended Joint Sparsity Reconstruction for Spatial and Temporal ERT Imaging. Sensors 2018, 18, 4014. [Google Scholar] [CrossRef] [PubMed]
- Szczesny, A.; Korzeniewska, E. Selection of the method for the earthing resistance measurement. Prz. Elektrotech. 2018, 94, 178–181. [Google Scholar]
- Romanowski, A. Contextual Processing of Electrical Capacitance Tomography Measurement Data for Temporal Modeling of Pneumatic Conveying Process. In Proceedings of the 2018 Federated Conference on Computer Science and Information Systems (FedCSIS), Poznań, Poland, 9–12 September 2018; pp. 283–286. [Google Scholar]
- Majchrowicz, M.; Kapusta, P.; Jackowska-Strumiłło, L.; Sankowski, D. Acceleration of image reconstruction process in the electrical capacitance tomography 3D in heterogeneous, multi-GPU system. Inform. Control Meas. Econ. Environ. Prot. 2017, 7, 37–41. [Google Scholar] [CrossRef]
- Kryszyn, J.; Smolik, W. Toolbox for 3D modelling and image reconstruction in electrical capacitance tomography. Inform. Control Meas. Econ. Environ. Prot. 2017, 7, 137–145. [Google Scholar] [CrossRef]
- Grudzien, K.; Chaniecki, Z.; Romanowski, A.; Sankowski, D.; Nowakowski, J.; Niedostatkiewicz, M. Application of twin-plane ECT sensor for identification of the internal imperfections inside concrete beams. In Proceedings of the 2016 IEEE International Instrumentation and Measurement Technology Conference Proceedings, Taipei, Taiwan, 23–26 May 2016; pp. 1–6. [Google Scholar]
- Rymarczyk, T. New methods to determine moisture areas by electrical impedance tomography. Int. J. Appl. Electromagn. Mech. 2016, 52, 79–87. [Google Scholar] [CrossRef]
- Rymarczyk, T.; Nita Pawełand Vejar, A.; Wos, M.; Stefaniak, B.; Adamkiewicz, P. Wareable mobile measuring device based on electrical tomography. Prz. Elektrotech. 2019, 95, 211–214. [Google Scholar] [CrossRef]
- Dusek, J.; Hladky, D.; Mikulka, J. Electrical impedance tomography methods and algorithms processed with a GPU. In Proceedings of the 2017 Progress In Electromagnetics Research Symposium—Spring (PIERS), St. Petersburg, Russia, 22–25 May 2017; pp. 1710–1714. [Google Scholar]
- Kozłowski, E.; Mazurkiewicz, D.; Żabiński, T.; Prucnal, S.; Sęp, J. Assessment model of cutting tool condition for reAl-time supervision system model oceny stAnu nArzędziA skrAwAjącego dlA systemu nAdzoru w czAsie rzeczywistym. Eksploat. Niezawodn. Reliab. 2019, 21. [Google Scholar] [CrossRef]
- Kłosowski, G.; Rymarczyk, T.; Kania, K.; Świć, A.; Cieplak, T. Maintenance of industrial reactors supported by deep learning driven ultrasound tomography. Eksploat. Niezawodn. 2020, 22, 138–147. [Google Scholar] [CrossRef]
- Kłosowski, G.; Rymarczyk, T.; Cieplak, T.; Niderla, K.; Skowron, Ł. Quality assessment of the neural algorithms on the example of EIT-UST hybrid tomography. Sensors 2020, 20, 3324. [Google Scholar] [CrossRef] [PubMed]
- Fernández-Fuentes, X.; Mera, D.; Gómez, A.; Vidal-Franco, I. Towards a Fast and Accurate EIT Inverse Problem Solver: A Machine Learning Approach. Electronics 2018, 7, 422. [Google Scholar] [CrossRef]
- Rymarczyk, T.; Tchorzewski, P.; Adamkiewicz, P.; Duda, K.; Szumowski, J.; Sikora, J. Practical Implementation of Electrical Tomography in a Distributed System to Examine the Condition of Objects. IEEE Sens. J. 2017, 17, 8166–8186. [Google Scholar] [CrossRef]
- Zhao, G.; Hu, J.; He, J.; Wang, S.X. A Novel Current Reconstruction Method Based on Elastic Net Regularization. IEEE Trans. Instrum. Meas. 2020, 69, 7484–7493. [Google Scholar] [CrossRef]
- Adler, A.; Lionheart, W.R.B. Uses and abuses of EIDORS: An extensible software base for EIT. Physiol. Meas. 2006, 27, S25–S42. [Google Scholar] [CrossRef]
- Hoegh, K.; Khazanovich, L. Correlation analysis of 2D tomographic images for flaw detection in pavements. J. Test. Eval. 2012, 40, 247–255. [Google Scholar] [CrossRef]
- Hoła, J.; Matkowski, Z.; Schabowicz, K.; Sikora, J.; Nita, K.; Wójtowicz, S. Identification of moisture content in brick walls by means of impedance tomography. COMPEL Int. J. Comput. Math. Electr. Electron. Eng. 2012, 31, 1774–1792. [Google Scholar] [CrossRef]
- Goetzke-Pala, A.; Hoła, A.; Sadowski, Ł. A non-destructive method of the evaluation of the moisture in saline brick walls using artificial neural networks. Arch. Civ. Mech. Eng. 2018, 18, 1729–1742. [Google Scholar] [CrossRef]
- Hoła, A.; Matkowski, Z.; Hoła, J. Analysis of the Moisture Content of Masonry Walls in Historical Buildings Using the Basement of a Medieval Town Hall as an Example. In Procedia Engineering; Elsevier Ltd.: Amsterdam, The Netherlands, 2017; Volume 172, pp. 363–368. [Google Scholar]
Publisher’s Note: MDPI stays neutral with regard to jurisdictional claims in published maps and institutional affiliations. |
© 2021 by the authors. Licensee MDPI, Basel, Switzerland. This article is an open access article distributed under the terms and conditions of the Creative Commons Attribution (CC BY) license (http://creativecommons.org/licenses/by/4.0/).

