Article

Investigation of Thermo-Flow Characteristics of Natural Draft Dry Cooling Systems Designed with Only One Tower in 2 × 660 MW Power Plants

Key Laboratory of Power Station Energy Transfer Conversion and System of Ministry of Education, School of Energy Power and Mechanical Engineering, North China Electric Power University, Beijing 102206, China
*
Author to whom correspondence should be addressed.
Energies 2021, 14(5), 1308; https://doi.org/10.3390/en14051308
Submission received: 25 January 2021 / Revised: 14 February 2021 / Accepted: 19 February 2021 / Published: 27 February 2021

Abstract

:
In recent years, natural draft dry cooling systems with only one tower have been adopted in some 2 × 660 MW power-generating units owing to the advantage of lower construction costs. The operating cases of two power-generating units and one power-generating unit will both appear based on the power load requirement, which may lead to very different flow and heat transfer performances of this typical cooling system. Therefore, this research explores the local thermo-flow characteristics of air-cooled heat exchangers and sectors, and then analyzes the overall cooling performance of the above two operating cases under various wind conditions. Using the numerical modeling method, the results indicate that the flow and heat transfer performance of this cooling system decreases significantly in the case of one unit with half sectors dismissed. At wind speeds lower than 8 m/s, the difference in turbine back pressure between two units and one unit appears obviously higher than in other wind conditions, even reaching 4.37 kPa. Furthermore, the air-cooled heat exchanger in the lower layer always has better cooling capability than that in the upper layer, especially in conditions where there is an absence of wind and under low wind speeds. The operating case of one unit is not recommended for this dry cooling system because of the highly decreased energy efficiency. In conclusion, this research could provide theoretical support for the engineering operation of this typical natural draft dry cooling system in 2 × 660 MW power plants.

1. Introduction

Power plants located in arid regions prefer natural draft dry cooling technology owing to its significant water-saving advantages [1,2]. In recent years, natural draft dry cooling systems (NDDCSs) with only one tower have been proposed for the ultra-supercritical 2 × 660 MW power-generating units owing to its much lower construction cost. For this type of NDDCS, the water-flow friction drag of an air-cooled heat exchanger (ACHE) with a two-path design on the water side is crippled by nearly 72.80%. Meanwhile, its overall cooling performance is found to be better than the traditional cooling system under weak wind conditions [3]. However, in a situation where a power plant operates with two units or only one unit, the thermo-flow performance of this typical cooling system has not been illustrated yet. Therefore, this research will focus on exploring the above issue which may provide theoretical guidelines for the engineering operation of this typical NDDCS with only one tower in 2 × 660 MW power plants.
Recently, research has concentrated on revealing the thermo-flow characteristics of some special cooling systems adopted in local power plants. Swirling motions were proved to be able to improve the thermal performance of short NDDCSs by reducing the cold air inflow and increasing the draft speed. In addition, the crosswind influences on the favorable swirl effects have also been investigated [4]. For a solar thermal power plant with increased capacity, the tower spacing of three short NDDCSs in an in-line layout was studied, then the interaction of the towers from the bottom to the top was identified at different tower spacings and wind speeds [5]. The reconstruction of natural draft wet cooling towers into natural draft dry cooling towers is attractive due to the saving of capital expenditure for some old thermal power plants, but the thermal characteristics of dry cooling towers reconstructed from obsolete wet cooling towers have been of concern [6]. The flue gas from an NDDCS cannot be discharged smoothly under unfavorable working conditions and may cause severe corrosion on the inner shell of the cooling tower, hence the flue gas flow and pollutant diffusion were numerically illustrated. In addition, increasing the height of the flue gas outlet was recommended [7]. For NDDCSs with steel cooling towers, the cooling performance with the cylinder-frustum tower shell was explored and compared with the traditional hyperbolic tower shell [8]. Other cooling systems, such as wind towers installed on the rooftops of buildings [9], as well as aero-dynamic devices, such as the indoor air decontamination [10] and spilt-type air conditioner, were also studied [11]. These works have provided theoretical support for engineering application, however the operation of cooling systems with only one tower has not been mentioned.
It is also worth pointing out that, in the past few years, much research has been dedicated to discovering the thermo-flow characteristics of general cooling systems. By using the numerical modeling process of the cold-end system and the innovative model of theoretical prediction, the flow and heat transfer performances of the NDDCS under different working conditions were revealed in detail [12,13]. Crosswind effects on local sectors were specifically illustrated by analyzing the aerodynamic fields surrounding the cooling columns [14,15]. The phenomenon of cold air inflow through the tower outlet has been clearly explained, and it can reduce the cooling capability of a dry cooling system [16]. Furthermore, the crosswind impacts were insightfully reviewed in 2019, which resulted in many valuable guidelines for the design and operation of the NDDCS [17]. As also mentioned, the transient start-up of the NDDCS has been studied in depth by the University of Queensland, with the stages of natural convection, mixed convection, and forced convection clarified in detail [18], the crosswind impacts disclosed [19], and the time-dependent cold air inflow also analyzed [20].
The relevant enhancement strategies for the cooling performance of the NDDCS were extensively put forward, such as the design of windbreakers [21,22,23,24,25,26,27,28], redistribution of water-flow rate among air-cooled sectors [29,30,31], and structure optimization of both the ACHE and the cooling towers [32,33,34,35,36]. Furthermore, the air jet-induced swirling plume by nozzle [37], the hot-air extraction [38], the evaporation-aided cooling [39,40,41], and the nozzle arrangement of the water spray system [42,43] were also proposed. Additionally, the critical impact factors on the cooling performance of the NDDCS, such as the heat exchanger arrangement, tower structure, crosswind, and mass flow ratio of circulating water to steam, were thoroughly studied and evaluated, and provided theoretical directions for the initial design of the cooling system [44].
Nowadays, the design of NDDCSs with only one tower has been put forward in some ultra-supercritical 2 × 660 MW dry cooling power plants (details in Section 2.1). For this type of cooling system, the operating cases of two power-generating units and one power-generating unit will both appear following the regional power load requirement, and may cause very different flow and heat transfer performances in an NDDCS. With regard to this issue, this research will focus on revealing both the local thermo-flow characteristics and the overall cooling performance of this typical NDDCS in the above two operating cases under various wind conditions, and this will supply theoretical suggestions for its practical engineering operation.

2. Numerical Modeling

2.1. NDDCS with Only One Tower

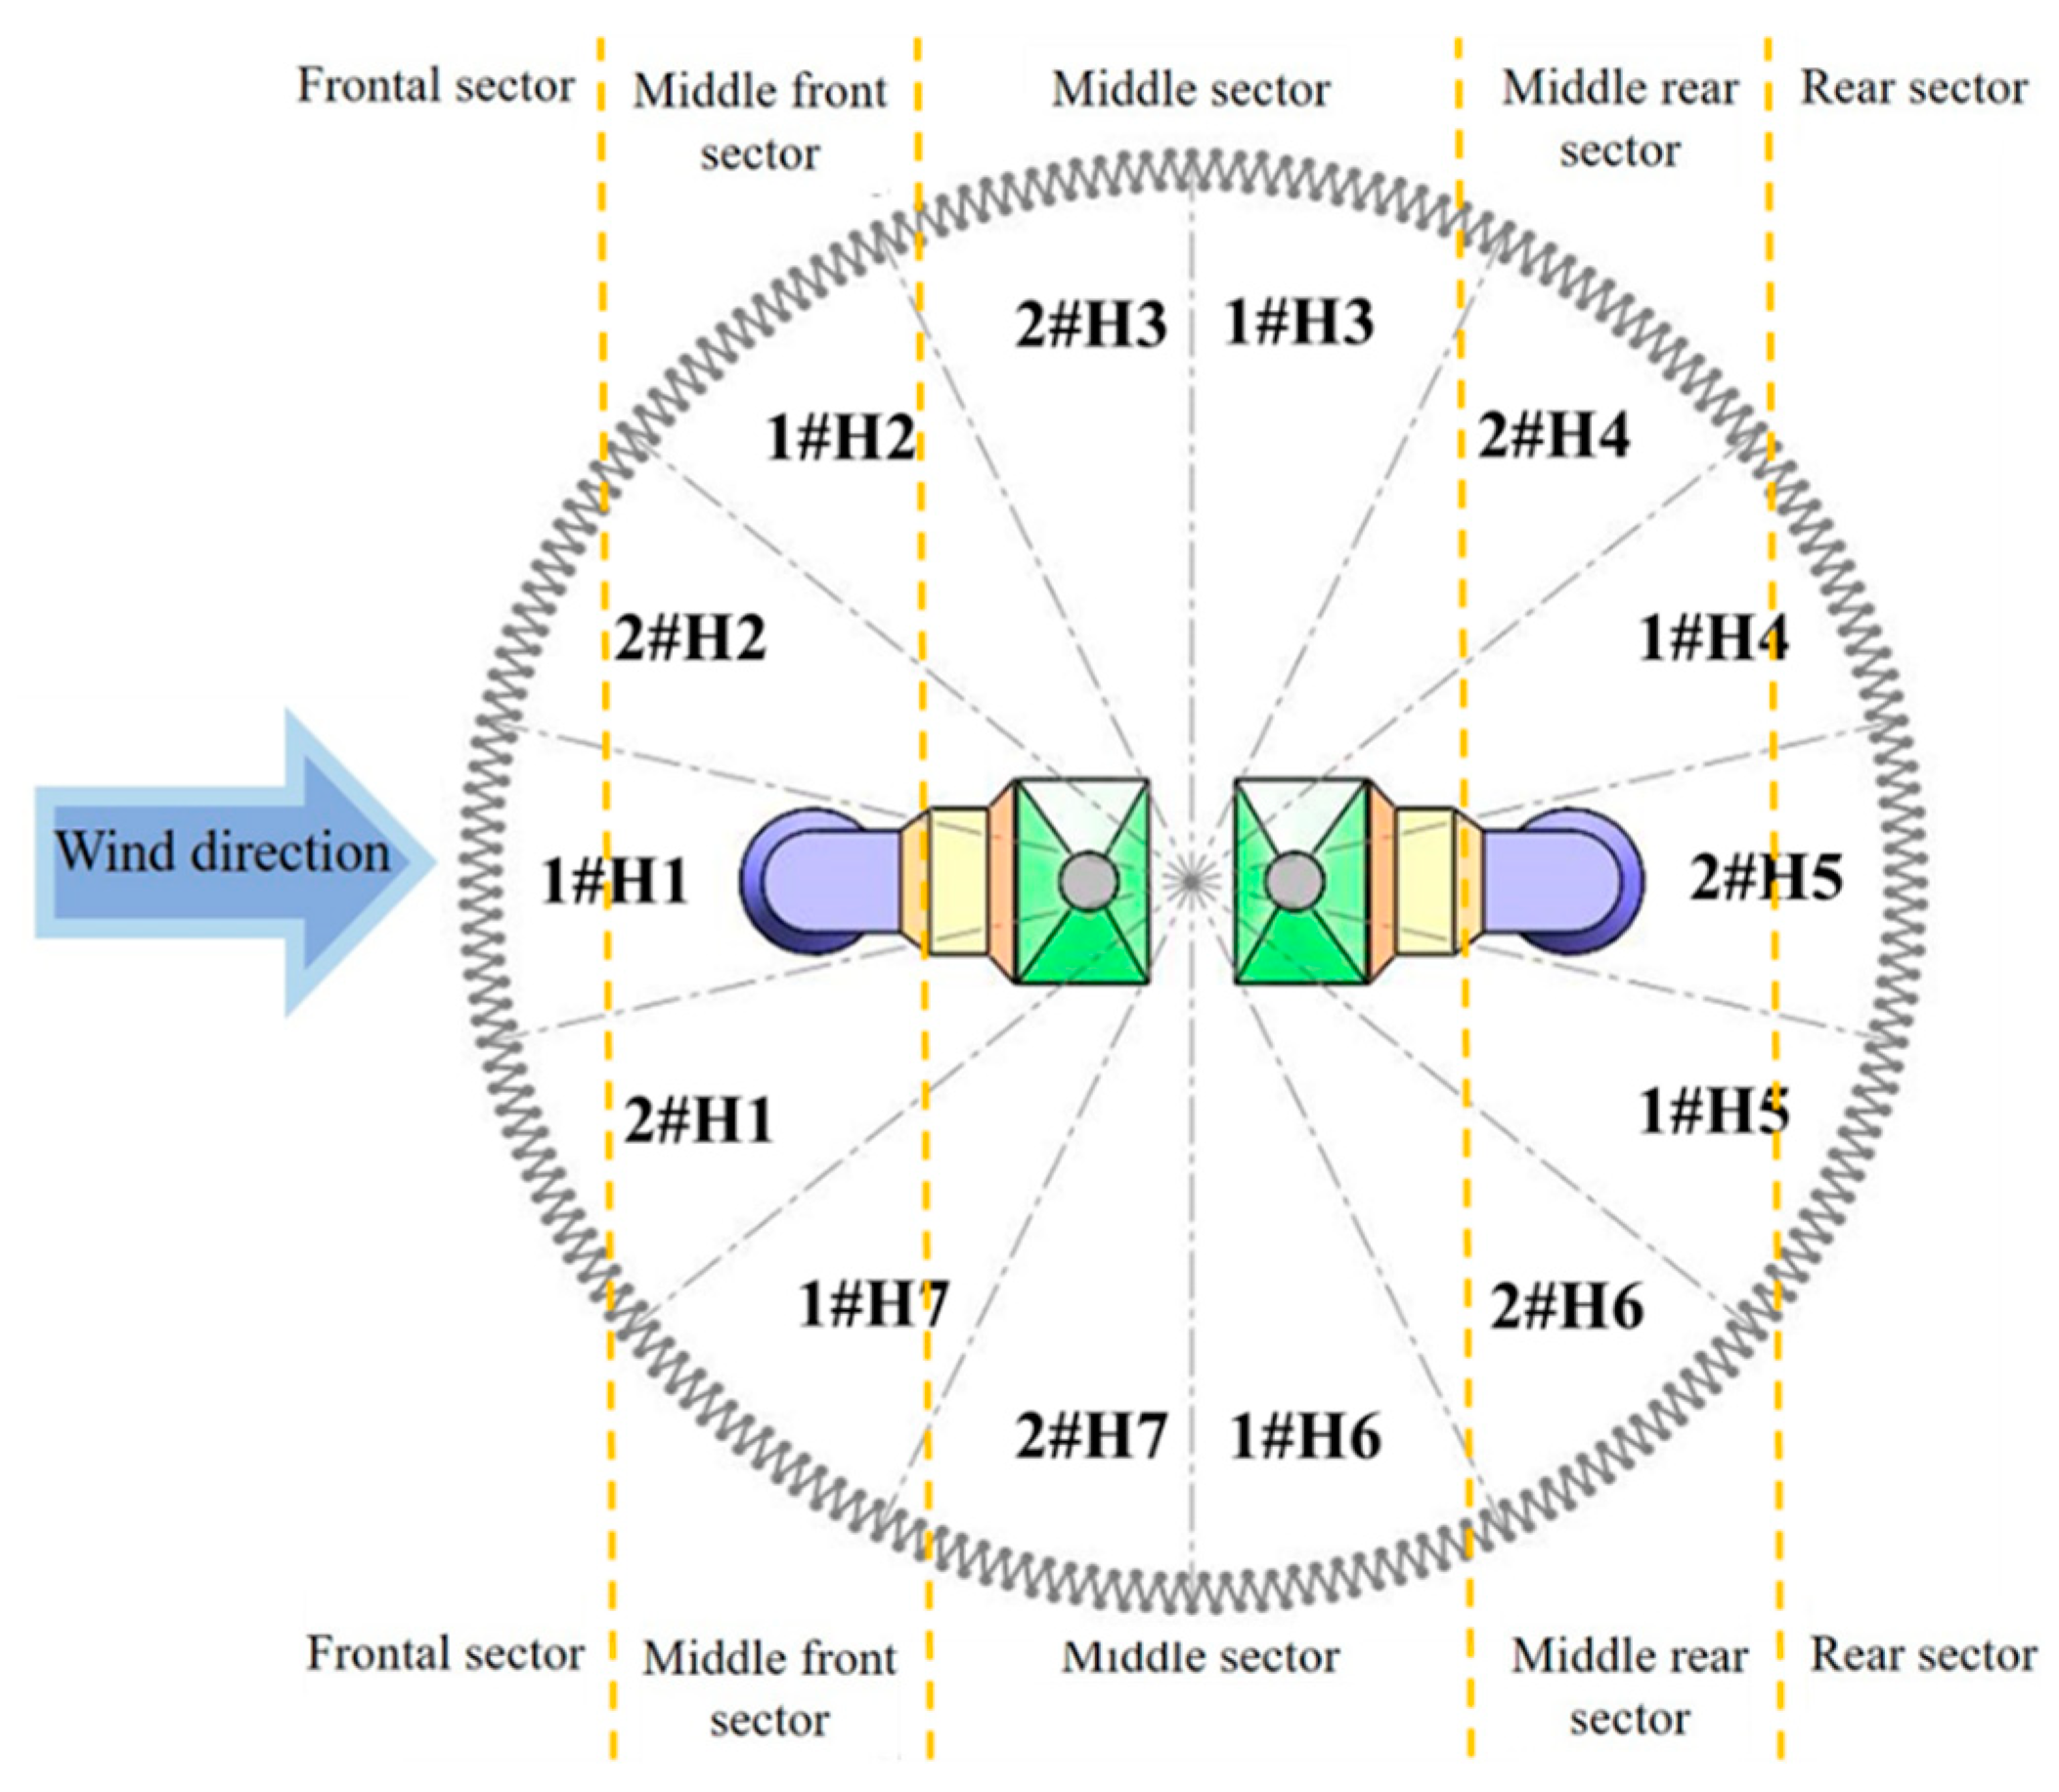
Taking the following 2 × 660 MW power plant as a typical example, an NDDCS with only one tower is designed to discharge the massive exhaust heat of the condensers. In other words, the heat rejection of the condenser in each power-generating unit will be taken away by the same one cooling tower, as shown in Figure 1a [3]. This type of dry cooling system consists of an ACHE with a double-layer configuration (the lower layer is named as layer B and the upper layer is named as layer A), a desulfurizer, a gas-condensing system (GCS), a wet electrostatic precipitator (WESP), and a flue gas chimney, as depicted in Figure 1b. The detailed geometric parameters are listed in Table 1. For the portioning of the ACHE, it is divided into 14 air-cooled sectors, which are arranged alternatively so that each power-generating unit (1# and 2#) has seven sectors, as presented in Figure 2.

2.2. Governing Equations

For numerical modeling of the NDDCS, cooling air with a low Mach number is regarded as the impressible flow. Time-averaged Navier–Stokes equations with the Boussinesq hypothesis are adopted to describe the flow and heat transfer performances of the dry cooling system, given as follows [14,15]:
( ρ u φ ) = ( Γ φ φ ) + S φ + S φ
The dependent variable φ equals 1, u (ui, uj, uk in x, y, z direction), cpt, k, and ε in the continuity, momentum, energy, and turbulence equation, respectively. Γφ and Sφ represent the diffusion coefficient term and the internal source term. Furthermore, these parameters are summarized in Table 2. In ACHE zones, the additional momentum sink and energy source term Sφ′ should be appended to the corresponding equations [45]:
S φ = Δ p j A j V m a c r o
S φ = Q V m a c r o
where Aj and Vmacro mean the surface area and the macro volume. Δpj′ represents the pressure drop, and Q′ is the heat rejection of the elemental macro, which are obtained by the macro heat exchanger model [46].
Δ p = 1 2 f ρ u A min 2
Q m a c r o = ε m a c r o m a c p a ( t w a 1 t a 1 ) m a c r o
Q = Q m a c r o

2.3. Boundaries, Meshing, and Solution

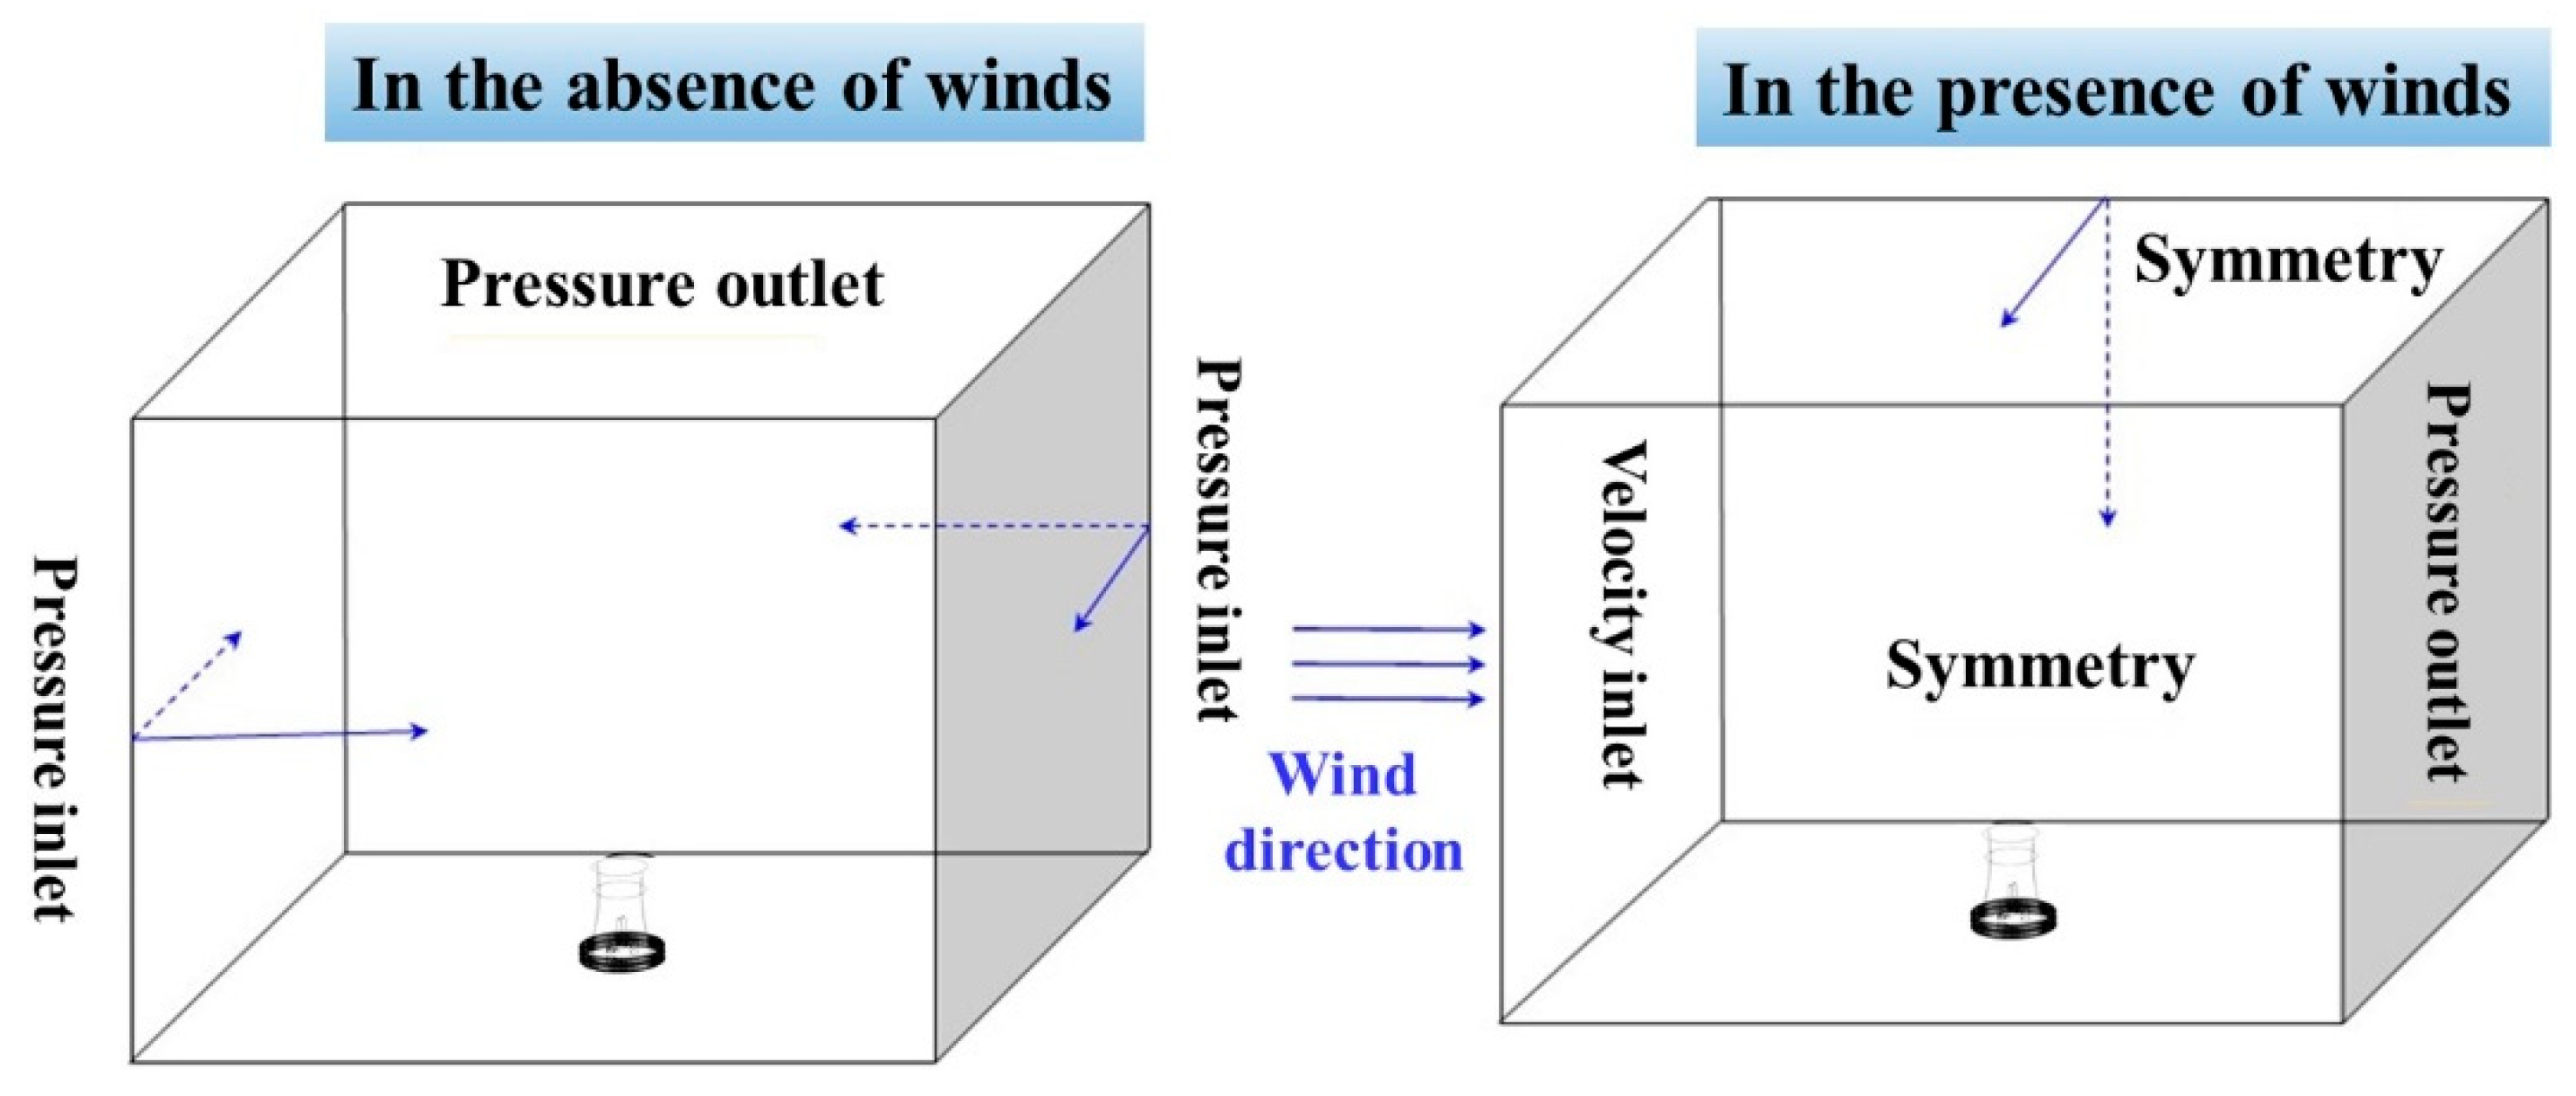
Ansys Fluent software is adopted to conduct the numerical modeling, and referring to research [3,21], the computational domain and boundaries of this dry cooling system are established, as shown in Figure 3. When developing the numerical model, the hexahedral meshes are generated for the ACHE and cooling tower, while the tetrahedral ones for the desulfurizer, gas-condensing system, wet electrostatic precipitator, and flue gas chimney. The detailed geometries and local meshes of these key sections are displayed in Figure 4. Finally, 6,542,372 meshes are formed for this computational domain. West wind appears most frequently throughout the year, the velocity inlet boundary is set at the windward surface, and the crosswind speed uz follows the power law equation [12,45]:
u z = u w ( H z H r e f ) e
where Hz means the vertical distance from ground, uw implies the crosswind at the reference height Href of 10 m, and is set with the typical values of 0, 4, 8, 12, and 16 m/s in this study. The exponent e relating to the ground roughness and atmosphere is set as 0.2. The pressure outlet boundary is appointed to the right surface, while the frontal, rear, and top surfaces are set as symmetry. In the absence of wind, the pressure inlet boundary is assigned to the four surrounding surfaces, while the pressure outlet boundary is given to the top surface. The ambient temperature at the boundary surface is set as the typical value of 12 °C. The ground, tower shell, support pillars, and surfaces of the four facilities inside the tower are set as the no-slip wall boundary. At the chimney outlet, the mass flow rate of flue gas is set as 868.58 kg/s and temperature as 49.4 °C.
Based on the finite volume method, the SIMPLE algorithm is utilized in the pressure-velocity coupling iteration process. The central and second-order discretization schemes are adopted for the convection and diffusion terms in governing equations. The divergence criteria of the scaled residuals are 10−6 and 10−4 for the energy equation and the others. Meanwhile, the heat rejection rate of the cooling system is further monitored to ensure numerical convergence [2].

2.4. Model Validation

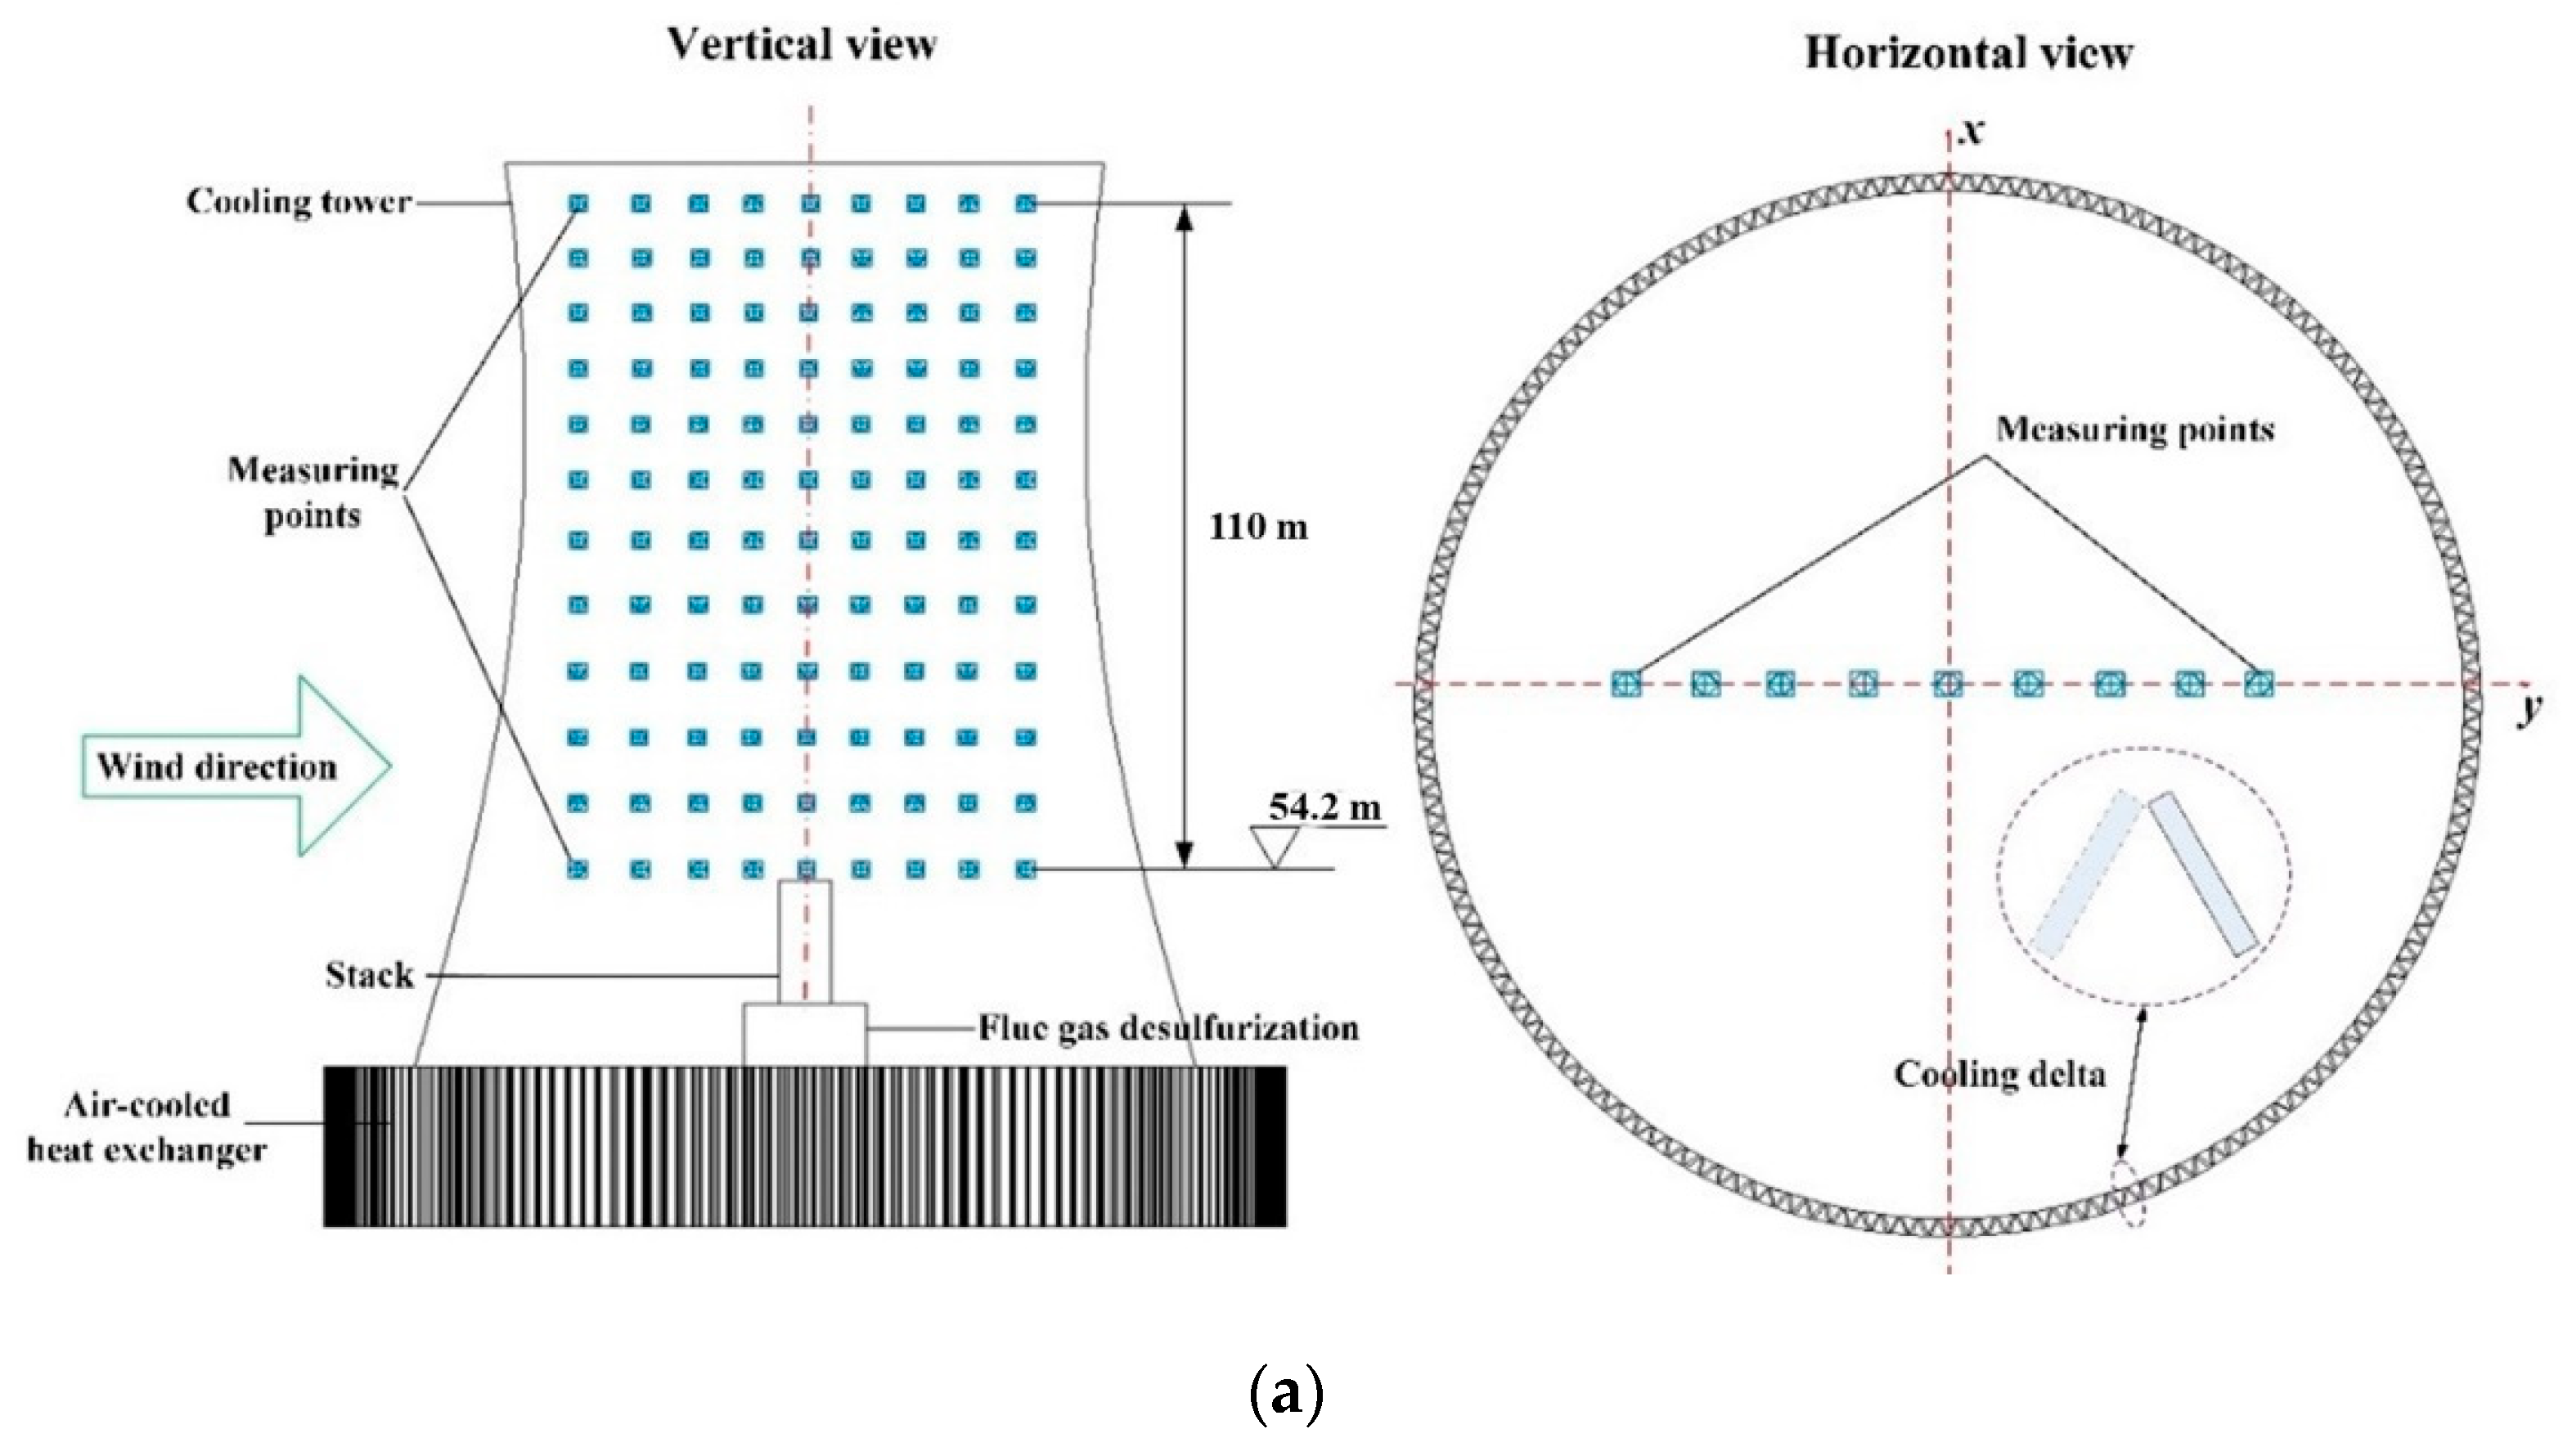
By carrying out the cooling air thermo-flow experiment with the scale model of an NDDCS in our previous works, the modeling and numerical methods are validated [3,30,45]. Based on the Euler scaling law, the heat exchanger bundles are replaced by the wire mesh with controllable heating power to characterize the heat rejection from the radiators. Crosswind is realized through adjusting the air flow by the centrifugal fans in the wind tunnel. Inside the cooling tower, 108 testing points are deployed along the z-direction with 12 layers and y-direction with 9 columns, as presented in Figure 5a. Each vertical distance between two testing points equals 10 m, while the horizontal distance is 9 m.
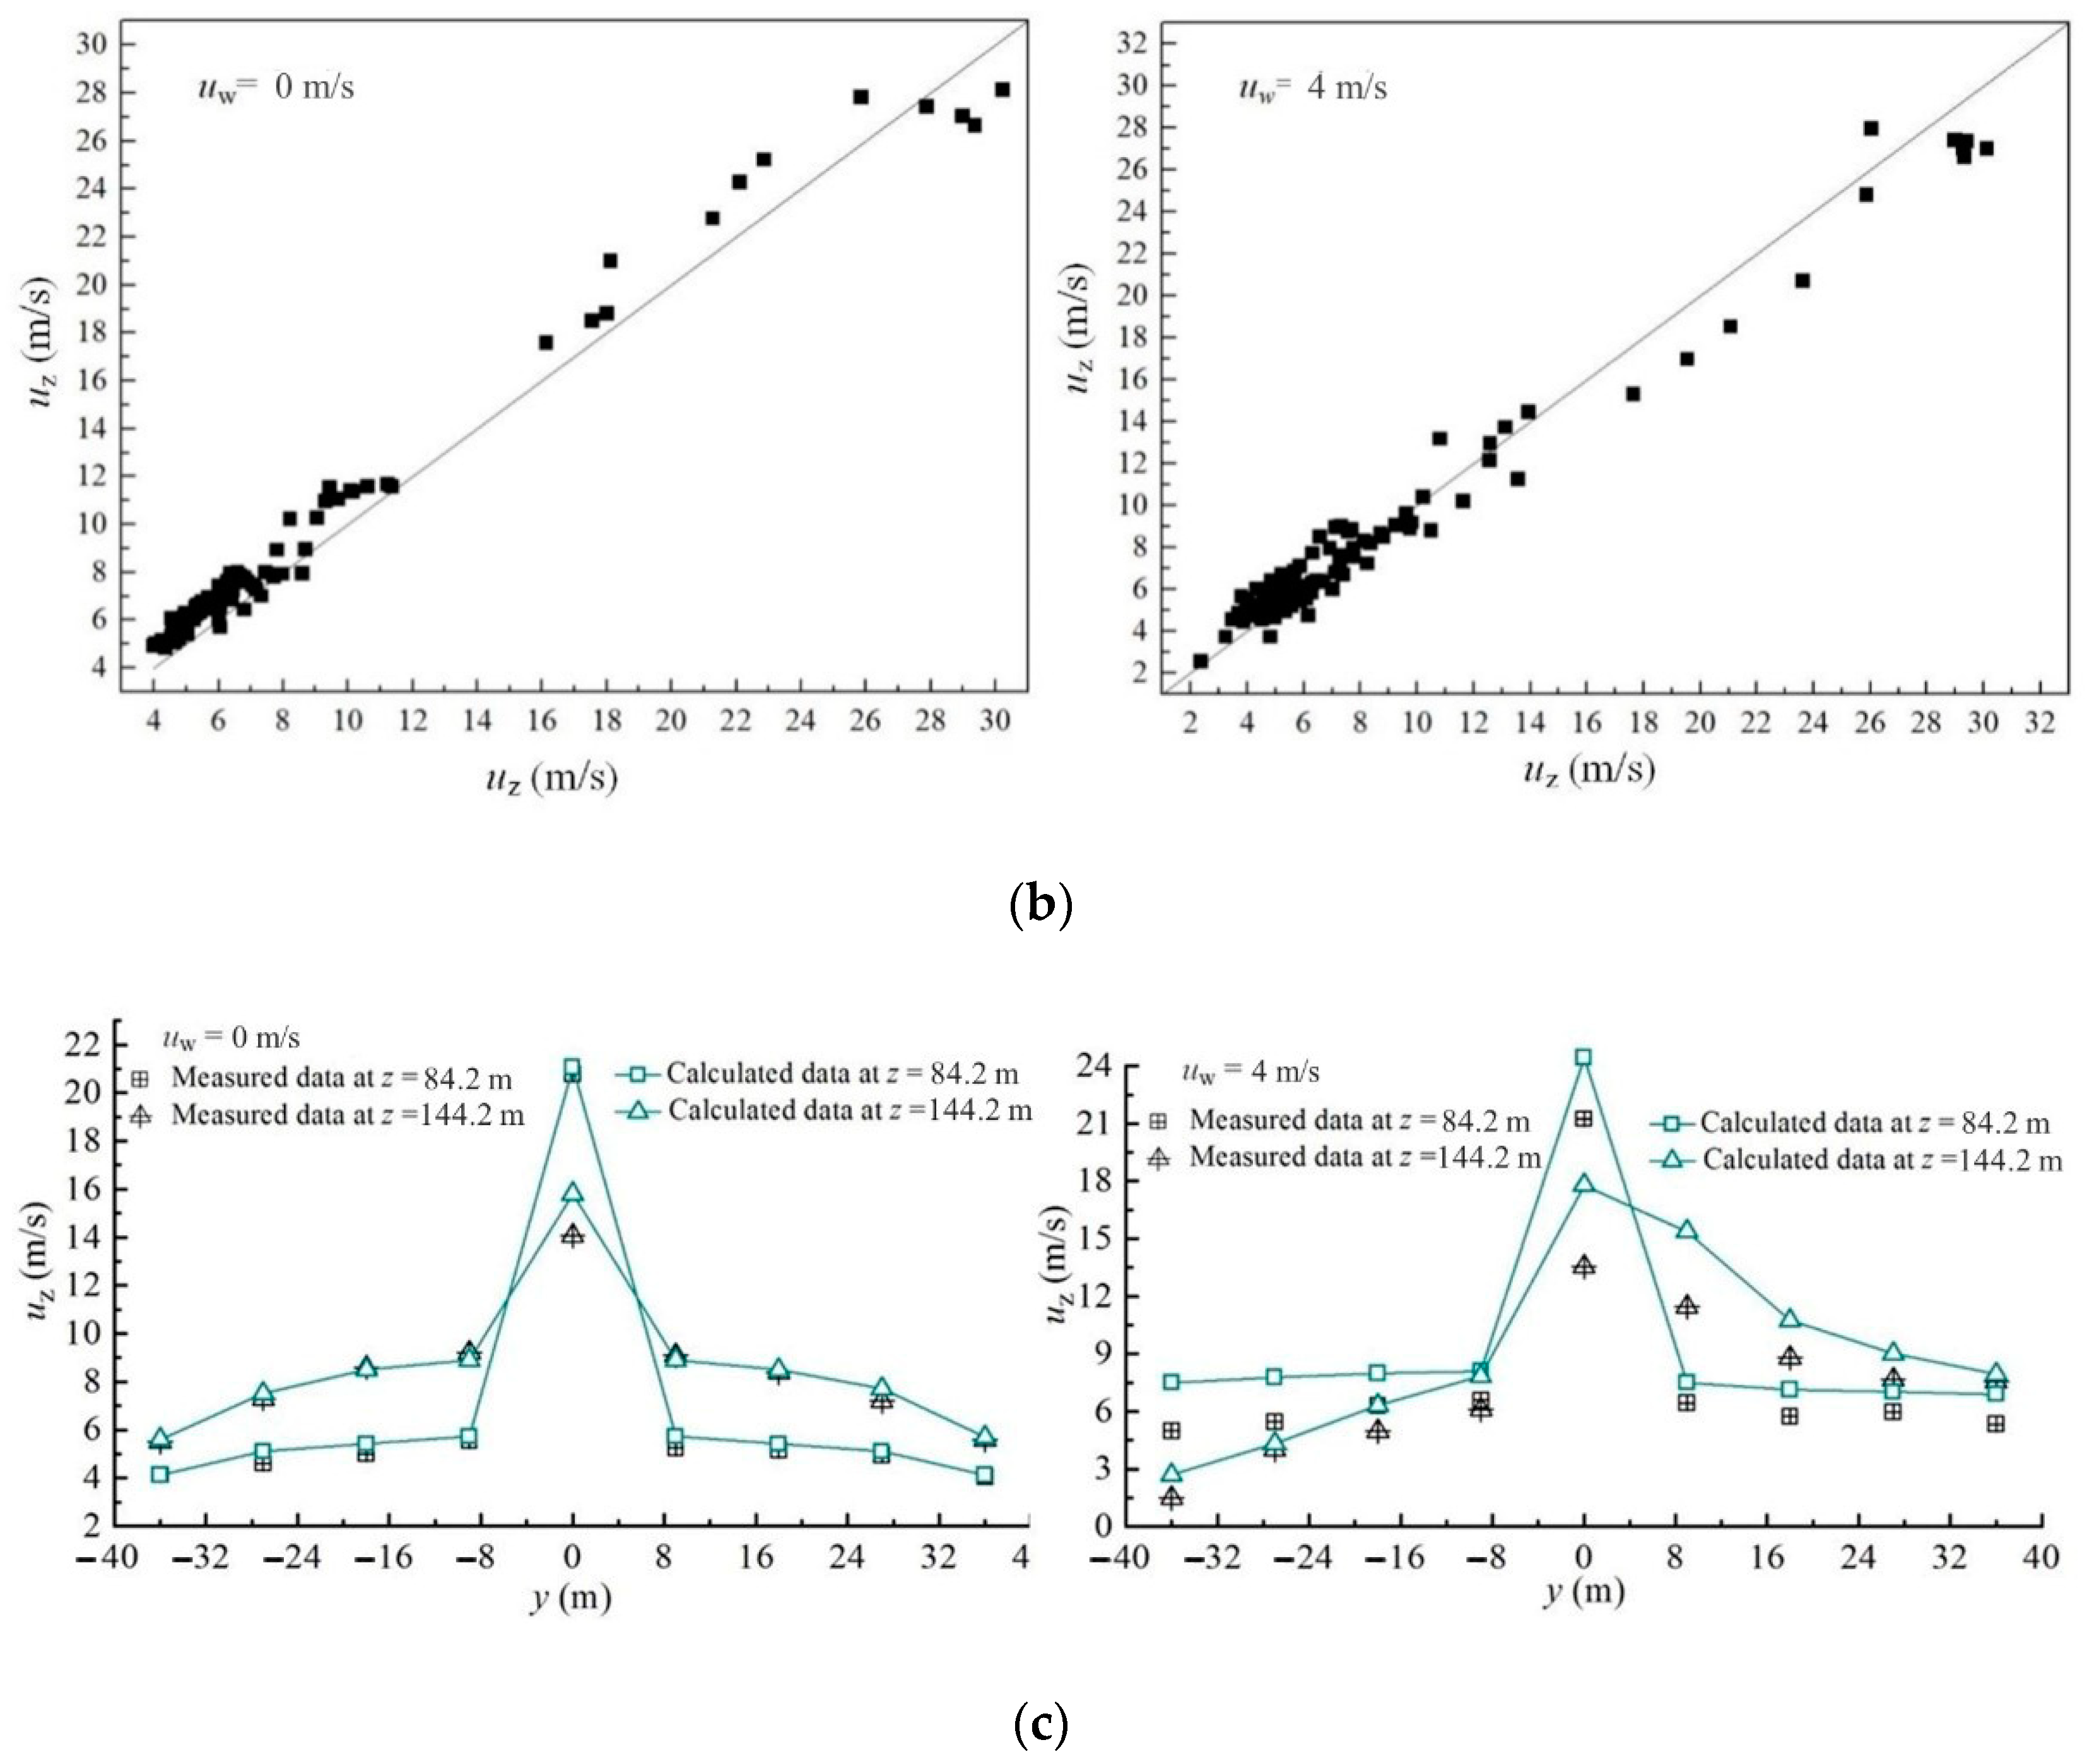
The numerical modeling is conducted according to the prototype configuration of the experimental NDDCS. Then, the numerical air ascending velocity was compared with the experiment in the absence of wind and at a crosswind of 4 m/s. The relative error of the ascending air velocity shows 13.25% and 12.7% in the absence of wind and at a crosswind of 4 m/s, as displayed in Figure 5b. The difficulty of measuring the low wind speed as well as some boundary effects which are uncontrollable in the experiment may cause such errors. Fortunately, the experimental trend of the 108 testing points validates well with the numerical modeling. As illustrated, Figure 5c shows their comparison at the typical heights of 84.2 m and 144.2 m. In both cases, the flue gas discharge of the stack causes higher velocity at the tower center than at other locations. Furthermore, in the absence of wind, the air ascending velocity at the tower center with a height of 144.2 m decreases versus that with a height of 84.2 m. Under a crosswind of 4 m/s at a height of 144.2 m, the air ascending velocity in the frontal side of the cooling tower increases much more slowly than that at the rear side due to the blocking effects of the upward air flows. Conclusively, the numerical and experimental results agree well with each other, which implies that the introduced numerical modeling methods could predict the thermo-flow characteristics of the NDDCS accurately.

3. Results and Discussions

In this research, for an NDDCS with one tower operating in the cases of two units and one unit, the thermo-flow performances of the cooling deltas and air-cooled sectors are firstly illustrated in Section 3.1 and Section 3.2. Then, the overall cooling performances of the cooling systems are presented and discussed in Section 3.3.

3.1. Thermo-Flow Performances of Cooling Deltas with One/Two Unit(s)

Figure 6 reveals the heat rejections and water outlet temperatures of double-layer cooling deltas in the absence of wind in the cases of two units and one unit. It can be seen that the heat rejections of cooling deltas show higher in layer A than in layer B. Therefore, the water outlet temperatures present correspondingly lower. As also observed, in the operating case of one unit, half of the air-cooled sectors quit operation meaning that the cooling capability of the NDDCS will decrease significantly, which leads to the reduced heat rejections and increased water outlet temperatures of the cooling deltas.
Figure 7 displays the heat rejections and water outlet temperatures of double-layer cooling deltas under a typical crosswind of 4 m/s in the cases of two units and one unit. Similar to the no-wind condition, air-cooled heat exchangers in layer A possess obviously better thermo-flow characteristics than in layer B. While under the crosswind effects, the cooling deltas in different sectors present quite non-uniform heat rejection and water outlet temperature distributions. Besides this, the phenomenon is more apparent in the case of one unit. This implies that the non-uniform thermo-flow characteristics of cooling deltas will be aggravated with sectors off. As also pointed out, cooling deltas in the case of two units have improved thermo-flow characteristics than in the case of one unit.
Figure 8 shows the heat rejections and water outlet temperatures of double-layer cooling deltas under a typical crosswind of 12 m/s in the cases of two units and one unit. When under gale wind conditions, the heat rejections and water outlet temperatures of cooling deltas in layer A and layer B have small differences. Besides this, the thermo-flow performance gap in the cases of two units and one unit also reduces. In addition, the high wind speed can result in conspicuously non-uniform heat transfer performances of cooling deltas in the two operating cases.

3.2. Thermo-Flow Performances of Air-Cooled Sectors with One/Two Unit(s)

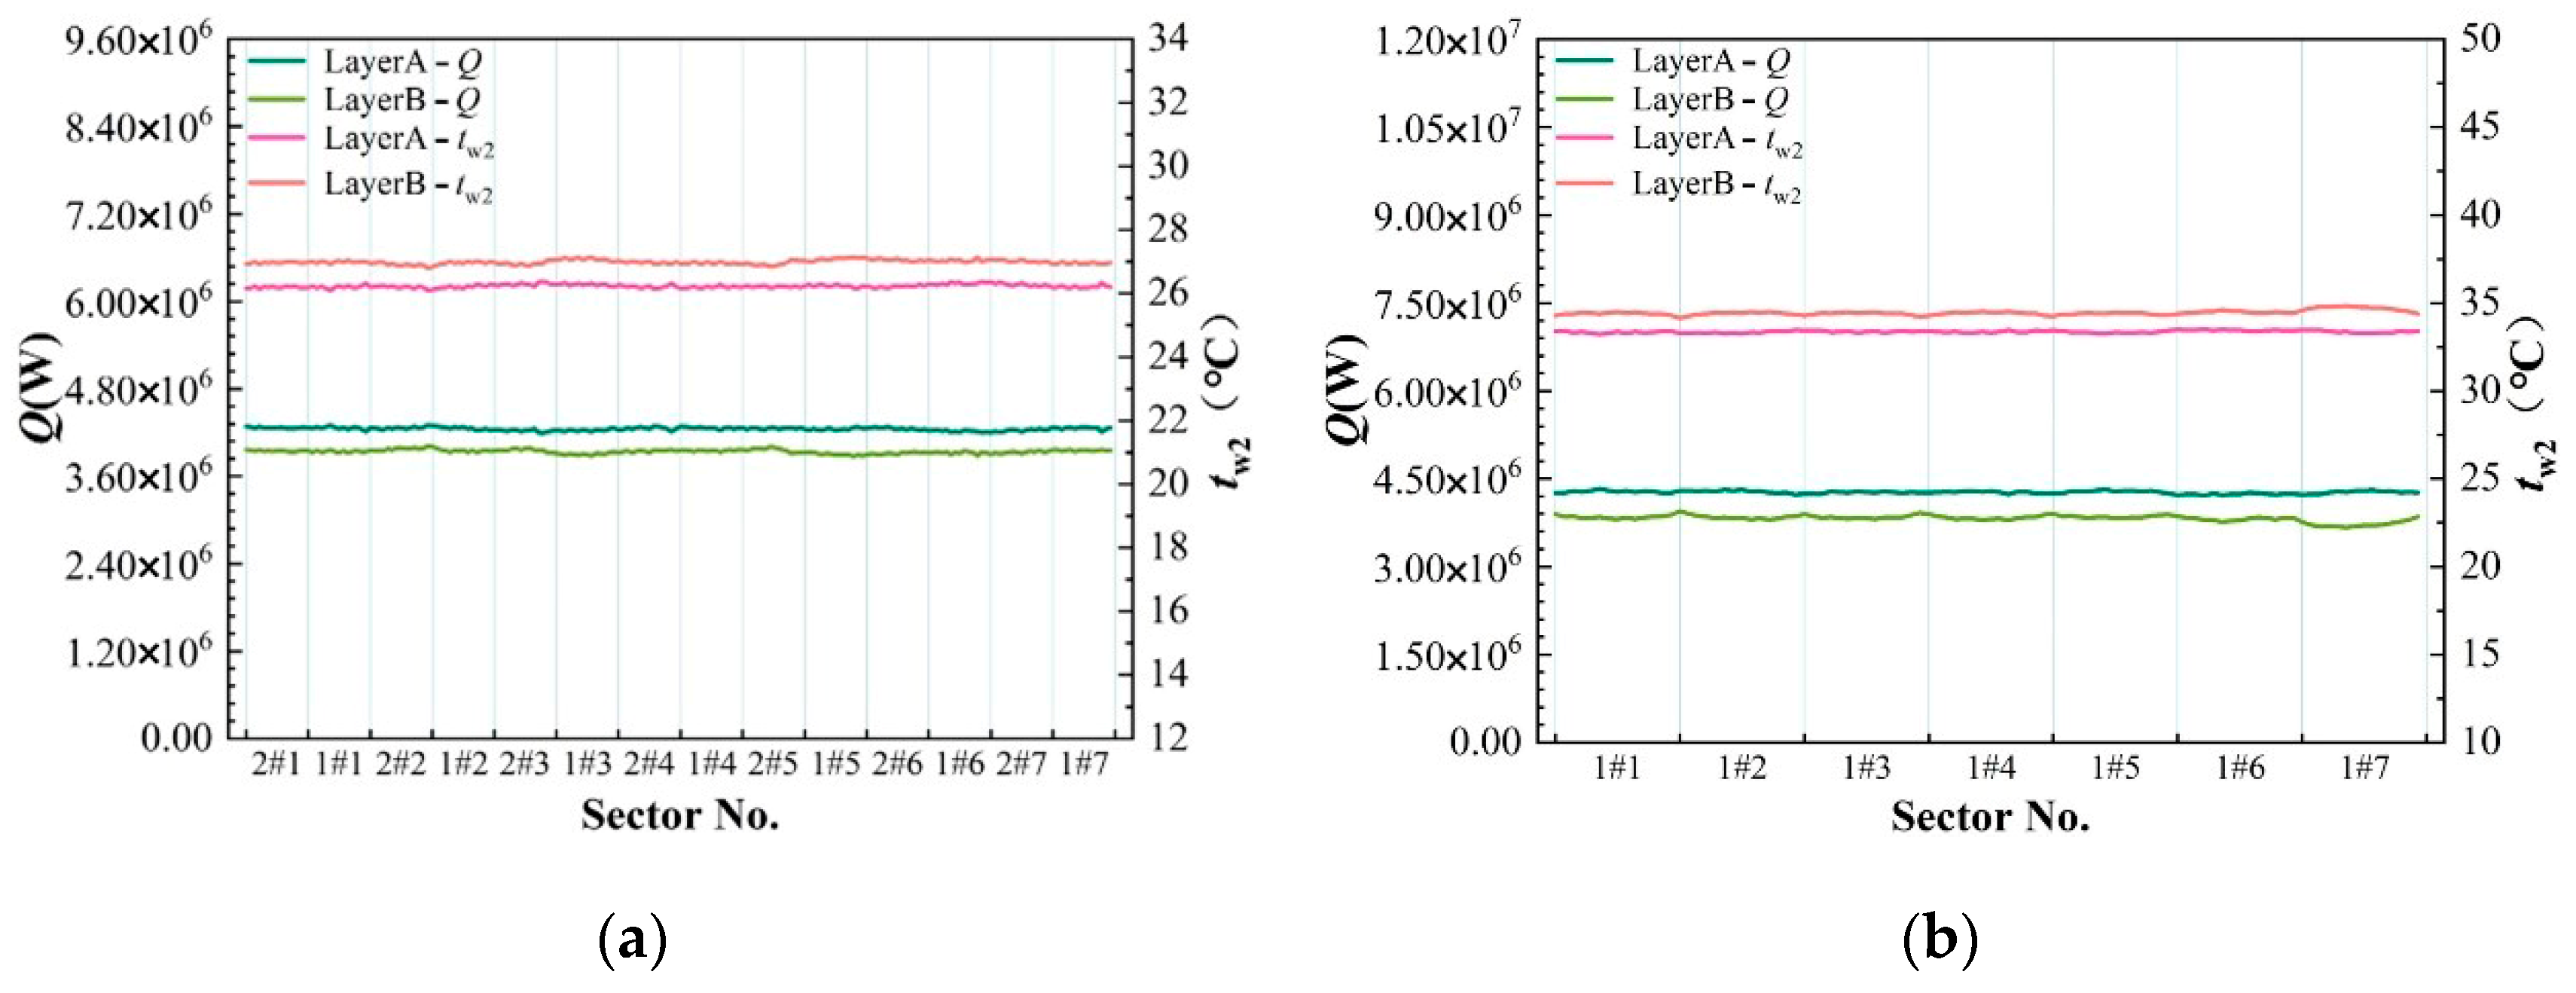
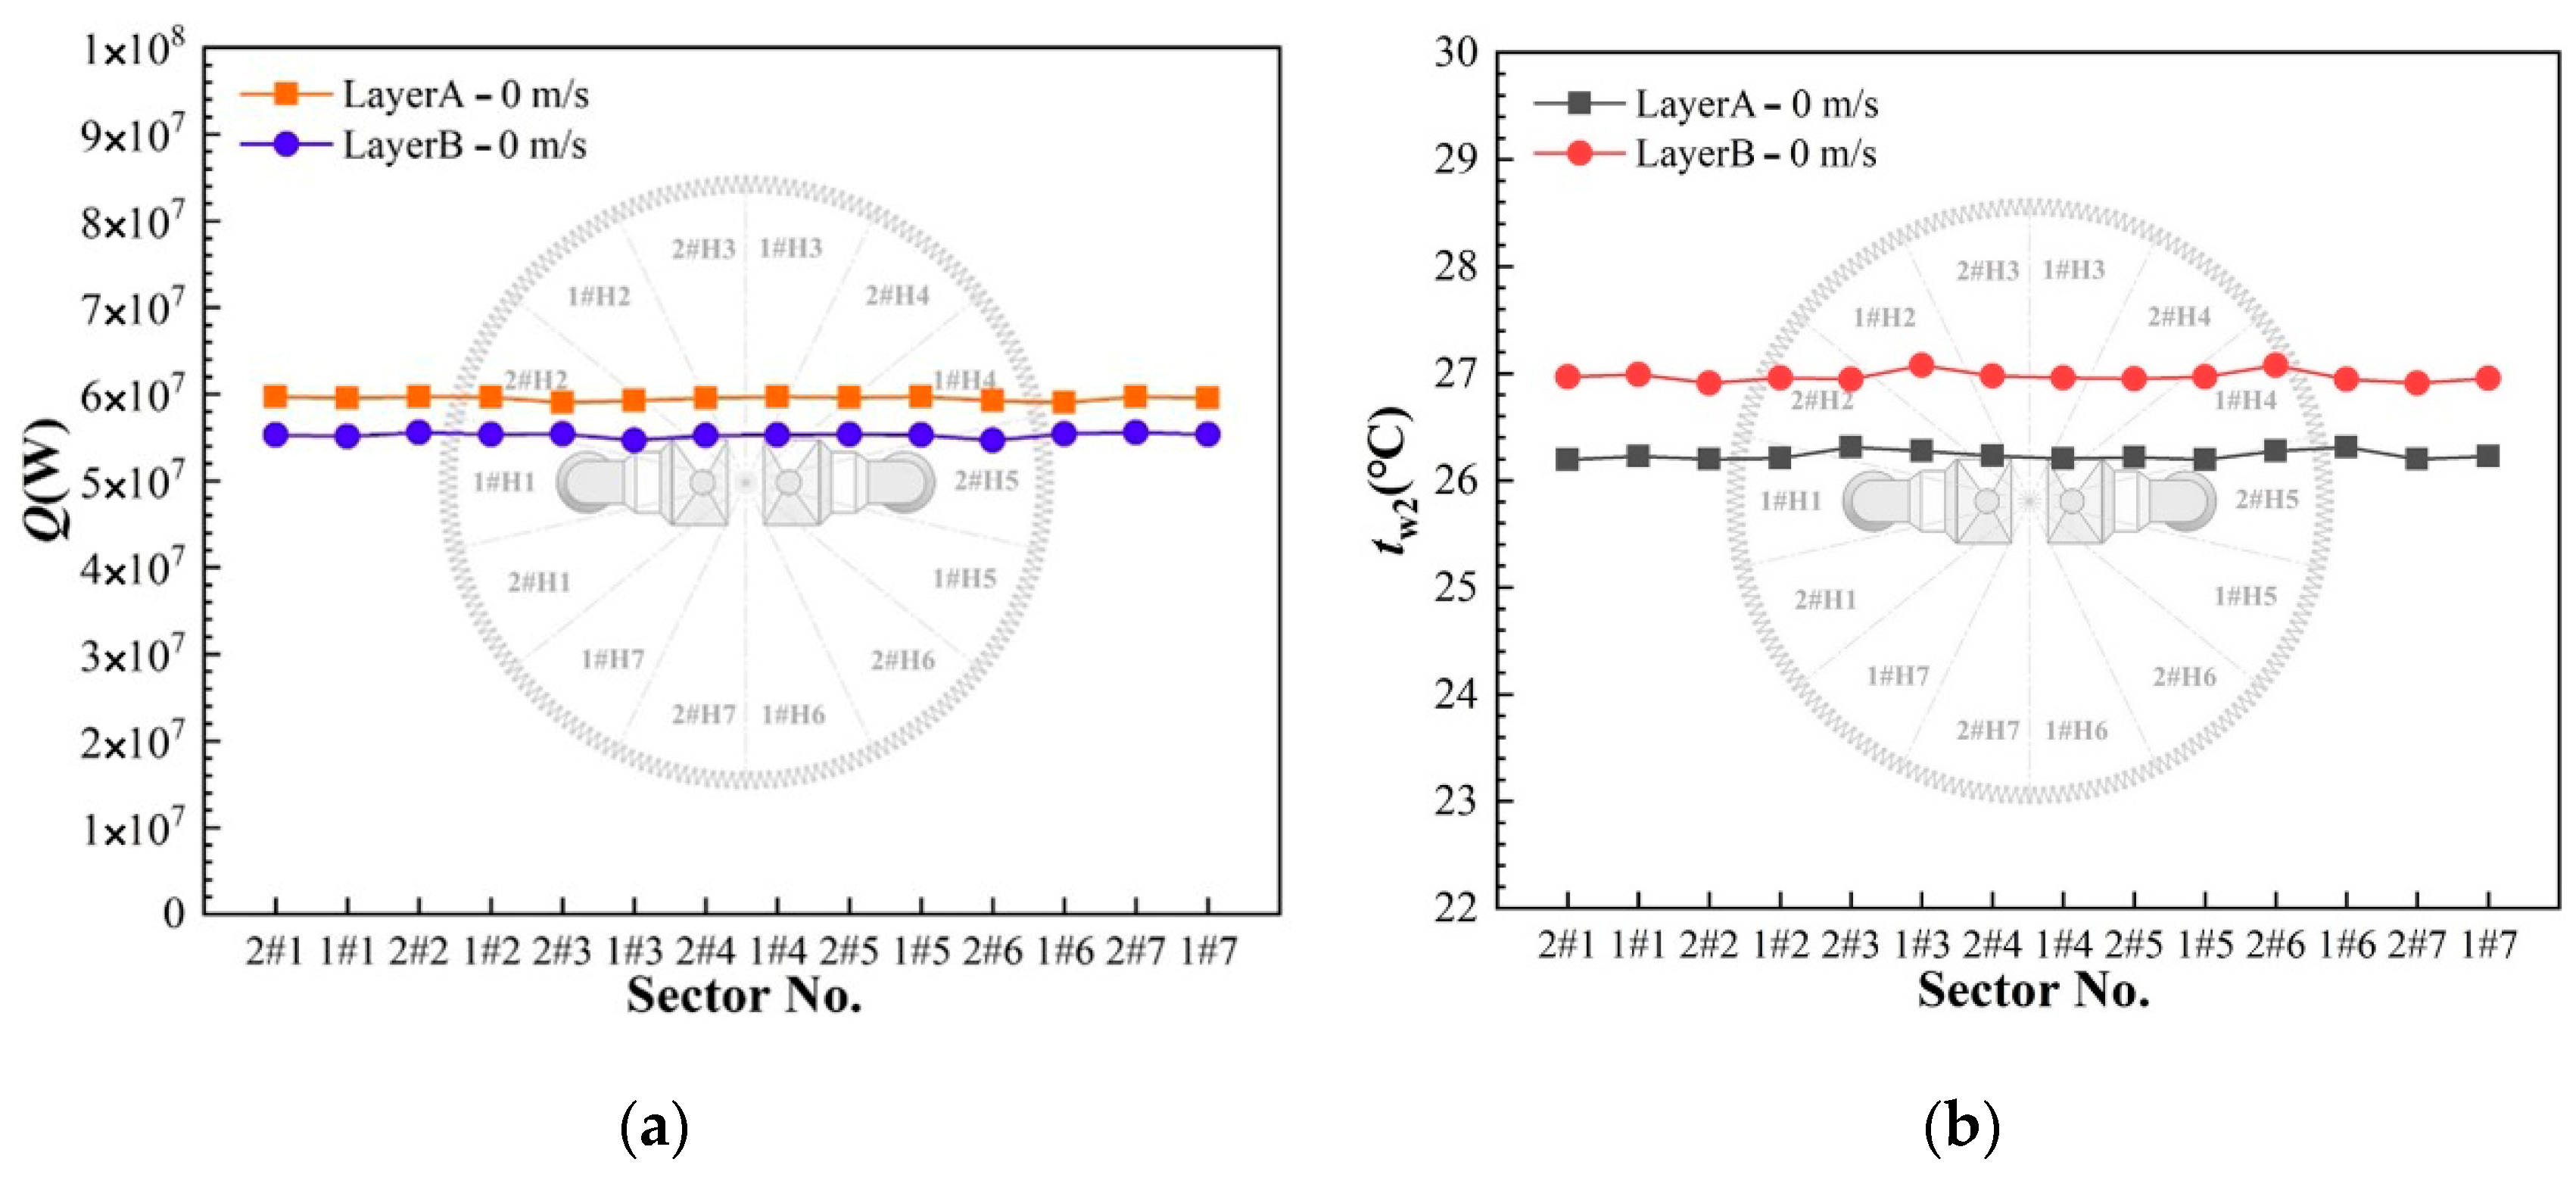
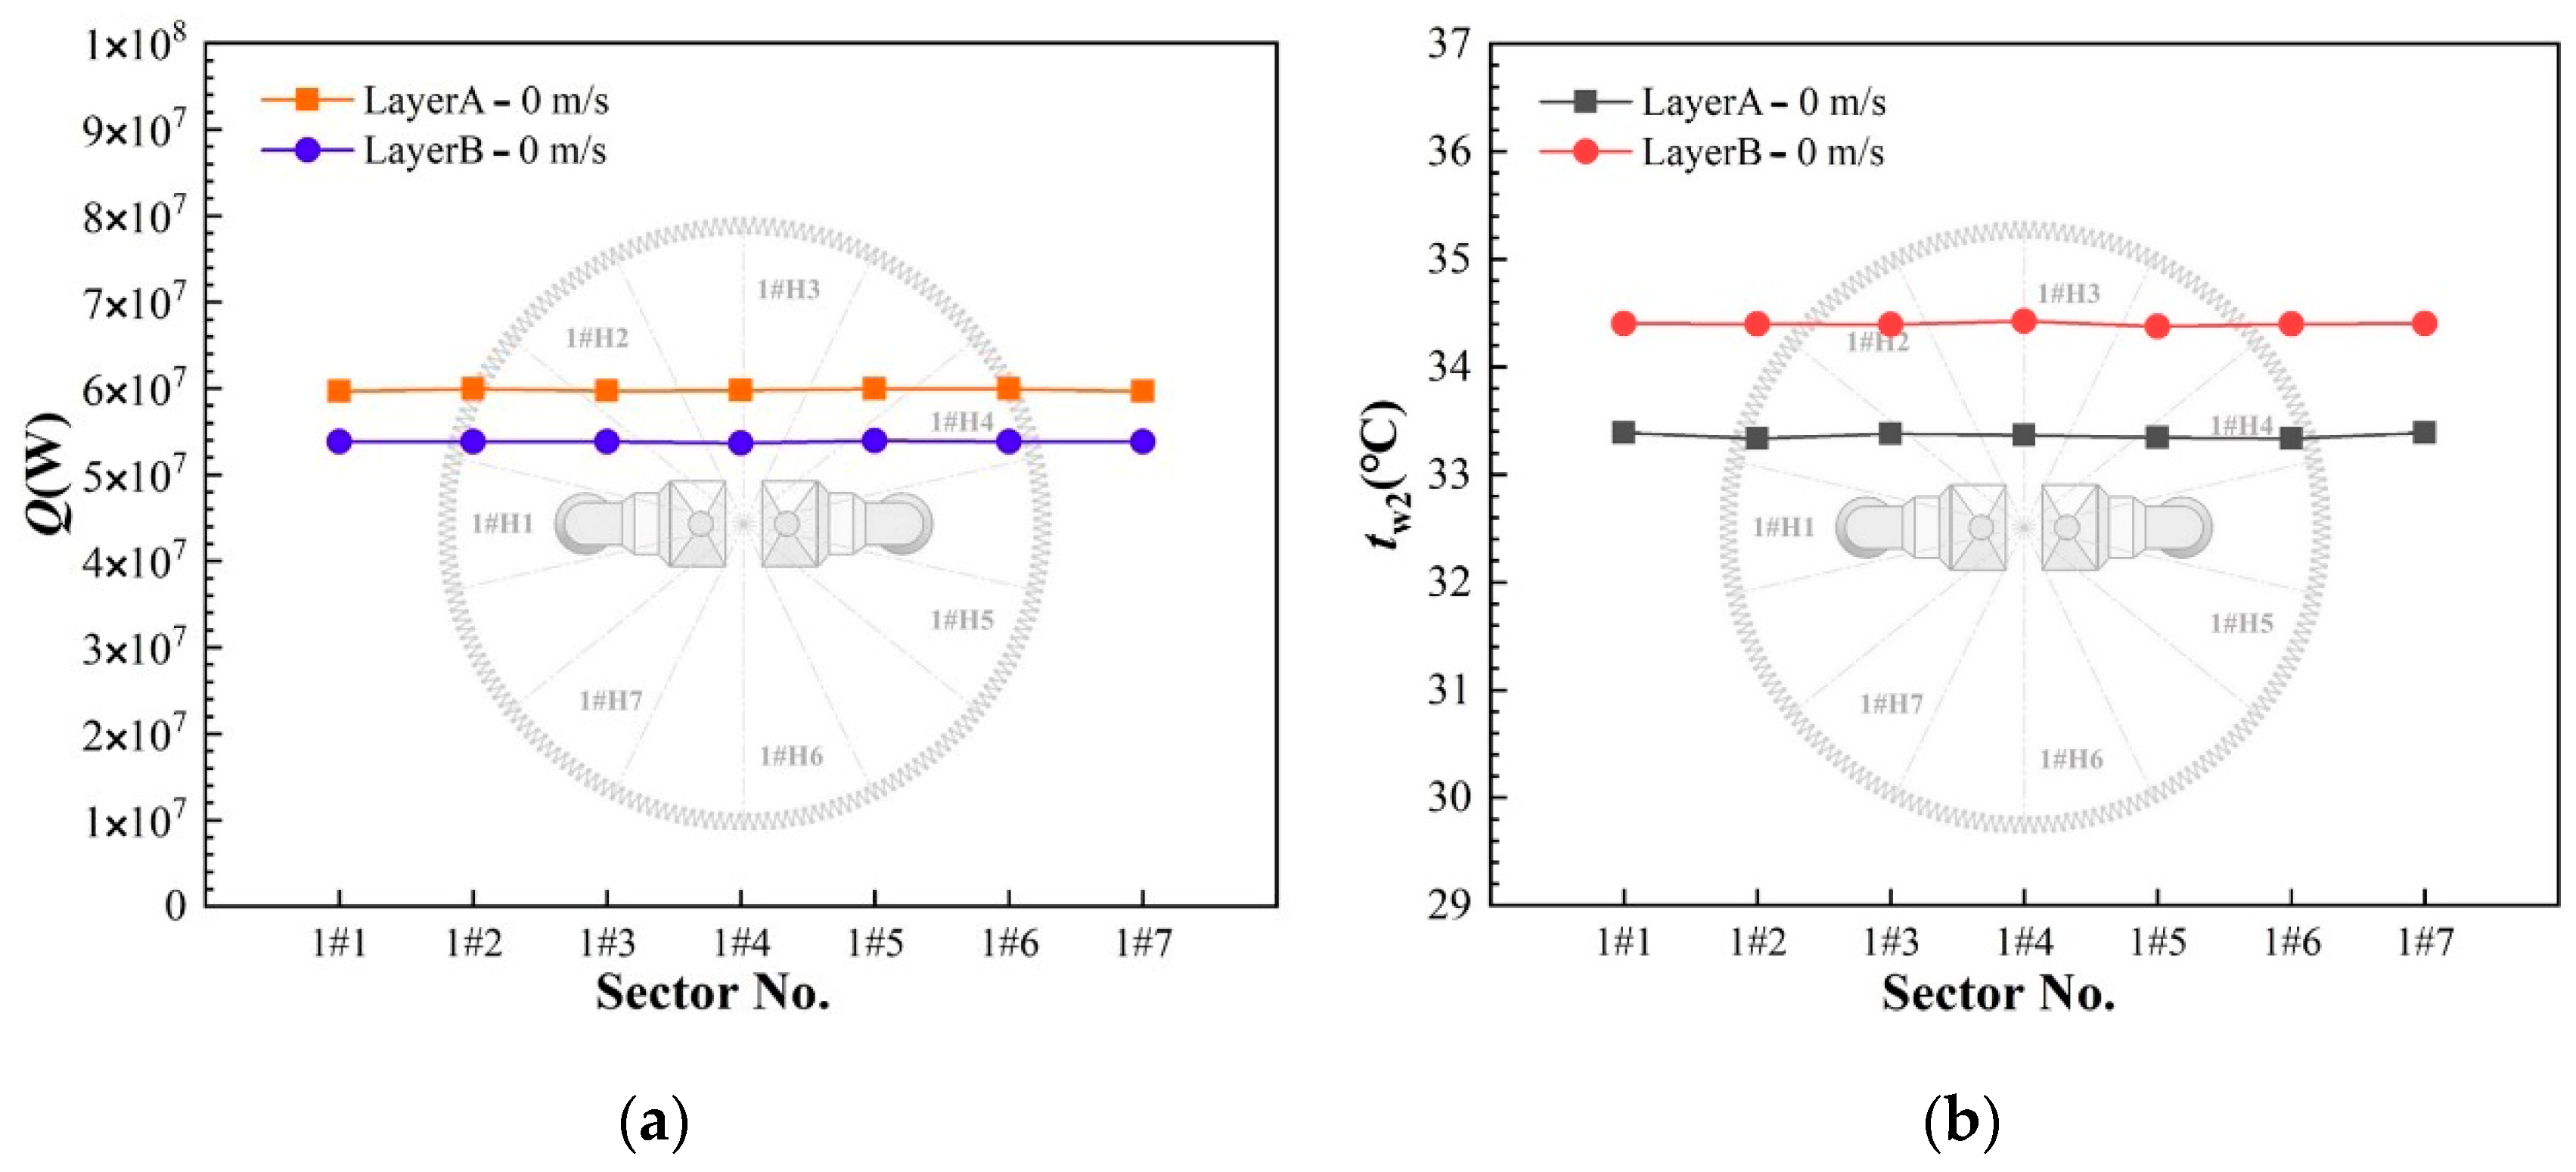
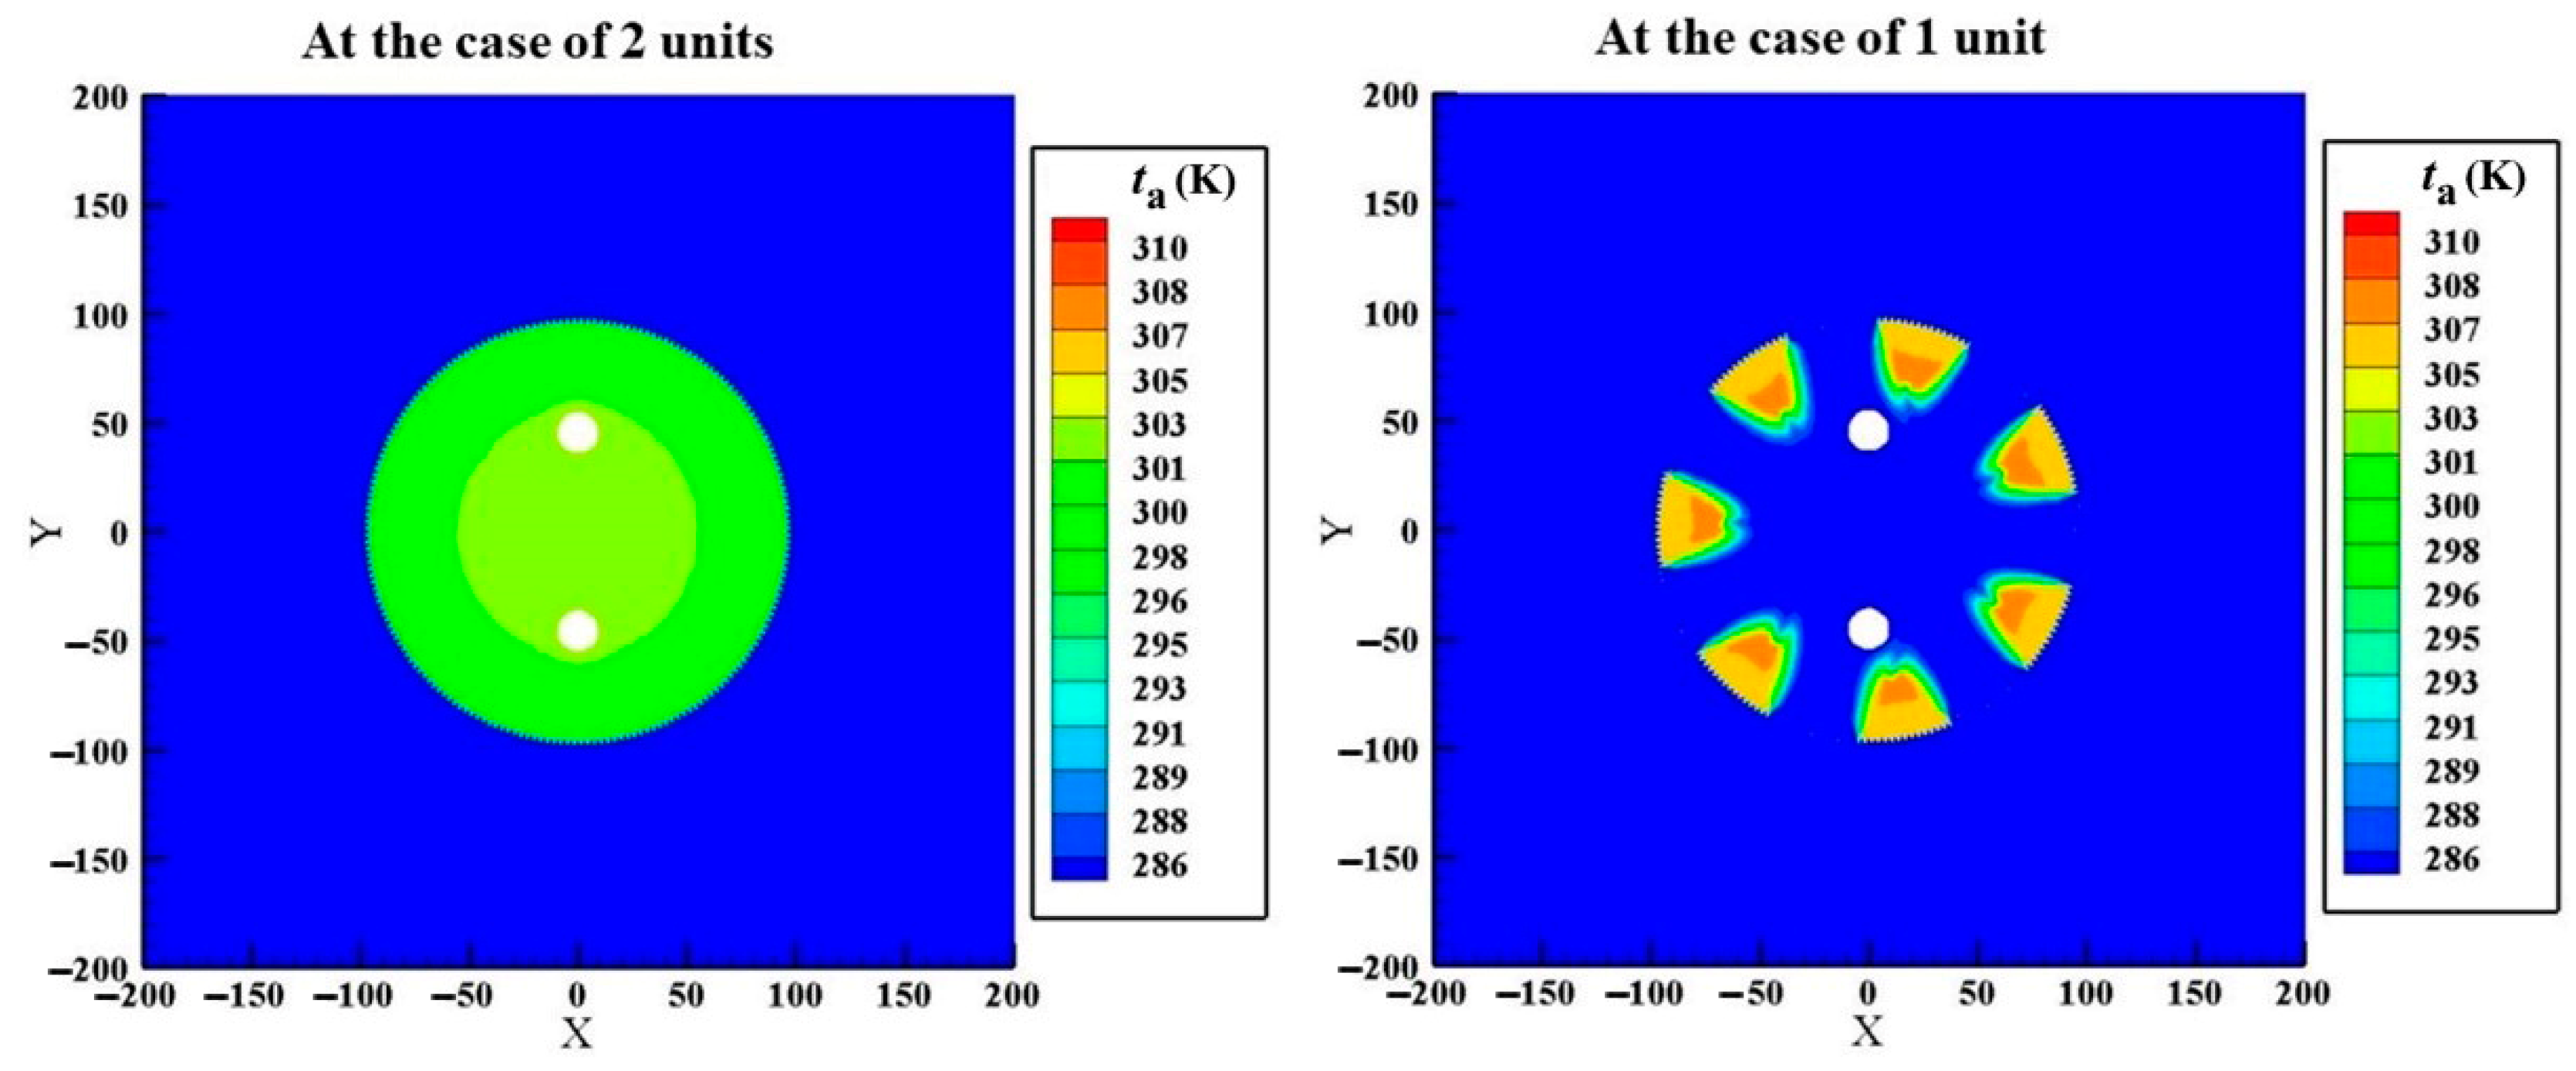
The heat rejections and water outlet temperatures of double-layer sectors in the absence of wind in the cases of two units and one unit are presented in Figure 9 and Figure 10, respectively. As can be seen, the heat rejections and water outlet temperatures of all sectors display nearly the same, meanwhile the sectors show more superior heat transfer characteristics in layer A than in layer B. In addition, Figure 10 proves that air-cooled sectors in the case of one unit have deteriorated thermo-flow performances compared with sectors in the case of two units in Figure 9. The air temperature fields of the ACHE in Figure 11 present a uniform distribution, which also show higher values in the case of one unit. This result denotes that when the air-side heat transfer surface of the ACHE decreases, the cooling capability of the operating sectors will be inevitably crippled.
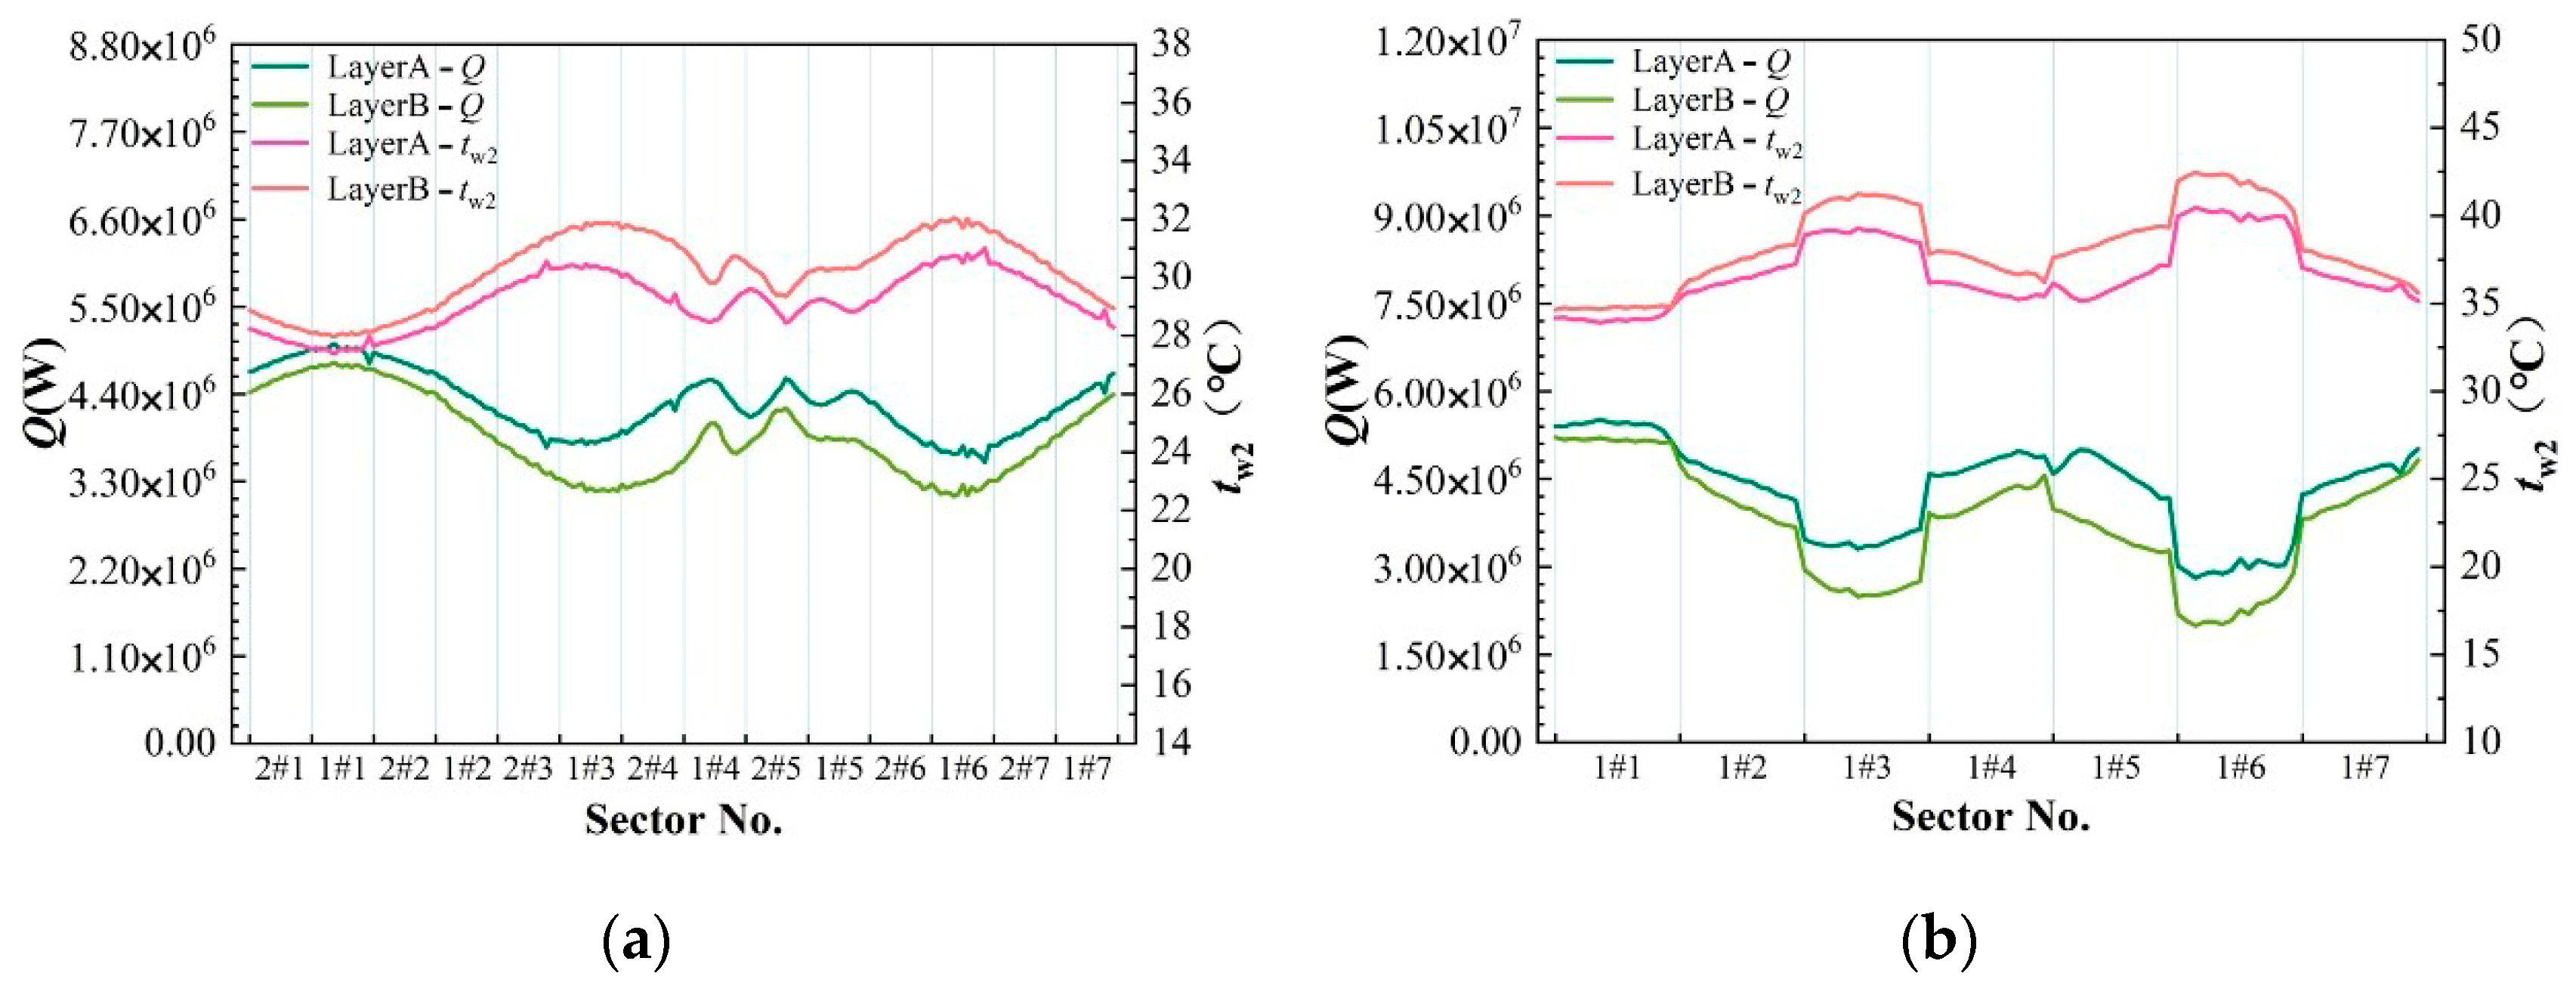
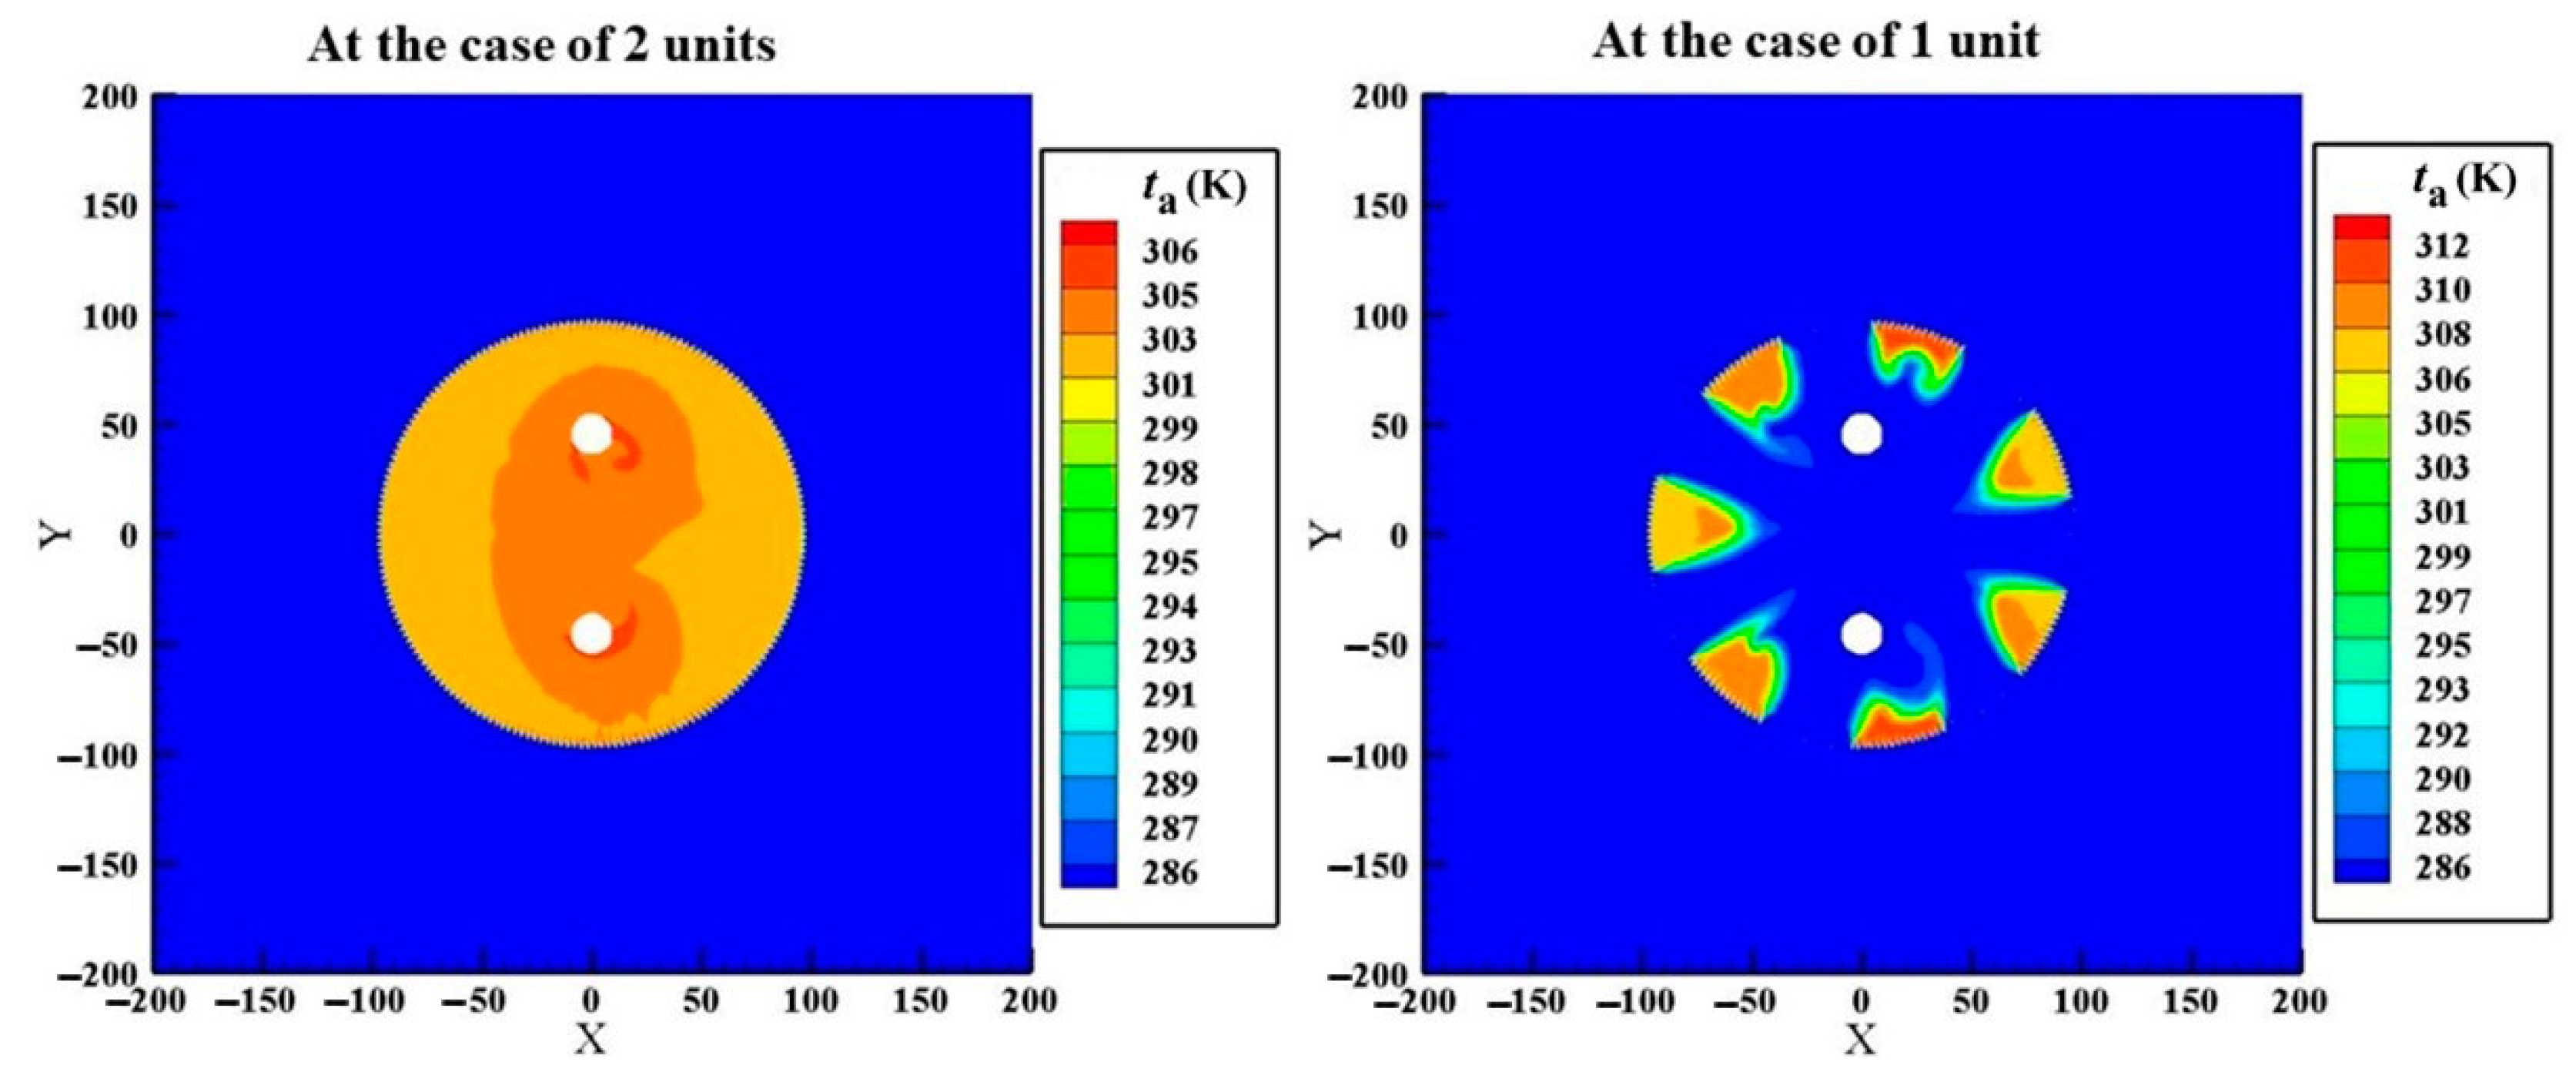
Under a typical crosswind of 4 m/s, Figure 12 and Figure 13 describe the heat rejections and water outlet temperatures of double-layer sectors in the cases of two units and one unit. Under the crosswind effects, sectors in layer A still have obviously higher heat rejections and lower water outlet temperatures than in layer B. With half sectors dismissed in the case of one unit, the non-uniform distribution of thermo-flow performances of all operating sectors becomes more evident. Moreover, the operating sectors present decreased heat transfer performance. The above results can be further validated by the air temperature fields given in Figure 14.
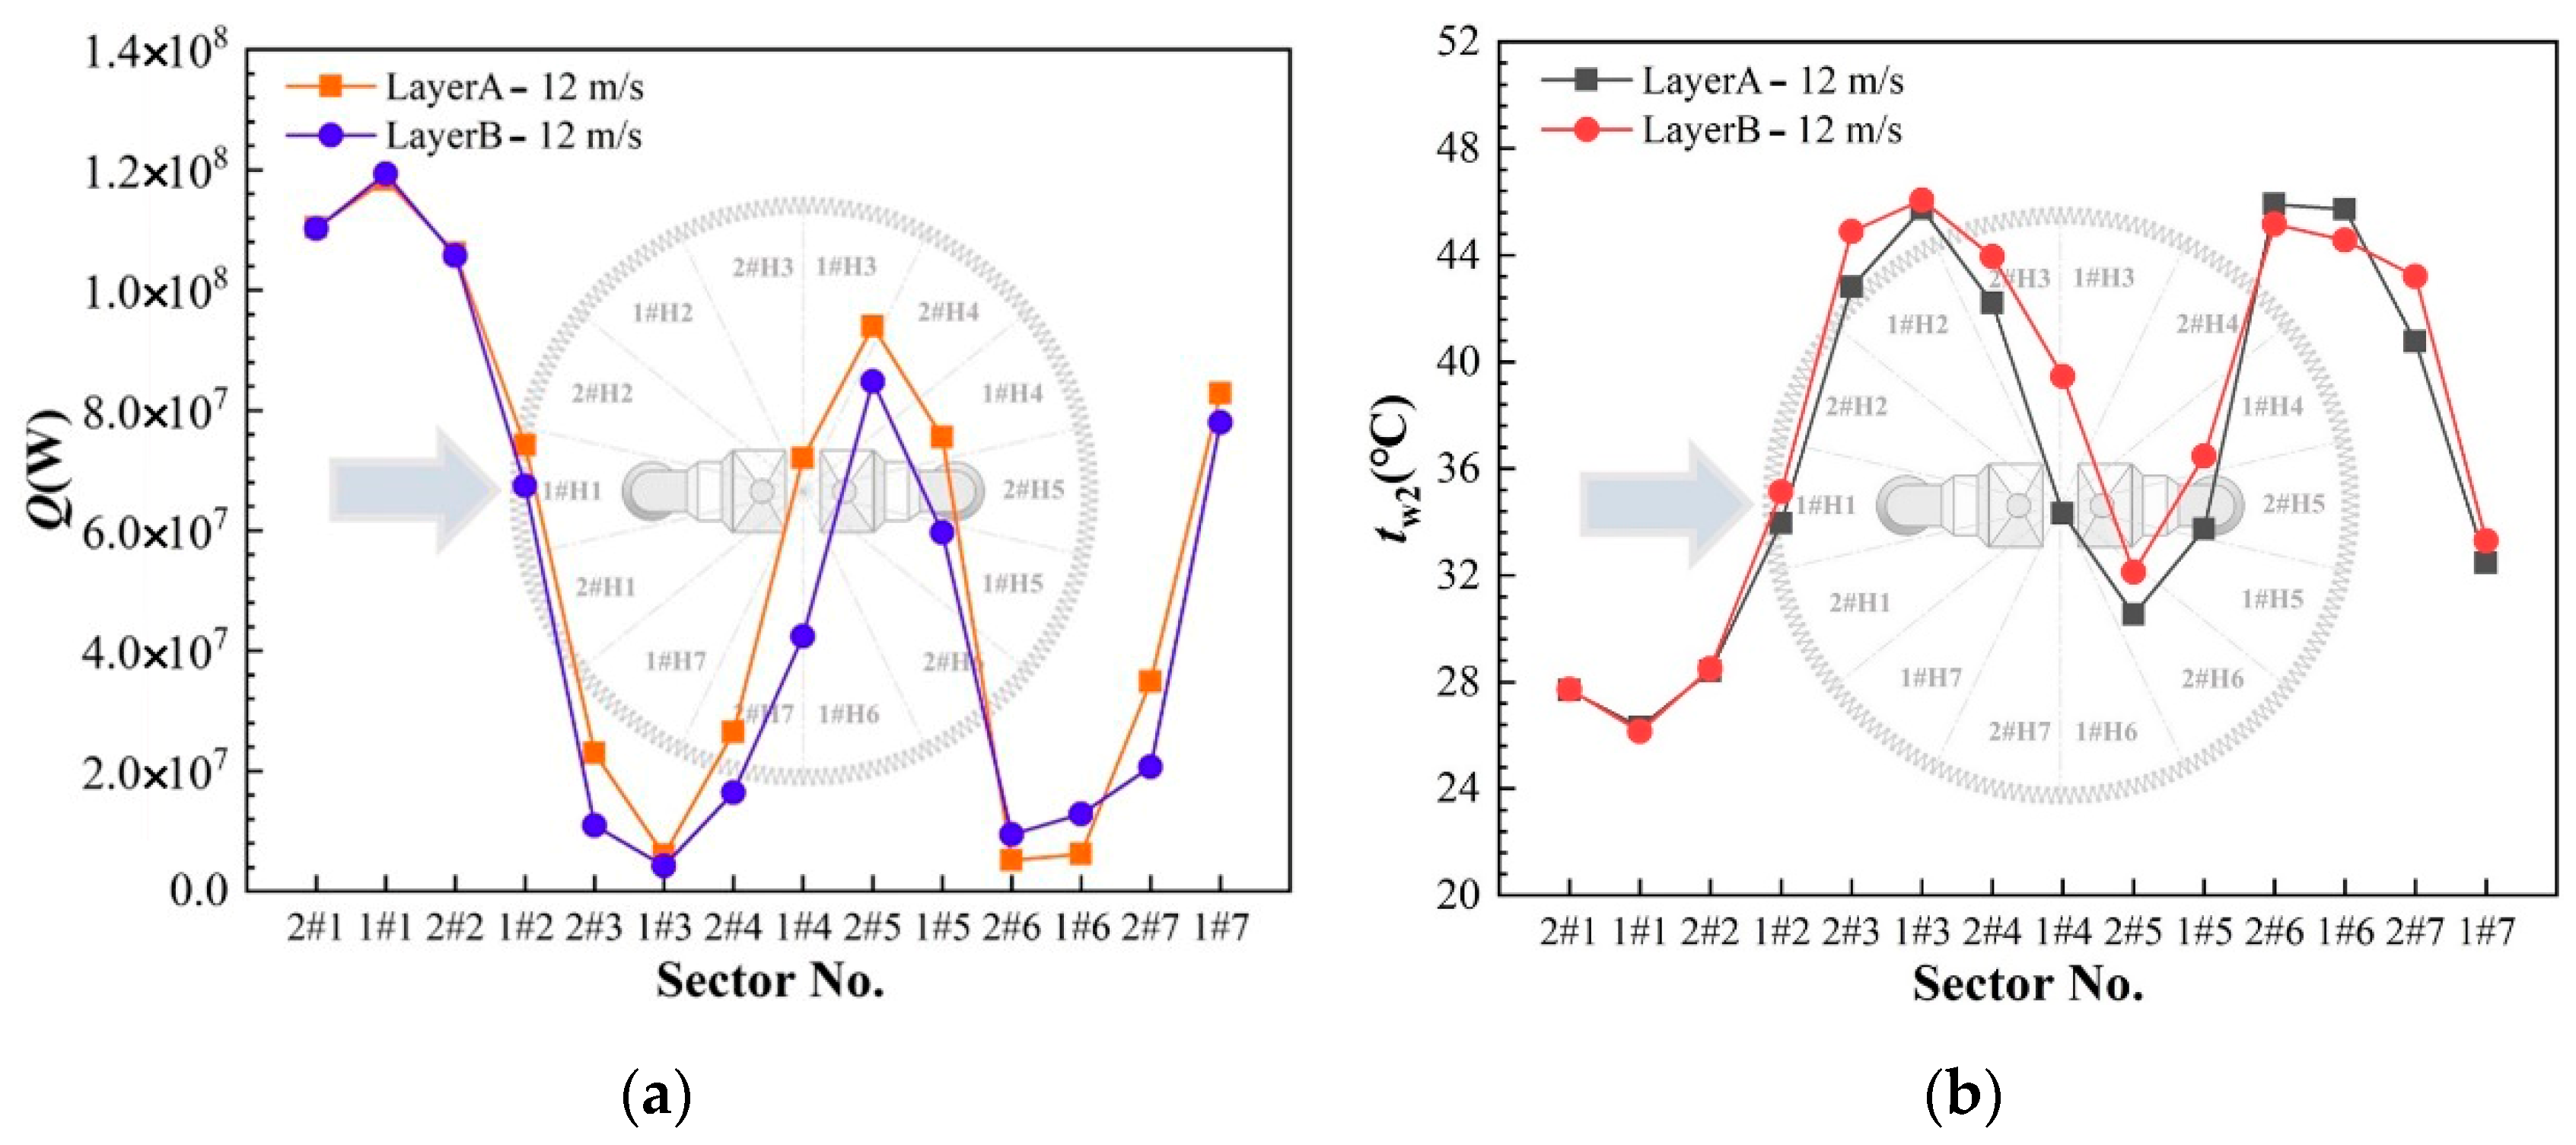
Under a typical crosswind of 12 m/s, the thermo-flow characteristics of double-layer sectors in the cases of two units and one unit are compared in Figure 15 and Figure 16. As observed, the flow and heat transfer characteristics of sectors in layer A and B show small differences under the high crosswind. Additionally, some middle sectors in layer B present slightly higher heat rejections and lower water outlet temperatures, which differ from the results in the absence of wind and at the small wind speed. Sector dismissal could reduce the heat transfer performances of the ACHE slightly. As further illustrated, Figure 17 depicts the significantly deteriorated air temperature fields in both operating cases, implying the complicated thermo-flow performances of cooling systems under a high crosswind.

3.3. Overall Cooling Performances of NDDCS with One/Two Unit(s)

The overall cooling performances of an NDDCS with one tower in the cases of two units and one unit are illustrated in the following Figure 18, Figure 19, Figure 20 and Figure 21 by analyzing the heat rejections, air mass flow rates, water outlet temperatures of the ACHE, and the turbine back pressures under various typical crosswind conditions.
As observed in Figure 18 and Figure 19, an NDDCS in the case of two units has a more superior cooling capability than in the case of one unit with half air-cooled sectors dismissed. Both the heat rejection and air mass flow rate decrease at first and then recover with the increase in the crosswind. Furthermore, the worst thermo-flow performance appears at the wind speed of 12 m/s and 8 m/s in the case of two units and one unit, respectively. Figure 20 and Figure 21 present the corresponding water outlet temperature of the ACHE and the turbine back pressure. It can be seen that the ACHE has much higher water outlet temperatures at various wind speeds when half the air-side heat transfer area is dismissed. The turbine back pressure increases in correspondence with the cooling capability of the NDDCS, implying the decreased energy efficiency of the power plant. Additionally, the largest elevation of turbine back pressure approaches as high as 4.37 kPa under a crosswind of 8 m/s.

4. Conclusions

Through numerical simulation, the thermo-flow characteristics of an NDDCS with one tower in 2 × 660 MW power-generating units were studied in the operating cases of two units and one unit under various crosswinds. The main findings are concluded as follows.
(1) In the case of one power-generating unit with half sectors off, the thermo-flow performances of cooling deltas, sectors, and the entire cooling system are crippled at various wind speeds.
(2) The turbine back pressure difference between two units and one unit gets much larger if the wind speed becomes smaller than 8 m/s, meanwhile the biggest gap could reach as high as 4.37 kPa.
(3) In both cases of two units and one unit, the air-cooled heat exchanger in layer A has a better heat transfer performance than that in layer B, especially in the absence of wind and under the relatively small wind speed of 4 m/s.
(4) For an NDDCS with one tower in 2 × 660 MW power-generating units, the operation of one unit is not recommended because of the decreased energy efficiency.
In the near future, the thermo-flow performances of this typical NDDCS under different power outputs will be investigated for further improvement of cooling efficiency. At the same time, this research may provide some theoretical guidelines for the design of NDDCSs with one tower in other high-capacity power plants with 2 × 350 MW, 2 × 600 MW (660 MW), and 4 × 600 MW (660 MW) power-generating units.

Author Contributions

Conceptualization, L.Y. and Y.N.; methodology, W.W.; software, M.L.; validation, X.Z., Z.Z. and H.Z.; formal analysis, M.L.; investigation, K.J.; resources, W.W.; data curation, L.C.; writing—original draft preparation, W.W.; writing—review and editing, L.Y.; visualization, L.C.; supervision, Y.N.; project administration, W.W.; funding acquisition, L.Y. All authors have read and agreed to the published version of the manuscript.

Funding

This research received no external funding.

Institutional Review Board Statement

Not applicable.

Informed Consent Statement

Not applicable.

Data Availability Statement

Not applicable.

Acknowledgments

The National Natural Science Foundation of China (Grant No. 51776067, 51906065, 52006065) supported this research, which is gratefully acknowledged.

Conflicts of Interest

The authors declare we have no conflict of interest.

Abbreviations

Nomenclature
Aheat transfer surface area (m2)
cpspecific heat (J Kg−1 K−1)
Ddiameter (m)
fpressure loss coefficient
Hheight (m)
kturbulent kinetic energy (m2 s−2)
Ltube length (m)
mmass flow rate (kg s−1)
Nnumber
ppressure (Pa)
Qheat rejection (W)
Ssource term in generic equation
ttemperature (K)
uvelocity (m s−1)
Vvolume (m3)
Wwidth (m)
Greek symbols
εturbulence dissipation rate (m2 s−3)
εmacroheat exchanger effectiveness
Γdiffusion coefficient (m2 s−1)
φscalar variable
ρdensity (kg m−3)
Subscripts
aair
wwind
wawater
1inlet
2outlet
Acronyms
ACHEair-cooled heat exchanger
GCSgas condensing system
NDDCSnatural draft dry cooling system
WESPwet electrostatic precipitator
1 #one power-generating unit
2 #two power-generating unit

References

  1. Kroger, D.G. Air-Cooled Heat Exchangers and Cooling Towers: Thermal-Flow Performance Evaluation and Design; Penn Well Corporation: Tulsa, OK, USA, 2004. [Google Scholar]
  2. Yang, L.J.; Wu, X.P.; Du, X.Z.; Yang, Y.P. Dimensional characteristics of wind effects on the performance of indirect dry cooling system with vertically arranged heat exchanger bundles. Int. J. Heat Mass Transf. 2013, 67, 853–866. [Google Scholar] [CrossRef]
  3. Wang, W.J.; Chen, L.; Kong, Y.Q.; Yang, L.J.; Niu, Y.G.; Du, X.Z. Cooling performance evaluation for double-layer configuration of air-cooled heat exchanger. Int. J. Heat Mass Transf. 2020, 151, 119396. [Google Scholar] [CrossRef]
  4. Dai, Y.; Lu, Y.; Klimenko, A.Y.; Wang, Y.; Hooman, K. Numerical investigation of swirl effects on a short natural draft dry cooling tower under windless and crosswind conditions. Appl. Therm. Eng. 2021, 21, 116628. [Google Scholar] [CrossRef]
  5. Khamooshi, M.; Anderson, T.N.; Nates, R.J. A numerical study on interactions between three short natural draft dry cooling towers In an in-line arrangement. Int. J. Therm. Sci. 2021, 159, 106505. [Google Scholar] [CrossRef]
  6. Ge, W.; Zhao, Y.; Song, S.; Li, W.; Gao, S.; Chen, T. Thermal characteristics of dry cooling tower reconstructed from obsolete natural draft wet cooling tower and the relevant thermal system coupling optimization—ScienceDirect. Appl. Therm. Eng. 2020, 174, 115202. [Google Scholar] [CrossRef]
  7. Yang, G.; Ding, L.; Guo, T.; Li, X.; Tian, W.; Xu, Z.; Wang, Z.; Sun, F.; Min, J.; Xu, J.; et al. Study of flue gas emission and improvement measure in a natural draft dry-cooling tower with flue gas injection under unfavorable working conditions. Atmos. Pollut. Res. 2020, 11, 963–972. [Google Scholar] [CrossRef]
  8. Song, G.; Zhi, X.; Fan, F.; Wang, W.; Wang, P. Cooling performance of cylinder-frustum natural draft dry cooling tower. Appl. Therm. Eng. 2020, 180, 115797. [Google Scholar] [CrossRef]
  9. Soltani, M.; Dehghani-Sanij, A.; Sayadnia, A.; Kashkooli, F.M.; Gharali, K.; Mahbaz, S.; Dusseault, M.B. Investigation of Airflow Patterns in a New Design of Wind Tower with a Wetted Surface. Energies 2018, 11, 1100. [Google Scholar] [CrossRef] [Green Version]
  10. Kashkooli, F.M.; Soltani, M.; Zargar, B.; Ijaz, M.K.; Taatizadeh, E.; Sattar, S.A. Analysis of an indoor air decontamination device inside an aerobiology chamber: A numerical-experimental study. Air Qual. Atmos. Health 2020, 13, 281–288. [Google Scholar] [CrossRef]
  11. Mehryan, S.A.M.; Kashkooli, F.M.; Soltani, M. Comprehensive study of the impacts of surrounding structures on the aero-dynamic performance and flow characteristics of an outdoor unit of split-type air conditioner. Build Simul. 2018, 11, 325–337. [Google Scholar] [CrossRef]
  12. Ma, H.; Si, F.Q.; Li, L.; Yan, W.S.; Zhu, K.P. Effects of ambient temperature and crosswind on thermo-flow performance of the tower under energy balance of the indirect dry cooling system. Appl. Therm. Eng. 2015, 78, 90–100. [Google Scholar] [CrossRef]
  13. Ma, H.; Si, F.Q.; Kong, Y.; Zhu, K.P.; Yan, W.S. A new theoretical method for predicating the part-load performance of natural draft dry cooling towers. Appl. Therm. Eng. 2015, 78, 1106–1115. [Google Scholar] [CrossRef] [Green Version]
  14. Zhao, Y.B.; Long, G.Q.; Sun, F.Z.; Li, Y.; Zhang, C.J. Numerical study on the cooling performance of dry cooling tower with vertical two-pass column radiators under crosswind. Appl. Therm. Eng. 2015, 75, 1106–1117. [Google Scholar] [CrossRef]
  15. Zhao, Y.B.; Sun, F.Z.; Li, Y.; Long, G.Q.; Yang, Z. Numerical study on the cooling performance of natural draft dry cooling tower with vertical delta radiators under constant heat load. Appl. Energy 2015, 149, 225–237. [Google Scholar] [CrossRef]
  16. Li, X.X.; Gurgenci, H.; Guan, Z.Q.; Sun, Y.B. Experimental study of cold inflow effect on a small natural draft dry cooling tower. Appl. Therm. Eng. 2018, 128, 762–771. [Google Scholar] [CrossRef] [Green Version]
  17. Li, X.X.; Gurgenci, H.; Guan, Z.Q.; Wang, X.R.; Xia, L. A review of the crosswind effect on the natural draft cooling towers. Appl. Therm. Eng. 2019, 150, 250–270. [Google Scholar] [CrossRef]
  18. Dong, P.X.; Li, X.X.; Sun, Y.B.; Hooman, K.; Guan, Z.Q.; Dai, Y.C.; Gurgenci, H. Numerical investigation of the influence of local effects on the transient start-up process of natural draft dry cooling towers in dispatchable power plants. Int. J. Heat Mass Transf. 2019, 133, 166–178. [Google Scholar] [CrossRef]
  19. Dong, P.X.; Li, X.X.; Hooman, K.; Sun, Y.B.; Li, J.S.; Guan, Z.Q.; Gurgenci, H. The crosswind effects on the start-up process of natural draft dry cooling towers in dispatchable power plants. Int. J. Heat Mass Transf. 2019, 135, 950–961. [Google Scholar] [CrossRef]
  20. Dai, Y.C.; Kaiser, A.S.; Lu, Y.S.; Klimenko, A.Y.; Dong, P.X.; Hooman, K. Addressing the adverse cold air inflow effects for a short natural draft dry cooling tower through swirl generation. Int. J. Heat Mass Transf. 2019, 145, 118738. [Google Scholar] [CrossRef]
  21. Zhao, Y.B.; Long, G.Q.; Sun, F.Z.; Li, Y.; Zhang, C.J.; Liu, J.B. Effect mechanism of air deflectors on the cooling performance of dry cooling tower with vertical delta radiators under crosswind. Energy Convers. Manag. 2015, 93, 321–331. [Google Scholar] [CrossRef]
  22. Chen, L.; Yang, L.J.; Du, X.Z.; Yang, Y.P. Performance improvement of natural draft dry cooling system by interior and exterior windbreaker configurations. Int. J. Heat Mass Transf. 2016, 96, 42–63. [Google Scholar] [CrossRef]
  23. Gu, H.F.; Wang, H.J.; Gu, Y.Q.; Yao, J.N. A numerical study on the mechanism and optimization of wind-break structures for indirect air-cooling towers. Energy Convers. Manag. 2016, 108, 43–49. [Google Scholar] [CrossRef]
  24. Wang, W.L.; Zhang, H.; Li, Z.; Lv, J.F.; Ni, W.D.; Li, Y.S. Adoption of enclosure and windbreaks to prevent the degradation of the cooling performance for a natural draft dry cooling tower under crosswind conditions. Energy 2016, 116, 1360–1369. [Google Scholar] [CrossRef]
  25. Wang, W.L.; Zhang, H.; Liu, P.; Li, Z.; Lv, J.F.; Ni, W.D. The cooling performance of a natural draft dry cooling tower under crosswind and an enclosure approach to cooling efficiency enhancement. Appl. Energy 2017, 186, 336–346. [Google Scholar] [CrossRef]
  26. Ma, H.; Si, F.Q.; Kong, Y.; Zhu, K.P.; Yan, W.S. Wind-break walls with optimized setting angles for natural draft dry cooling tower with vertical radiators. Appl. Therm. Eng. 2017, 112, 326–329. [Google Scholar] [CrossRef] [Green Version]
  27. Ma, H.; Si, F.Q.; Zhu, K.P.; Wang, J.S. The adoption of windbreak wall partially rotating to improve thermo-flow performance of natural draft dry cooling tower under crosswind. Int. J. Therm. Sci. 2018, 134, 66–88. [Google Scholar] [CrossRef]
  28. Wu, T.; Ge, Z.H.; Yang, L.J.; Du, X.Z. Flow deflectors to release the negative defect of natural wind on large scale dry cooling tower. Int. J. Heat Mass Transf. 2019, 128, 248–269. [Google Scholar] [CrossRef]
  29. Goodarzi, M.; Amooie, H. Heat transfer enhancement in a natural draft dry cooling tower under crosswind operation with heterogeneous water distribution. Int. J. Nuclear Power 2016, 61, 252–259. [Google Scholar]
  30. Wang, X.B.; Yang, L.J.; Du, X.Z.; Yang, Y.P. Performance improvement of natural draft dry cooling system by water flow distribution under crosswinds. Int. J. Heat Mass Transf. 2017, 108, 1924–1940. [Google Scholar] [CrossRef]
  31. Li, X.X.; Xia, L.; Gurgenci, H.; Guan, Z.Q. Performance enhancement for the natural draft dry cooling tower under crosswind condition by optimizing the water distribution. Int. J. Heat Mass Transf. 2017, 107, 271–280. [Google Scholar] [CrossRef]
  32. Goodarzi, M.; Ramezanpour, R.R. Alternative geometry for cylindrical natural draft cooling tower with higher cooling efficiency under crosswind condition. Energy Convers. Manag. 2014, 77, 243–249. [Google Scholar] [CrossRef]
  33. Liao, H.T.; Yang, L.J.; Du, X.Z.; Yang, Y.P. Influences of height to diameter ratios of dry-cooling tower upon thermo-flow characteristics of indirect dry cooling system. Int. J. Therm. Sci. 2015, 94, 178–192. [Google Scholar] [CrossRef]
  34. Kong, Y.Q.; Wang, W.J.; Yang, L.J.; Du, X.Z.; Yang, Y.P. A novel natural draft dry cooling system with bilaterally arranged air-cooled heat exchanger. Int. J. Therm. Sci. 2017, 112, 313–334. [Google Scholar] [CrossRef]
  35. Goodarzi, M. Proposing a new technique to enhance thermal performance and reduce structural design wind loads for natural drought cooling tower. Energy 2013, 62, 164–172. [Google Scholar] [CrossRef]
  36. Goodarzi, M. A proposed stack configuration for dry cooling tower to improve cooling efficiency under crosswind. J. Wind Eng. Ind. Aerodyn. 2010, 98, 858–863. [Google Scholar] [CrossRef]
  37. Lu, Y.S.; Klimenko, A.; Russell, H.; Dai, Y.C.; Warner, J.; Hooman, K. A conceptual study on air jet-induced swirling plume for performance improvement of natural draft cooling towers. Appl. Energy. 2018, 217, 496–508. [Google Scholar] [CrossRef]
  38. Chen, L.; Wang, W.; Kong, Y.; Yang, L.; Du, X. Hot air extraction to improve aerodynamic and heat transfer performances of natural draft dry cooling system. Int. J. Heat Mass Transf. 2020, 163, 120476. [Google Scholar] [CrossRef]
  39. Xia, L.; Gurgenci, H.; Liu, D.Y.; Guan, Z.Q.; Zhou, L.; Wang, P. CFD analysis of pre-cooling water spray system in natural draft dry cooling towers. Appl. Therm. Eng. 2016, 105, 1051–1060. [Google Scholar] [CrossRef] [Green Version]
  40. Chen, L.; Huang, X.W.; Yang, L.J.; Du, X.Z.; Yang, Y.P. Evaluation of natural draft dry cooling system incorporating water spray air precooling. Appl. Therm. Eng. 2019, 151, 294–307. [Google Scholar] [CrossRef]
  41. Huang, X.W.; Chen, L.; Yang, L.J.; Du, X.Z.; Yang, Y.P. Evaporation aided improvement for cooling performance of large scale natural draft dry cooling system. Appl. Therm. Eng. 2019, 163, 114350. [Google Scholar] [CrossRef]
  42. Sun, Y.B.; Guan, Z.Q.; Gurgenci, H.; Li, X.X.; Hooman, K. A study on multi-nozzle arrangement for spray cooling system in natural draft dry cooling tower. Appl. Therm. Eng. 2017, 124, 795–814. [Google Scholar] [CrossRef] [Green Version]
  43. Sun, Y.B.; Guan, Z.Q.; Gurgenci, H.; Li, X.X.; Hooman, K.; Li, X.X. Investigations on the influence of nozzle arrangement on the pre-cooling effect for the natural draft dry cooling tower. Appl. Therm. Eng. 2018, 130, 979–996. [Google Scholar] [CrossRef]
  44. Ge, W.J.; Fan, J.; Liu, C.X.; Li, W.D.; Chen, G.G.; Zhao, Y.B. Critical impact factors on the cooling performance design of natural draft dry cooling tower and relevant optimization strategies. Appl. Therm. Eng. 2019, 154, 614–627. [Google Scholar] [CrossRef]
  45. Wang, W.J.; Huang, X.W.; Yang, L.J.; Du, X.Z.; Yang, Y.P. Anti-freezing operation strategies of natural draft dry cooling system. Int. J. Heat Mass Transf. 2018, 118, 165–170. [Google Scholar] [CrossRef]
  46. Kong, Y.Q.; Yang, L.J.; Du, X.Z.; Yang, Y.P. Effects of continuous and alternant rectangular slots on thermo-flow performances of plain finned tube bundles in in-line and staggered configurations. Int. J. Heat Mass Transf. 2016, 93, 97–107. [Google Scholar] [CrossRef]
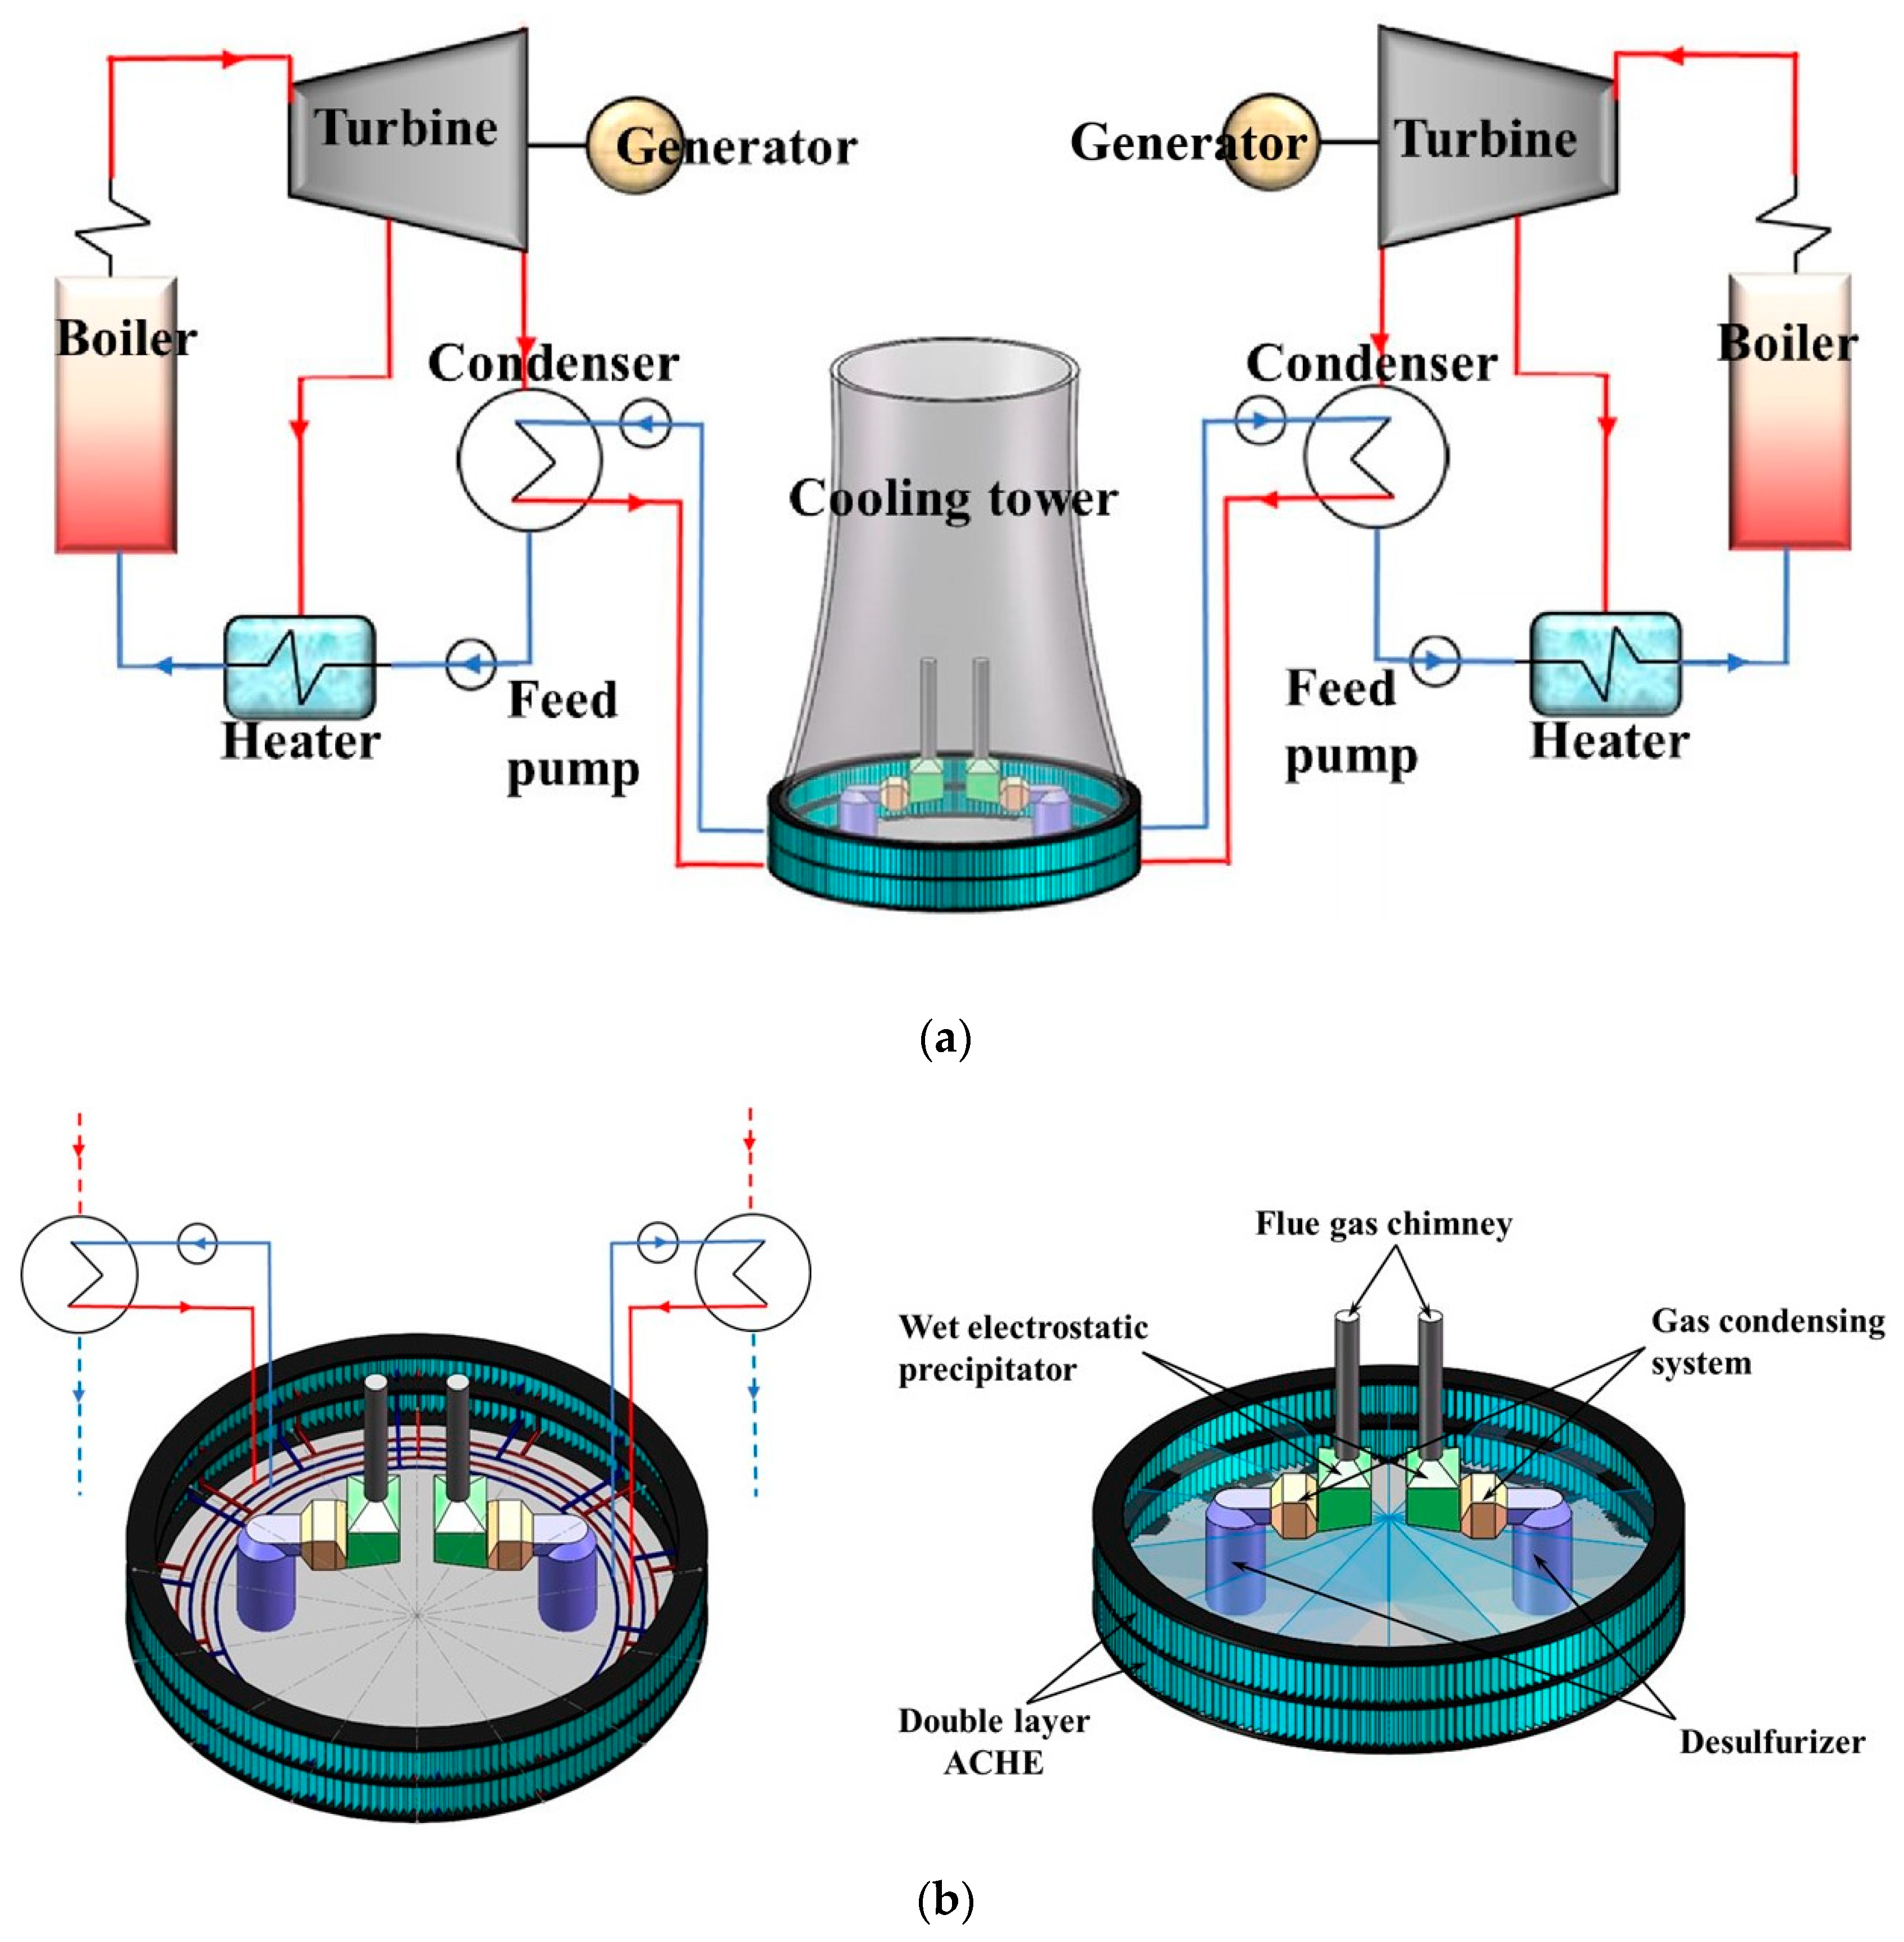
Figure 1. Geometric model. (a) Natural draft dry cooling system (NDDCS) with only one tower in a typical 2 × 660 MW power plant; (b) double-layer air-cooled heat exchanger (ACHE), desulfurizer, gas-condensing system (GCS), wet electrostatic precipitator (WESP), and flue gas chimney inside tower.
Energies 14 01308 g001
Figure 2. Deployment of air-cooled sectors for each power-generating unit.
Energies 14 01308 g002
Figure 3. Computational domain and corresponding boundaries of NDDCS with one tower.
Energies 14 01308 g003
Figure 4. Detailed geometries and local meshes of the key sections in the numerical model of NDDCS with one tower. (a) Geometries; (b) local meshes.
Energies 14 01308 g004
Figure 5. Experimental procedure of NDDCS and comparison with numerical simulation [3,30,45]. (a) Measuring points; (b) ascending air velocities of all measuring points in the absence of wind and under a crosswind of 4 m/s; (c) ascending air velocities at two typical heights in the absence of wind and under a crosswind of 4 m/s.
Energies 14 01308 g005aEnergies 14 01308 g005b
Figure 6. Heat rejections and water outlet temperatures of double-layer cooling deltas in the absence of wind. (a) In the case of 2 units; (b) in the case of 1 unit.
Energies 14 01308 g006
Figure 7. Heat rejections and water outlet temperatures of double-layer cooling deltas under a typical crosswind of 4 m/s. (a) In the case of 2 units; (b) in the case of 1 unit.
Energies 14 01308 g007
Figure 8. Heat rejections and water outlet temperatures of double-layer cooling deltas under a typical crosswind of 12 m/s. (a) In the case of 2 units; (b) in the case of 1 unit.
Energies 14 01308 g008
Figure 9. Heat rejections and water outlet temperatures of double-layer sectors in the absence of wind in the case of 2 units. (a) Heat rejections; (b) water outlet temperatures.
Energies 14 01308 g009
Figure 10. Heat rejections and water outlet temperatures of double-layer sectors in the absence of wind in the case of 1 unit. (a) Heat rejections; (b) water outlet temperatures.
Energies 14 01308 g010
Figure 11. Comparison of temperature fields of ACHE in the absence of wind in the cases of 2 units and 1 unit.
Energies 14 01308 g011
Figure 12. Heat rejections and water outlet temperatures of double-layer sectors under a typical crosswind of 4 m/s in the case of 2 units. (a) Heat rejections; (b) water outlet temperatures.
Energies 14 01308 g012
Figure 13. Heat rejections and water outlet temperatures of double-layer sectors under a typical crosswind of 4 m/s in the case of 1 unit. (a) Heat rejections; (b) water outlet temperatures.
Energies 14 01308 g013
Figure 14. Comparison of temperature fields of ACHE under a typical crosswind of 4 m/s in the cases of 2 units and 1 unit.
Energies 14 01308 g014
Figure 15. Heat rejections and water outlet temperatures of double-layer sectors under a typical crosswind of 12 m/s in the case of 2 units. (a) Heat rejections; (b) water outlet temperatures.
Energies 14 01308 g015
Figure 16. Heat rejections and water outlet temperatures of double-layer sectors under a typical crosswind of 12 m/s in the case of 1 unit. (a) Heat rejections; (b) water outlet temperatures.
Energies 14 01308 g016
Figure 17. Comparison of temperature fields of ACHE under a typical crosswind of 12 m/s in the cases of 2 units and 1 unit.
Energies 14 01308 g017
Figure 18. Heat rejections of NDDCS with one tower in the cases of 2 units and 1 unit under typical crosswind speeds.
Energies 14 01308 g018
Figure 19. Air mass flow rates of NDDCS with one tower in the cases of 2 units and 1 unit under typical crosswind speeds.
Energies 14 01308 g019
Figure 20. Water outlet temperatures of ACHE in the cases of 2 units and 1 unit under typical crosswind speeds.
Energies 14 01308 g020
Figure 21. Turbine back pressures in the cases of two units and one unit under typical crosswind speeds.
Energies 14 01308 g021
Table 1. Geometric parameters of ACHE, cooling tower, desulfurizer, GCS, WESP, and flue gas chimney of NDDCS.
ParameterSymbolValue
Air-cooled heat exchanger and cooling tower
Height of tower (m)Ht225
Height of tower throat (m)Htt168.75
Height of each ACHE layer (m)HA/B14.65
Interval of ACHE layer (m)Hi1.2
Diameter of tower outlet (m)Do128
Diameter of tower throat (m)Dtt121
Diameter of tower bottom (m)Db195
Number of cooling deltas Ncd392
Number of air-cooled sectorsNs14
Four subsystems inside cooling tower
Diameter of desulfurizer (m)Dd18.6
Height of desulfurizer (m)Hd38.05
Length of GCS (m)LG20.9
Width of GCS (m)WG14
Hight of GCS (m)HG3.5
Length of WESP (m)LW17.5
Width of WESP (m)WW27.85
Height of WESP (m)HW16.7
Diameter of flue gas chimney (m)Dc8
Height of flue gas chimney (m)Hc12.25
Table 2. Summary of the parameters in the governing equations.
EquationsφΓφSφ
Continuity100
x-momentumuiμe p x i + 1 3 [ x i ( μ u i x i ) + x j ( μ u j x i ) + x k ( μ u k x i ) ]
y-momentumujμe p x j + 1 3 [ x i ( μ u i x j ) + x j ( μ u j x j ) + x k ( μ u k x j ) ]
z-momentumukμe p x k + ρ g + 1 3 [ x i ( μ u i x k ) + x j ( μ u j x k ) + x k ( μ u k x k ) ]
EnergycptμeT0
Turbulence kinetic energykμ + μTk G k + G b ρ ε
Turbulence dissipation rateεμ + μTε ρ C 1 S ε ρ C 2 ε 2 k + ν ε + C 1 ε ε k C 3 ε G b
Publisher’s Note: MDPI stays neutral with regard to jurisdictional claims in published maps and institutional affiliations.