Article

Visualization of Chemical Heavy Oil EOR Displacement Mechanisms in a 2D System

Department of Chemical and Petroleum Engineering, University of Calgary, University Drive NW, Calgary, AB T2N1N4, Canada
*
Author to whom correspondence should be addressed.
Energies 2021, 14(4), 950; https://doi.org/10.3390/en14040950
Submission received: 1 December 2020 / Revised: 3 February 2021 / Accepted: 6 February 2021 / Published: 11 February 2021
(This article belongs to the Special Issue Enhancing Conventional Heavy Oil Production)

Abstract

:
This study aims to develop a visual understanding of the macro-displacement mechanisms associated with heavy oil recovery by water and chemical flooding in a 2D system. The sweep efficiency improvements by water, surfactant, polymer, and surfactant-polymer (SP) were evaluated in a Hele-Shaw cell with no local pore-level trapping of fluids. The results demonstrated that displacement performance is highly correlated to the mobility ratio between the fluids. Surfactant and water reached similar oil recovery values at similar mobility ratios; however, they exhibited different flow patterns in the 2D system—reductions in IFT can lead to the formation of emulsions and alter flow pathways, but in the absence of porous media these do not lead to significant improvements in oil recovery. Polymer flooding displayed a more stable front and a higher reduction in viscous fingering. Oil recovery by SP was achieved mostly by polymer rather than due to the effect of the surfactant. The surfactant in the SP slug washed out residual oil in the swept zone without increasing the swept area. This shows the impact of the surfactant on reducing the oil saturation in water-swept zones, but the overall oil recovery was still controlled by the injection of polymer. This study provides insight into the fluid flow behavior in diverging flow paths, as opposed to linear core floods that have limited pathways. The visualization of bulk liquid interactions between different types of injection fluids and oil in the Hele-Shaw cell might assist in the screening process for new chemicals and aid in testing the production process.

1. Introduction

With decreasing global conventional oil reserves, unconventional resources have become one of the alternatives to supply the world’s energy demand. These unconventional resources may come in the form of heavy oil or bitumen reservoirs. Thermal EOR techniques have shown excellent results in heavy oil recovery. However adverse conditions such as thin pay and deep reservoirs make it impossible to apply them due to huge heat losses. Waterflooding has also been implemented, but the high difference in viscosity between oil and water leads to viscous fingering, which leads to early water breakthrough and the slow production of oil beyond breakthrough. Chemical EOR is considered as an alternative method to improve the sweep efficiency in heavy oil reservoirs and improve the oil recovery response compared to water injection.
Recent studies suggest that to improve the mobility ratio in heavy oil systems, polymer flooding and surface-active agents can be used to attain a stable displacement. A polymer might be used to increase the viscosity of the displacing fluid and, in this fashion, reduce its mobility [1,2,3,4,5,6]. Surface-active agents such as surfactants, alkalines, and their combination might be used to improve oil recovery through the formation of emulsions [7,8,9]. The mechanisms linked to this process are ‘‘emulsification & entrainment’’ and ‘‘emulsification & entrapment’’. The first one refers to a displacement of oil by transforming it into emulsions that are less viscous than the constituent oil, such as oil-in-water emulsions [10,11], therefore mobilizing the oil in the aqueous phase and easily producing it as a low-viscosity fine emulsion. The second mechanism refers to emulsion droplets that become trapped in the pore throats and result in plugging off pre-formed flow channels that divert incoming fluids to unswept areas of the system and alter the sweep efficiency. Core flood data interpretation and associated low-field NMR testing indicate that entrapment through the formation of either O/W or W/O emulsions seems to be more effective than entrainment due to a decrease in the water cut and the introduction of a higher-pressure gradient in the system [12,13]. However, the response of this mechanism might be mistaken for other mechanisms of surface-active agents, such as the traditional understanding of surfactants as agents to sweep residual oil out of swept zones.
The coalescence of these emulsion drops might form large oil banks that can flow through preformed flow channels. These might have the same response as the ‘‘emulsification & entrapment’’ mechanism in terms of pressure and water cut. That means that surface-active agents may not necessarily be diverting fluids into unswept areas of the system and improving the areal sweep, but rather recovering and banking the residual oil left behind in the swept zone. If this premise is accepted, then some interesting questions arise: Are emulsions assisting in improving the areal sweep of heavy oil systems? Which part of the system does this produced oil come from? Does it come from the already swept area, or does it come from new contacted flow paths? Therefore, a detailed study of surfactant–heavy oil interactions is needed to identify the main heavy oil recovery mechanism used by surface-active agents.
A factor that has made it difficult to observe the performance of emulsification mechanisms is the type of model used for carrying out these flooding displacements. Most heavy oil recovery mechanisms observations in the literature have been made in linear cores or 1D systems which have limited available flow pathways [8,12,14]. For small cores or sand packs, it is possible for these limited previously flooded channels to be plugged off, and now access to new regions of the core will increase the pressure once again in the system, leading to an increase in oil production. This recovered oil might be a significant portion of the original oil in place in these linear cores. However, in bigger systems such as 3D models or real reservoirs with a vast number of alternative flow paths it is possible that this mechanism does not perform as it does in a 1D system. Therefore, the improved sweep from emulsification and entrapment in a 1D system may be overestimated [15].
The surface-active agent mechanisms in the presence of polymer are also poorly understood. When polymer and surfactant are injected in the same slug, it is expected that the synergy of the flooding mechanisms of each chemical work together. The former stabilizes the flood front and the latter accesses the isolated zones to displace the trapped residual oil. However, it is important to determine whether the same benefits of surfactant will be present with the polymer—i.e., whether IFT can be reduced in the presence of polymer and whether emulsions are still able to form in a more viscous polymer solution [16].
The complexity of interpreting the behaviour of these chemicals demands a study that allows observing visually at a micro and macro scale the performance of these chemicals, starting from the most basic level (fluid–fluid interaction) and moving up to the more complex porous media (fluid–porous media interaction). The model also needs to be 2D or 3D to avoid the enhanced effect of the plugging of limited pathways observed in linear systems. Therefore, in this work a 2D model is proposed: (1) to study the macro mechanisms associated with chemical flooding, (2) to provide insight into the fluid flow behaviour in diverging flow paths, and (3) to illustrate the role that surfactants might play in heavy oil systems with and without the addition of polymer. This 2D model (Hele-Shaw cell) will be tested without the presence of porous media to understand the impacts of changing the IFT and viscosity ratio without the potential emulsification that can occur in porous media. The displacements carried out in the Hele-Shaw cell and their results might be considered as a baseline for further comparisons. Therefore, the oil recovery mechanisms encountered in a system with no local pore-level trapping of fluids might be compared against those observed in systems where the complexity effect of porous media is considered.
The displacements carried out in the Hele-Shaw cell allow us to study and visualize the bulk liquid interactions between different types of fluids and oils. Therefore, they might assist in the screening process for new chemicals and testing production processes. Further experimentation should be performed with different chemical solutions (surfactants, polymers, alkalis, nanoparticles, etc.), different representative salinity values of a reservoir, and different crude oils. Understanding how heavy oil recovery through chemical injection performs could lead to the design of injection patterns and early recovery strategies for maximizing the production of heavy oil at low cost, in the appropriate stage of the reservoir life, with the right chemicals, and with the minimum environmental impact.

2. Materials and Methods

2.1. 2D Physical Model Apparatus

The set-up of the experiment consisted of a 2D Hele-Shaw cell, a pressure transducer, a Quizix pump (Model 6K-SS), a high-resolution digital camera (Nikon Coolpix P520, 18.1 Megapixels), and a computer for data acquisition; see Figure 1.
The Hele-Shaw cell was constructed from Plexiglas and a Teflon gasket with a thickness of 0.0397 cm and was used to set a gap between the two plates of the cell. The thickness of the gasket was selected to be approximately the size of a sand particle. Figure 2 shows the top and side view of the cell. The bolts were tightened in a cross pattern with a torque of 4.07 N-m (36 lb.-in). Six ports were drilled on the side of the upper plate, however just two were used as injection (top right corner) and production (bottom left corner) ports. The oil and aqueous chemicals were injected at a constant flow rate using a dual-cylinder Quizix pump through the injection port and were produced by the production port at atmospheric conditions. In this fashion, the displacement of fluids occurred diagonally across the cell. The Hele-Shaw cell was placed in a levelled stand where underneath there was a light source. The light allowed for the better visualization of the crude oil and the injected aqueous fluids. The pressure transducer, digital scale, and pump were connected to an automated data acquisition system which allowed for the logging of pressures, flow rates, and produced liquid mass.
The contact angle of the oil–water interface on Plexiglas was determined to be 68° for the crude oil. The measurement of the static contact angle was performed using an OCA 20 Contact Angle System-Dataphysics. The analysis of the wettability determined for the cell showed an oil wetting state (oil-wet contact angle θow < 70°). This oil-wet tendency allowed the formation of a wetting layer that interfered with an accurate estimation of the swept area through an image binarization process. Therefore, the values of heavy oil recovered in each displacement in this study were assessed through material balance.

2.2. Fluid Properties

The main objective of this work was to study heavy oil mechanisms in a nonlinear system. As such, no attempt was made to screen different surfactants and polymers; the surfactant and polymer were fixed and only their concentrations were manipulated. The chemical solutions were prepared in deionized water. The crude oil was provided by Husky Energy. Initially, the oil had a viscosity of around 3000 mPa·s at 25 °C. To decrease its viscosity, the oil was mixed with 5% weight diesel. The viscosity of the diluted oil used in all the subsequent tests was determined to be 1186 mPa·s at 25 °C, with a density of 0.926 g/cm3 and containing 1.7% emulsified water, according to NMR analysis. The chemical and oil properties are listed in Table 1.
The surfactant SURFLOOD HORA-W905 used in this study was a commercial non-ionic surfactant that was supplied by ChemEOR. Surfactant solution viscosity measurement was obtained from the standard test method for the kinematic viscosity of transparent and opaque liquids, ASTM D445-14a. Based on interfacial tension analysis shown in Figure 3, the optimum concentration was found to be between 1000 and 2000 ppm for the crude oil in the study. For this study, the concentration was set at 1500 ppm.
The polymer used was a dry high molecular anionic polyacrylamide KEMSWEEP A-5360 provided by KEMIRA CHEMICALS. The polymer concentration was set at 500 ppm. The polymer and SP viscosity measurements were all obtained using the Brookfield Rheometer LV-DVIII Ultra. The results are shown in Figure 4. In the Hele-Shaw cell displacements, the test flow rate was 0.3 mL/min for the crude oil tests. The effective shear rate for this flow rate was calculated based on the Alvarado and Marsden correlation [17] and was determined to be 0.72 s−1. Because polymer and SP solutions are non-Newtonian liquids—i.e., their viscosities depend on the shear rate of the system—the solution viscosities at these two shear rates were predicted from Figure 4 and the results are summarized in Table 2. The viscosities of the polymer and SP solutions were similar, and both were lower than the crude oil viscosity. However, it was expected that they exhibit a better viscosity ratio improvement compared to water alone.
During linear displacements in Hele-Shaw cells, when a more viscous liquid is displaced by a less viscous one, the displacement can be characterized by two dimensionless numbers: the mobility ratio M, which for a Hele-Shaw cell (i.e., no porous media) is the viscosity ratio of displaced fluid to the displacing fluid [18,19], and the instability number, which is an indication of whether viscous fingering will occur during displacement [20]. The mobility ratio is in the order of 1000 for water and surfactant, and, with polymer, M drops to 10. This shows the effect of the polymer viscosity on the local displacement efficiency. The instability number was also determined for each displacement through the Coskuner and Bentsen approach [20]. These numbers do not satisfy the condition of stable displacement (Ist < π2), meaning that the displacements will be unstable (i.e., viscous fingering will occur) even when polymer is added to water. The Reynolds number for each water and chemical flood was less than 1, reaching the creeping flow condition (creeping flow, Re < l)—i.e., the study flow rates can be present in oil reservoirs.
Before interpreting the results of the flooding tests conducted in the Hele-Shaw cell, repeated tests were carried out. Error bars and ANOVA two-factor tests were performed to determine the uncertainty of repeated tests. Four repeat waterflooding experiments and two repeat flooding experiments per chemical injected (i.e., surfactant, polymer, and SP) were run to test the reproducibility of the results. All the tests were run at 0.3 mL/min and the oil recovery factors were calculated and collected at each pore volume injected. The ANOVA analysis was applied in each pore volume data of the water and chemical flooding tests; therefore, sixteen ANOVA tests were run in total.
For a 0.05 level of significance, the hypothesis (Ho) of no difference among flooding test was tested for each pore volume data of each flooding (i.e., water, surfactant, polymer, and SP). The hypothesis was only rejected for the four runs of waterflooding, meaning that the oil recovery values varied in every run and there was no reproducibility in the waterflooding tests. This fact can be graphically seen in the large range of uncertainty of the error bars in 1 and 2 PV of water flooding, which were found to be ±1.9% and ±4.2% of the oil in place, respectively (see Figure 5). The variation in the oil recovery with waterflooding is associated with the adverse viscosity ratio between water and crude oil, which affects the front behavior of the flooding. For most of the surfactant, polymer, and SP flooding runs, the error bars were found to be approximately ±1% of the oil in place, meaning that there was reproducibility in the performance of these fluids during the tests.

2.3. Experimental Procedure

Before each experiment, the cell was cleaned with regular liquid soap and a soft sponge to prevent any scratching and erosion. The cell was first saturated with de-ionized water at a constant flow rate of 1 mL/min in a vertical position to avoid any air bubble entrapment. The final volume of water in the system was considered as the pore volume of the cell. The cell was then placed in a levelled horizontal position, and the water was displaced by crude oil at a constant flow rate of 0.3 mL/min. The water displaced during the oil flood was used to calculate the initial oil saturation in the cell. After saturating the cell with oil, this one was then flooded with different aqueous chemical solutions (i.e., water, surfactant, polymer, and SP) at constant flow rates of 0.3 mL/min until 4 PV of the solutions were injected.
During the floods, the pressure in the injection port and pictures were taken and monitored every 30 s. All the tests were carried out at room temperature ≈25 °C and fluids were produced at atmospheric pressure. The produced fluids (some of them in the form of emulsions) were collected, at the end of each pore volume injected, in graduated cylinder tubes. The tubes were then left for 24 h in ambient conditions to allow a complete separation of the oil from the aqueous solutions. The fractions of oil and water collected were considered as part of the material balance analysis.

3. Results and Discussion

3.1. Water Flooding Tests

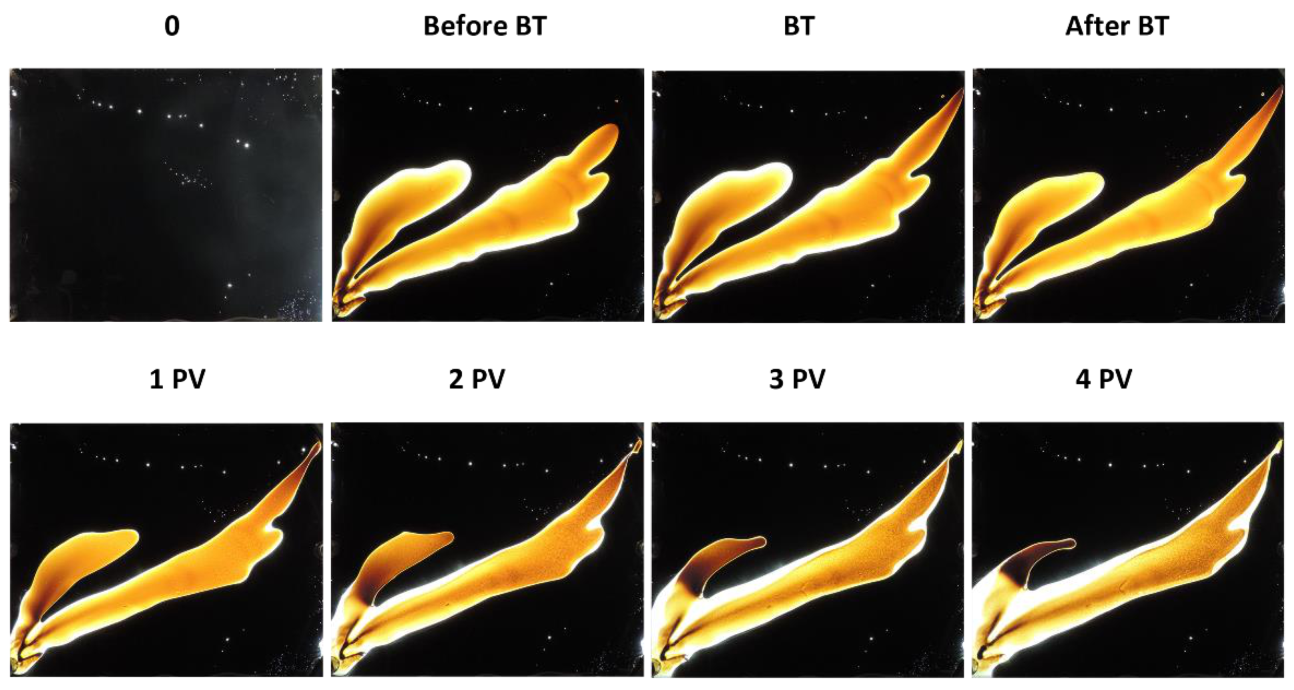
Figure 6 shows the image sequences for water flooding in crude oil. The sequences show how water penetrates and fingers through the viscous oil. In these figures, “BT” refers to the breakthrough of water to the production corner of the cell (i.e., the top right-hand corner). Comparing the data between the balance and the volume injected by the pump, it is observed that before breakthrough (early times), oil is not displaced at the same rate as the water is injected into the cell. The water fingers grow or advance in the direction of the pressure gradient, pushing oil ahead of and increasing the pressure in the model. Once breakthrough occurs, the pressure across the cell declines sharply, meaning that further injected water is flowing through pre-formed water pathways. As the pressure drops, the water channels are pinched (the area swept by water decreases) and the real area swept by water is shown right after breakthrough; see the ‘‘After BT’’ frames.
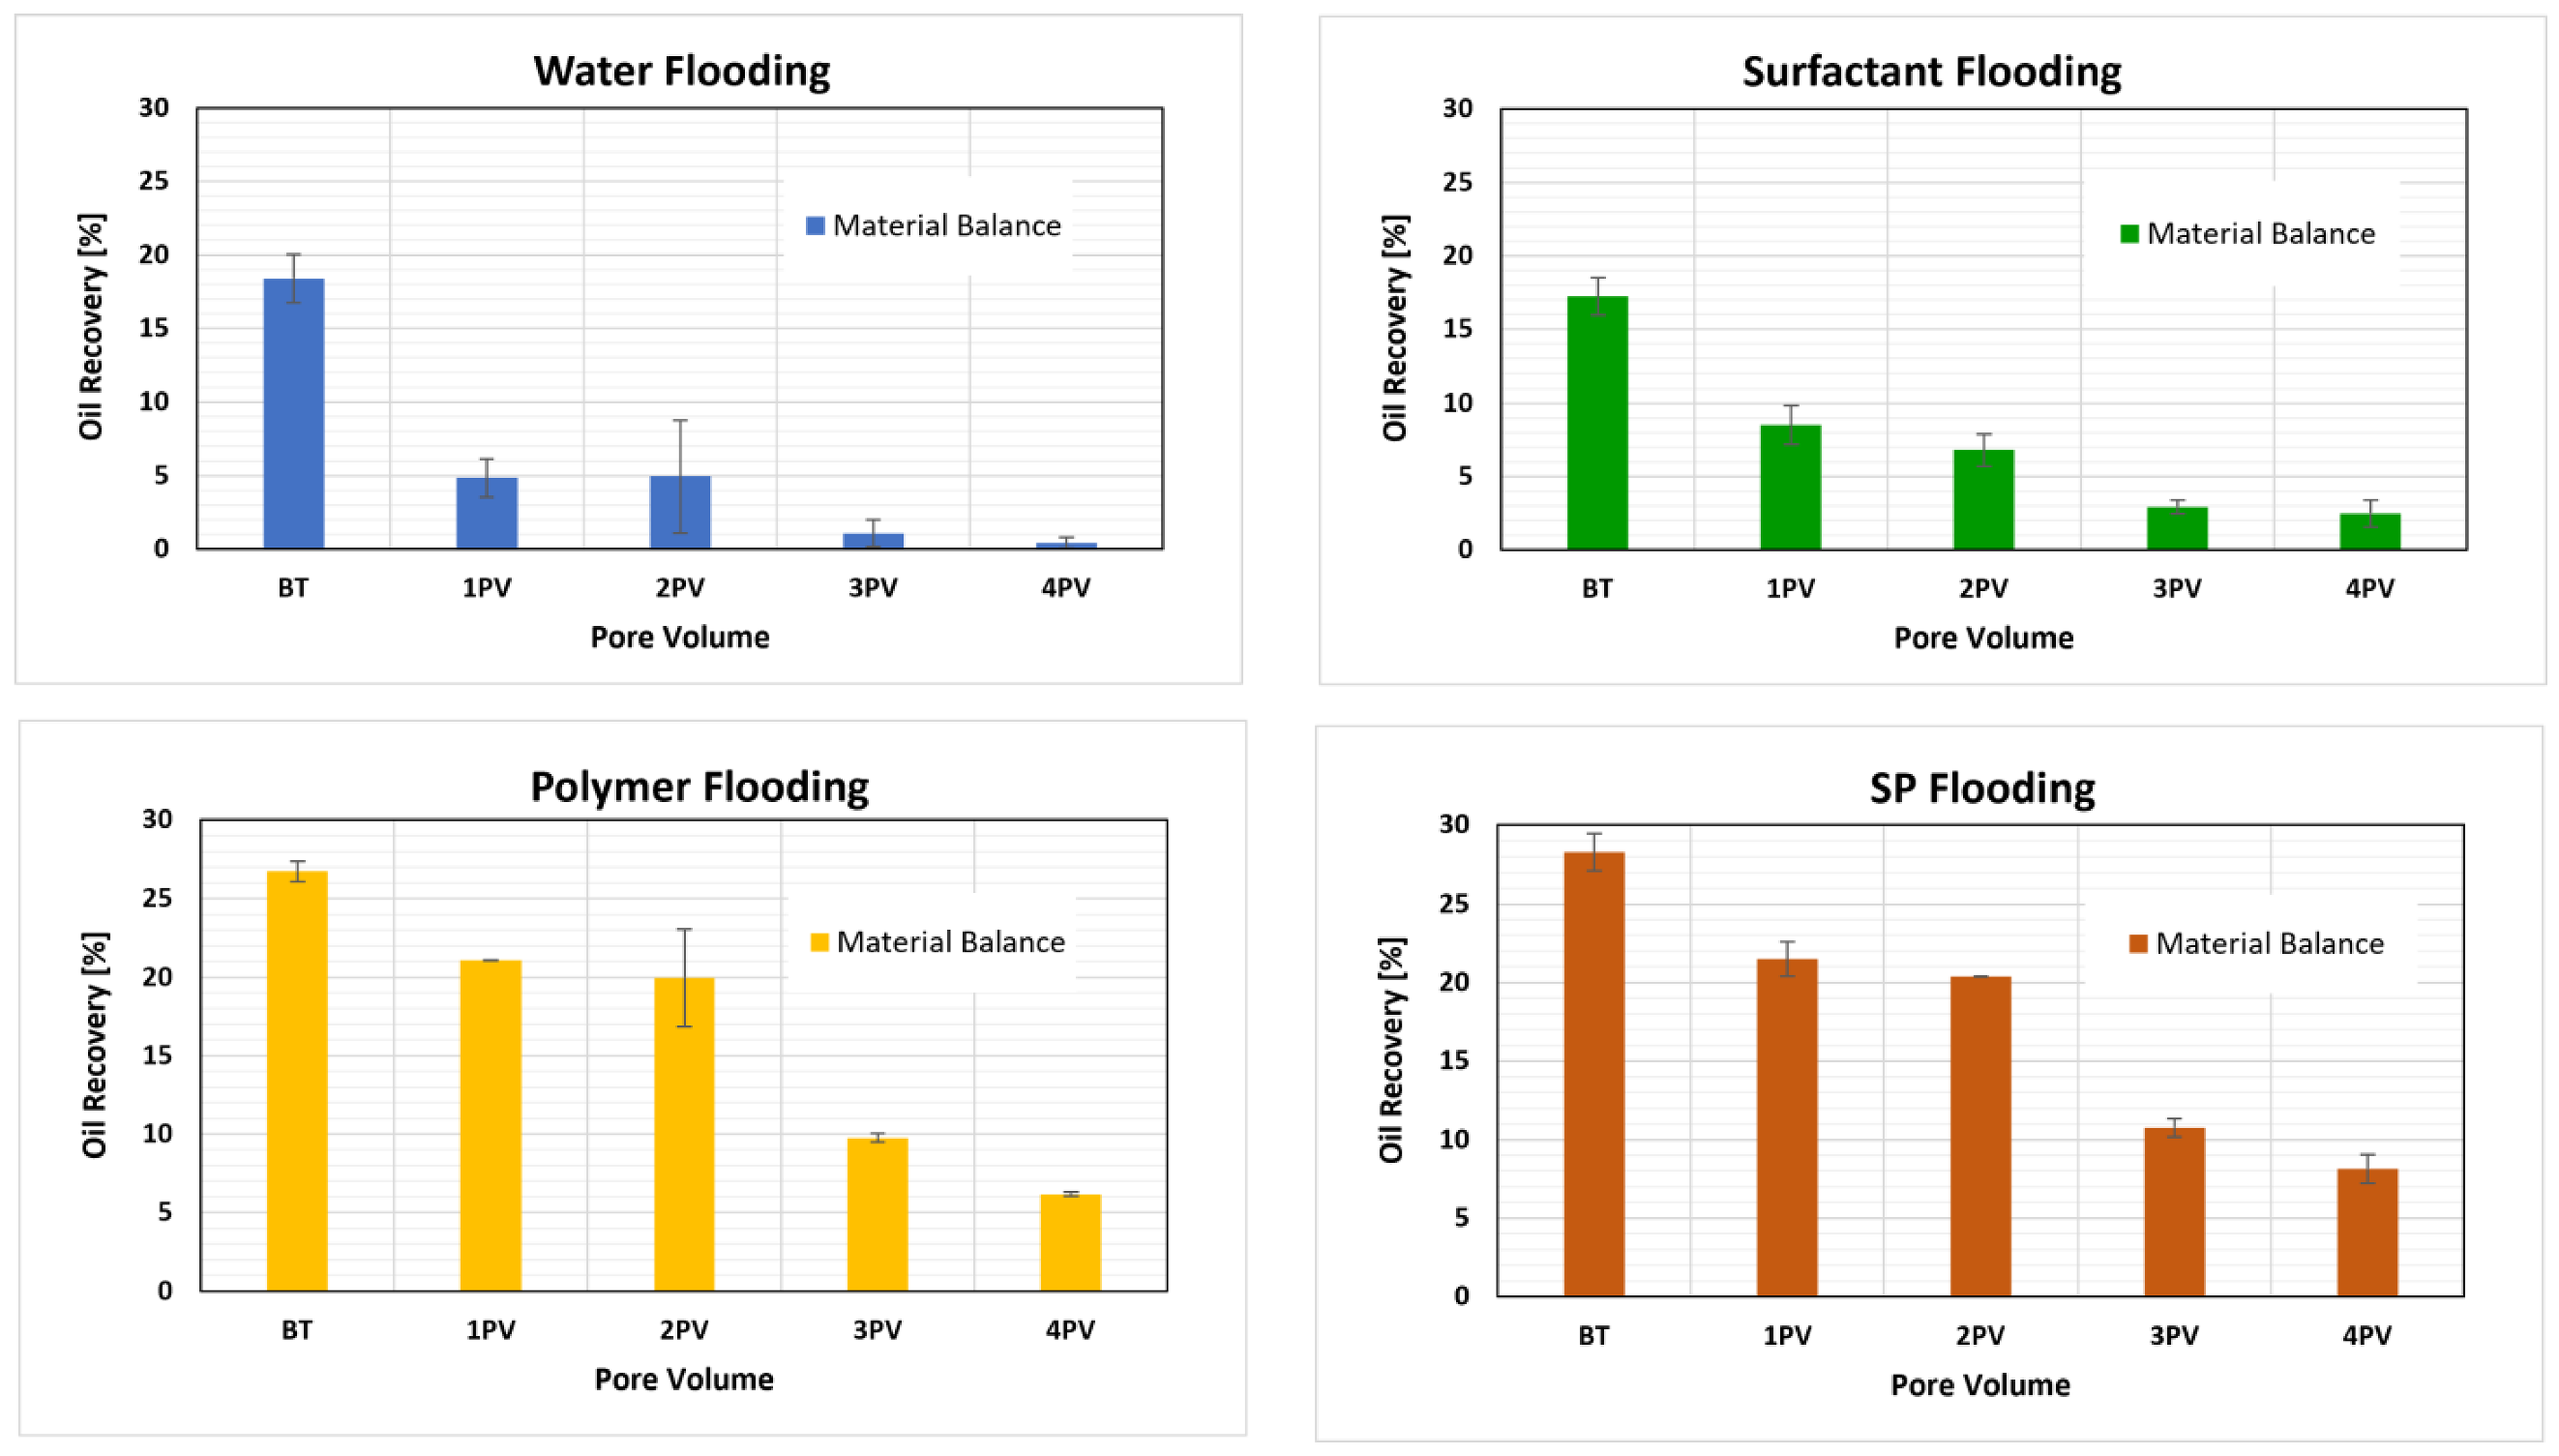
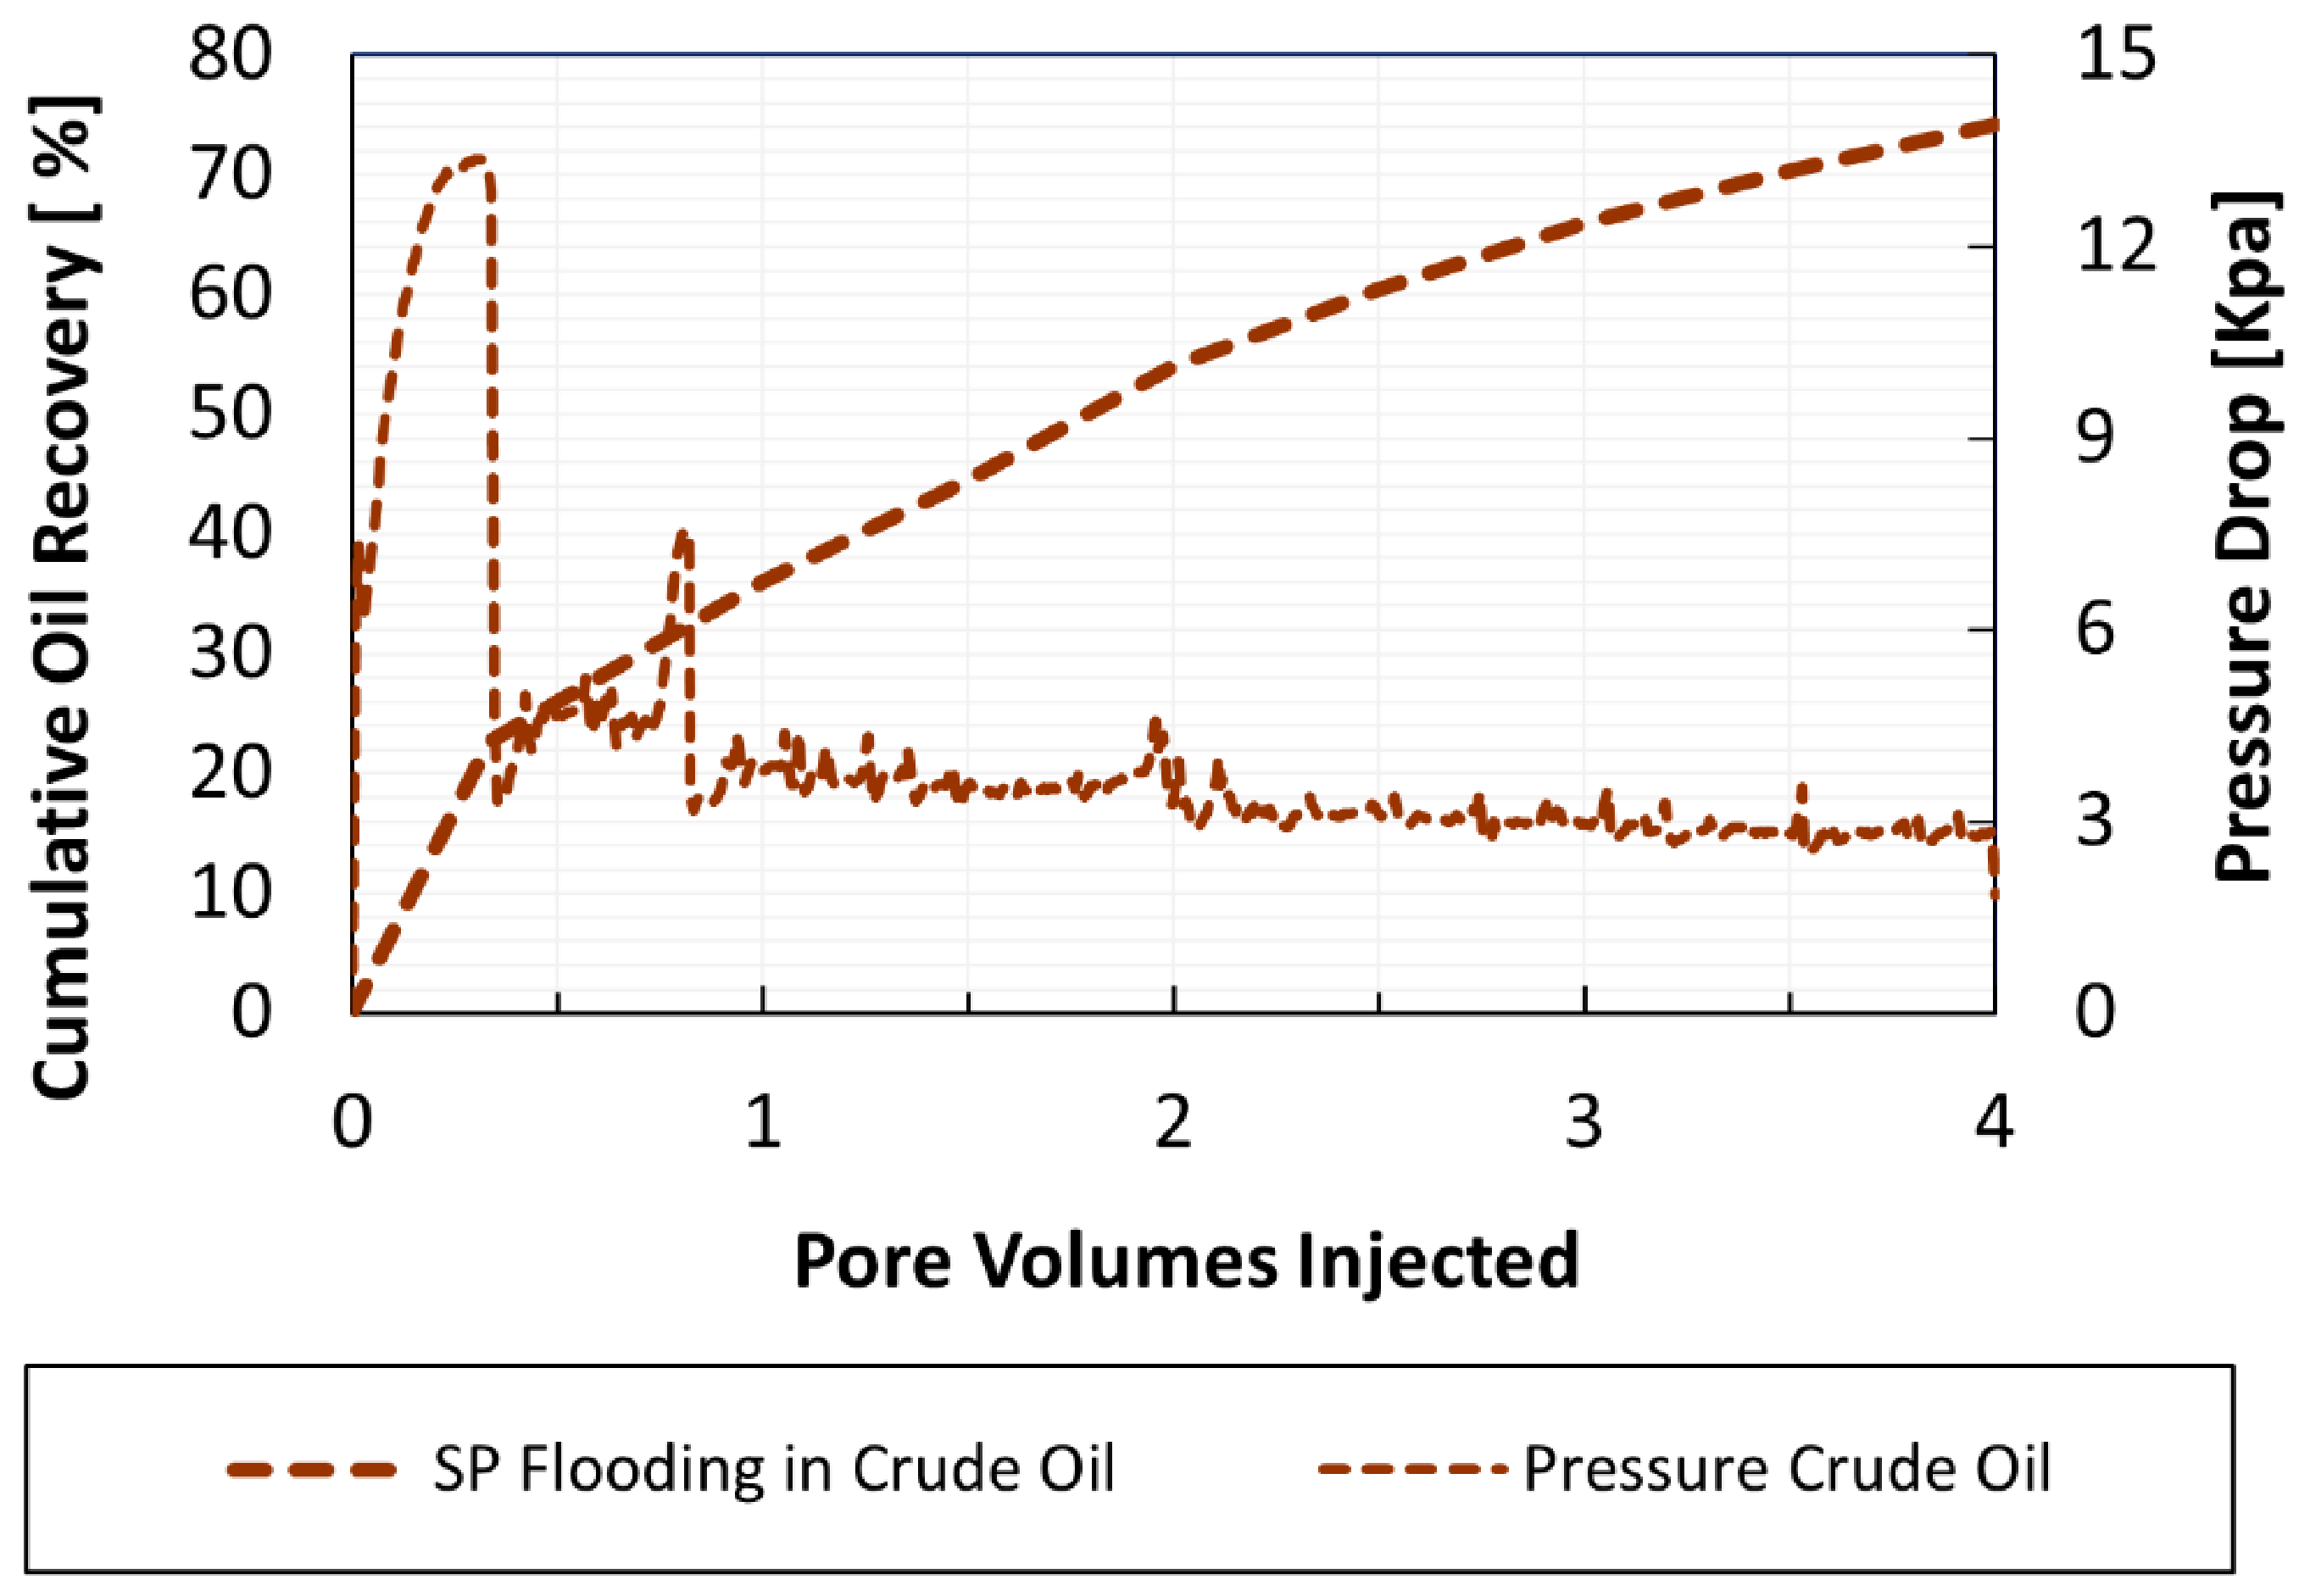
Figure 7 plots the cumulative oil recovery obtained from the material balance for waterflooding at a constant flow rate of 0.3 mL/min, as well as the pressure drop in the system. In this figure, the water breakthrough can be identified when the pressure line reaches its first local maximum, and right afterwards the slope of the line changes. The pressure at breakthrough is 10.3 kPa and the cumulative oil recovery at this point is 20% OOIP.
An interesting observation from Figure 6 is the formation of a limited number of thick fingers at the point of breakthrough. As the injection continues, the incoming water prefers to flow through the thicker fingers, leading to the thinner ones shrinking and snapping off, as is seen in frame ‘‘4 PV’’ in Figure 6. In this sequence, the water is not diverted to unswept zones. Instead, it keeps flowing continuously until it reaches the production port again without any marked oil recovery improvement. The oil production after breakthrough is minimal compared to the breakthrough recovery, showing that in this visual cell the path of least resistance is clearly through the formed water fingers. Incremental oil comes from the weak stripping/dragging effect at the edges of the water path or due the effect of water channels snapping off.
Mai and Kantzas [21] showed that, in porous media, the post-breakthrough recovery from water flooding can be significant compared to the breakthrough recovery, and this is related to the capillary imbibition of water. In Hele-Shaw cells, which are expected to contain negligible capillary forces, the mechanism of oil recovery after water breakthrough in mobile crudes is the snapping off of continuous water channels. This leads to discontinuous oil production, associated with small pressure spikes as the oil is mobilized. Future tests are still needed to determine whether these same small pressure increases are present and if this production mechanism can be used to control or accelerate oil production in heavy oil waterfloods in porous media. The goal of the baseline waterflood tests is to visualize the displacement of heavy oil by water under highly adverse mobility conditions in a 2D cell, and compare it to the subsequent chemical flooding flow patterns and oil recovery.

3.2. Surfactant Flooding Tests

Surfactant flooding is well known for mobilizing trapped oil rather than improving the sweep efficiency. For this reason, the surfactant impacts in heavy oil are expected to be minor, but in fact the recovery from alkali and/or surfactants floods in heavy oil laboratory tests (1D core floods) has shown considerable promise [22,23]. Due to the lack of capillary trapping and plugging effects in the Hele-Shaw cell, impacts such as capillary trapping reduction will not be expected to play a role in these visual systems either. Instead, tests were carried out to understand the natural behavior of the surfactant in contact with crude oil—i.e., to observe changes in the displacement interface behavior and possible mechanisms such as the formation of emulsions for rediverting flow in the cell. 
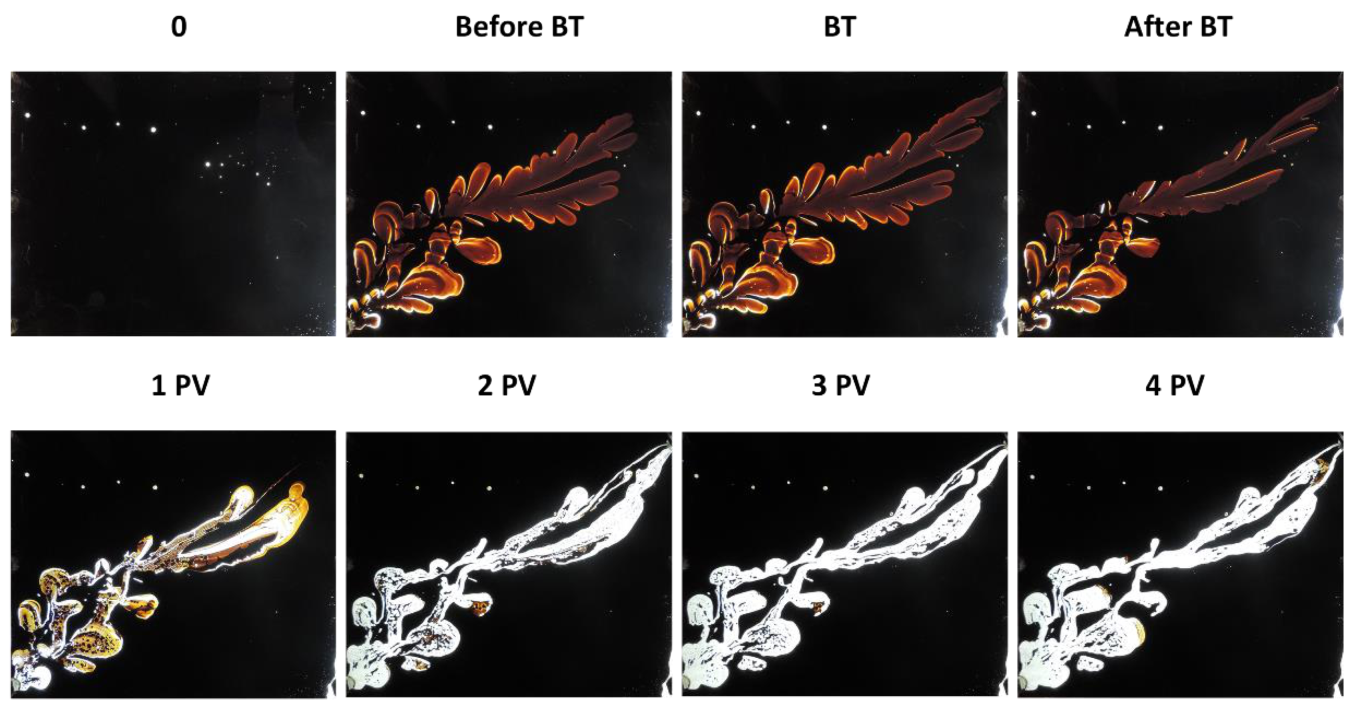
Figure 8 shows images of the oil displacement sequence for surfactant flooding in crude oil at the same 0.3 mL/min flow rate as the waterflood. For the comparison of these displacements, the analyses of the tests can be divided into before and after breakthrough. A crucial observation in this system is that, compared to water injection, the oil recovery before breakthrough is reached by the formation of main fingers, which are subdivided into multiple little fingers. This observation has been reported in previous works [24,25,26], where the little sub-fingers lead to an increase in the contact area within the oil. The surfactant solution has a similar viscosity to water, but the formation of many small sub-fingers compared to the larger water fingers is evidence of the significantly lower IFT. The surfactant reduces the crude oil/water IFT by two orders of magnitude—i.e., from 22.5 to 0.046 mN/m compared to water (see Table 1). As the surfactant sub-fingers are being formed through the cell, oil can become surrounded by these aqueous fingers, so the formation of macroscopic emulsions is much easier under these low IFT phenomena. Figure 8 shows that the main fingers and sub-fingers are discolored (lighter orange color) compared to those in waterflooding. This discoloration is evidence of low IFT zones, where the surfactant emulsifies oil in the aqueous phase in the form of O/W emulsions. This was corroborated by the production of fluids which showed oil-in-water emulsions. When they were first produced, the produced fluid appeared to be a single-phase brown/orange liquid of low viscosity, and a clear interface between oil and water not seen until the fluids slowly separated over the space of several hours. The oil recovery before breakthrough is controlled mostly by a higher pressure drop in the model, which leads to an oil recovery of 17% OOIP.
From Figure 9, it is interesting to note that during oil displacements, the pressure reaches its maximum at breakthrough and then keeps low values without any additional pressure drop peaks compared to the waterflood (Figure 7), but oil continues to be produced even in the absence of these spikes. This shows the improved oil mobility compared to water injection—oil is still produced at a reduced slope compared to before breakthrough, but oil is able to move even in the absence of measurable pressure drops.
The images from surfactant flooding, in both tests, show also that the production mechanisms before and after breakthrough appear to be different. Early in the flood, oil is displaced through the formation of small sub-fingers that branch out from the main fingers. This is still a viscous-driven displacement, but the nature of the aqueous phase fingers is visually quite different from the waterflood. Later in the flood, after 1 PV is injected, there are no longer any more sub-fingers formed. At these times, the surfactant sweeps the oil left behind by previous streams in the sweep zone, and by the time 4 PV injected the swept pathways and the walls of the Hele-Shaw plates are completely washed out of oil (no residual oil film left behind due to the wettability alteration of the cell). The remaining oil recovery is achieved by sweeping along the oil trapped in the center of the sub-fingers and by emulsifying and stripping the oil along the edges of the swept zones—i.e., the swept zone gets broader over time—however, this effect is not too pronounced. The oil recovery at the end of the displacement does not vary considerably, and the final oil recovery is 24% OOIP. The localized snap-off that is seen in the crude oil displacement (see frame 1PV in Figure 7 and second pressure spike in Figure 9) corresponds to the formation of a surfactant pathway that is too thin and close to the production port. This one overtime is broken up or snapped off by the viscous oil, developing a small pressure drop in the system which indicates the presence of instabilities in the displacement.
The effect of continuous sub-finger formation is that of flow diversion and improved sweep in the system, which is observed in systems where the mobility ratio is not severe. Flow diversion by oil-in-water emulsions has also been previously reported in surfactant-based heavy oil recovery core floods [12]. However, it is reported that flow diversion is associated with pressure buildup, which was not seen in this Hele-Shaw cell. Keeping in mind that these results are obtained in the absence of porous media, and higher plugging may be observed in sand packs, the lack of plugging in this 2D system still may be an indication that surfactant localized plugging and diverting mechanisms may be seen on a wider scale, with no effects of capillary trapping or plugging effects, and can still lead to the production of oil. Two different mechanisms are responsible for oil recovery by surfactant flooding: the formation of sub-fingers before breakthrough and washing out the oil of swept zones at later times; however, their performance is strongly associated with the viscosity ratio between the fluids in the system.

3.3. Polymer Flooding Tests

Polymer flooding has a different oil recovery mechanism than that of surfactant and water. The polymer is added to water to increase its viscosity and reduce its mobility, exhibiting a mobility ratio improvement compared to surfactant or water alone, see Table 1. This fact is reflected in the number and shape of the fingers in the displacements, see Figure 10.
Figure 10 shows the image sequence of polymer injection at 0.3 mL/min in crude oil. In this figure, the polymer-oil mobility ratio is still unfavourable so there are still fingers of polymer solution moving through the oil. However, due to the significantly higher polymer fluid viscosity, there is a reduced number of thick and large fingers at the head of the front compared to water flooding for the same system. As the displacement advances and breakthrough occurs, the displacement front is more stable due to the improved sweep of the system. The fingers in the crude oil displacement are thicker before breakthrough and as the stable front continues advancing, a residual oil film is left behind as is also observed in waterflooding displacements. This means that polymer solutions cannot modify the wettability of the cell and clean up completely the swept paths as is observed in surfactant flood displacements. The pressure in the cell built up at breakthrough until 12.4 kPa, but then decreases sharply and maintains a pressure after breakthrough of approximately 2.7 kPa in the whole displacement, see Figure 11. Under the more stable polymer displacement, pressure grows to a similar maximum value (related to the flow of the same viscous oil). However, as expected, breakthrough occurs later, and pressure does not decline as quickly as for the waterfloods.
The surprising fact is that polymer viscosity is only around 18% of that of crude oil viscosity. Even so it shows a good sweep efficiency and stable displacement after 2 PV injected, reaching a final cumulative oil recovery of around 82% OOIP. The other significant observation is the oil recovery after breakthrough, which is very low for both water and surfactant floods. Figure 11 shows that the effect of polymer flooding in heavy oil is not only in improved breakthrough recovery, but that oil is displaced more stably throughout the entire flood. The presence of a snap-off in the system was also noticed in the image sequences and pressure drop curves (secondary pressure peaks after breakthrough). These occur near the production port, where the polymer pathways that are too thin eventually are broken up to help to recover extra oil; see Figure 11.

3.4. SP Flooding Tests

SP flooding is sometimes considered for heavy oil systems that can be accessed through polymer floods. SP injection can be run either instead of polymer or potentially after polymer flooding. In these tests, SP injection was run without any previous polymer floods so that their behavior before and after breakthrough could be observed. Figure 12 shows the response of the SP injection in crude oil at 0.3 mL/min. Before breakthrough, the displacement was characterized by a few thick and large fingers ahead of the front, which might be a consequence of the slightly high viscosity of SP, similar to the polymer response (see Table 1). The addition of surfactant to the polymer also reduces the oil–water interfacial tension from 22.50 to 3.9 mN/m. The effect of surfactant is observed in the shape of the initial fingers and after breakthrough in the swept zone. It seems that surfactant cleans or recovers the oil film left behind by previous streams, flowing along the swept zones. The post-breakthrough recovery mechanism is the combination of viscous displacement as well as the oil being swept along through the cell (see the thin line marks left behind by SP flooding in frames 2 PV and 3 PV of Figure 12).
The effect of the polymer is also seen in all flooding sequences, since sweep is better than under surfactant injection alone. The pressure in the cell reaches a value of 13.1 kPa at breakthrough and then decreases and holds a low value of 3 kPa until the 4 PV injected is completed; see Figure 13. Snap-off effects (local pressure increases) are present in the displacement in the first and second PV injected; however, the pressure peaks are not as sharp as in polymer flooding, meaning that with the additional stripping of oil and improved flow properties from the surfactant, the generation of local snap-off and improved sweep is not as significant as a recovery mechanism. The final oil recovery from the SP injection is 74%.

3.5. Displacement Comparisons

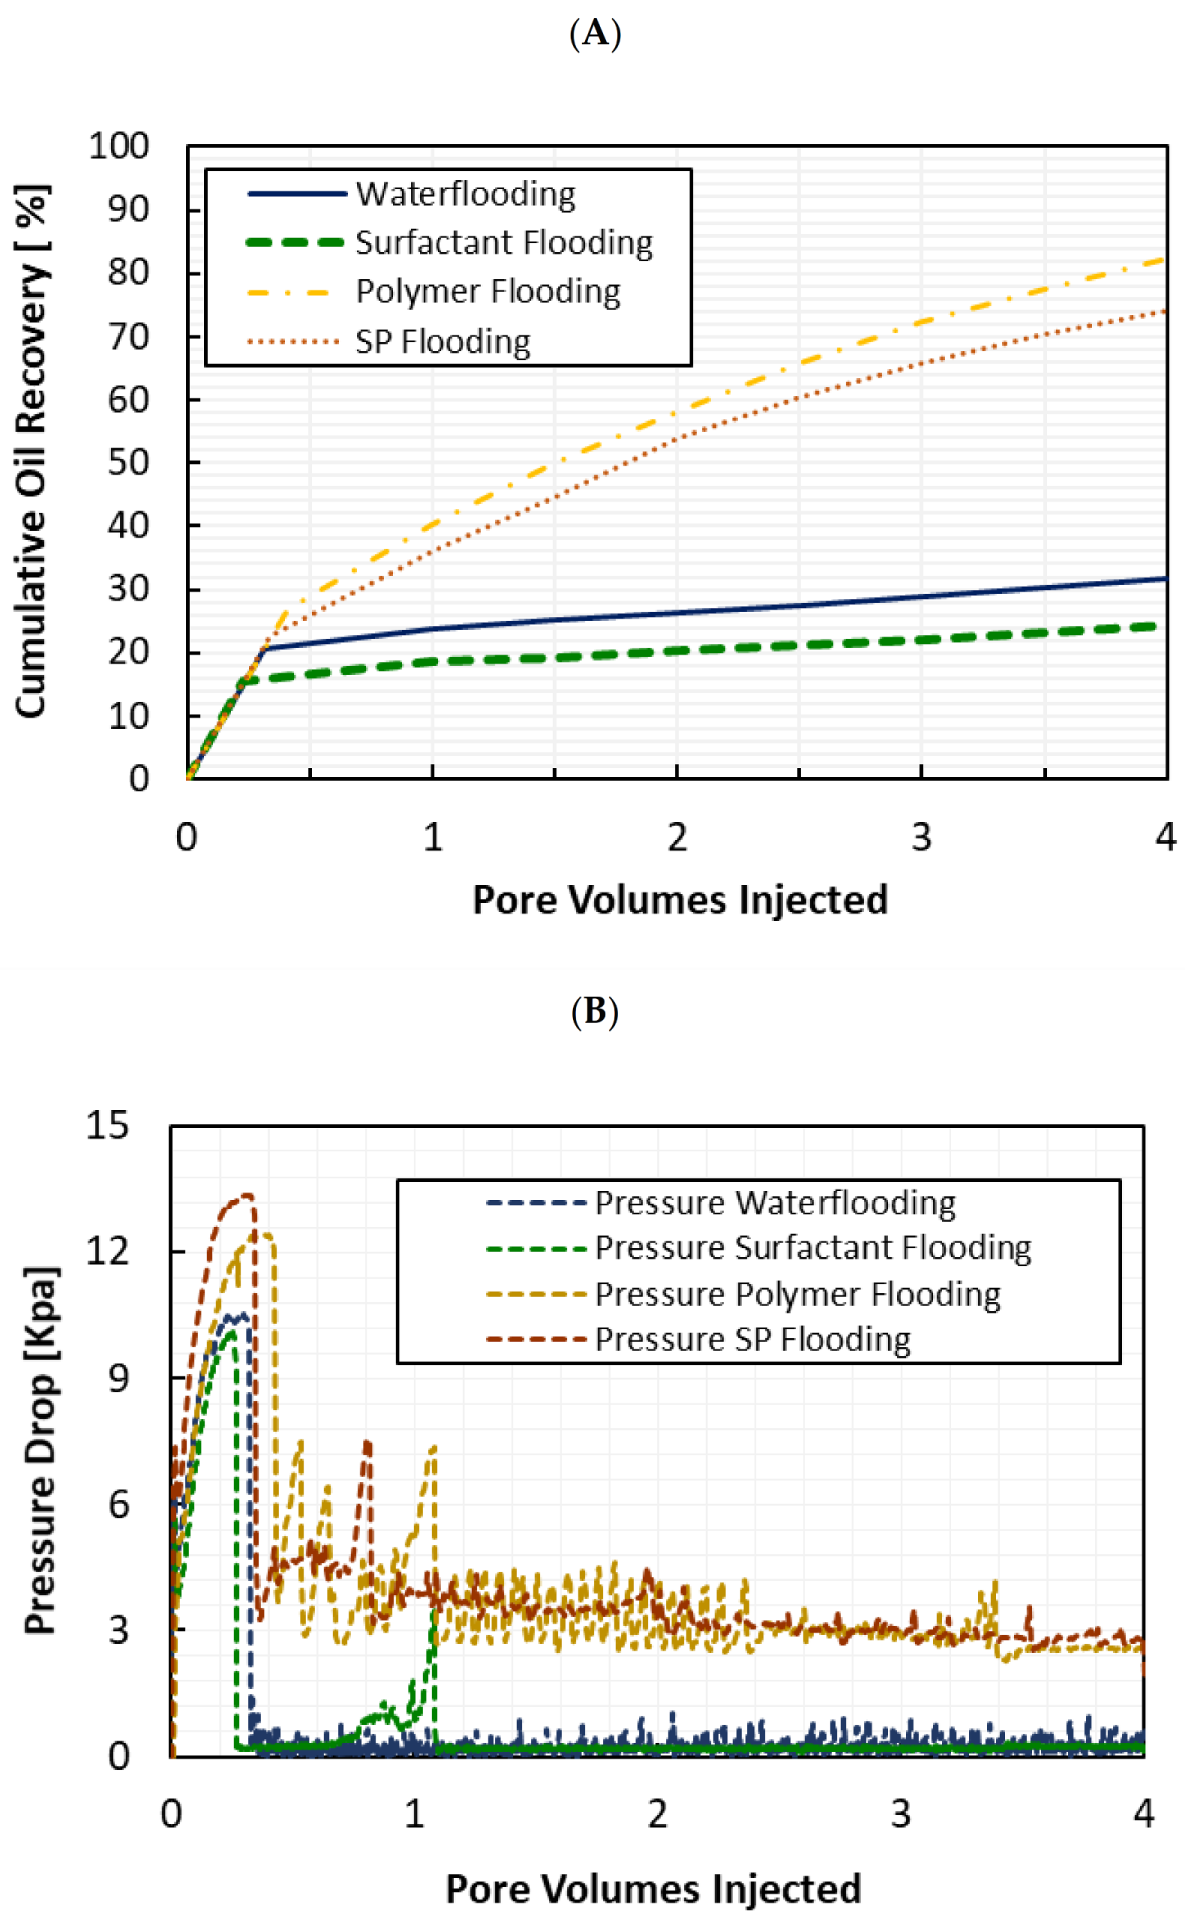
Figure 14A compares the cumulative oil recovery for crude oil displacements by water and chemical solutions. The breakthrough recovery is shown in each displacement as the point where the pressure reaches a maximum and then drops; see Figure 14B. Breakthrough recovery appears to be dominated by viscous forces: the breakthrough recovery is around 3–8% higher from polymer or SP injection compared to water or surfactant. Surfactant leads to the highest degree of fingering before breakthrough, so the time of breakthrough occurs faster, at approximately 0.25 PV injected, compared to that on waterflooding at 0.34 PV injected, leading to a low oil recovery. Surfactant flooding in an adverse mobility system does change the interfacial behavior, but in the absence of strong oil and water emulsification, the reduction in IFT actually hurts the recovery instead of helping.
The breakthrough oil recoveries range from 15% to 23%, with water and surfactant flooding giving low breakthrough recoveries and polymer and SP giving higher values. Table 3 summarizes the breakthrough and post-breakthrough oil recovery values. In terms of breakthrough recovery, the impact of a higher degree of fingering from SP injection does not affect recovery the way that surfactant does compare to water; the breakthrough recovery in both polymer and SP is controlled by the polymer viscosity. Furthermore, despite the dramatic injection fluid viscosity contrast between polymer/SP and water/surfactant solutions, the breakthrough recoveries are not different by an order of magnitude. Instead, the impacts of the higher viscosity polymer or SP fluids are seen after breakthrough (see Table 3).
The post-breakthrough crude oil recovery by waterflooding is not very high. In the Hele-Shaw cell system, there is no opportunity for improved oil production from water imbibition into bypassed zones. With local displacements and oil stripping as the only recovery mechanisms, there is a very limited driving force for incremental oil production after the viscous pressure drop has declined. The incremental recovery from BT to 4 PV of water injected is just around 12% OOIP. As is observed in the sequence of Figure 6, the water is not diverted to unswept zones; instead, it keeps flowing continuously through the preformed water channel and sweeping residual oil at the edges of the sweep zone without any marked oil recovery improvement. The initial pressure drop at breakthrough drives the formation and shape of the main water channels and therefore the final oil recovery.
Oil recovery by surfactant is reached due to IFT effects; an apparent wettability alteration of the cell allows for the complete recovery of the oil film left behind by former surfactant streams. The final oil recovery by surfactant is 24% OOIP, which is lower than waterflooding alone, and the incremental oil recovery from BT to 4 PV of surfactant injected is 9% OOIP, which is similar to that of waterflooding. This means two things: First, that the bypassed oil within the swept zones does not contribute much to the ultimate oil recovery. Second, that the front control of the displacement before BT is an important parameter that can make the difference in reaching a higher final cumulative oil recovery in displacements with high viscosity ratios. Although the viscosity ratios for both waterflooding and surfactant flooding are similar, the degree of fingering reached by surfactant flooding is more pronounced. The reduction in IFT leads to the surfactant increasing its contact area with the crude oil and thus increasing the fingering in the displacement. Nevertheless, the high viscosity of the crude oil prevents surfactants from travelling further from the main fingers. Higher viscosities seem to affect the surfactant’s performance as well as the access to the further unswept areas of the model. It should be emphasized again that these observations are from the Hele-Shaw cell, which did not involve any porous media. Laboratory studies showing improved surfactant effects in linear core floods are clearly seeing the impacts of fluid mobility changes or flow diversion from the formation of emulsions in the presence of surfactants. The value of the Hele-Shaw visual study is to show that (a) surfactants do in fact work in heavy oil systems in terms of dramatically changing the interfacial properties compared to water alone, but (b) without the formation of emulsions this does not lead to improved oil recovery. Furthermore, in actual oil reservoir applications (i.e., moving away from linear sand packs) the impact of emulsions must be significant in the 3D space or surfactant flooding will also not be impactful in heavy oil.
As was discussed previously, the polymer is added to water to increase its viscosity and reduce its mobility. Compared to water and surfactant, polymeric displacements (i.e., polymer and SP) exhibit a marked improvement in the sweep efficiency. In Table 3, polymeric solutions show a final oil recovery of approximately ≈ 50% more than those ones at water and surfactant flooding. This recovery is attained at higher pressures, as is seen in Figure 14B. Polymer breakthrough occurs later (at 0.41 PV compared to water at 0.29 PV), and the oil recovery at breakthrough (22% OOIP) is already comparable to the final oil recovery from the total waterflood. This shows the significance of reduced viscous fingering before breakthrough. The biggest impact of the higher viscosity fluid is after breakthrough: even with continuous polymer channels present across the cell, the mobility in these channels remains low due to the higher polymer viscosity. As a result, more oil is recovered by the improved viscosity ratio, giving a final cumulative oil recovery of 82% OOIP under higher pressure drops. The residual oil film is observed as a response of the cell to being oil-wet in the presence of polymer.
The SP solution has a viscosity that is around 20% that of crude oil (see Table 2) and that is slightly higher than that of polymer. Based on this evidence and the synergy between surfactant and polymer, it was initially speculated that the displacement by SP might be more efficient than polymer in terms of ultimate oil recovery. Figure 12 shows once again that, in the absence of significant emulsification effects from the surfactant, the recovery is still controlled by the viscosity of the polymer. A breakthrough occurs faster for SP (0.32 PV), leading to a quite similar oil recovery to polymer at this point: 23% OOIP. The surfactant effect is just noticed in the sweep zone, as is seen in Figure 12. The surfactant only helps to recover the oil film left behind by polymer. This means that in a 2D system with no capillary trapping, the oil recovery in real crude oil by SP is achieved mostly by polymer effects and just a negligible fraction by surfactant. The ultimate oil recovery is quite a bit lower than that of polymer. The addition of surfactant into the polymer solution decreases the final oil recovery from 82% OOIP of polymer flooding to 74% OOIP. Comparing Figure 10 and Figure 12, it is observed that the surfactant in polymer solutions increases the fingering, leading to a slightly unstable front that ultimately affects the final oil recovery. This finding agrees with previous findings reported by Zhou et al. [13] in a two-dimensional physical model, where it was found that the presence of surfactant in polymer slugs might affect the performance of the polymer displacement, leading to a decrease in oil recovery compared to that found in polymer solutions alone.
Based on laboratory and literature observations [27] which state that surfactant might assist in heavy oil recovery in the presence of polymer, a two-slug displacement was designed to check the SP sweep mechanism in previous polymer-flooded zones. The first chemical slug consists of 1.5 PV of polymer injected, followed by a second slug of 2.5 PV of SP injected. The concentrations of each chemical slug were kept the same as those in previous displacements. The test was carried out at a flow rate of 0.3 mL/min.
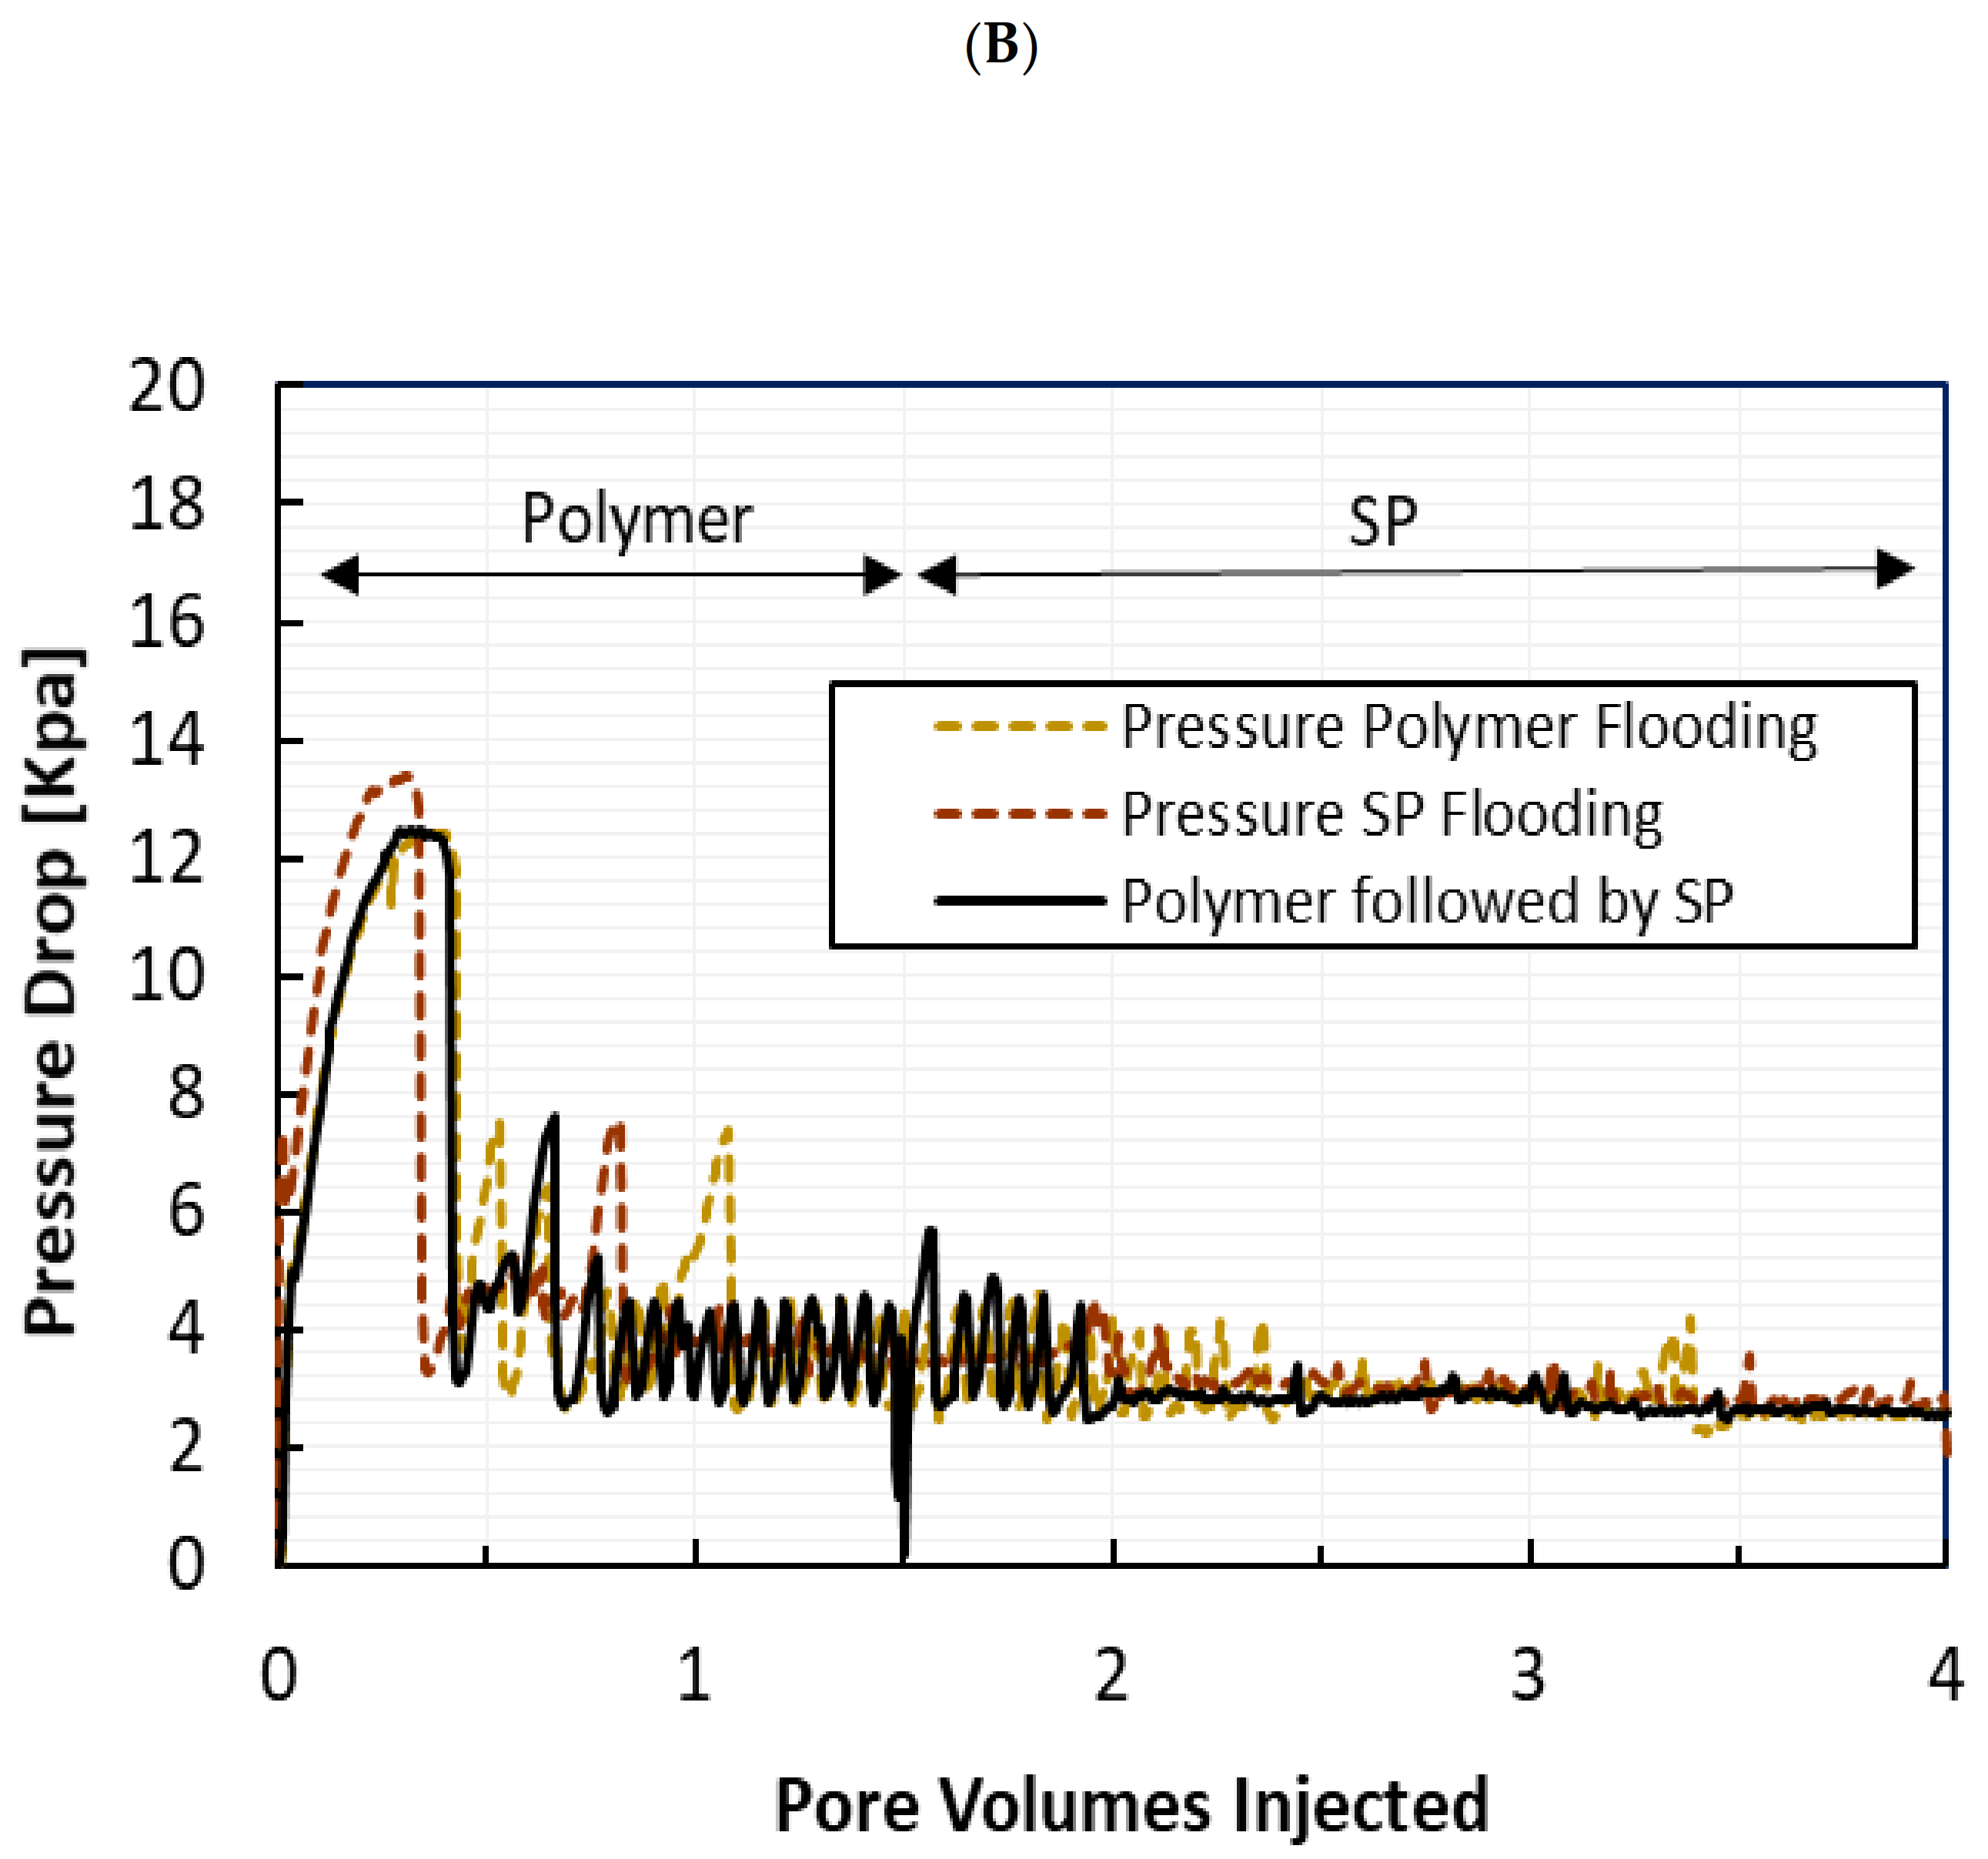
Figure 15 shows the displacement sequence for this test and Figure 16A,B show the cumulative oil recovery and the pressure drop graph for the slug injection polymer followed by SP. The maximum pressure drop of 12.4 kPa is reached during polymer flooding at breakthrough and then is hardly maintained at around 3.4 kPa due to the presence of snap-off at the outlet of the cell. When SP is injected, the pressure increases again up to 5.5 kPa, meaning that the overall pressure in the system is still maintained by the further SP solution. Once the SP has filled the polymer channels, the pressure in the system decreases again until 2.7 kPa, with no presence of snap-off (i.e., pressure drop is constant in the cell, it does not have local increases and decreases as in the polymer flood). During the SP flooding in the cell, surfactant is essentially sweeping the residual oil film out of the system and the pre-formed polymer pathways are washed out as the displacement of SP continues. This shows that the surfactant is active in the system. However, it is important to note that, once SP is injected into the cell, the oil recovery decreases, reaching a final oil recovery of 76% OOIP—a value similar to the SP-flooded system. This result is similar to the previous SP flood system, where the addition of surfactant appears to affect the polymer displacement performance. The higher polymer flood recovery may be related to these localized small pressure spikes driving incremental oil out of the system. In the case of straight SP injection or SP after polymer, the pressure drop is overall similar to that of the polymer, but without these localized spikes in pressure the oil recovery is lower. Thus, surfactant acting to reduce IFT can actually negate some of the interfacial forces that are helping to displace oil after breakthrough. Once again, these observations are made in a system with no porous media, where emulsions are not present. The significance of these tests is to demonstrate that, unless significant emulsification is present, surfactants may actually hurt oil recovery in the reservoir.

4. Conclusions

The Hele-Shaw tests in this work allow for the visual observation of the behaviour of various fluids (water, surfactant, polymer, SP, and solvent) and heavy oil in a 2D system, with no capillary trapping effects from porous media. The following conclusions were drawn:
  • The macro mechanisms of heavy oil production by chemical flooding are strongly associated with the viscosity ratio between the displacing fluids and crude oil.
  • Heavy oil recovery is affected most strongly by reducing the mobility of the displacing phase than decreasing the oil–water interfacial tension and trying to generate and flow emulsions.
  • The oil recovery by waterflooding at early and later times in crude oil systems is strongly linked to the performance of water fingers up to the point of BT. After this point, water keeps flowing through the preformed fingers without any additional oil recovery.
  • Surfactant flooding recovers oil through sub-finger formation at early times, followed by oil stripping and sweeping residual oil along swept zones.
  • The formation of sub-fingers in surfactant flooding displacement changes the flow patterns in the 2D system and shows that waterfloods and surfactant floods do not displace oil in the same way, even though both fluids exhibit similar values for the viscosity ratio. However, despite these differences the oil recovery from water and surfactant floods will be similar. Without significant emulsification due to surfactant injection, the oil recovery will not be improved compared to water injection alone.
  • The mechanism of heavy oil production by polymer flooding is observed in the reduction in the number of fingers compared to water/surfactant flooding, as well as the presence of a more stable front. These mechanisms improve the sweep efficiency both at the point of breakthrough and at later times.
  • In the 2D system without porous media, oil recovery by SP is achieved mostly by polymer rather than the effect of surfactant. The surfactant in the SP slug just washes out the swept zone after breakthrough, but it does not assist in increasing the area swept. Surfactants smooth out the localized pressure spikes in the system at later times and can actually lead to a worse displacement efficiency compared to polymer alone. Once again, unless surfactants are able to generate the significant emulsification of fluids within the reservoir, they do not appear to help with heavy oil recovery and, in fact, may decrease the recovery when compared to polymer flooding alone.

Author Contributions

Formal analysis, F.G., J.B. and A.K.; Investigation, F.G.; Methodology, F.G.; Supervision, A.K.; Writing—original draft, F.G.; Writing—review & editing, J.B. and A.K. All authors have read and agreed to the published version of the manuscript.

Funding

This research received no external funding.

Institutional Review Board Statement

Not applicable.

Informed Consent Statement

Not applicable.

Acknowledgments

The authors wish to acknowledge the staff of PERM Inc./TIPM Laboratory, especially to Feng Li, who provided considerable assistance in setting up the laboratory equipment for the experiments. The advice and collaboration from Bernard Then are also appreciated. The chemicals used in this study were generously provided by ChemEOR and Kemira Chemicals. Financial support was provided by NSER/AITF IRC in fundamentals of Unconventional Resources and the associated industrial consortium members: Husky Energy, Athabasca Oil Corporation, Brion Energy, Canadian Natural, Foundation CMG, Laricina Energy, Maersk Oil, Suncor Energy and the Schulich School of Engineering (University of Calgary).

Conflicts of Interest

The authors declare no conflict of interest.

Nomenclature

hCell spacing or gasket thickness, [m]
LLength in the direction of the flow [m]
PPressure, [psi]
QFlow rate [m3/s]
RReynolds Number
ƟowContact angle between oil and water
µViscosity, [mPa·s]
π3.14159
IstInstability Number
BTBreakthrough
EOREnhanced Oil Recovery
IFTInterfacial Tension
OOIPOriginal Oil in Place
O/WOil-in-Water
PVPore Volume Injected
SPSurfactant-Polymer

References

  1. Wang, J.; Dong, M. Optimum Effective Viscosity of Polymer Solution for Improving Heavy Oil Recovery. J. Pet. Sci. Eng. 2009, 16, 155–158. [Google Scholar] [CrossRef]
  2. Ashghari, K.; Nakutnny, P. Experimental results of Polymer Flooding of Heavy Oil Reservoirs. In Proceedings of the Canadian International Petroleum Conference/SPE Gas and Technology Symposium, Calgary, AB, Canada, 17–19 June 2008. [Google Scholar]
  3. Sheng, J.J. A Comprehensive Review of Alkaline–Surfactant–Polymer (ASP) Flooding. Asian-Pac. J. Chem. Eng. J. 2014, 9, 471–489. [Google Scholar] [CrossRef]
  4. Levitt, D.; Jouenne, S.; Bondino, I.; Santanach, E.; Bourrel, M. Polymer Flooding of Heavy Oil Under Adverse Mobility Conditions. In Proceedings of the SPE Enhanced Oil Recovery Conference, Kuala Lumpur, Malaysia, 2–4 July 2013. [Google Scholar]
  5. Vik, B.; Kedir, A.; Kippe, V.; Sandengen, K.; Skauge, T.; Solbakken, J.; Dingwei, Z. Viscous Oil Recovery by Polymer Injection; Impact of In-Situ Polymer Rheology on Water Front Stabilization. In Proceedings of the SPE Europe featured at 80th EAGE Conference and Exhibition, Copenhagen, Denmark, 11–14 June 2018. [Google Scholar]
  6. Hernández, E.; Valero, E.; Rodríguez, I.; Guerra, E.; Espinoza, J.; Briceño, R.; Alida, V. Enhancing the Recovery of an Extra Heavy Oil Reservoir by Using Low Salinity Polymer Flooding. In Proceedings of the SPE Latin American and Caribbean Petroleum Engineering Conference, 27–31 July 2020. Virtual Presentation. [Google Scholar]
  7. Johnson, C., Jr. Status of Caustic and Emulsion Methods. J. Pet. Technol. 1976, 28, 85–92. [Google Scholar] [CrossRef]
  8. Aminzadeh, B.; Hoang, V.; Inouye, A.; Izgec, O.; Walker, D.; Chung, D.; Nizamidin, N.; Tang, T.; Lolley, C.; Varadarajan, D. Improving Recovery of a Viscous Oil Using Optimized Emulsion Viscosity. In Proceedings of the SPE Improved Oil Recovery Conference, Tulsa, OK, USA, 11–13 April 2016. [Google Scholar]
  9. Mohammadzadeh, O.; Sedaghat, M.H.; Kord, S.; Zendehboudi, S.; Giesy, J.P. Pore-Level Visual Analysis of Heavy Oil Recovery Using Chemical-Assisted Waterflooding Process Use of A New Chemical Agent. Fuel 2019, 239, 202–219. [Google Scholar] [CrossRef]
  10. Schramm, L.L. Emulsions: Fundamentals and Applications in the Petroleum Industry. In Petroleum Emulsions: Basic Principles; Advances in Chemistry Series 231; American Chemical Society: Washington, DC, USA, 1992; pp. 1–50. [Google Scholar]
  11. Liu, Q.; Dong, M.; Shanzhou, M. Alkaline/Surfactant Flood Potential in Western Canadian Heavy Oil Reservoirs. In Proceedings of the SPE/DOE Symposium on Improved Oil Recovery, Tulsa, OK, USA, 22–26 April 2006. [Google Scholar]
  12. Bryan, J.; Kantzas, A. Potential for Alkali-Surfactant Flooding in Heavy Oil Reservoirs Through Oil-in-Water Emulsification. J. Can. Pet. Technol. 2009, 48, 37–46. [Google Scholar] [CrossRef]
  13. Zhou, X.; Dong, M.; Maini, B. The Dominant Mechanism of Enhancing Heavy Oil Recovery By Chemical Flooding In A Two- Dimensional Physical Model. J. Fuel 2012, 18, 262–268. [Google Scholar]
  14. Kumar, R.; Kishore, K.M. ASP Flooding of Viscous Oils. In Proceedings of the SPE Annual Technical Conference and Exhibition, Florence, Italy, 19–22 September 2010. [Google Scholar]
  15. Bryan, J.; Shamekhi, H.; Su, S.; Kantzas, A. Insights into Heavy Oil Recovery by Surfactant, Polymer and ASP Flooding. In Proceedings of the SPE Heavy Oil Conference-Canada, Calgary, AB, Canada, 11–13 June 2013. [Google Scholar]
  16. Lee, J.; Huang, J.; Tayfun, B. Visual Support for Heavy-Oil Emulsification and its Stability for Cold-Production using Chemical and Nano-Particles. Paper presented at the SPE Annual Technical Conference and Exhibition, Calgary, AB, Canada, 30 September–2 October 2019. [Google Scholar]
  17. Alvarado, D.; Marsden, S. Flow of Oil-in-Water Emulsions Through Tubes and Porous Media. Soc. Pet. Eng. J. 1979, 19, 369–377. [Google Scholar] [CrossRef]
  18. Saffman, P.; Taylor, G. The Penetration of a Fluid into a Porous Medium or Hele-Shaw Cell Containing a More Viscous Liquid. Proceedings of the Royal Society of London. Ser. A Math. Phys. Sci. 1958, 245, 312–329. [Google Scholar]
  19. Lenormand, R.; Touboul, E.; Zarcone, C. Numerical models and experiments on immiscible displacements in porous media. J. Fluid Mech. 1988, 189, 165–187. [Google Scholar] [CrossRef]
  20. Coskuner, G.; Bentsen, R. A Hele-Shaw cell study of a new approach to instability theory in porous media. J. Can. Petroleum Technol. 1988, 27, 87–95. [Google Scholar]
  21. Mai, A.; Kantzas, A. Mechanisms of Heavy Oil Recovery by Low Rate Waterflooding. J. Can. Pet. Technol. 2010, 49, 44–50. [Google Scholar] [CrossRef]
  22. Abdelfatah, E.; Wahid-Pedro, F.; Melnic, A.; Vandenberg, C.; Luscombe, A.; Berton, P.; Bryant, S.L. Microemulsion Formulations with Tunable Displacement Mechanisms for Heavy Oil Reservoirs. Spe J. 2020, 25, 2663–2677. [Google Scholar] [CrossRef]
  23. Denney, D. Processes Responsible for Heavy-Oil Recovery by Alkali/Surfactant Flooding. J. Pet. Technol. 2009, 61, 52–88. [Google Scholar] [CrossRef]
  24. Izuchukwu, O.; Ayodele, T.O.; Abdullahi, G.S.; Joshua, D.; Olafuyi, O. Visualization of Heavy Oil Recovery Processes Using Hele-Shaw Cell. In Proceedings of the SPE Nigeria Annual International Conference and Exhibition, Lagos, Nigeria, 6–8 August 2018. [Google Scholar]
  25. Voroniak, A.; Bryan, J.L.; Hejazi, H.; Kantzas, A. Two-Dimensional Visualization of Heavy Oil Displacement Mechanism During Chemical Flooding. In Proceedings of the SPE Annual Technical Conference and Exhibition, Dubai, UAE, 26–28 September 2016. [Google Scholar]
  26. Guerrero, F.; Bryan, J.L.; Kantzas, A. Heavy Oil Recovery Mechanisms by Surfactant, Polymer and SP in a Non-Linear System. In Proceedings of the SPE Canada Heavy Oil Technical Conference, Calgary, AB, Canada, 13–14 March 2018. [Google Scholar]
  27. Rousseau, D.; Bekri, S.; Boujlel, J.; Hocine, S.; Degre, G. Designing Surfactant-Polymer Processes for Heavy Oil Reservoirs: Case Studies. In Proceedings of the SPE Canada Heavy Oil Technical Conference, Calgary, AB, Canada, 13–14 March 2018. [Google Scholar]
Figure 1. Schematic of the Hele-Shaw displacement experiments.
Energies 14 00950 g001
Figure 2. Hele-Shaw dimensions.
Energies 14 00950 g002
Figure 3. Oil–water IFT as a function of surfactant concentration.
Energies 14 00950 g003
Figure 4. Viscosity versus shear rate for polymer and SP.
Energies 14 00950 g004
Figure 5. Error bars for the repeated tests in heavy oil displacements by water, surfactant, polymer, and SP.
Energies 14 00950 g005
Figure 6. Crude oil displacement by waterflooding at 0.3 mL/min.
Energies 14 00950 g006
Figure 7. Oil recovery by waterflooding for crude oil.
Energies 14 00950 g007
Figure 8. Crude oil displacement by surfactant flooding at 0.3 mL/min.
Energies 14 00950 g008
Figure 9. Oil recovery by surfactant flooding for crude oil.
Energies 14 00950 g009
Figure 10. Crude oil displacement by polymer flooding at 0.3 mL/min.
Energies 14 00950 g010
Figure 11. Oil recovery by polymer flooding for crude oil.
Energies 14 00950 g011
Figure 12. Crude oil displacement by SP flooding at 0.3 mL/min.
Energies 14 00950 g012
Figure 13. Oil recovery by SP flooding for crude oil.
Energies 14 00950 g013
Figure 14. Cumulative oil recovery (A) and pressure drop (B) in different chemical solutions at 0.3 mL/min in crude oil displacements.
Energies 14 00950 g014
Figure 15. Crude oil displacements by 1.5 PV of polymer injected, followed by 2.5 PV of SP injected at 0.3 mL/min.
Energies 14 00950 g015
Figure 16. Cumulative oil recovery (A) and pressure drops (B) by polymer followed by SP at 0.3 mL/min for the displacement of crude oil.
Energies 14 00950 g016aEnergies 14 00950 g016b
Table 1. Properties of the oil and aqueous solutions used in this experiment.
PropertyCrude OilDeionized WaterSurfactant 1500 ppmPolymer 500 ppmSP
Density at 25 °C [kg/m3]926 997997997997
IFT – Crude Oil [mN/m]N/A22.500.0522.363.90
Table 2. Viscosity ratios for crude oil tests.
Displacement TestsCrude Oil
Test Flow Rates [mL/min]0.3
Equivalent Shear Rate [1/s]0.72
Viscosity [mPa·s]Oil1186
Deionized Water0.89
Surfactant0.97
Polymer204
SP242
Viscosity RatioOil/Water1333
Oil/ Surfactant1223
Oil/ Polymer5.81
Oil/ SP4.90
Table 3. Summary results of flood tests.
Chemical SlugBreakthrough
Recovery
[%OOIP]
Incremental Oil
Recovery
[%OOIP]
Final Oil
Recovery
[%OOIP]
Water Flooding201232
Surfactant Flooding15924
Polymer Flooding226082
SP Flooding235174
Publisher’s Note: MDPI stays neutral with regard to jurisdictional claims in published maps and institutional affiliations.

