Article

Damping Studies on PMLG-Based Wave Energy Converter under Oceanic Wave Climates

1
College of Mechatronics and Control Engineering, Shenzhen University, Shenzhen 518061, China
2
Department of Electrical Engineering, Uppsala University, Box 65, 75103 Uppsala, Sweden
*
Author to whom correspondence should be addressed.
Energies 2021, 14(4), 920; https://doi.org/10.3390/en14040920
Submission received: 29 December 2020 / Revised: 29 January 2021 / Accepted: 3 February 2021 / Published: 9 February 2021
(This article belongs to the Section A3: Wind, Wave and Tidal Energy)

Abstract

:
Wave energy converters (WECs), which are designed to harvest ocean wave energy, have recently been improved by the installation of numerous conversion mechanisms; however, it is still difficult to find an appropriate method that can compromise between strong environmental impact and robust performance by transforming irregular wave energy into stable electrical power. To solve this problem, an investigation into the impact of varied wave conditions on the dynamics of WECs and to determine an optimal factor for WECs to comply with long-term impacts was performed. In this work, we researched the performance of WECs influenced by wave climates. We used a permanent magnet linear generator (PMLG)-based WEC that was invented at Uppsala University. The damping effect was first studied with a PMLG-type WEC. Then, a group of sea states was selected to investigate their impact on the power production of the WEC. Two research sites were chosen to investigate the WEC’s annual energy production as well as a study on the optimal damping coefficient impact. In addition, we compared the WEC’s energy production between optimal damping and constant damping under a full range of sea states at both sites. Our results show that there is an optimal damping coefficient that can achieve the WEC’s maximum power output. For the chosen research sites, only a few optimal damping coefficients were able to contribute over 90% of the WEC’s annual energy production. In light of the comparison between optimal and constant damping, we conclude that, for specific regions, constant damping might be a better choice for WECs to optimize long-term energy production.

1. Introduction

Wave energy technology was proposed as a concept for harvesting energy from ocean waves, with its first relevant patent documented in 1799 [1]. Nowadays, devices aiming to generate usable energy from wave energy are regarded as wave energy converters (WECs) [2]. In general, a WEC can be divided into two major parts: One part is an absorbing component to extract energy by reacting to the waves and the other part is a generating system that transforms the absorbed mechanical energy into usable energy (mostly electrical energy).
Until recently, there are lists of WECs dedicated to harvesting wave energy, with a variety of designs from mechanical structure to electrical conversion. Accordingly, comprehensive classifications by multiple criteria are also available in several literature reviews. For instance, Falcao gave a comprehensive overview on the mechanical structure and control methods of WECs [3]. Later, a review of the economic analysis of WECs was presented by Astariz in [4]. Penalba published a review on wave-to-wire models for wave energy converters [5]. Ozkop summarized the control methods employed in WECs [6]. Nguyen presented a review on the large floating system integration of a wave energy converter [7]. As physical constraints are removed from the designs of WECs, new designs and research continue to pop up and, as a result, the classification is updated accordingly.
In light of [8], the WEC used in our study was a point absorber (PA) type WEC—a subcategory classified by the WEC’s mechanical mechanism, with other subcategories depicted in Figure 1. PA is defined as the absorption width having a much smaller dimension than the wave length and is further regarded as a simplified point that captures waves [9].
Regarding PA-type WECs, the permanent magnet linear generator (PMLG) is one of the most frequently used mechanisms to produce electricity [10]. PMLG-based WECs are effective based on their simplicity of mechanical design and degree-of-freedom to wave reactions [11]; however, due to the direct-drive feature of PMLG, the generated power is closely related to the behavior of the waves, meaning that the design is significantly affected by ocean wave dynamics [12]. In this case, changes in sea state with large uncertainty may lead to undesirable power flow.
To reduce undesirable output ripples, power regulation is a vital step in the procedure of electrical conversion [13]. Note that within a PMLG-based direct-drive WEC, the induced damping force is one controllable determining factor to enhance electrical power generation [12], and is the key to regulating the power profile.
Relevant research on damping is available in some published literature on PMLG-based WECs. In light of [14], Liu studied both electrical damping and mechanical damping on a buoy’s behavior. In [15], Wang proposed the optimal load estimation based on the electromagnetic force by power-take-off (PTO) damping. Teillant discussed the optimal damping profiles with a single degree of freedom [16]. Son utilized an optimal damping profile for a nonlinear model predictive control (NMPC) methodology [17]. In [18], the author simulated different PTO damping of different power rates. The authors of [19] studied the influence of the PTO damping on the wave pressure with varied positions of the wet-surface. In [20,21], the damping coefficient was probed for damping implementation to optimize the WEC’s performance. The above literature provides research that focuses mainly on the power-take-off (PTO) damping of the direct-drive linear generator, without considering the damping under different wave conditions that persist for long periods and the subsequent effect on the power performance. Moreover, more concerns related to actual cases should be included such as redundant signal errors, weather uncertainties, and even higher losses due to more powered electronic devices [22].
As the WEC’s performance is significantly impacted by wave climates, it is vital to research the impact of different sea states on the performance of WECs [23]. To address this, [24] confirmed that the conditions of the waves significantly affected the damping through experiments. Some published research has also shown that the damping effect is influenced by the wave climate of various sea states [25]. A similar pattern can also be observed by the relation between the damping coefficient and the absorbed wave energy under different sea states. Some studies have also suggested optimal damping for the direct-drive type of wave energy conversion system [26,27]. Nevertheless, while most research has been conducted with a limited number of damping coefficients, comprehensive research on the optimal damping coefficient is still lacking consideration of the variable impact of wave climates.
Note that oceanic wave climates can be predicted by the statistics of different sea states at a certain location (i.e., the occurrence frequency of sea states) [28], thus, it is necessary to investigate damping based on the known wave climates to study the impact of the variation of sea states. However, waves can be considered as stochastic processes [29], especially for small waves with an energy period in a range of several seconds. A better way to enhance wave energy absorption is to optimize the WEC’s performance in light of the local wave climates.
In our study, a PMLG-based WEC was studied under a real wave climate. By investigating annual wave climates found at different test sites, we propose optimal choices for the damping coefficient to enhance WEC power production. Our study features two major contributions to the body of research of WECs: the study of the variation of the optimal damping coefficient under different wave climates and the proposal of a new methodology for the annual evaluation of the optimized performance of one WEC under a real wave climate. The research procedure consisted of five continuous steps:
  • The numeric model was verified on a PMLG-type WEC with experimental results.
  • The power profiles were investigated in relation to a limited variation of sea states.
  • The damping impact was studied toward the WEC’s power production.
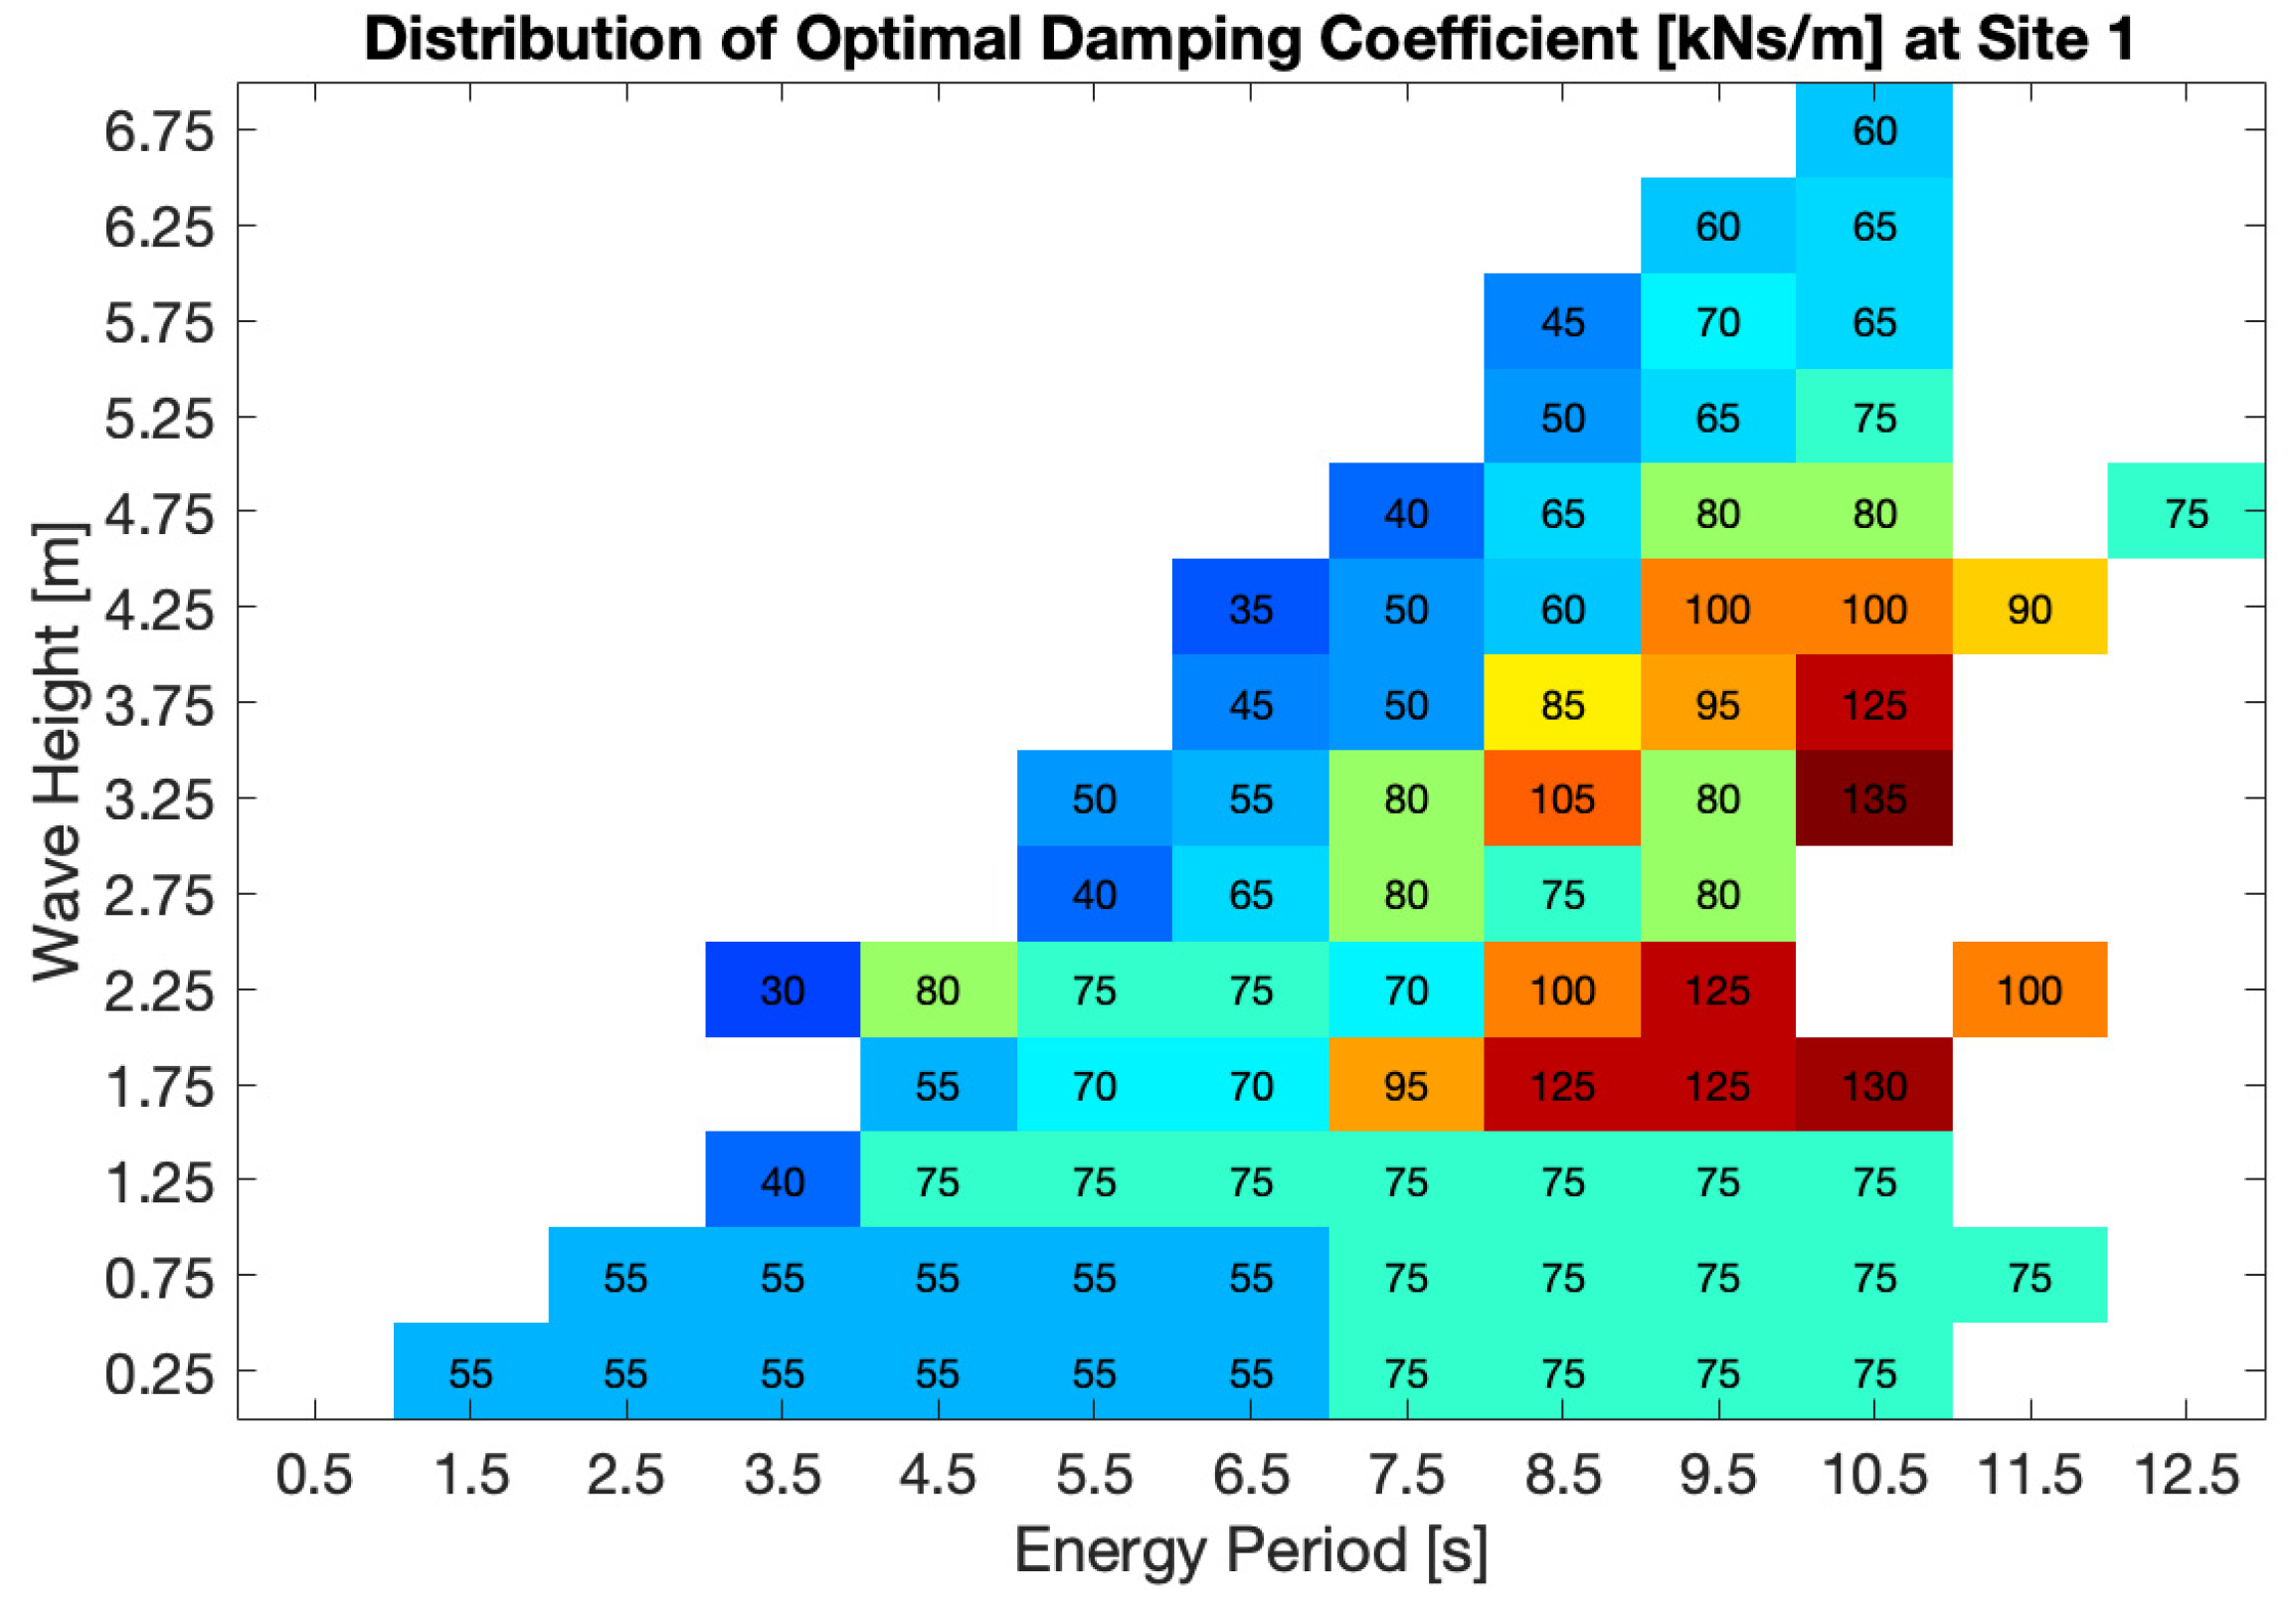
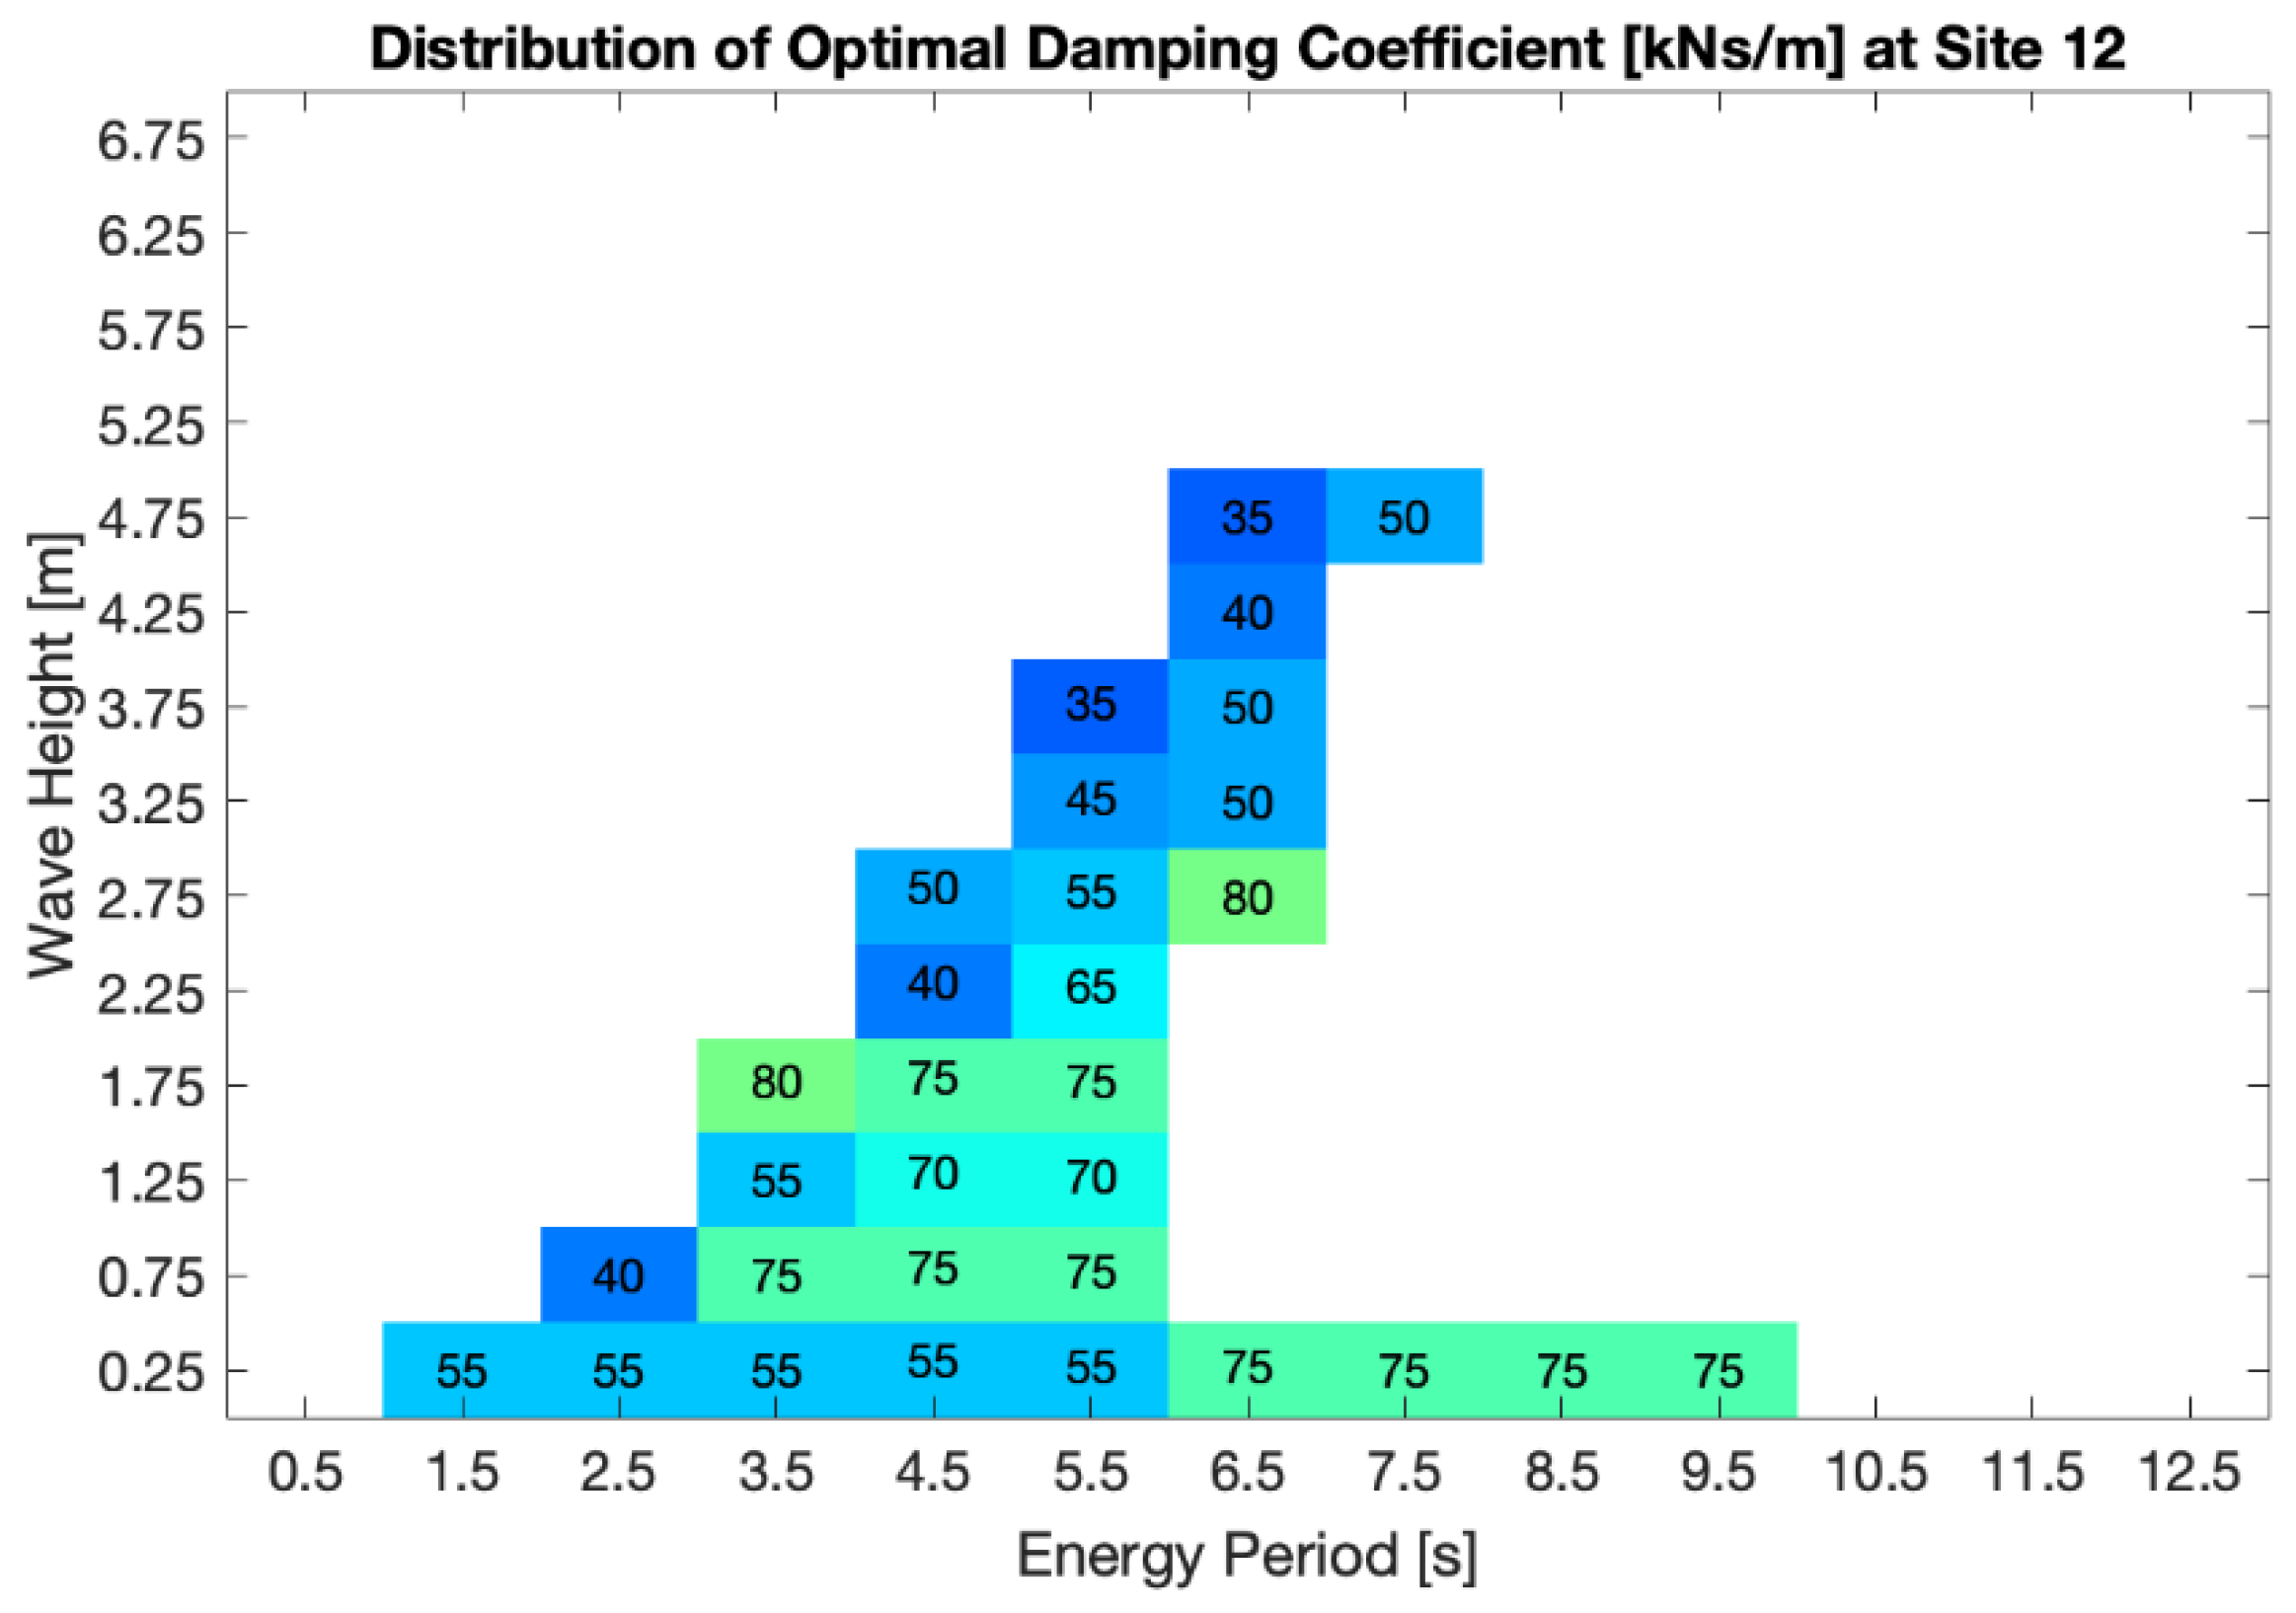
  • Power matrix was obtained under optimal damping cases at two different test sites.
  • Annual energy production was estimated and compared between optimal damping and constant damping cases at different test sites.
The rest of this paper is structured as follows. Section 2 presents the studied WEC invented in the wave energy project held by Uppsala University, followed by the hydrodynamics theory and working principle for the PMLG-based WEC, which is presented in Section 3. Section 4 introduces the materials and methods utilized in this article including the WEC model and the studied wave climates at the two chosen test sites and Section 5 displays the results with a detailed discussion where the results show the interaction of the WEC’s damping features and the wave climates as well as proposing the optimal damping coefficient that leads to the maximum energy production. Finally, Section 6 presents our conclusions and future work.

2. Wave Energy Project at Uppsala University

The wave energy project at Lysekil is led by Uppsala University (UU) in Sweden [30,31,32]. The project started in 2002, and so far, 13 prototype WECs have been installed at the test site located on the Swedish west coast [33].
The test sites are located in an area about 10 km off the Swedish west coast, as shown in Figure 2a [34], where the UU Project deploys and tests the WECs. The research site fulfills three important geographical requirements and economic consideration: (a) the seabed is flat enough to accommodate over 10 prototypes of WEC; (b) the nearby harbor offers good accessibility and transmission conditions; and (c) biological and environmental studies are available as the test site is close to biological stations.
The WEC studied in this paper was invented within the UU Project. The concept of WEC is based on a PMLG installed on the seabed, as shown in Figure 3. The linear generator consists of two parts: a fixed stator and a movable translator. The translator is connected to a floating buoy at the ocean surface via a guiding line. When incoming waves push the buoy moving up and down, the translator is driven to produce reciprocating motion. Then, the electrical power is generated and thus transmitted to the on-land load through a sea cable [35,36]. In this work, a numerical model was established for the WEC. Relevant theories for the model are discussed in Section 3. Optimal damping at the region of the Lysekil test site was already studied in [12]; therefore, we selected other locations to investigate the variation of sea states (see Figure 4).

3. Theories on Hydrodynamics and Energy Conversion

The hydrodynamic model was built to describe the mechanic interaction between waves and a single WEC of the point absorber with PMLG power take-off [39]. This theory only applies to the vertical motion of the waves and floating buoy, as described in Equation (1).
m a + m x ¨ 1 = f e x c t f r t f h f l x 1 , x 2 m b x ¨ 2 = f l i n e x 1 , x 2 + f d a m p x 2 , x ˙ 2 m b g + f u p p _ e s + f l o w _ e s
where x 1 and x 2 both represent the WEC’s motion under excitation from waves. x 1 is the buoy vertical position and x 2 is the translator position. In the upper equation, f e x c t denotes the excitation force, f r denotes radiation force, and f l is the force acting on the guiding line. m a is the mass of buoy and m is the added mass. All the variables function in time series.
In the lower equation, m b is the mass of the translator. Furthermore, f d a m p denotes the damping force inside the generator, f u p p _ e s is the force on the upper-end stop, and f l o w _ e s is the force on the lower-end stop. All the above variables depend on the velocity of the translator in time series. Two end-stop springs inside the generator were used as protection for the hull of the generator. The upper and lower end-stop forces are denoted as f u p _ e s and f l o w _ e s , respectively, and their forces are obtained by Equations (2) and (3), respectively [12].
f u p _ e s x 2 = k s 1 x 2 l 1 i f   x 2 > l 1 0 e l s e
f l o w _ e s x 2 = k s 2 x 2 l 2 i f   x 2 < l 2 0 e l s e
In Equation (1), the guiding line that connects the linear generator, and the floating buoy is regarded as a stiff spring. The spring takes effect when the distance between the buoy and translator is larger than the length of the line, giving a force as described in Equation (4).
f l i n e x 1 , x 2 = k line x 1 x 2 i f   x 1 > x 2 0 e l s e
The damping force is induced inside the generator when relative motion occurs between the translator and stator [27]. The damping force is proportional to the translator speed multiplied by the damping coefficient γ , which is given by
f d a m p x ˙ 2 = γ x ˙ 2
Note that γ is a time-dependent variable and it relies on the behavior of PMLGs. According to the hydrodynamic theory, the average absorbed power by the buoy can be calculated,
P a b s o r b e d = f d a m p x ˙ 2
Besides the absorbed power on the buoy, the available wave energy toward the buoy is also necessary, as given in Equation (8). P a v a i l a b l e represents the available wave energy toward the buoy, given by,
P a v a i l a b l e = ρ g 2 64 π T e H s 2

4. Materials and Methods

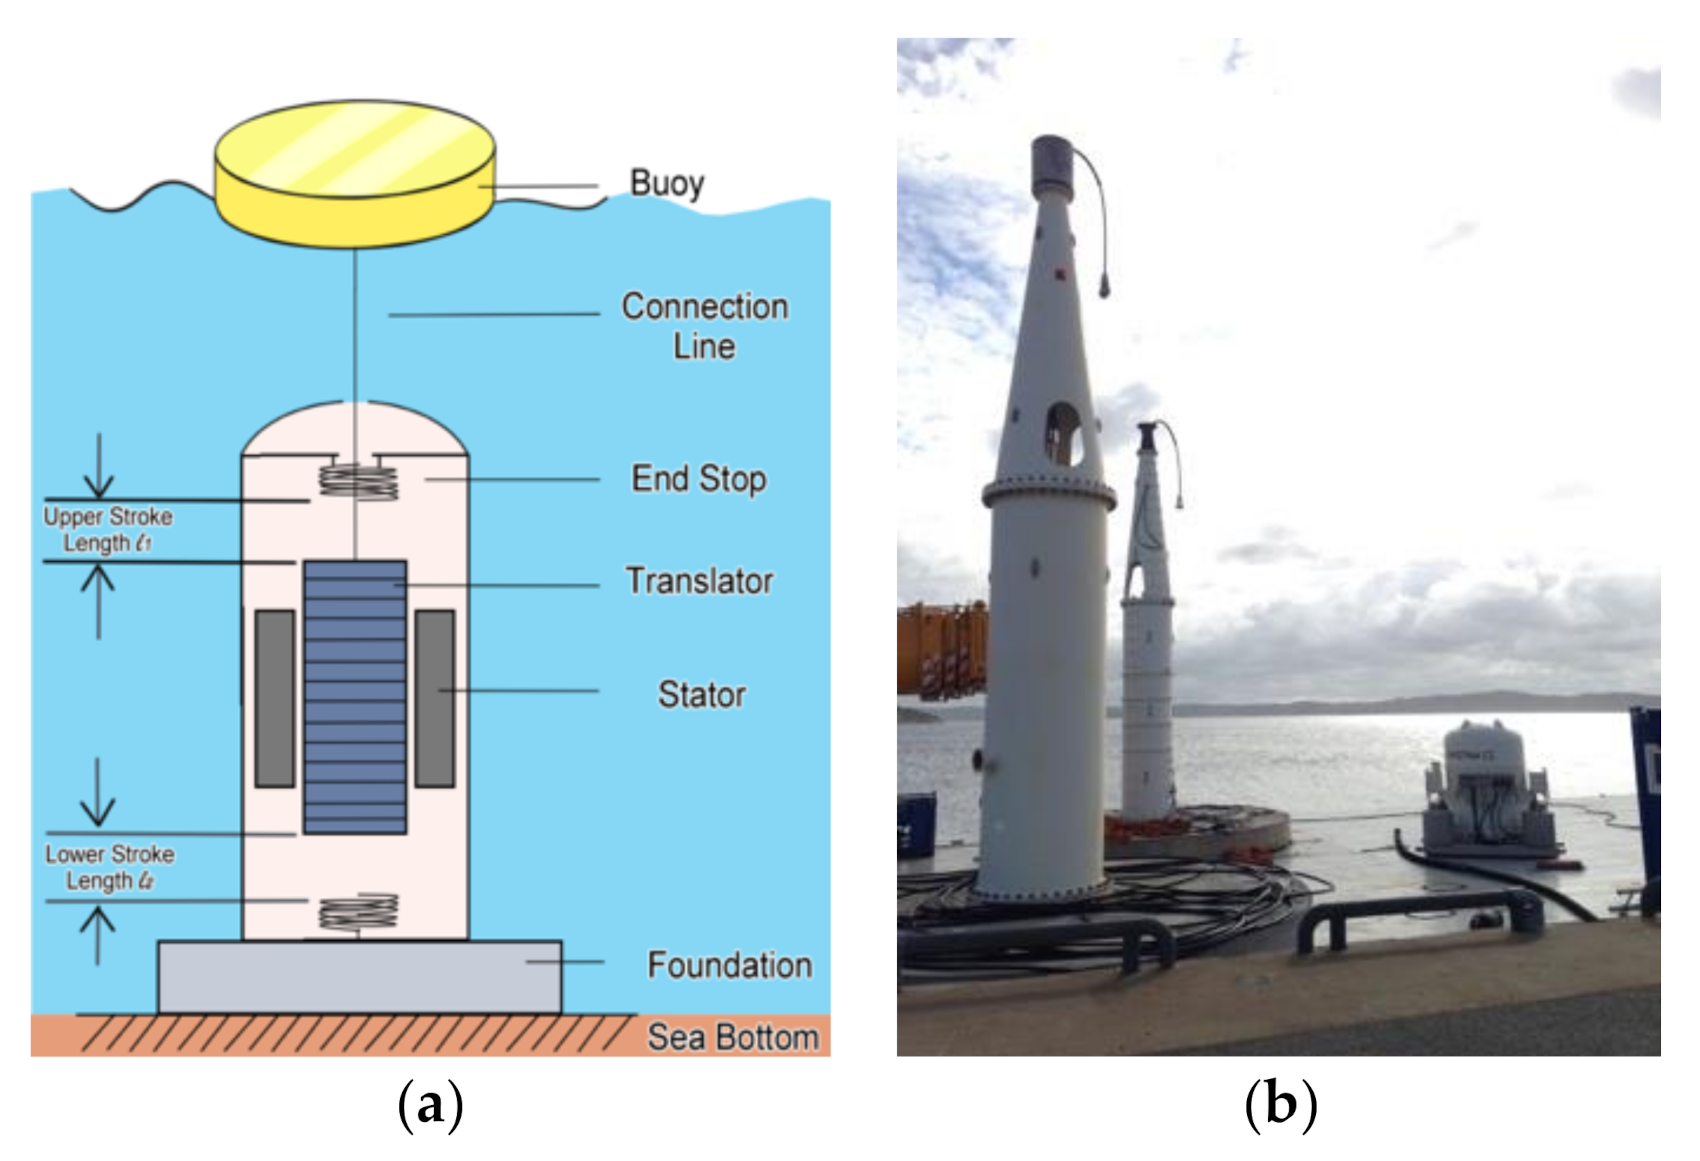
4.1. Wave Energy Converter (WEC) Model
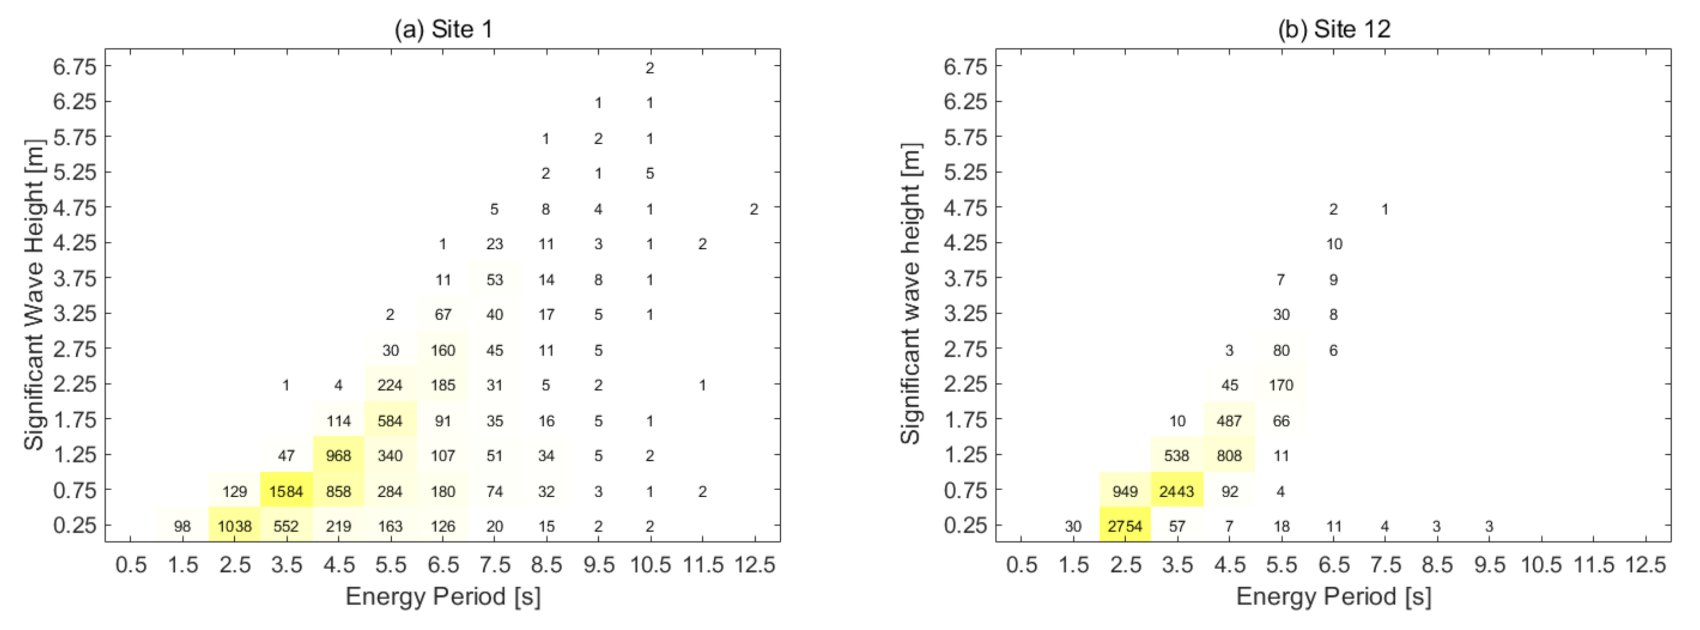
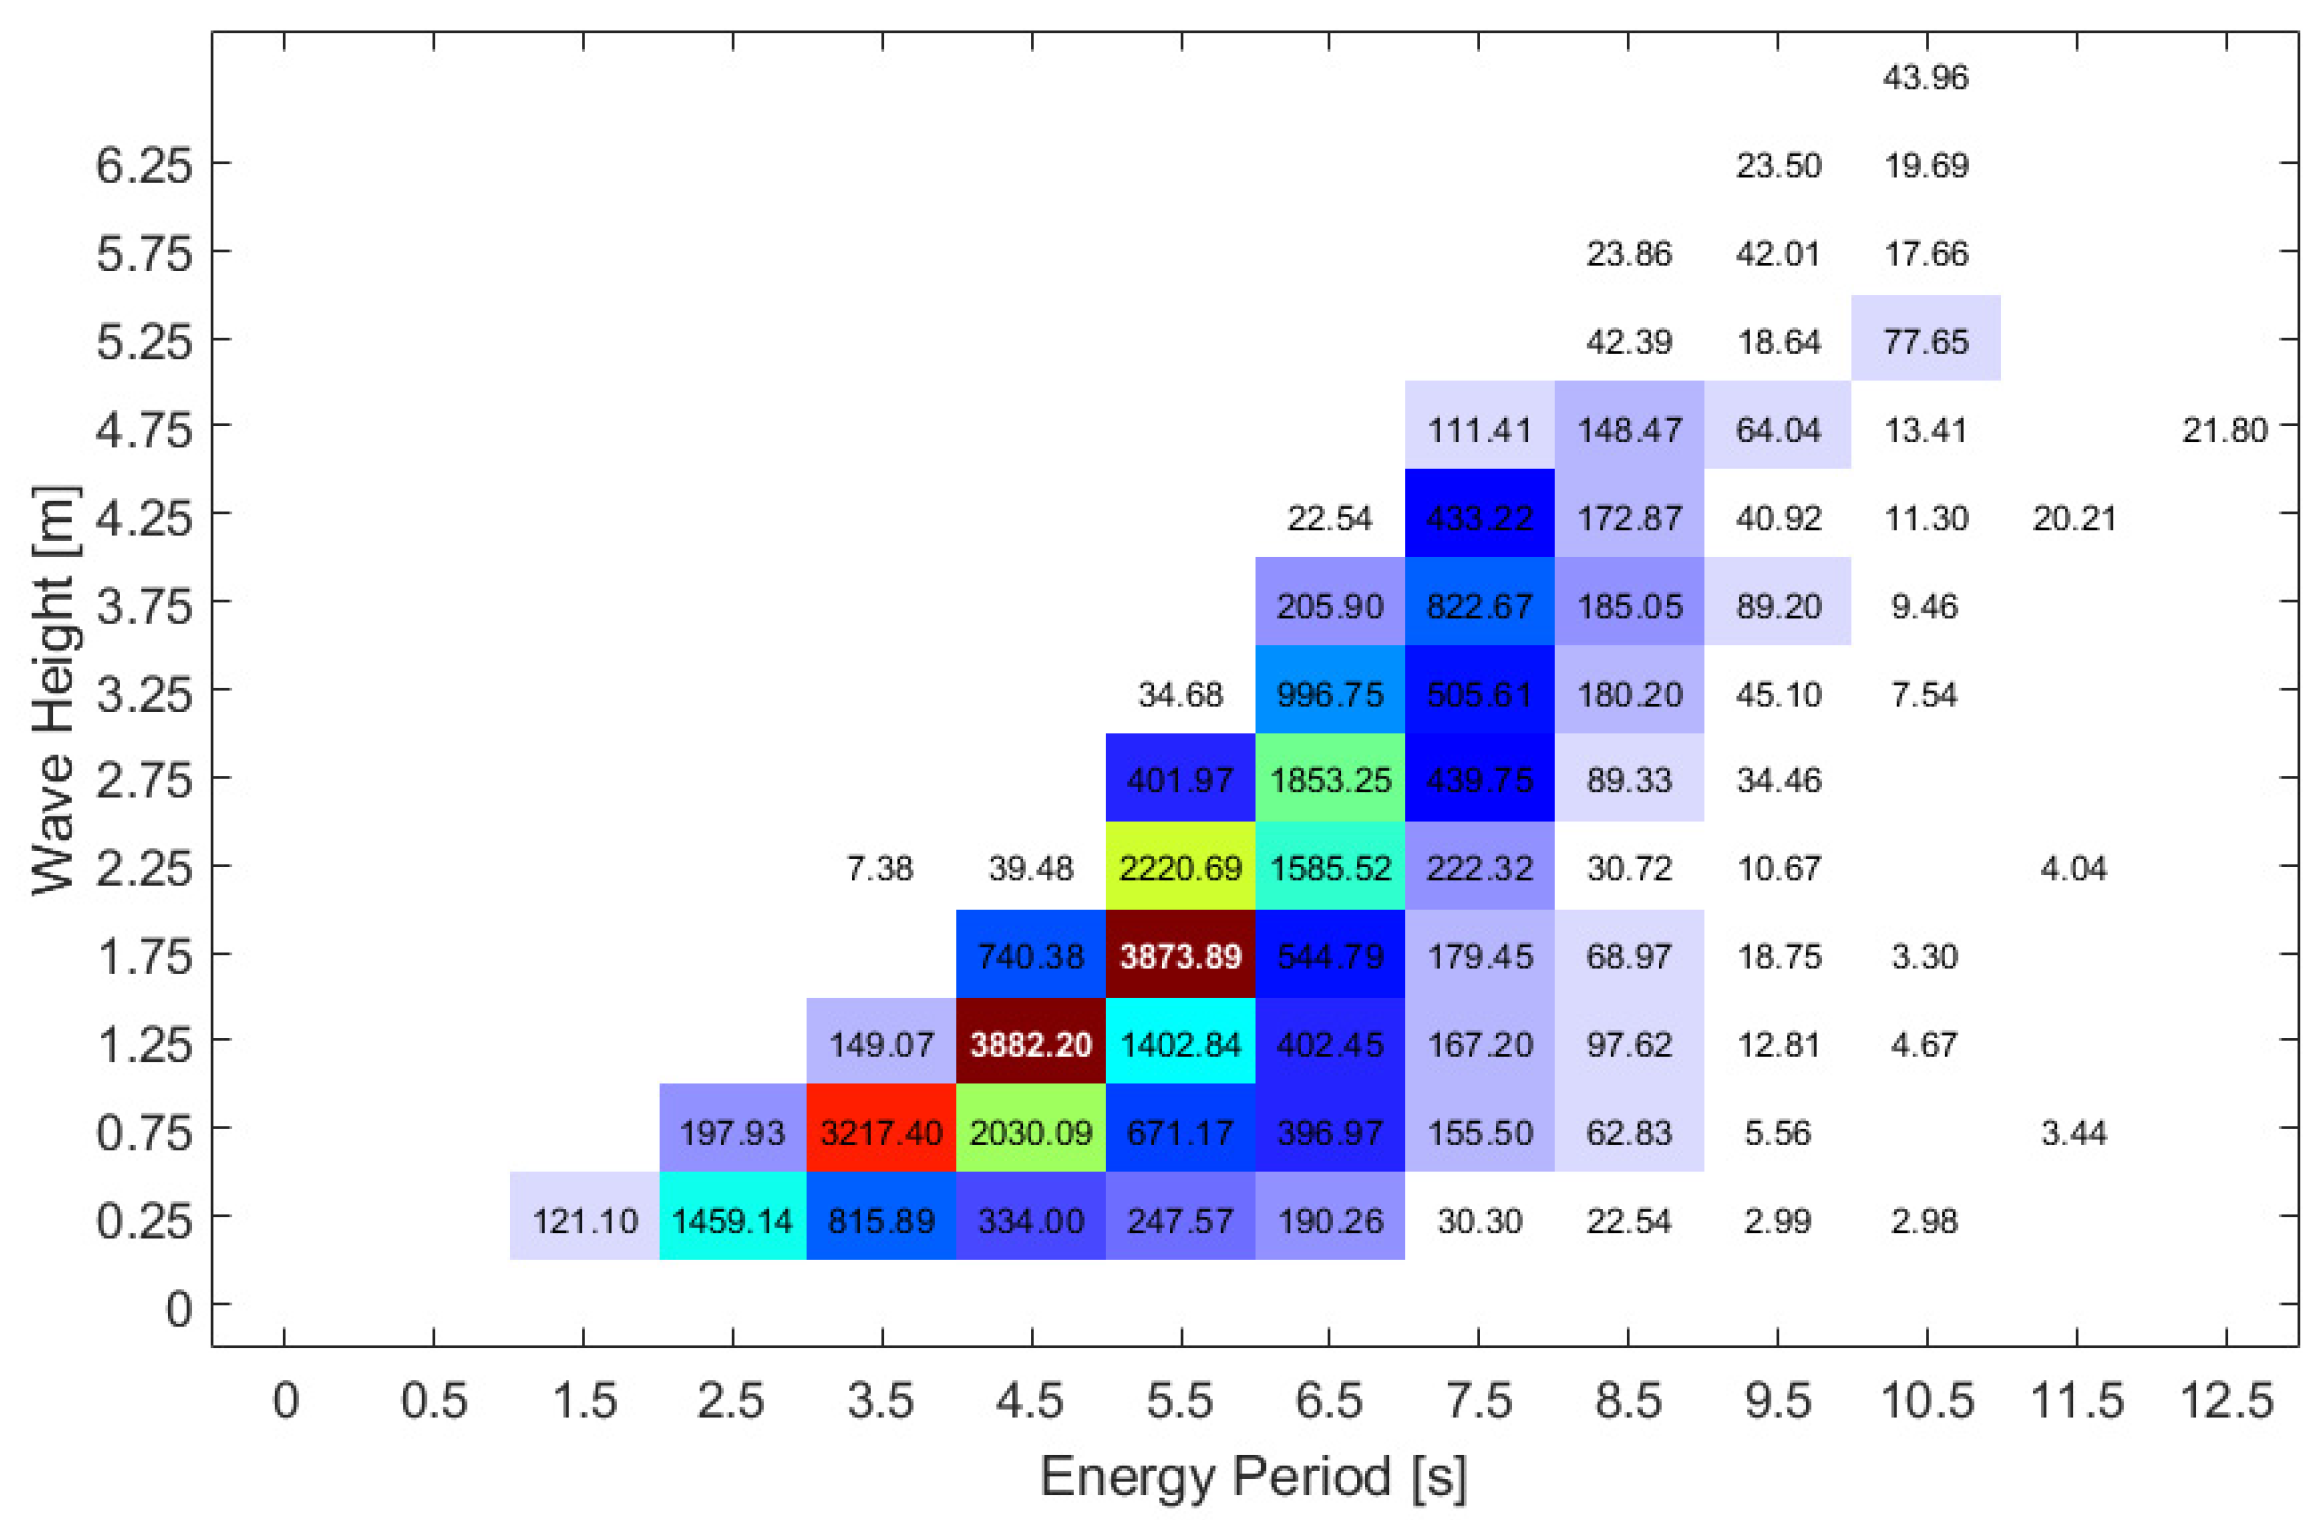
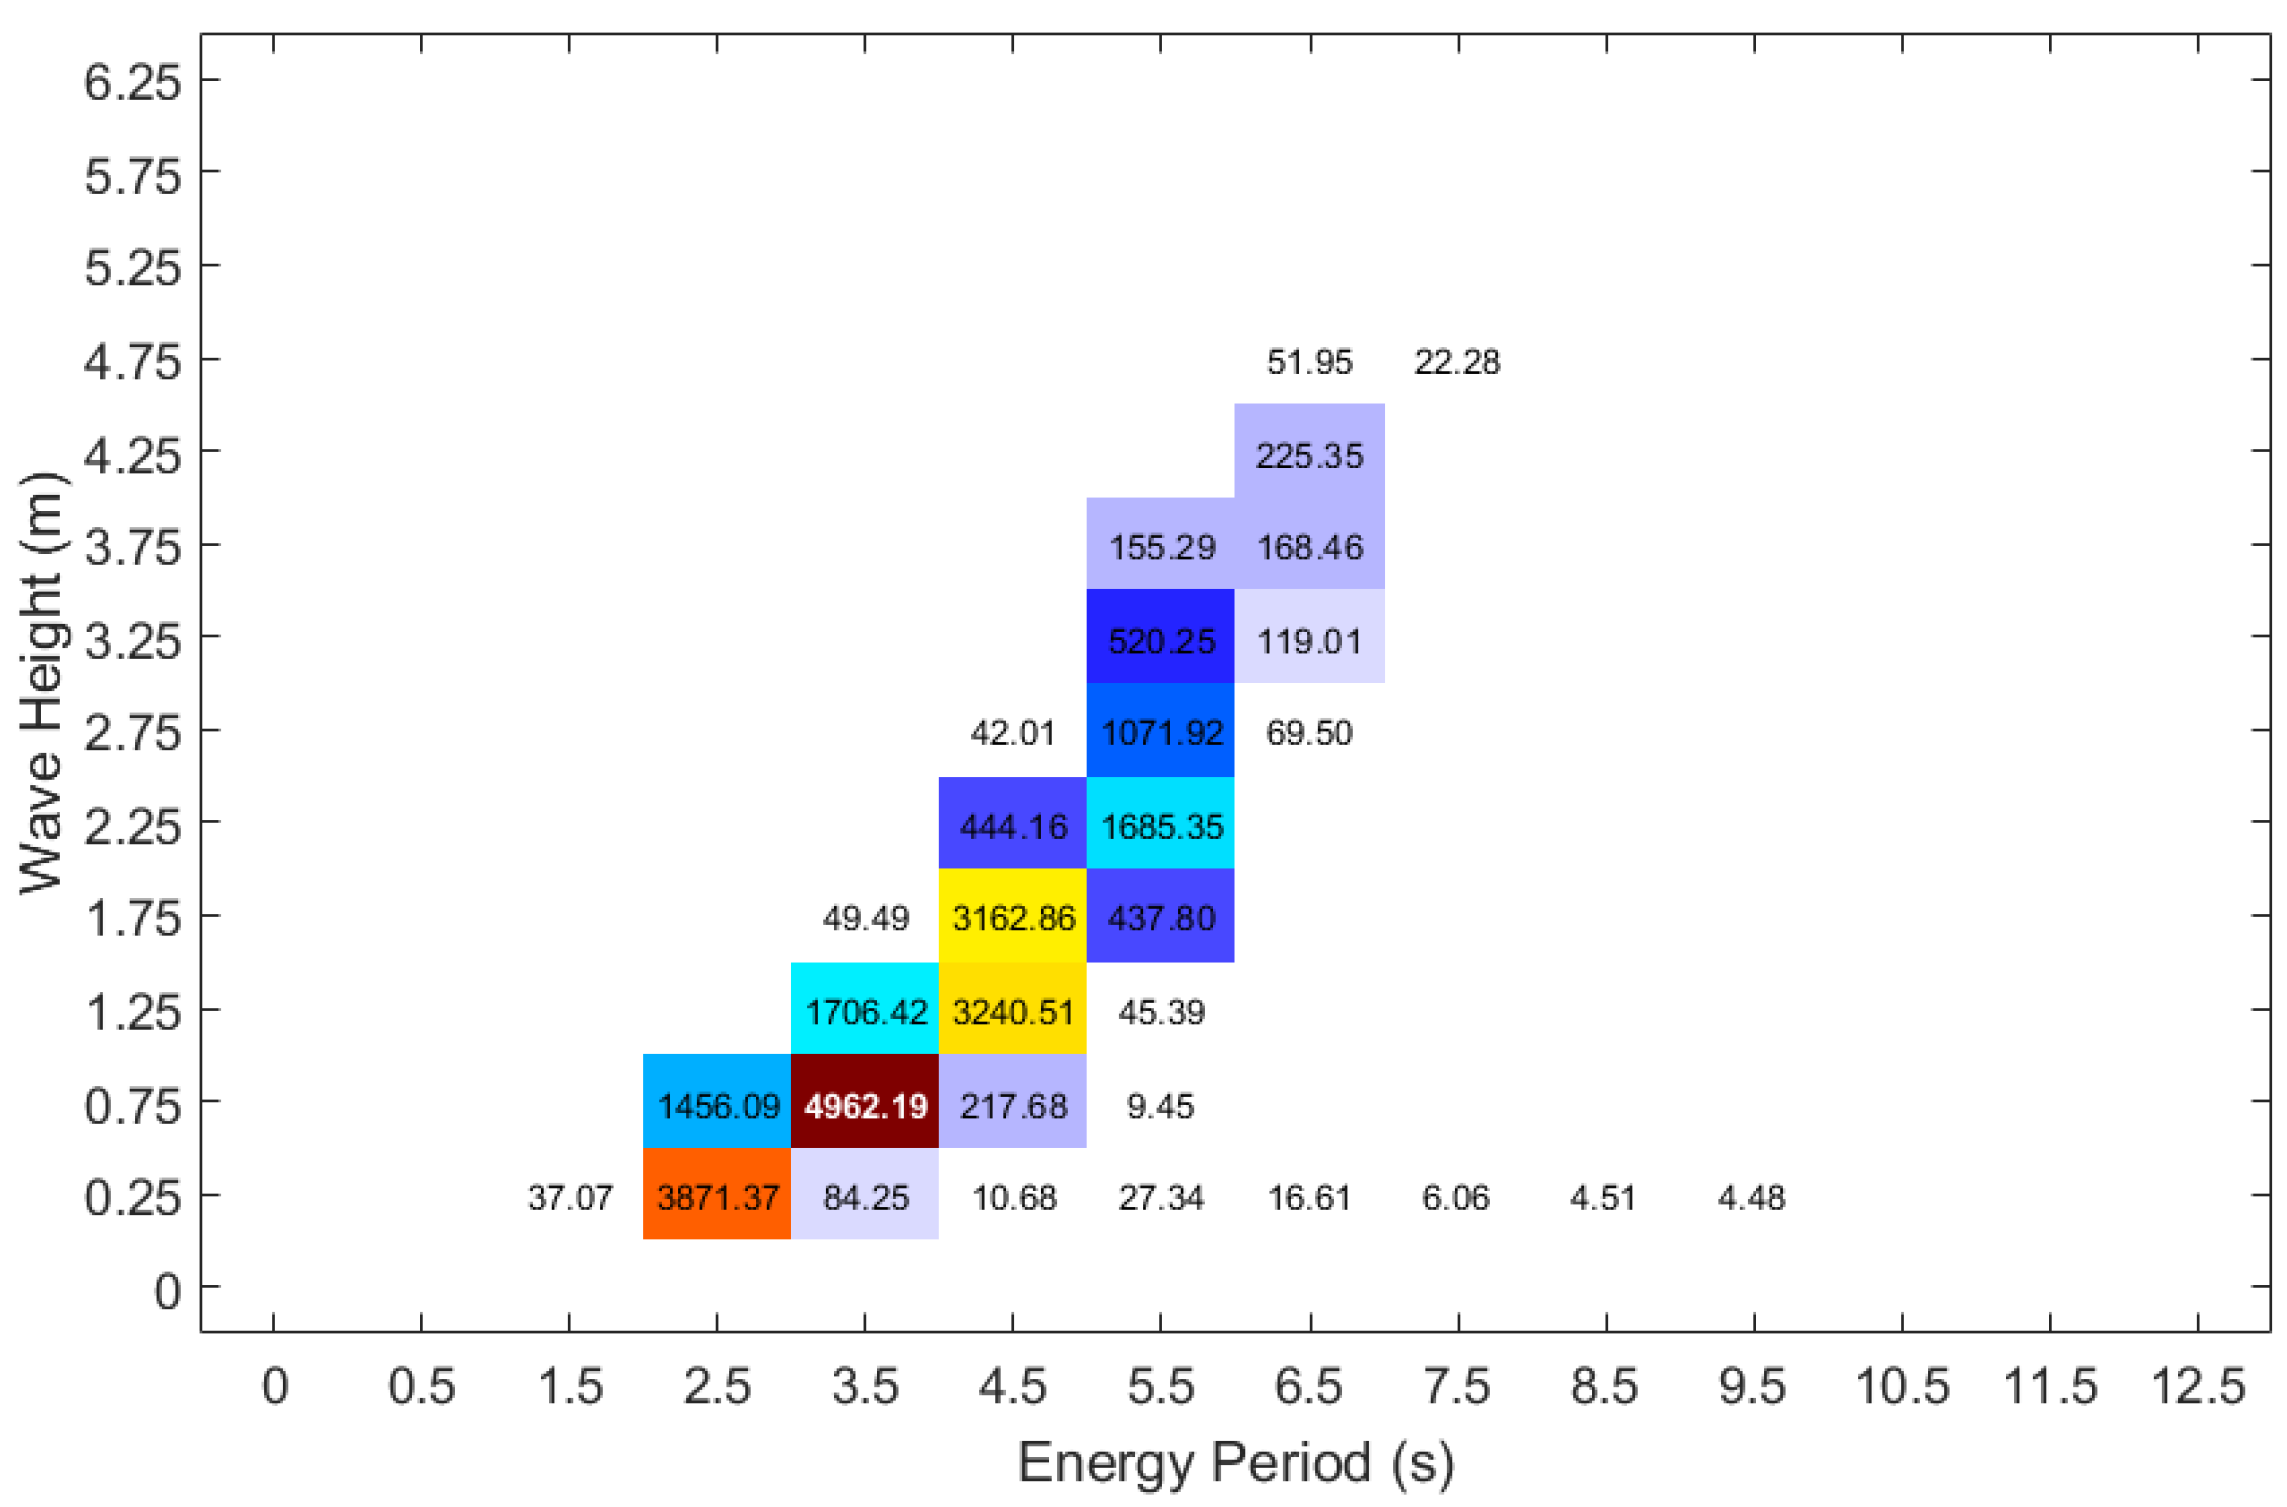
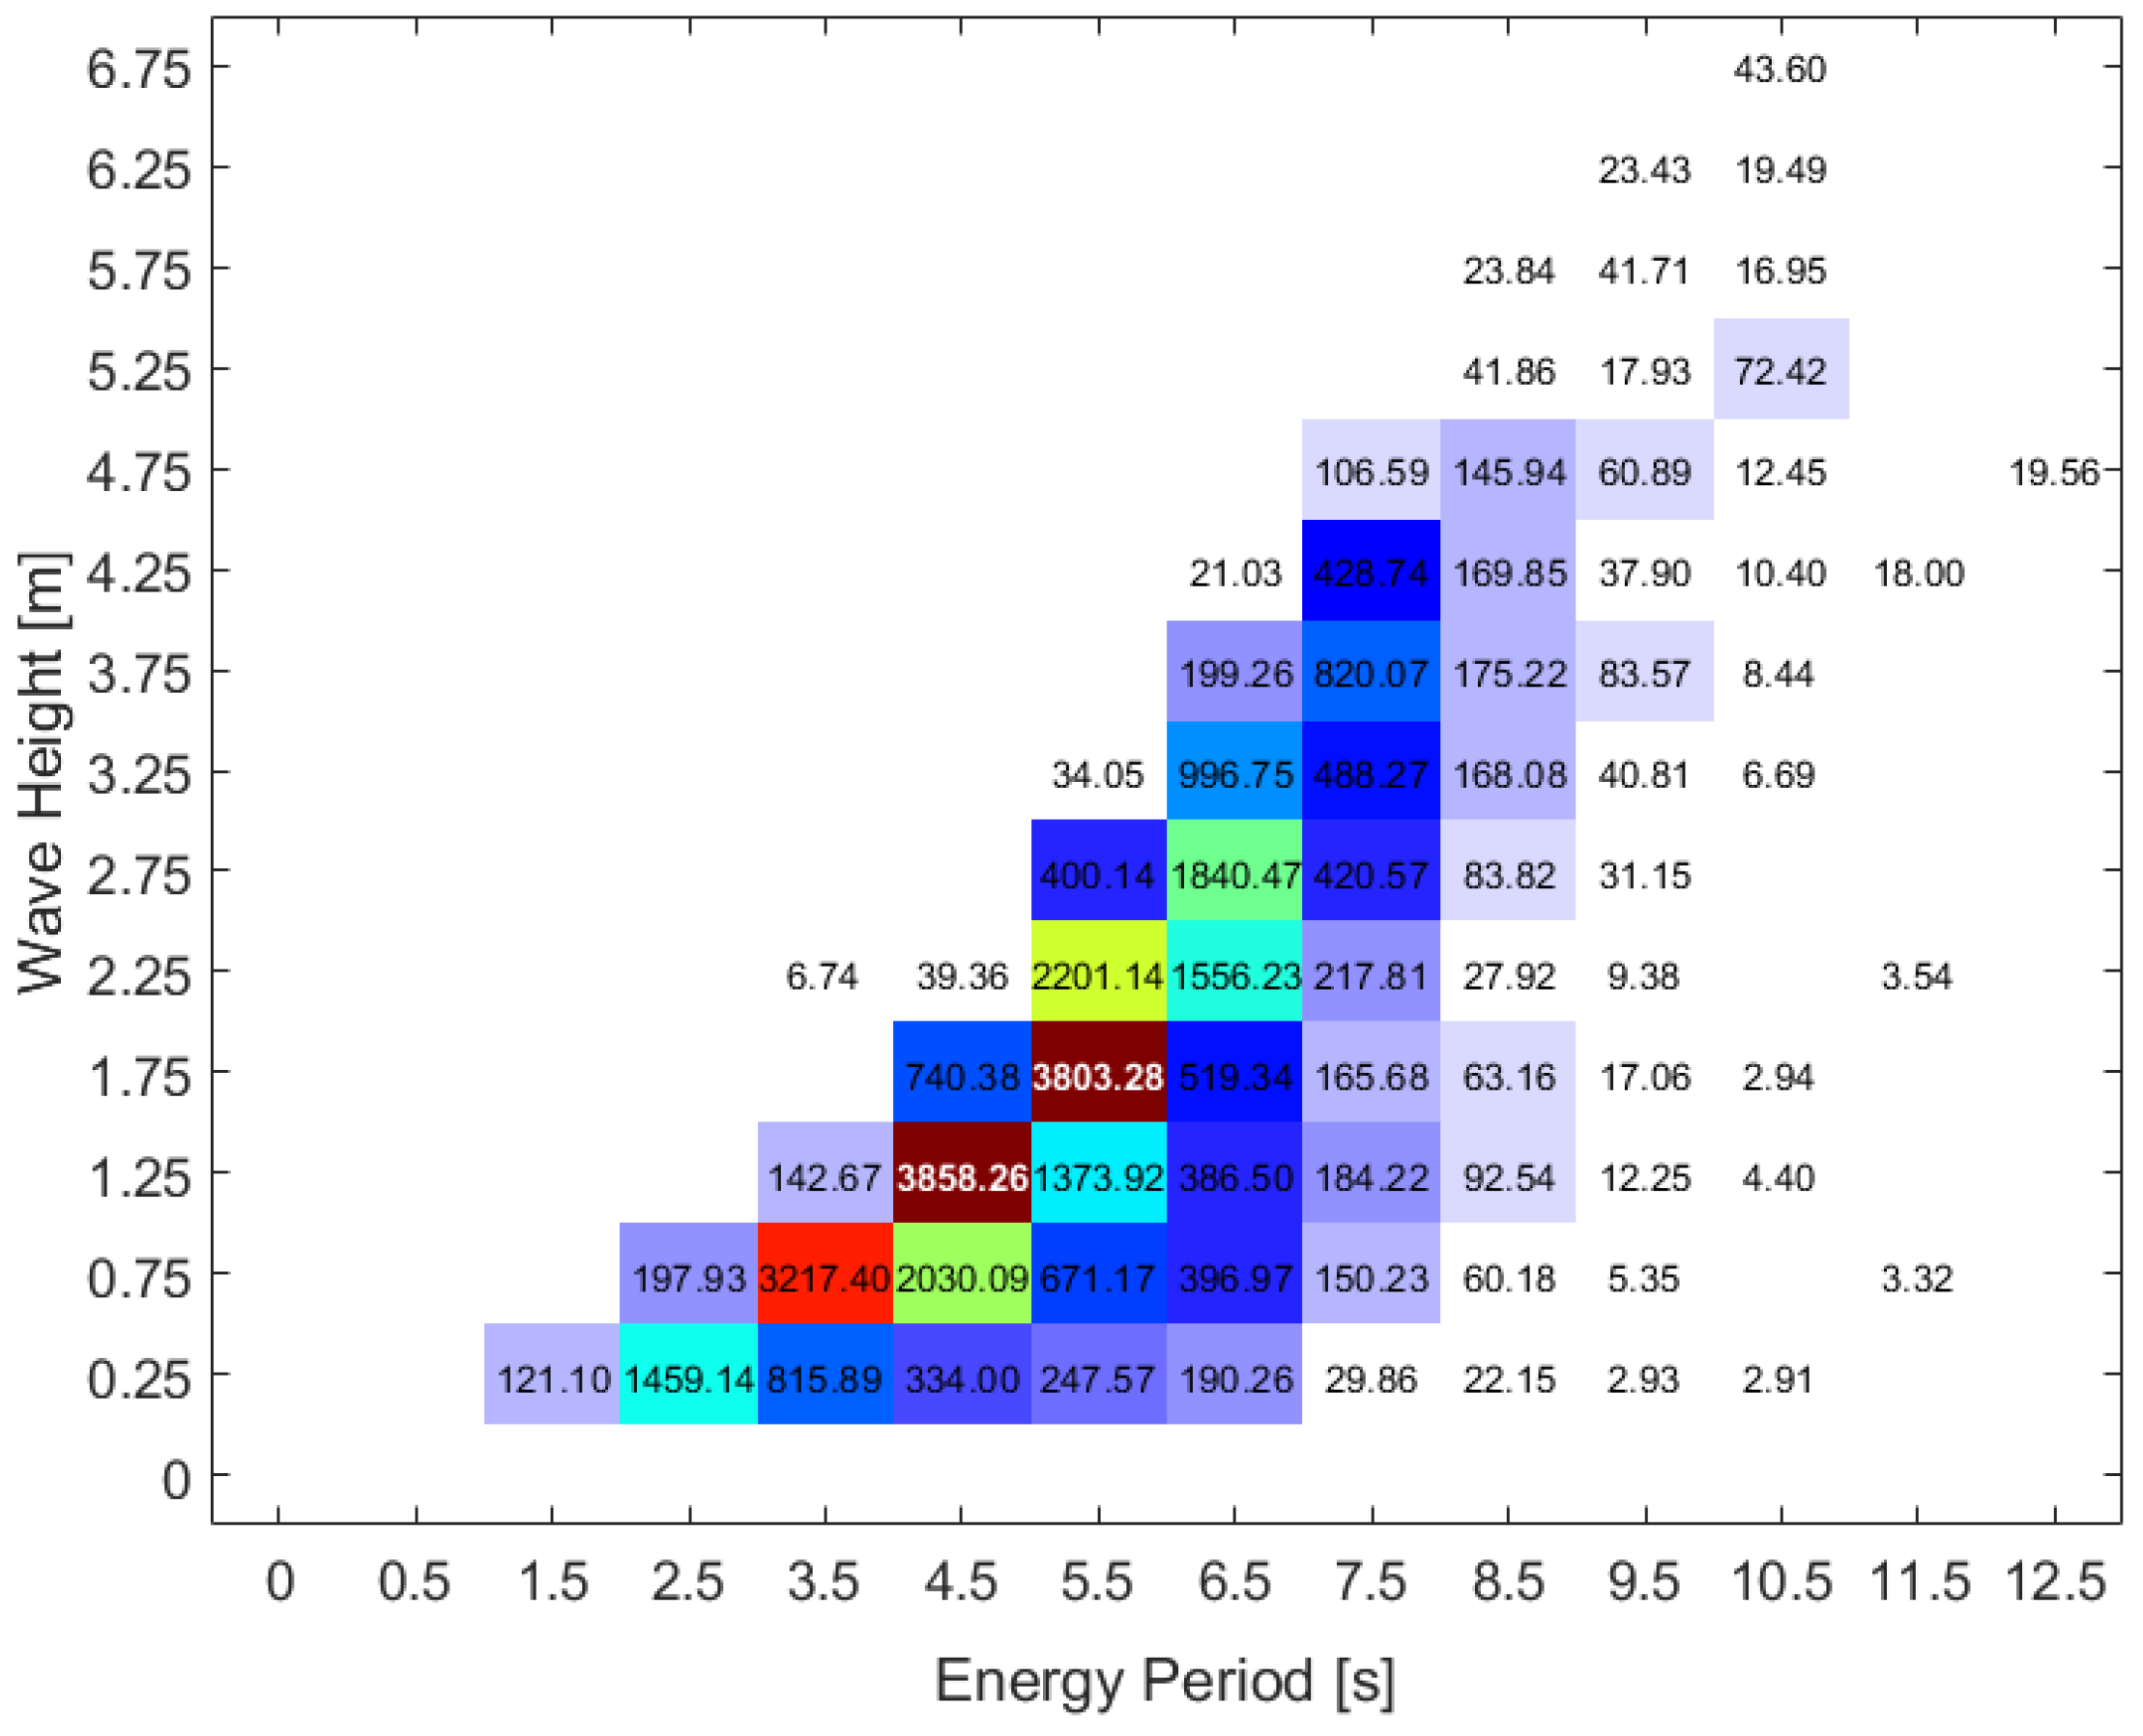
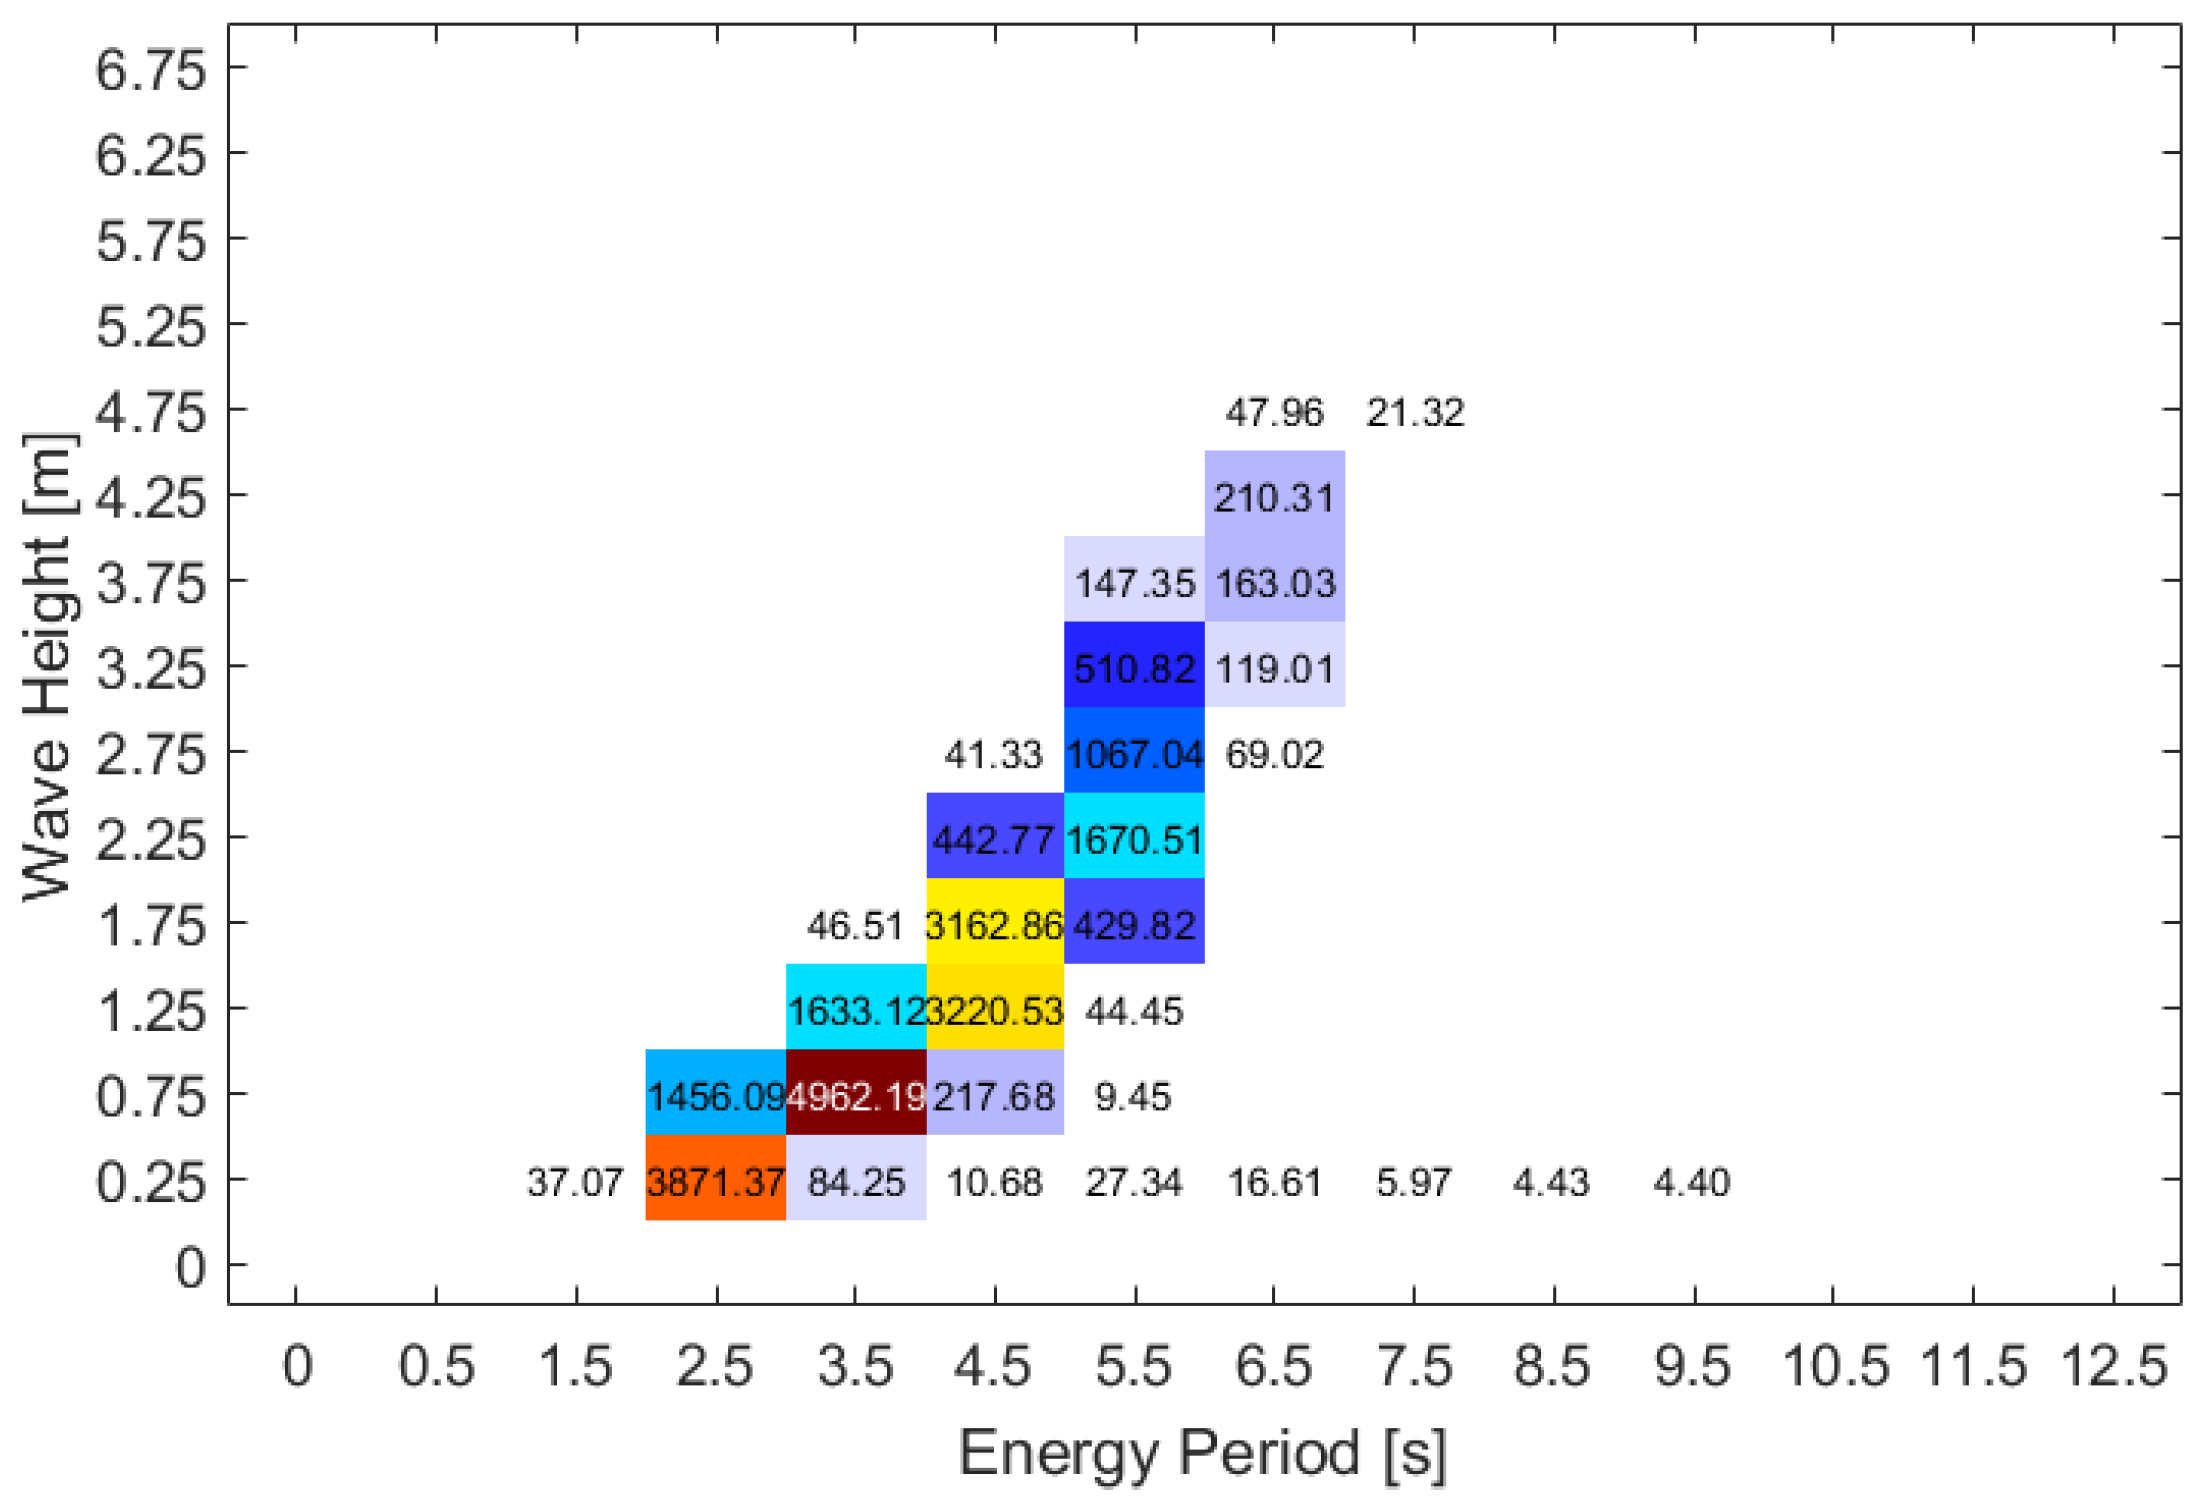
The numerical model of the WEC was implemented in MATLAB. The WEC model consisted of two sub-models: a hydrodynamic model, and a linear generator model. This research mainly concerns the hydrodynamics and generator model, based on which the damping coefficient of the generator was further studied with various sea states. Table 1 provides the WEC parameters applied in the model. The parameters were based on the prototype of WEC L9 developed in the UU project, with the aim to study and propose an optimized choice for future mechanical designs [12].

4.2. Wave Climates

Wave climates at two sites were utilized to investigate the performance of the WEC. The sites are both located off the Swedish west coast and were named Site 1 and Site 12 (see Figure 2a for site locations). Site 1 is located in Skagerrak of the North Sea, which is close to Norway, and Site 12 is located in Kattegat of the North Sea near Denmark. The wave climate at Site 1 has more variations than the wave climate at Site 12. Scatter diagrams with the occurrence of sea states for the sites are both listed in Figure 4, which were used as the wave sources for the WEC modeling. The reason these two sites were chosen was to observe the different impacts from the wave climates on the WEC’s energy production [38].
Wave data at the test sites (and the other two sites, marked in Figure 2a) were obtained from Fugro OCEANOR AS of Norway [40], as displayed in Figure 4. The data were collected in time series with one half hour of every six hours lasting for eight years through the combined methods of an on-site wave-buoy, satellites, and the SWAN model. A frequency analysis was applied to the statistics of annual occurrence for each sea state, giving an estimation of the energy density distribution for the test sites. The wave source was applied as an excitation to drive the numerical WEC model; this is detailed in a later section of this paper.
In this study, the Bretschneider spectrum [41] was applied as an empirical approach to describe the ocean waves, providing a source for irregular waves for the numerical model. Accordingly, the spectrum is defined as:
S B S ω = 5 16 ω m 4 ω 5 H s 2 e 5 ω m 4 / 4 ω 4
where ω denotes the angular frequency and ω m is the modal frequency for any given wave. Figure 5 presents an example of the Bretschneider spectrum later utilized for the case study.

4.3. Research Methods

In this study, the modeling procedure was divided into five steps. They represent five different ongoing research aims.
Step 1: A numerical model based on the PMLG WEC was developed and verified with the experimental data from sea trials. Part of the verification was published in [41], and an additional error analysis was made in this paper.
Step 2: Power profiles of the PMLG-based WEC was first obtained under different wave climates, aiming to observe the interaction between WEC’s performance and sea states. Five cases of energy period were chosen, which all represent the normal and abnormal cases for the sea states at the test sites, respectively. The overall 4 × 4 combination of comparison was carried out. Furthermore, a three-dimensional power distribution was attained according to a scatter matrix of sea states varying from 0 to 12.5 s by energy period and 0 to 6.75 m by significant wave height.
Step 3: Observation was performed on the influence of damping coefficient toward the WEC’s power production, in order to track the optimal damping coefficient, which contributes to maximum power production.
Step 4: Annual energy production was estimated under the wave climates at research sites. For each sea state, the corresponding optimal damping coefficient was obtained and analyzed. Subsequently, two research sites were chosen to investigate the different results of energy production.
Step 5: Annual energy production was estimated when the WEC was implemented under constant damping at the test sites. Constant damping was achieved by setting the damping coefficient to a constant to investigate the average energy production of specific damping states. The investigation was achieved by varying the damping coefficient from 5 to 200 kNs/m with an interval of 5 kNs/m. The results were further compared with those of optimal control. It is worth noting that the optimal control method either mechanically or electrically on the generator was not studied. Relevant studies will be performed in the future.

5. Results and Discussion

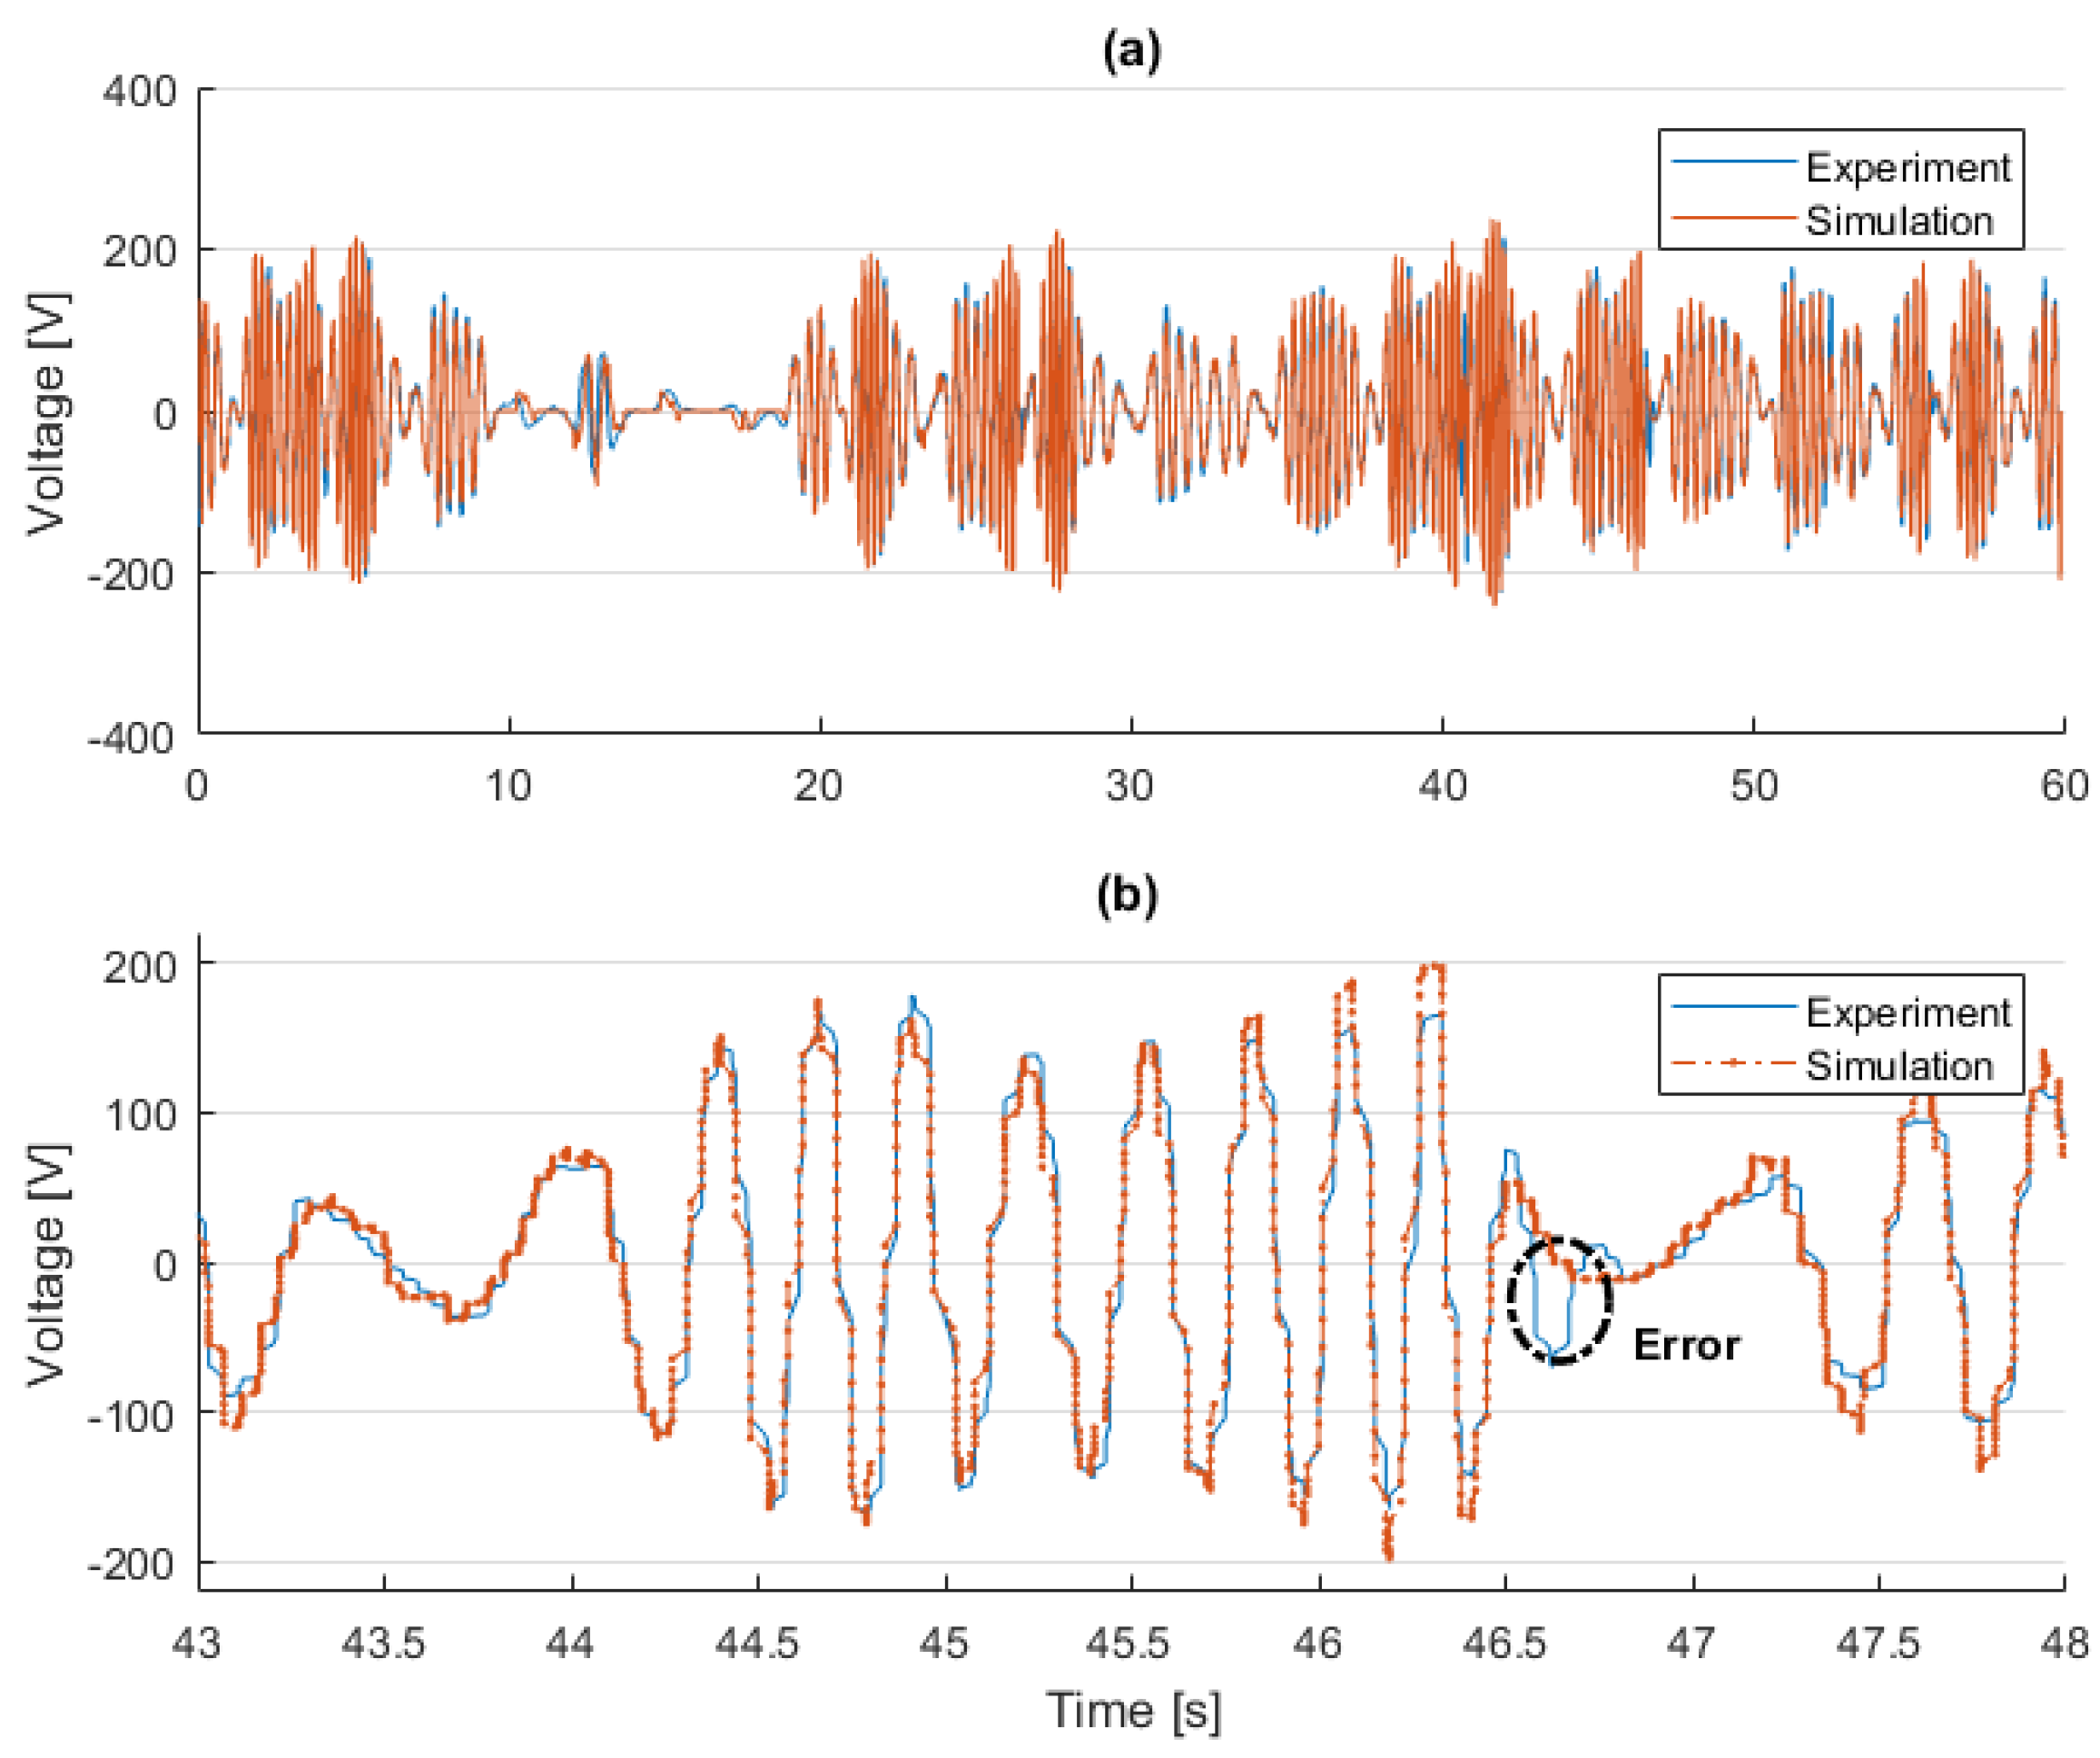
5.1. Model Verification

The numerical modeling on the WEC was performed with a duration of 60 s. The simulated voltage on phase A was collected and compared with the experimental results from the WEC prototype in the sea trial, depicted in Figure 6.
The comparison in Figure 6a and the draw-out in Figure 6b demonstrates how the simulated results matched the test results. We observed that the simulated results matched quite well with the experimental voltage, regardless of the few errors that occurred at zero-crossing. The results of verification on the WEC model have already been published in [12] with further error analysis, which are also presented in Table 2. The reason for the reuse here is to support the continued research proposed in this work.

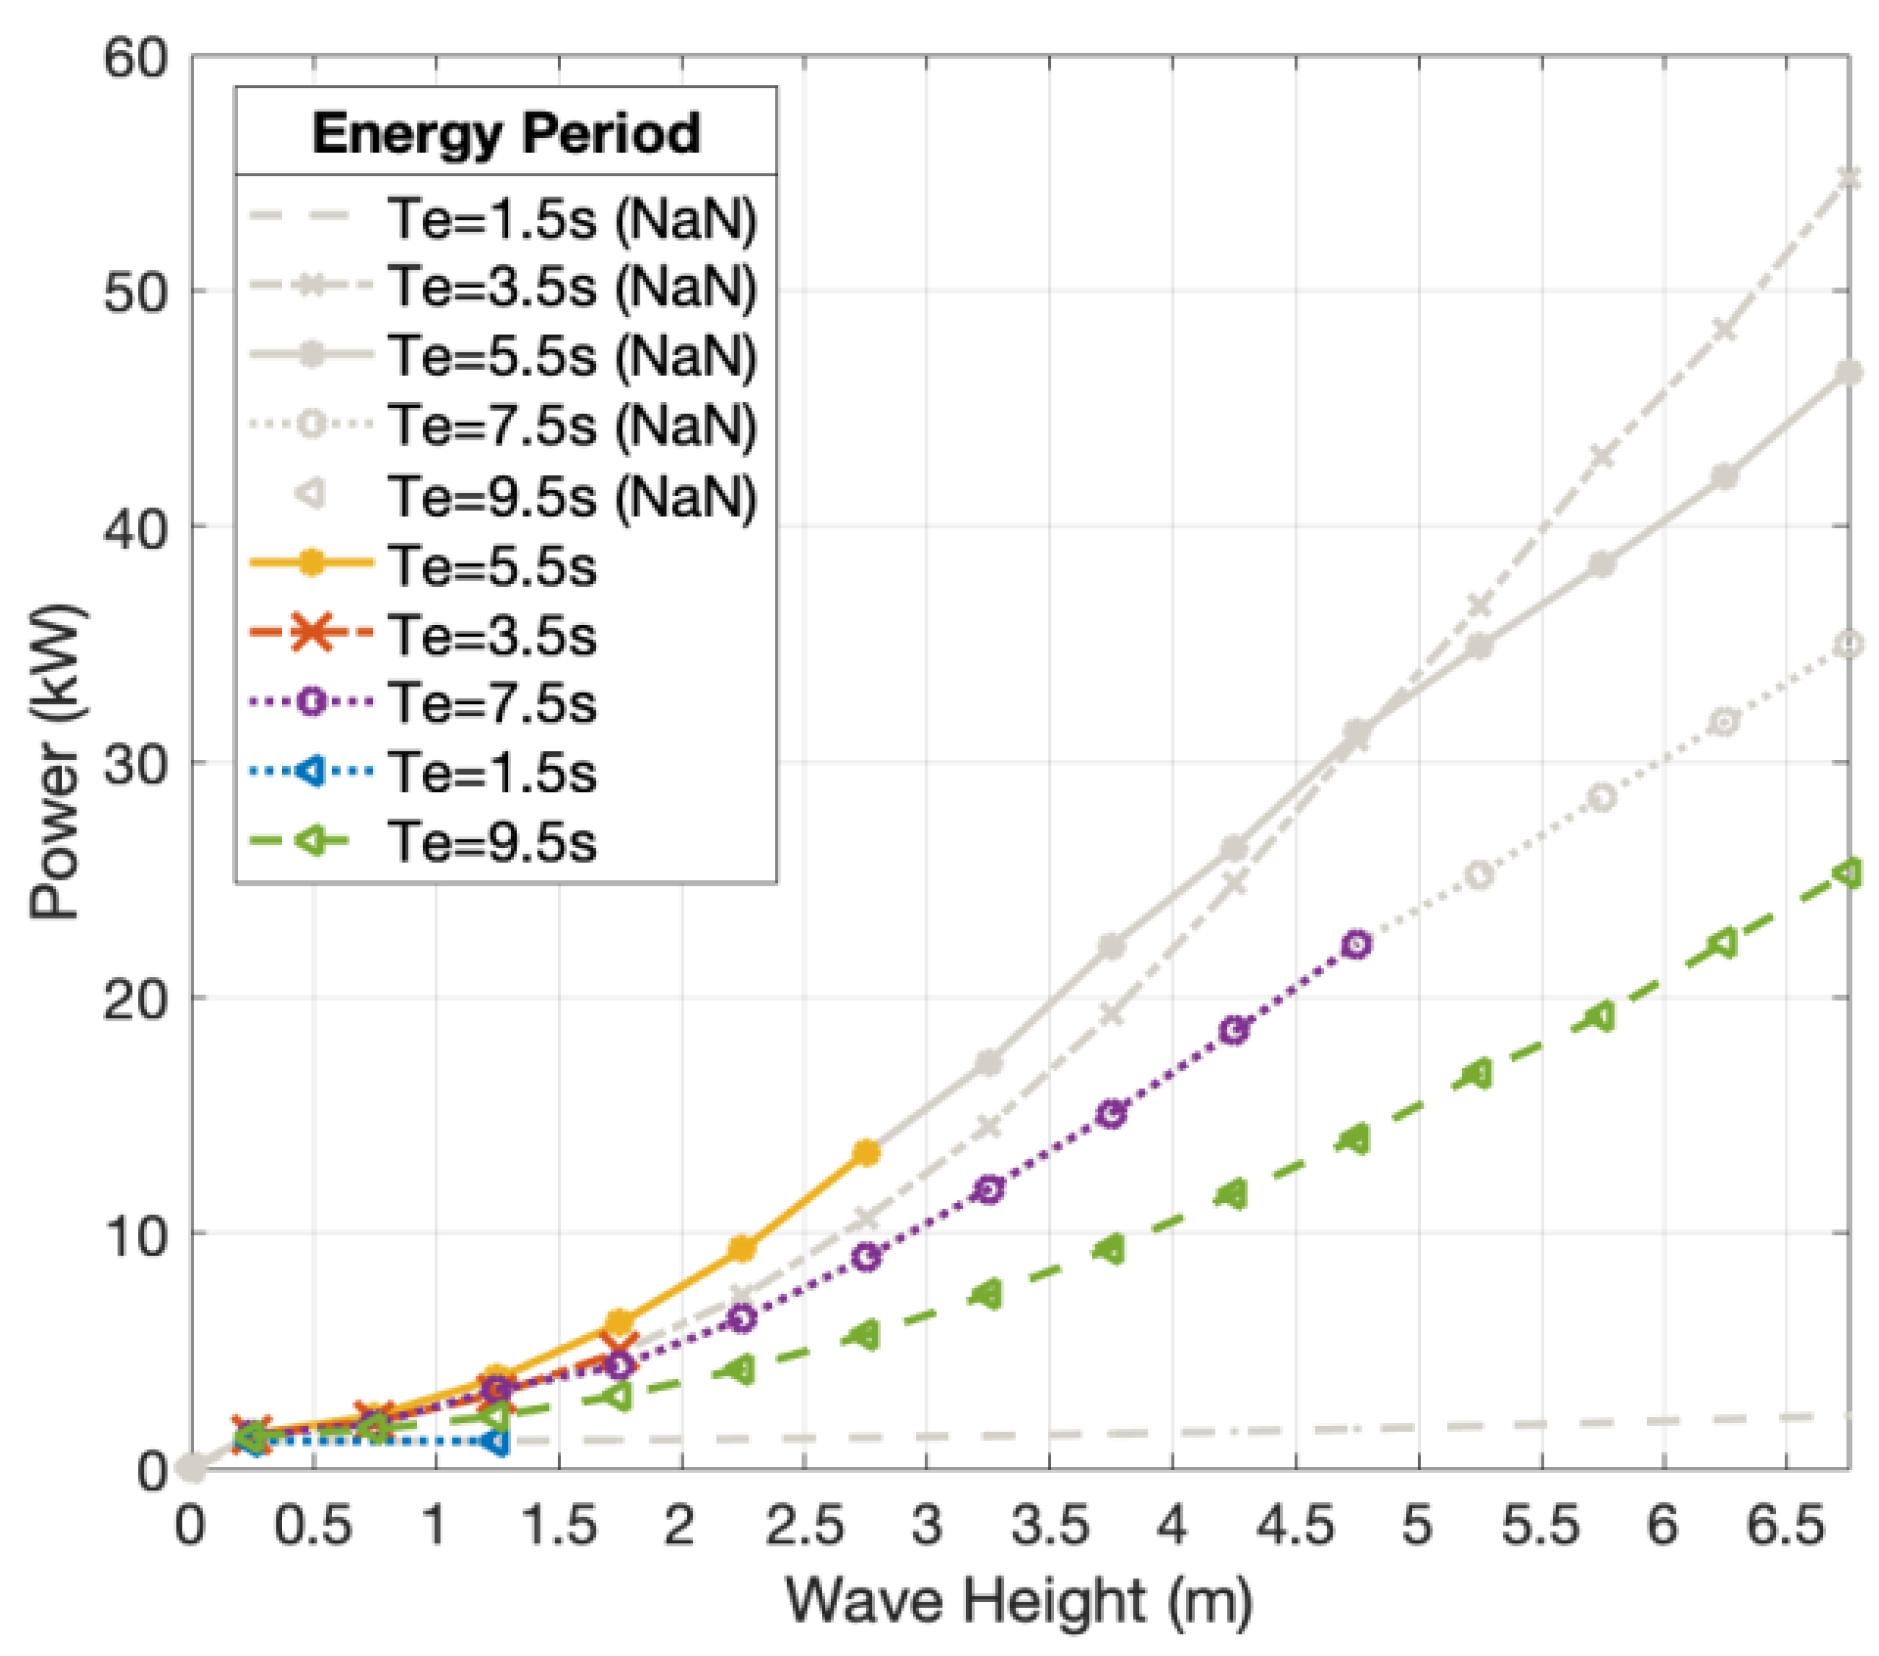
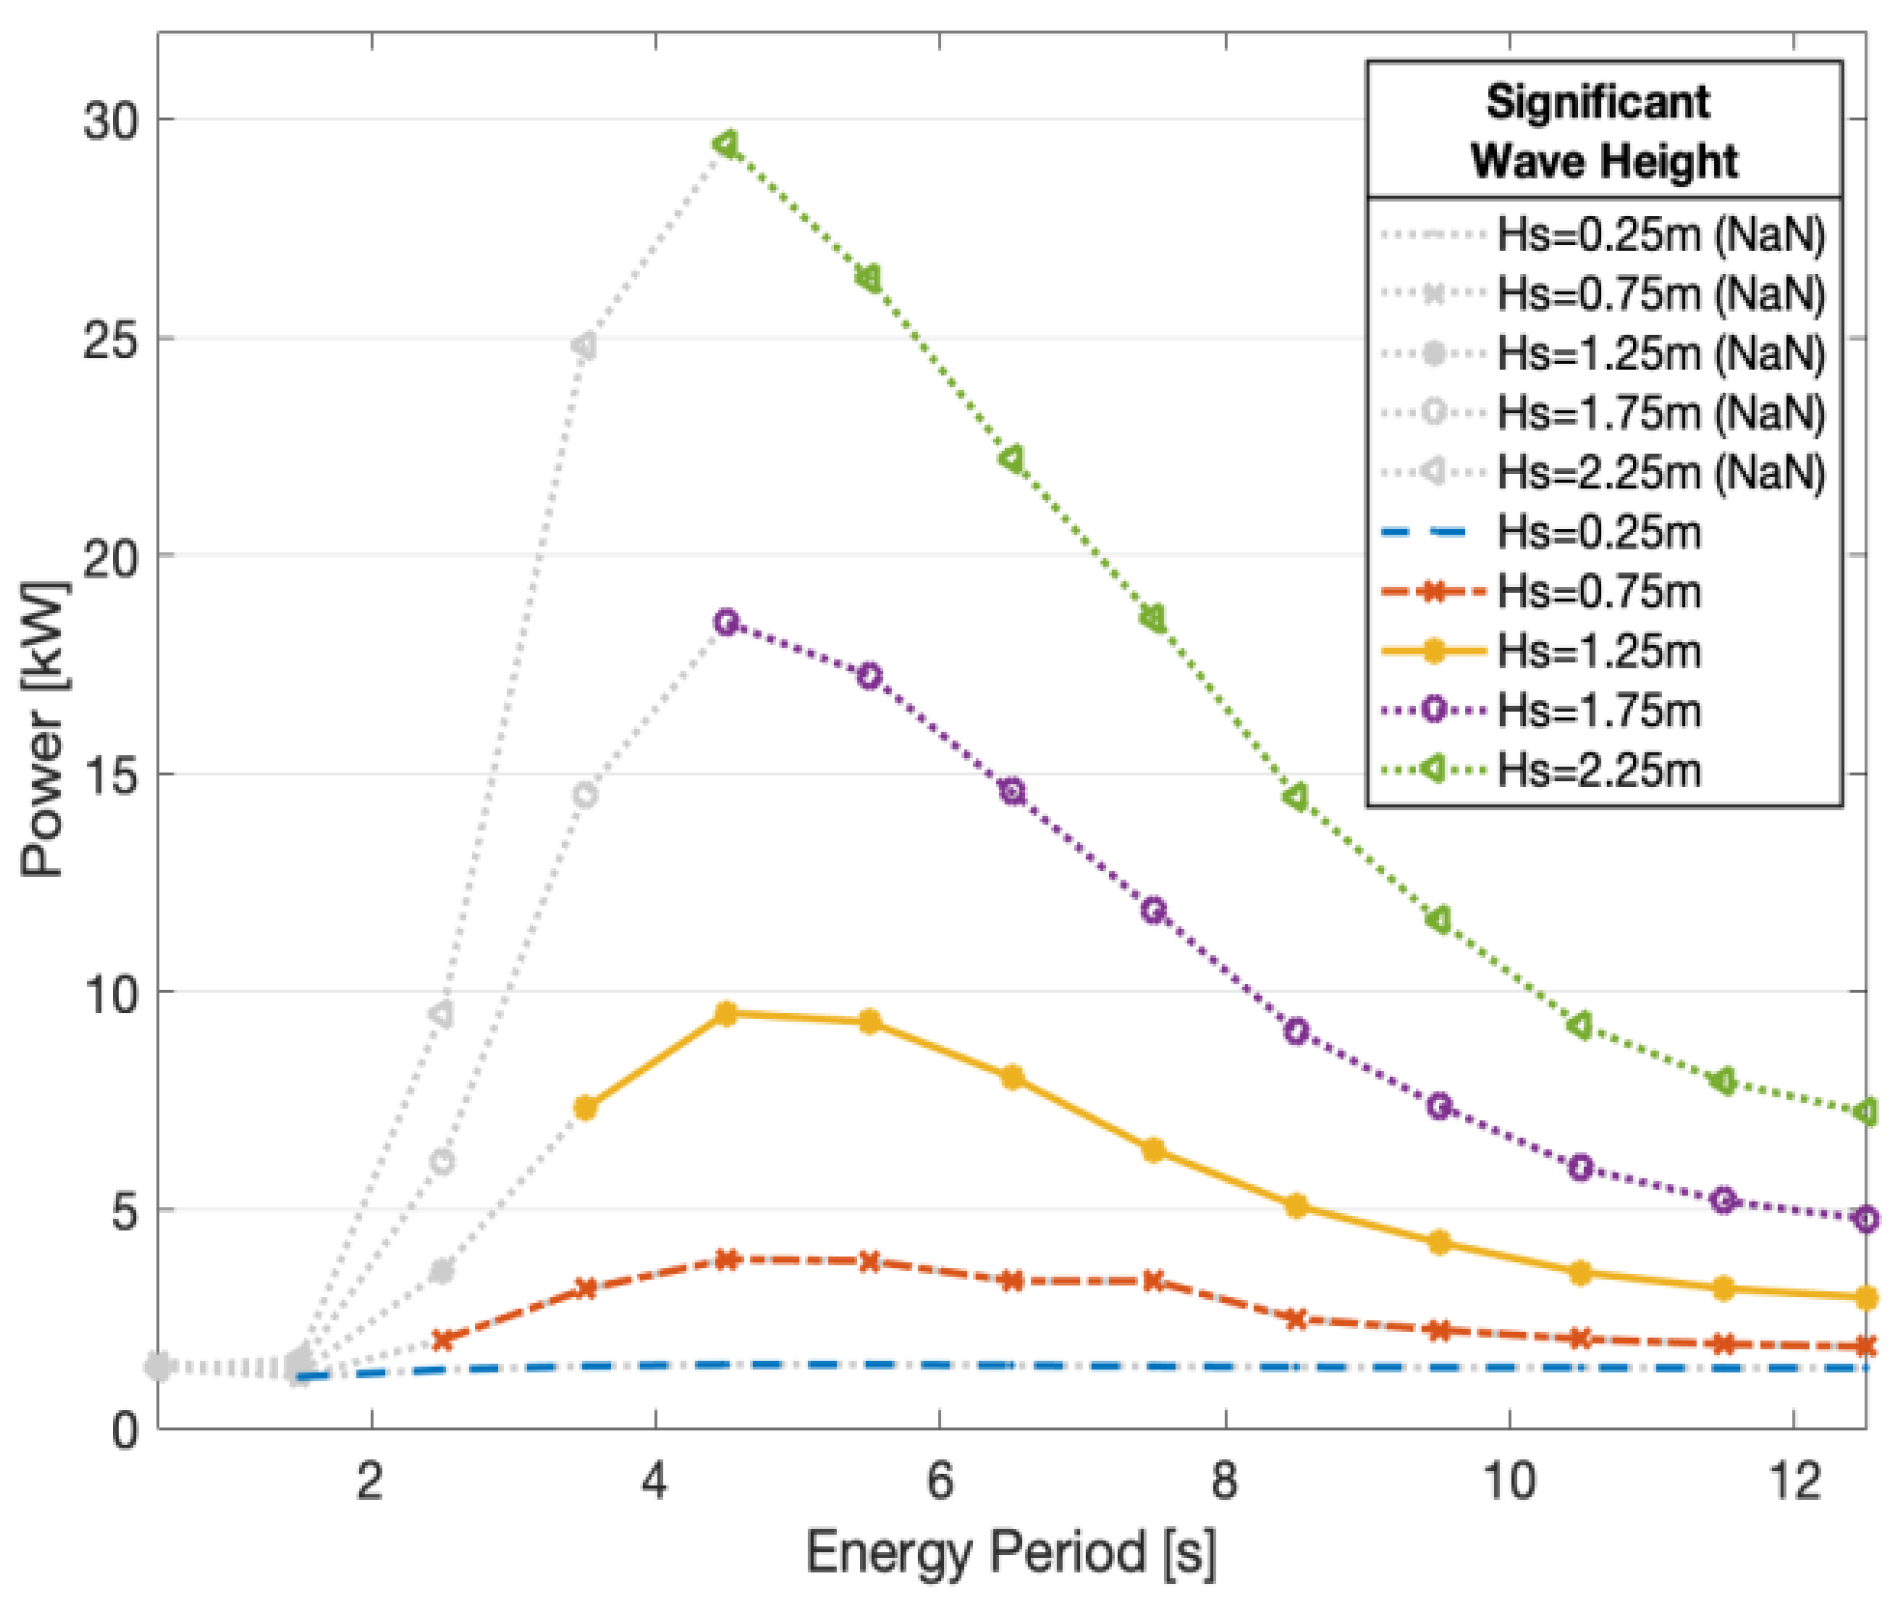
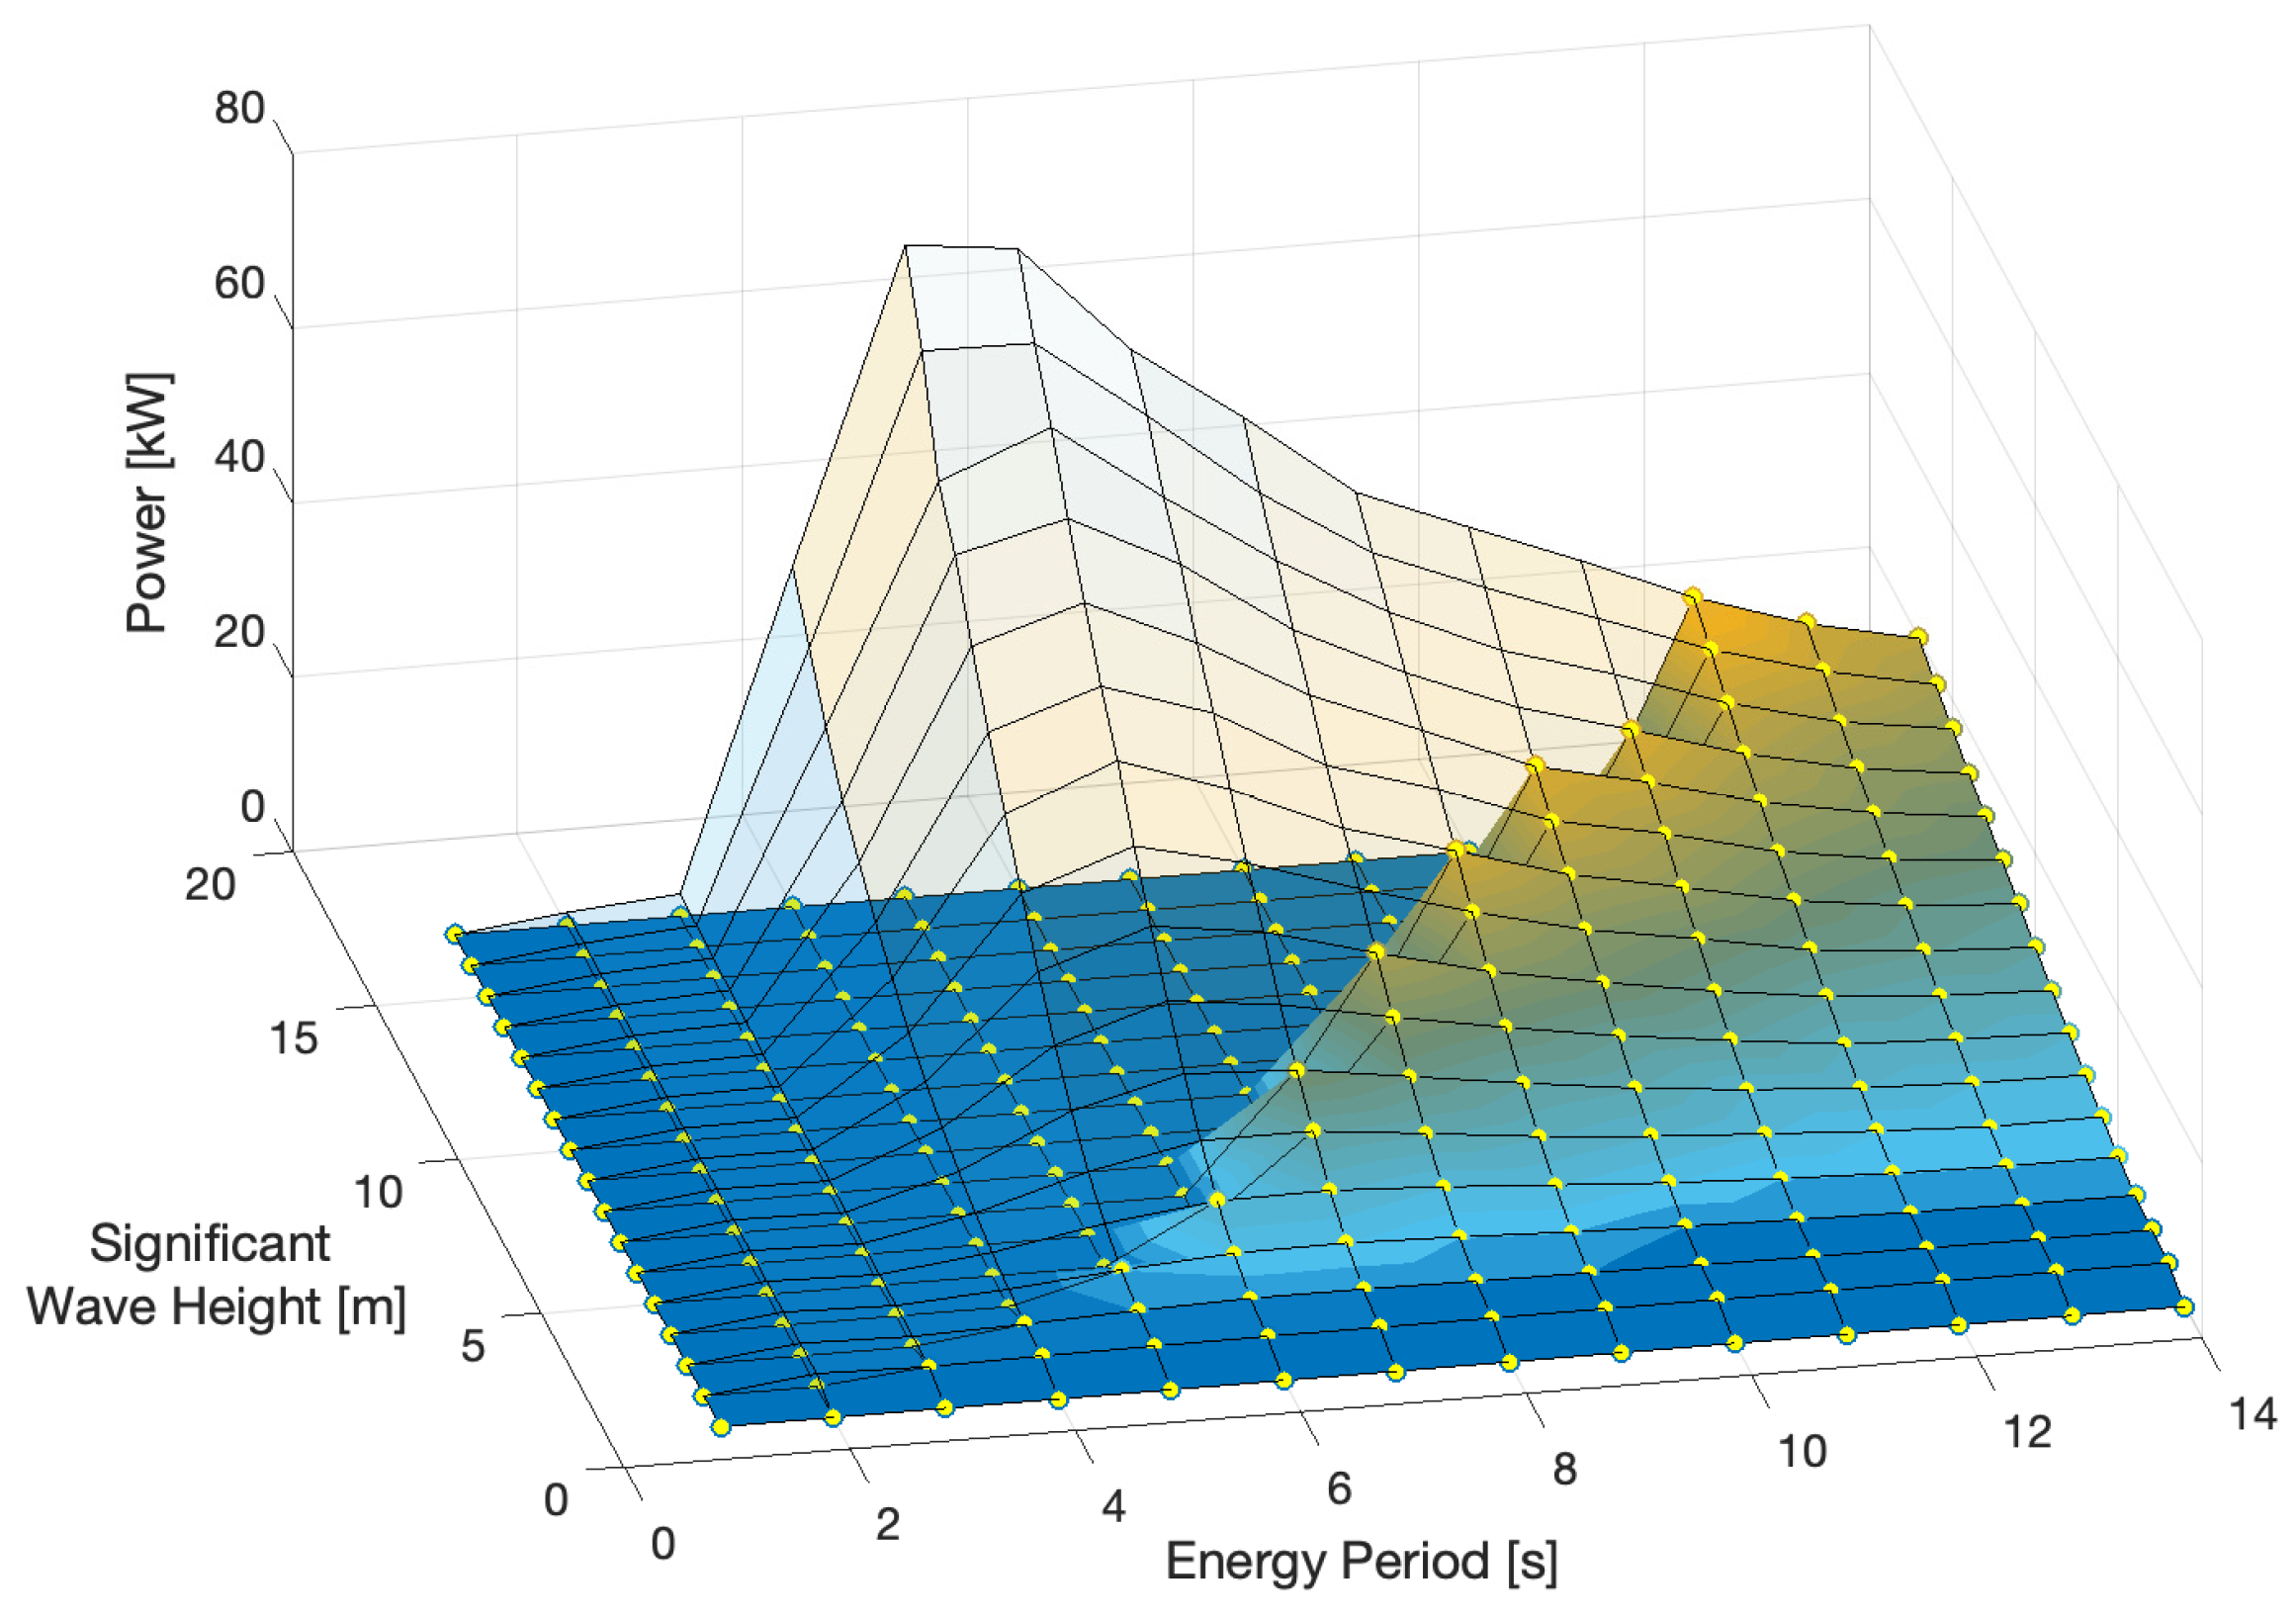
5.2. Generation and the Sea States

The WEC was numerically studied with different sea states to investigate the varying impact of wave climates on the WEC’s power generation. Different cases of energy period and significant wave height were chosen and applied, respectively. In this study, five cases of energy periods (1.5, 3.5, 5.5, 7.5, and 9.5 s) were chosen. Then, power profiles from the WEC were obtained by varying the significant wave height; Figure 7 shows the results.
In Figure 7, the results for all cases indicated a common phenomenon: the power level rises as the significant wave height increases, suggesting that higher wave heights might contribute to higher power production because of the higher energy flux per meter of the wave crest. In terms of Equation (4), this phenomenon can be explained: Based on the idea that if the energy period is kept constant, a higher significant wave height leads to higher wave energy available for the WEC.
However, our results revealed that generated power is not proportional to the energy period. At the premise of a wave height less than 1.75 m for both cases, when Te = 3.5 s and Te = 5.5 s, the observed power was much higher than in the other three cases. In addition, as the significant wave height increases, there are no sea states physically available at Te = 3.5 s, which is because when reaching a specific height, the wave will break into smaller waves due to oceanic hydrodynamics, similar to other cases of energy periods. Moreover, when the significant wave height increases, the power for longer periods exceeds that for a shorter energy period. We observed that for each significant wave height, there exists a specific energy period, leading to maximum power output.
Further investigation was carried out with five cases of significant wave heights (0.25, 0.75, 1.25, 1.75, and 2.25 m) to study the impact from the energy period; Figure 8 presents the results. We also note that there are some sea states not available in real cases, where marked in grey. In Figure 8, a nonlinear change can be observed in power production as significant wave height increased. In addition, for significant wave height Hs = 0.75 m and Hs = 1.25 m, we can observe a maximum power point corresponding to a specific energy period. This phenomenon explains another result revealed in Figure 7; that the power will not be enhanced simply due to a longer energy period. For all cases of the wave height, the power profiles glided after reaching a maximum point.
A three-dimensional power distribution is given in Figure 9 to provide an overview of how average power varies with both significant wave height and energy period. In the figure, the yellow points represent each value in the power matrices corresponding to significant wave height and energy period. Moreover, in Figure 9, the transparent surface reveals the ideally calculated power relating to all combinations of Hs and Te. However, we should note that there are some sea states not physically available in real cases. Hereby, the surface in solid color presents the distribution of power relating to the available sea states occurring in one region.

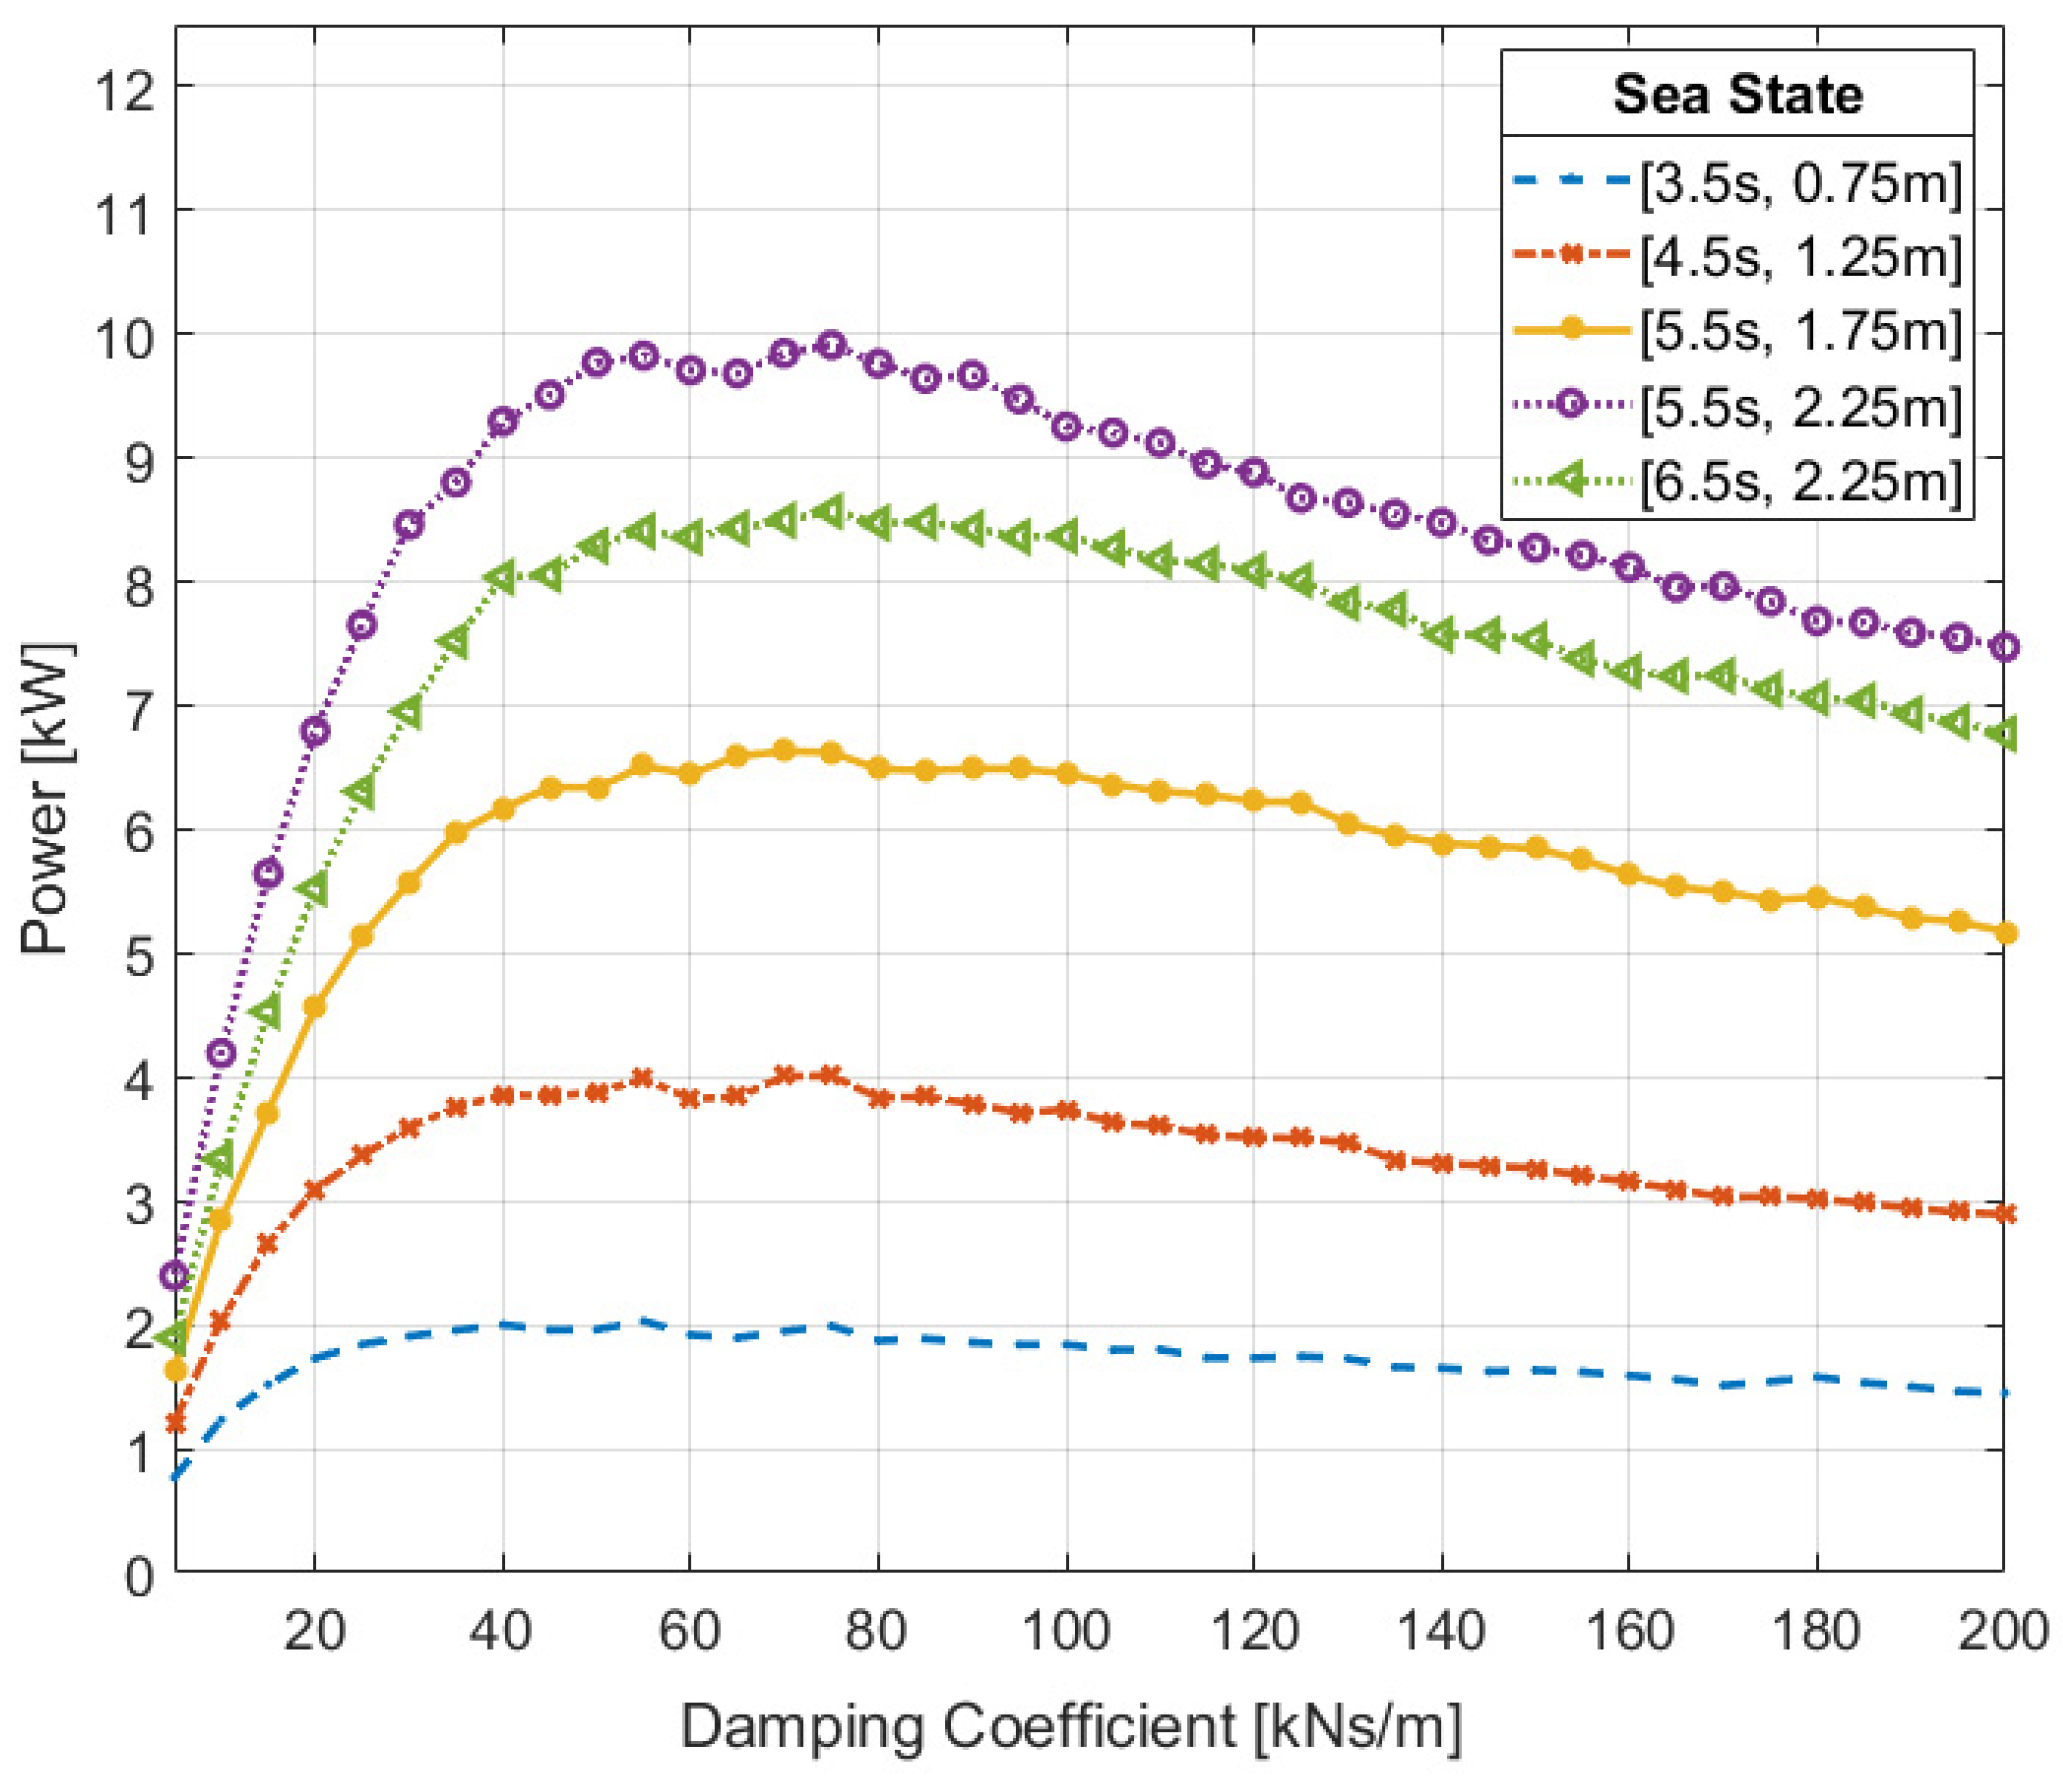
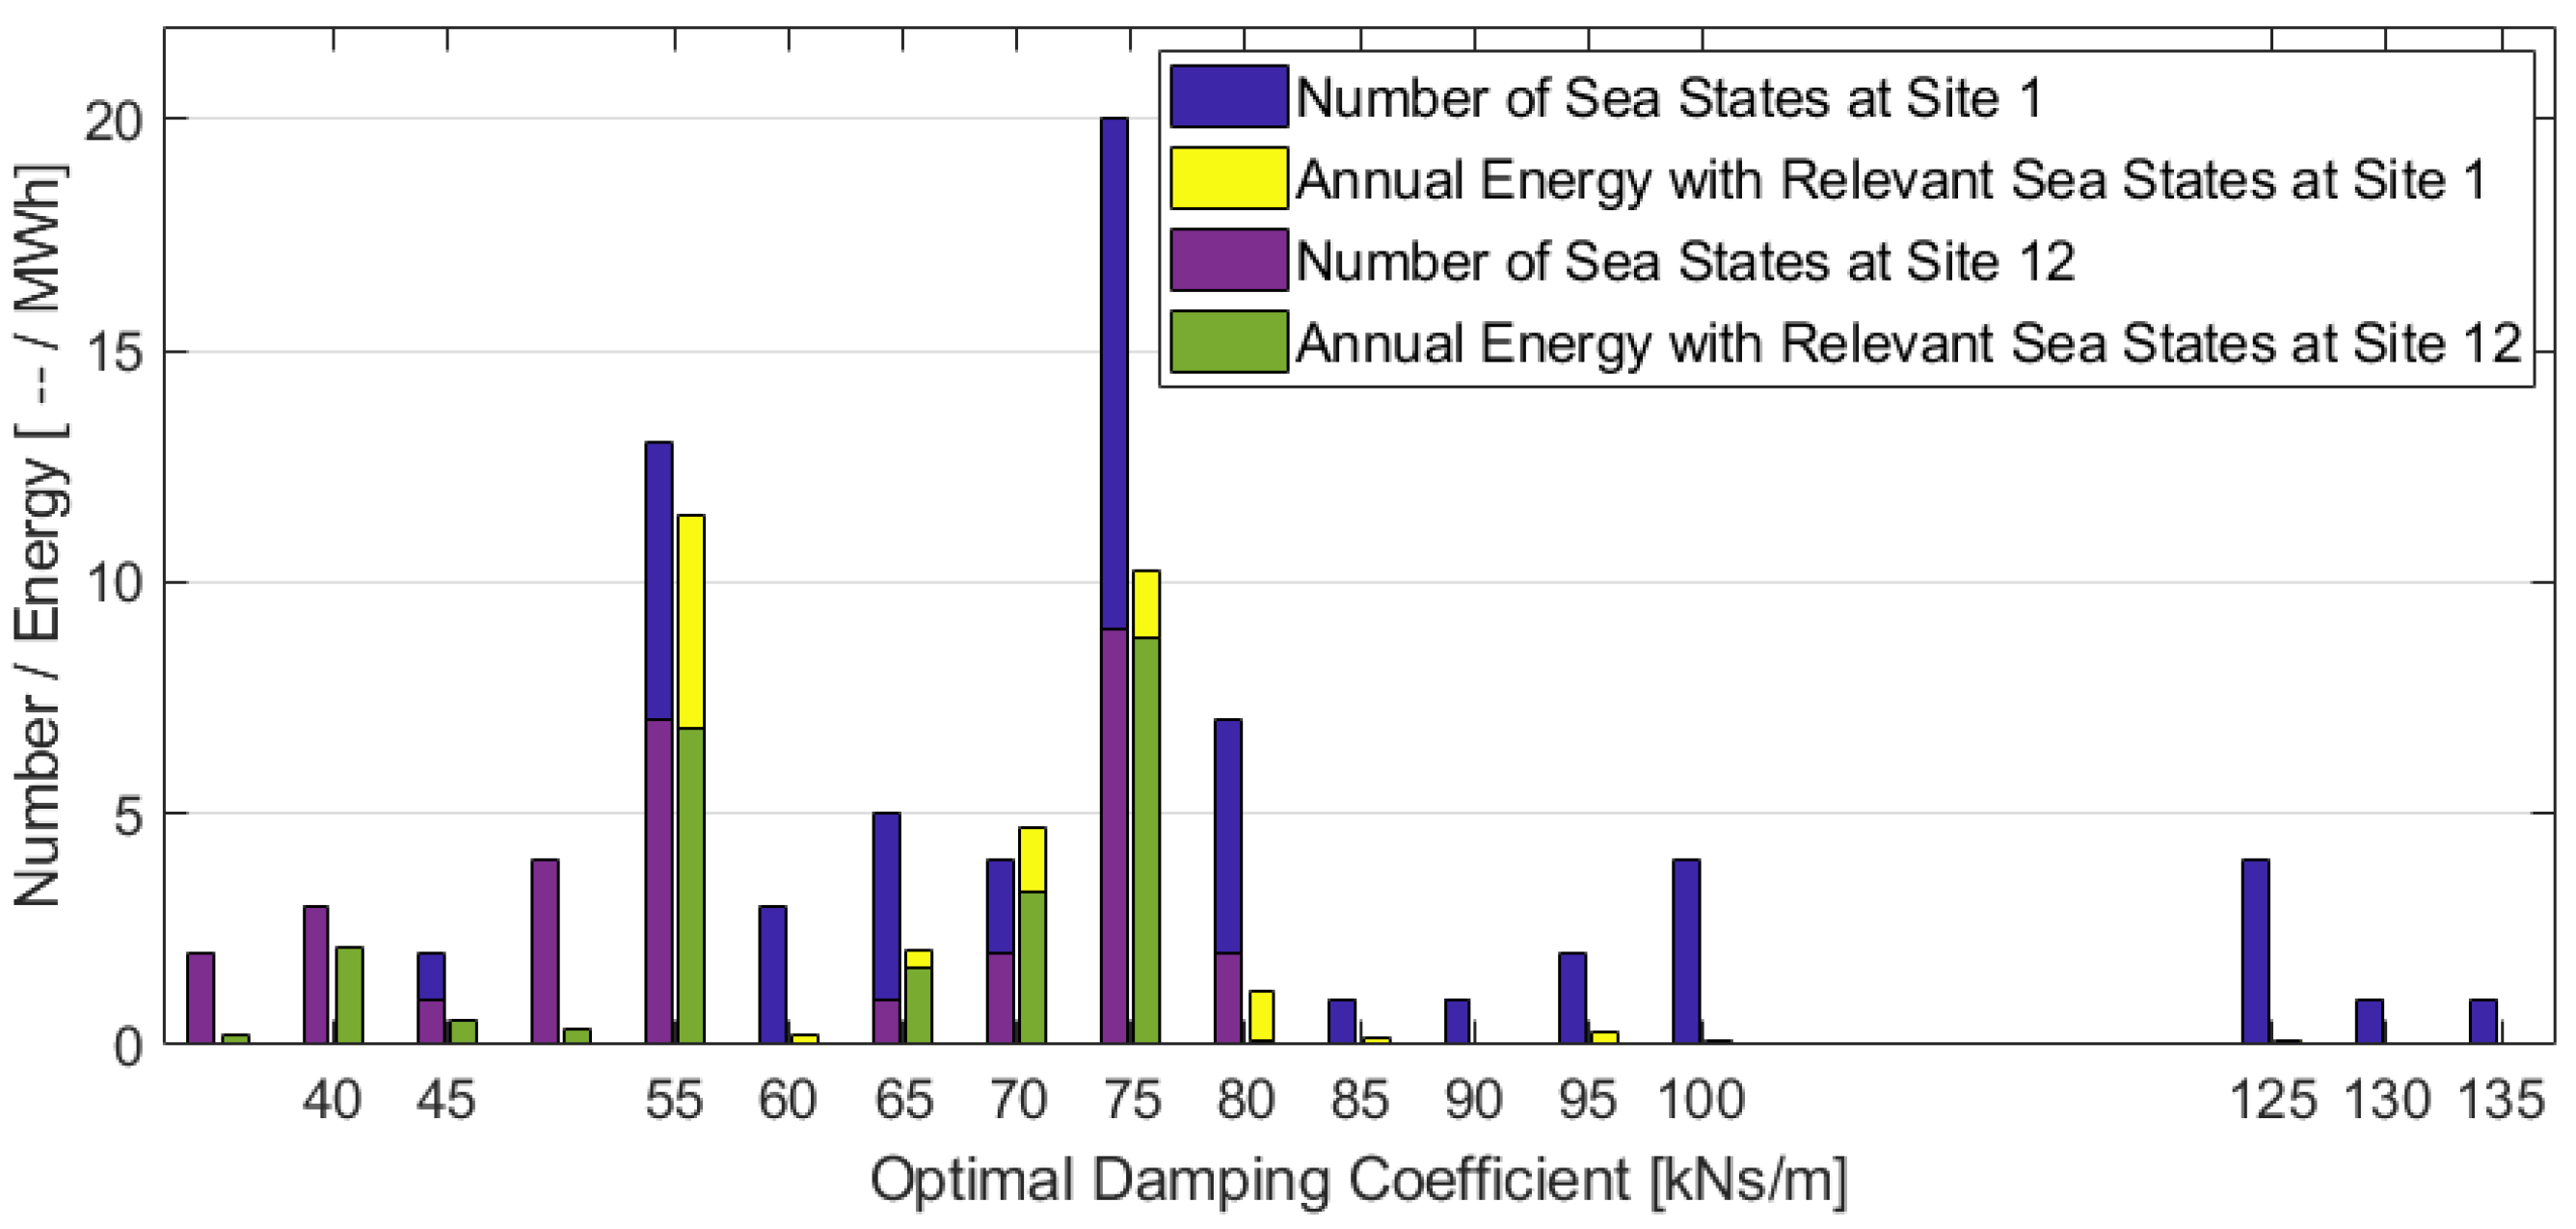
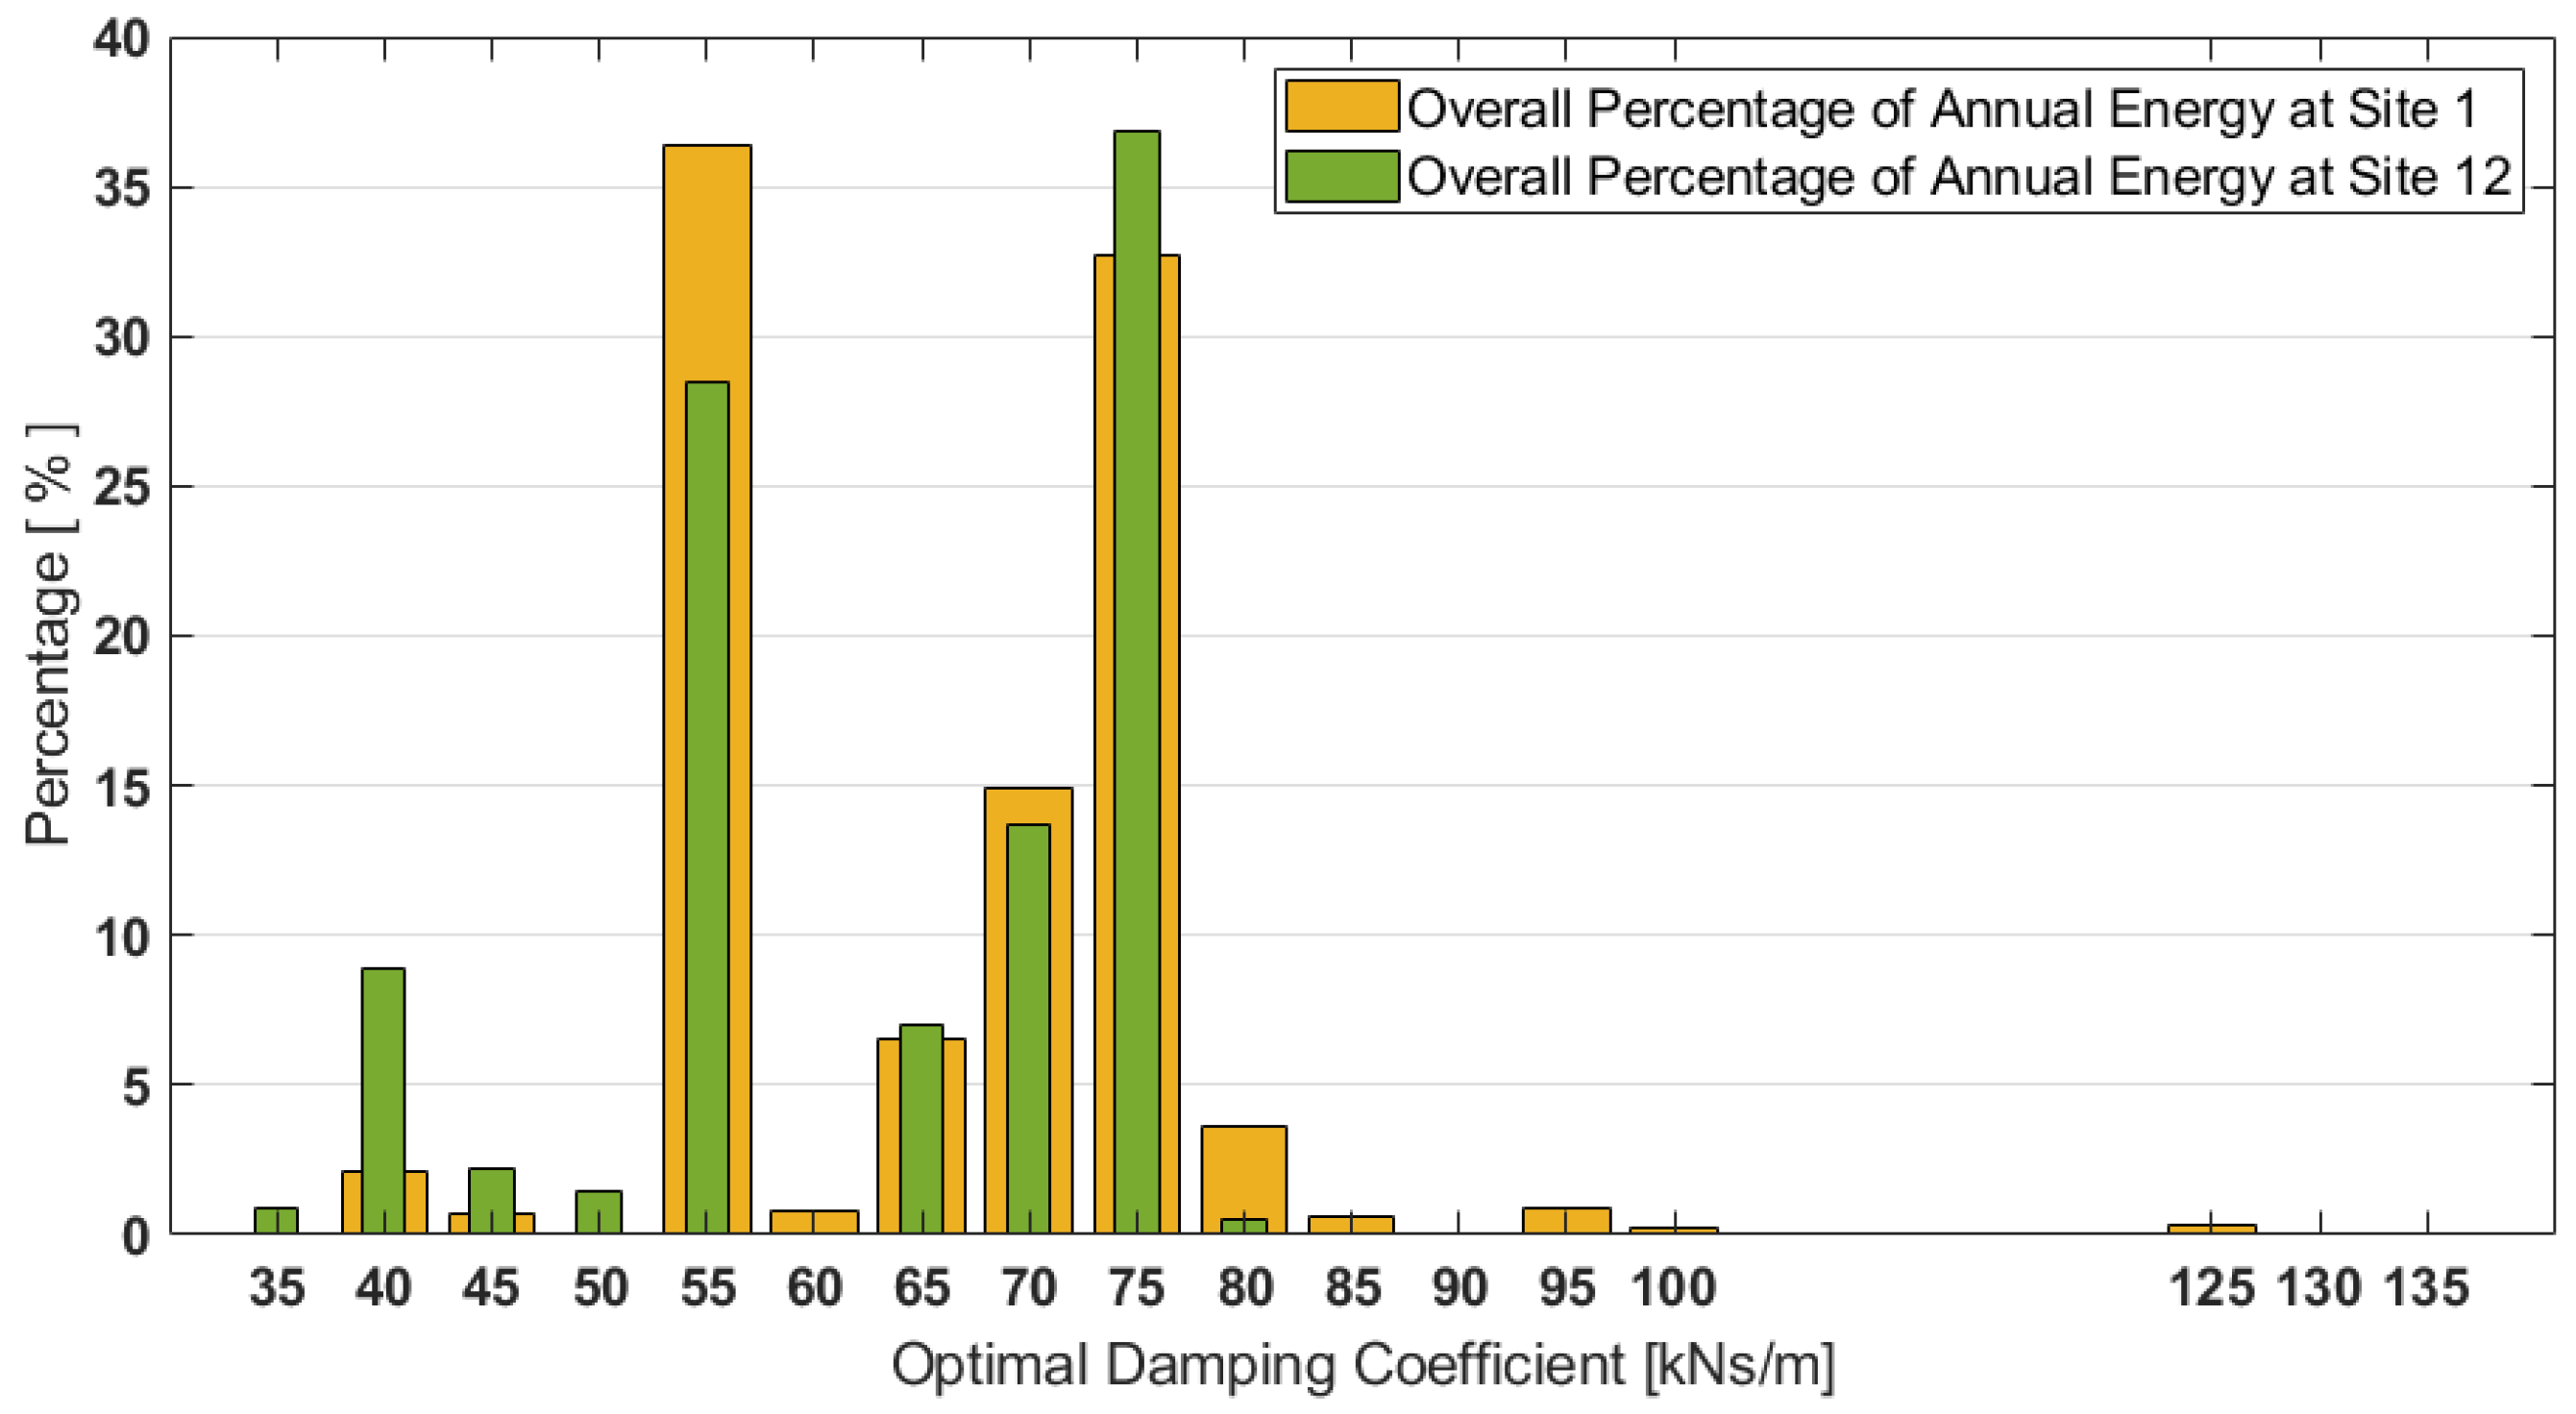
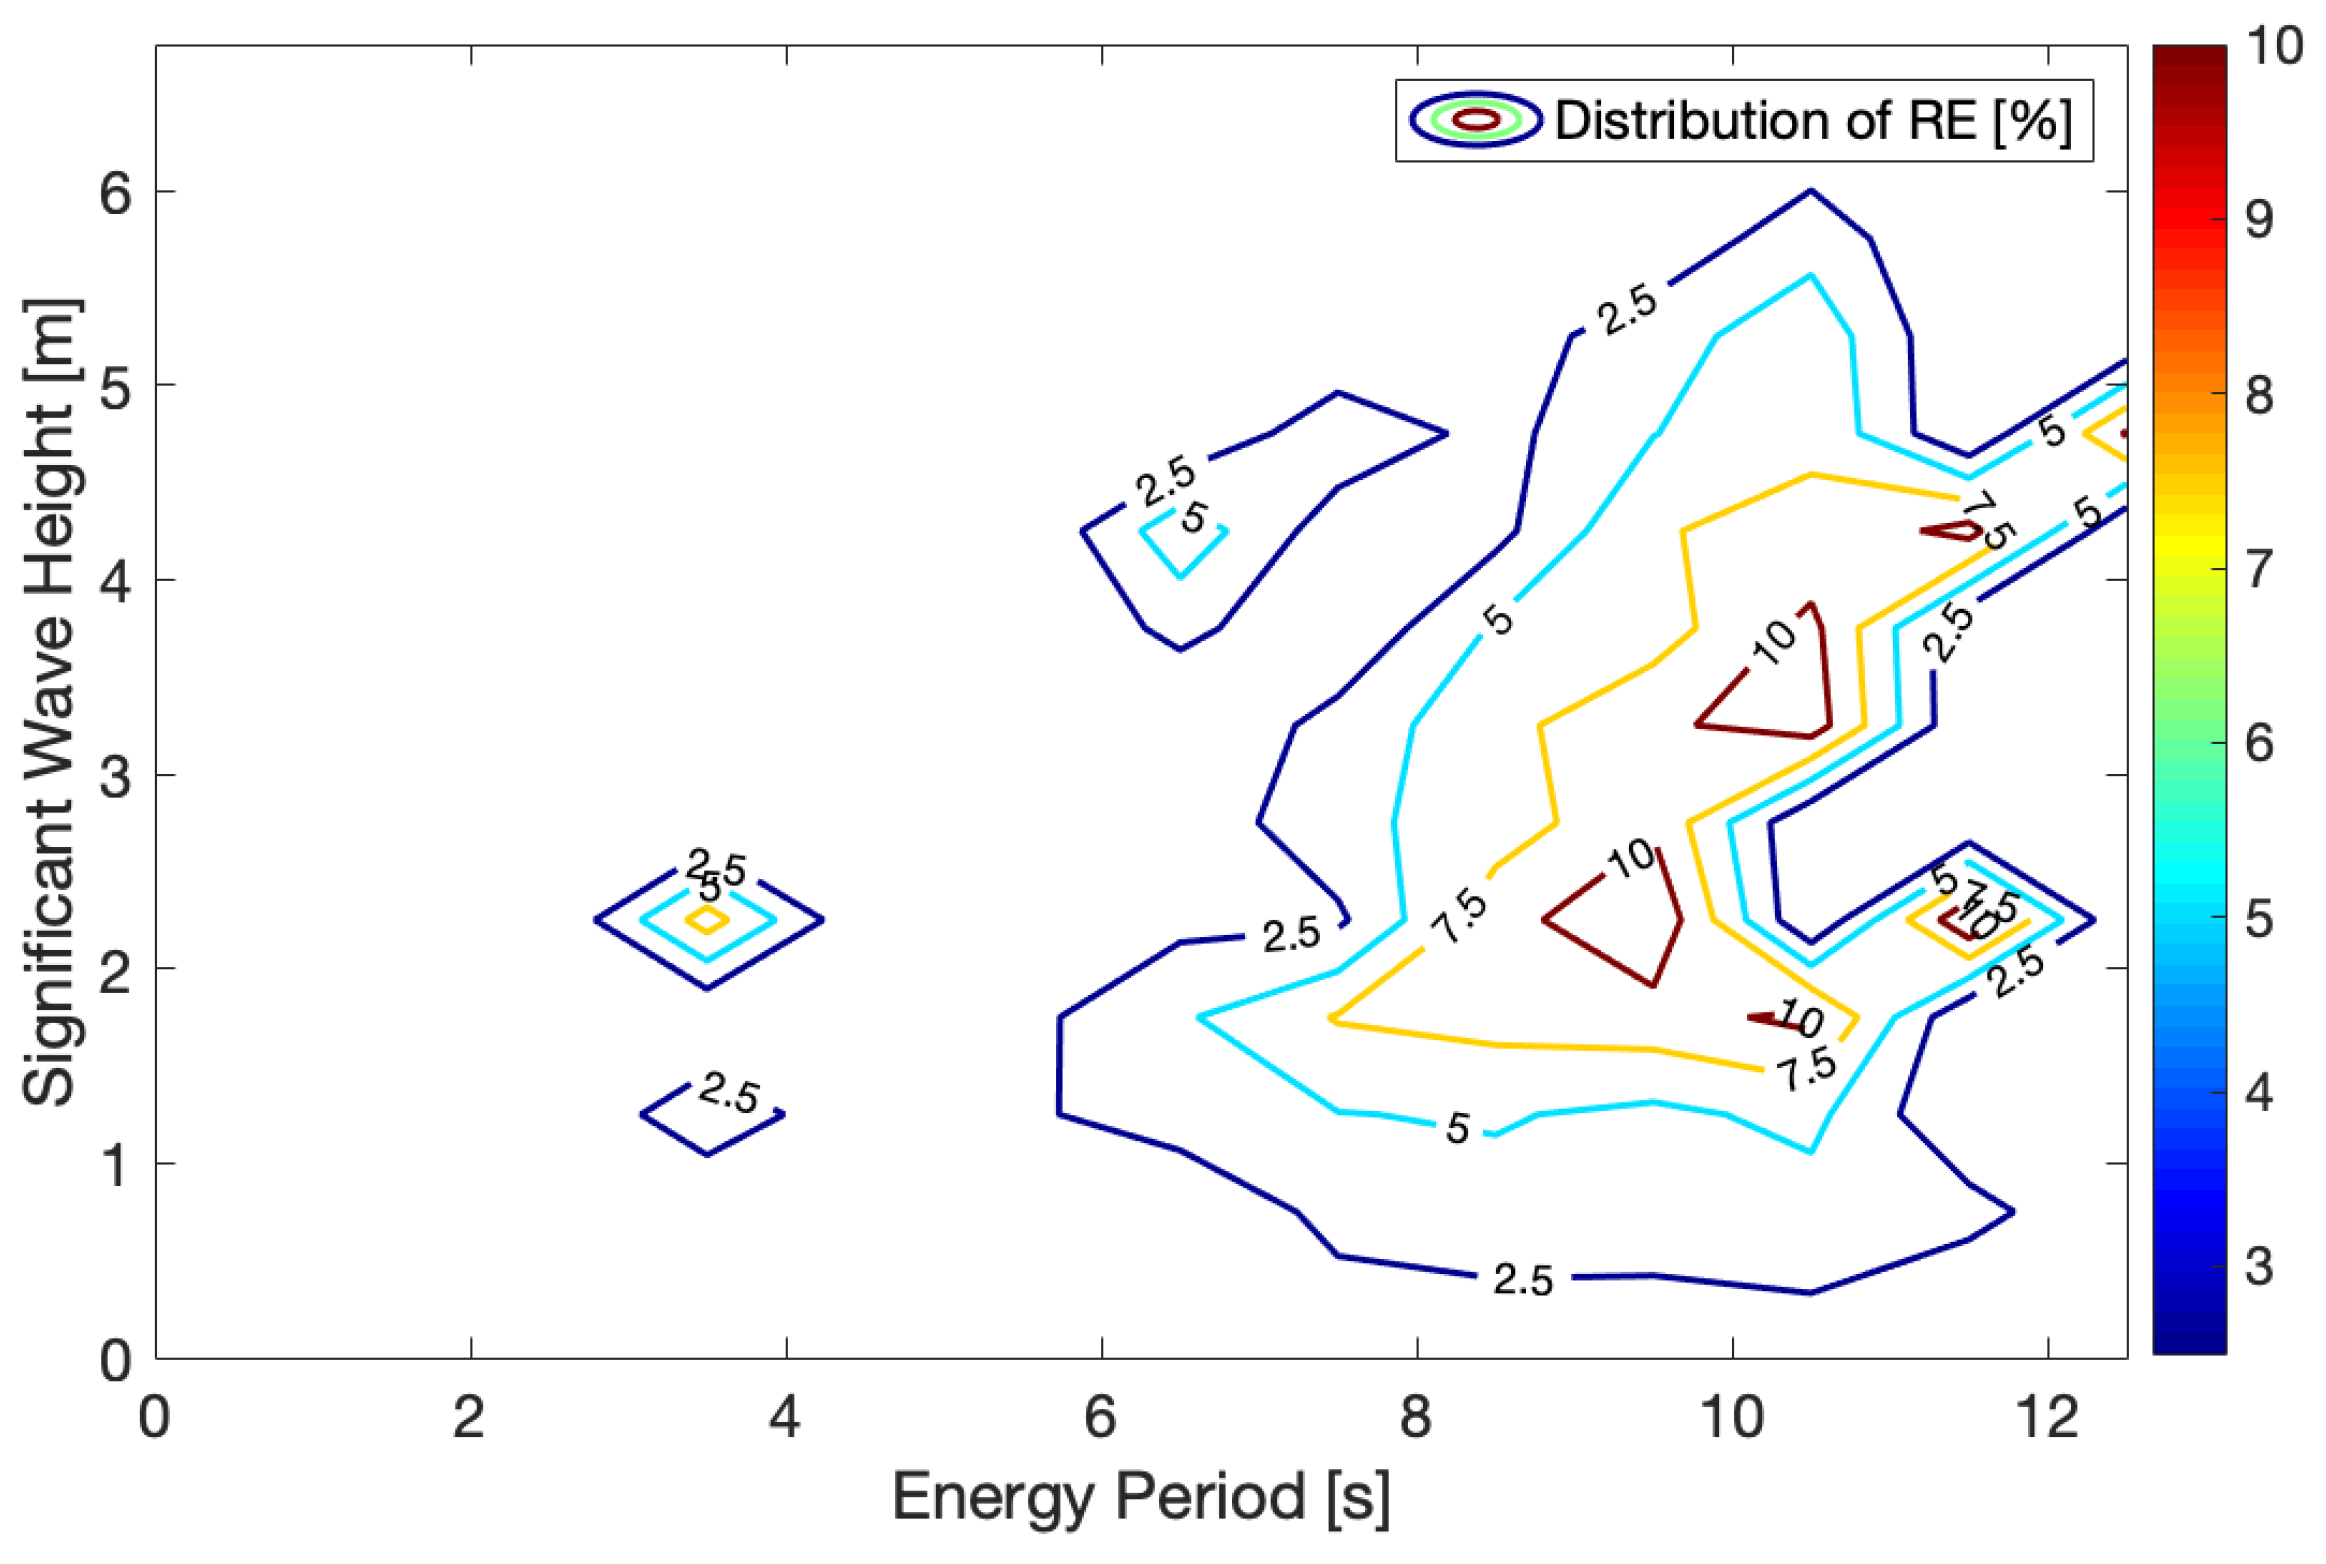
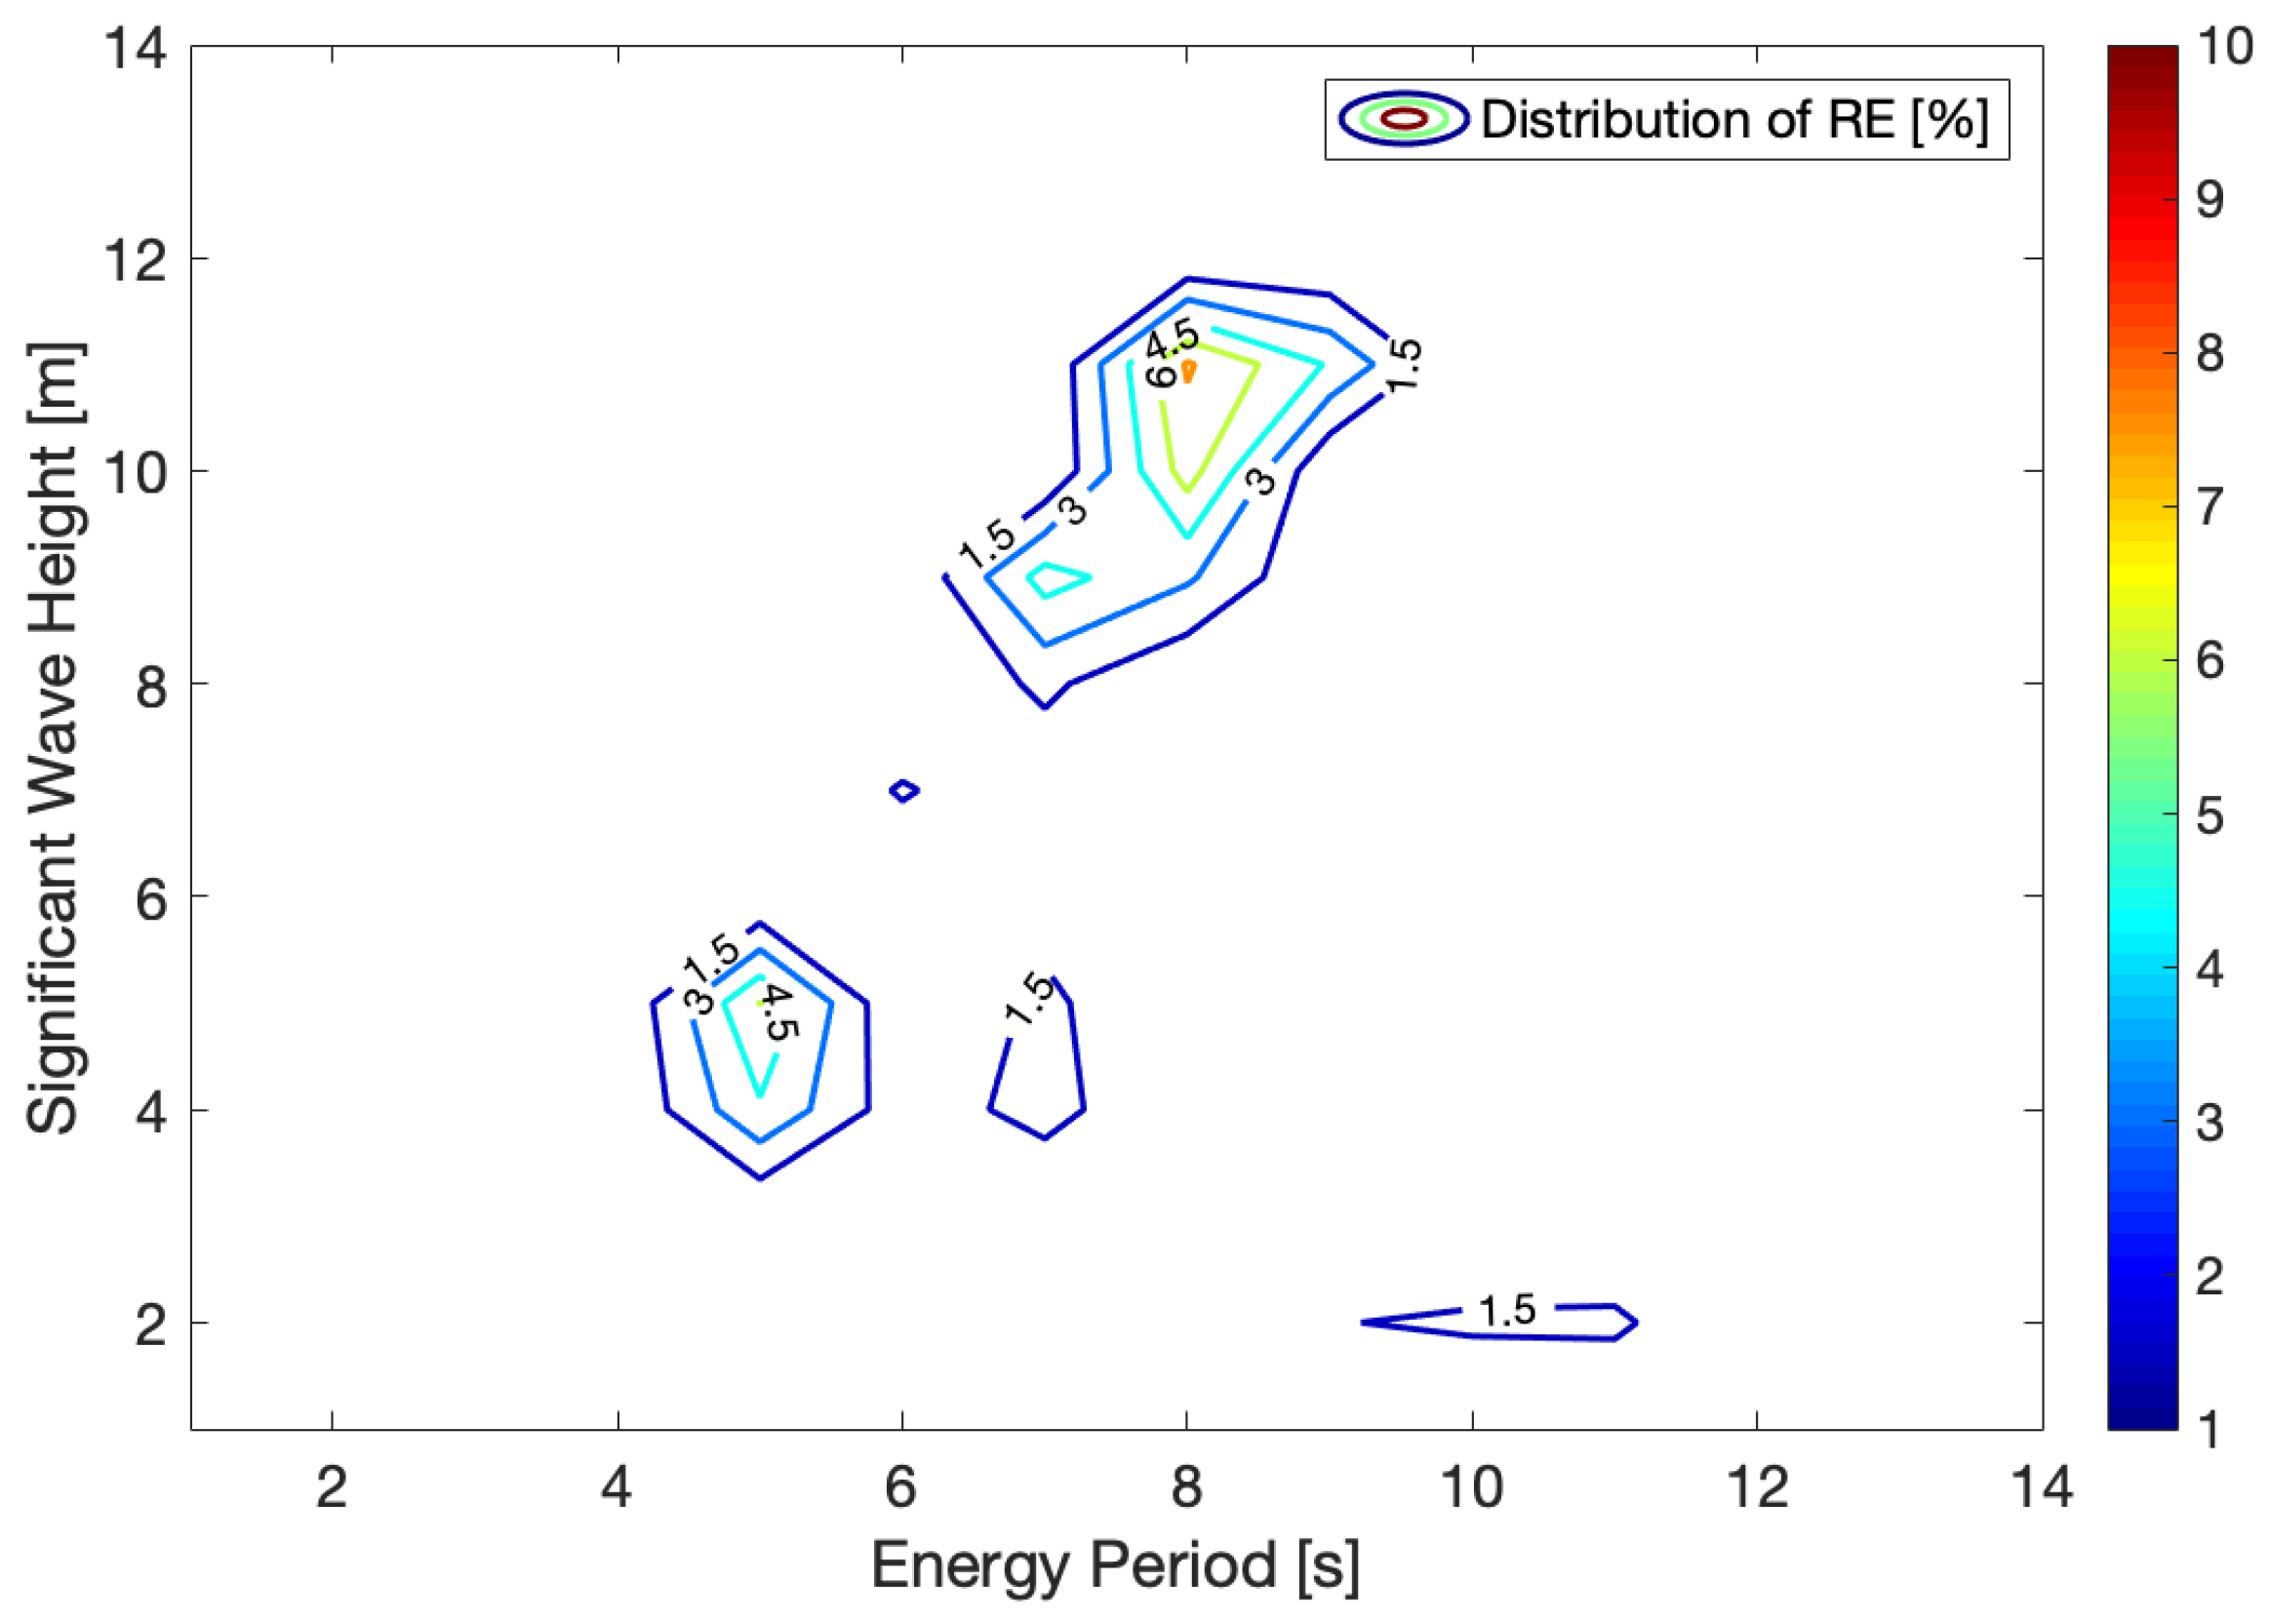
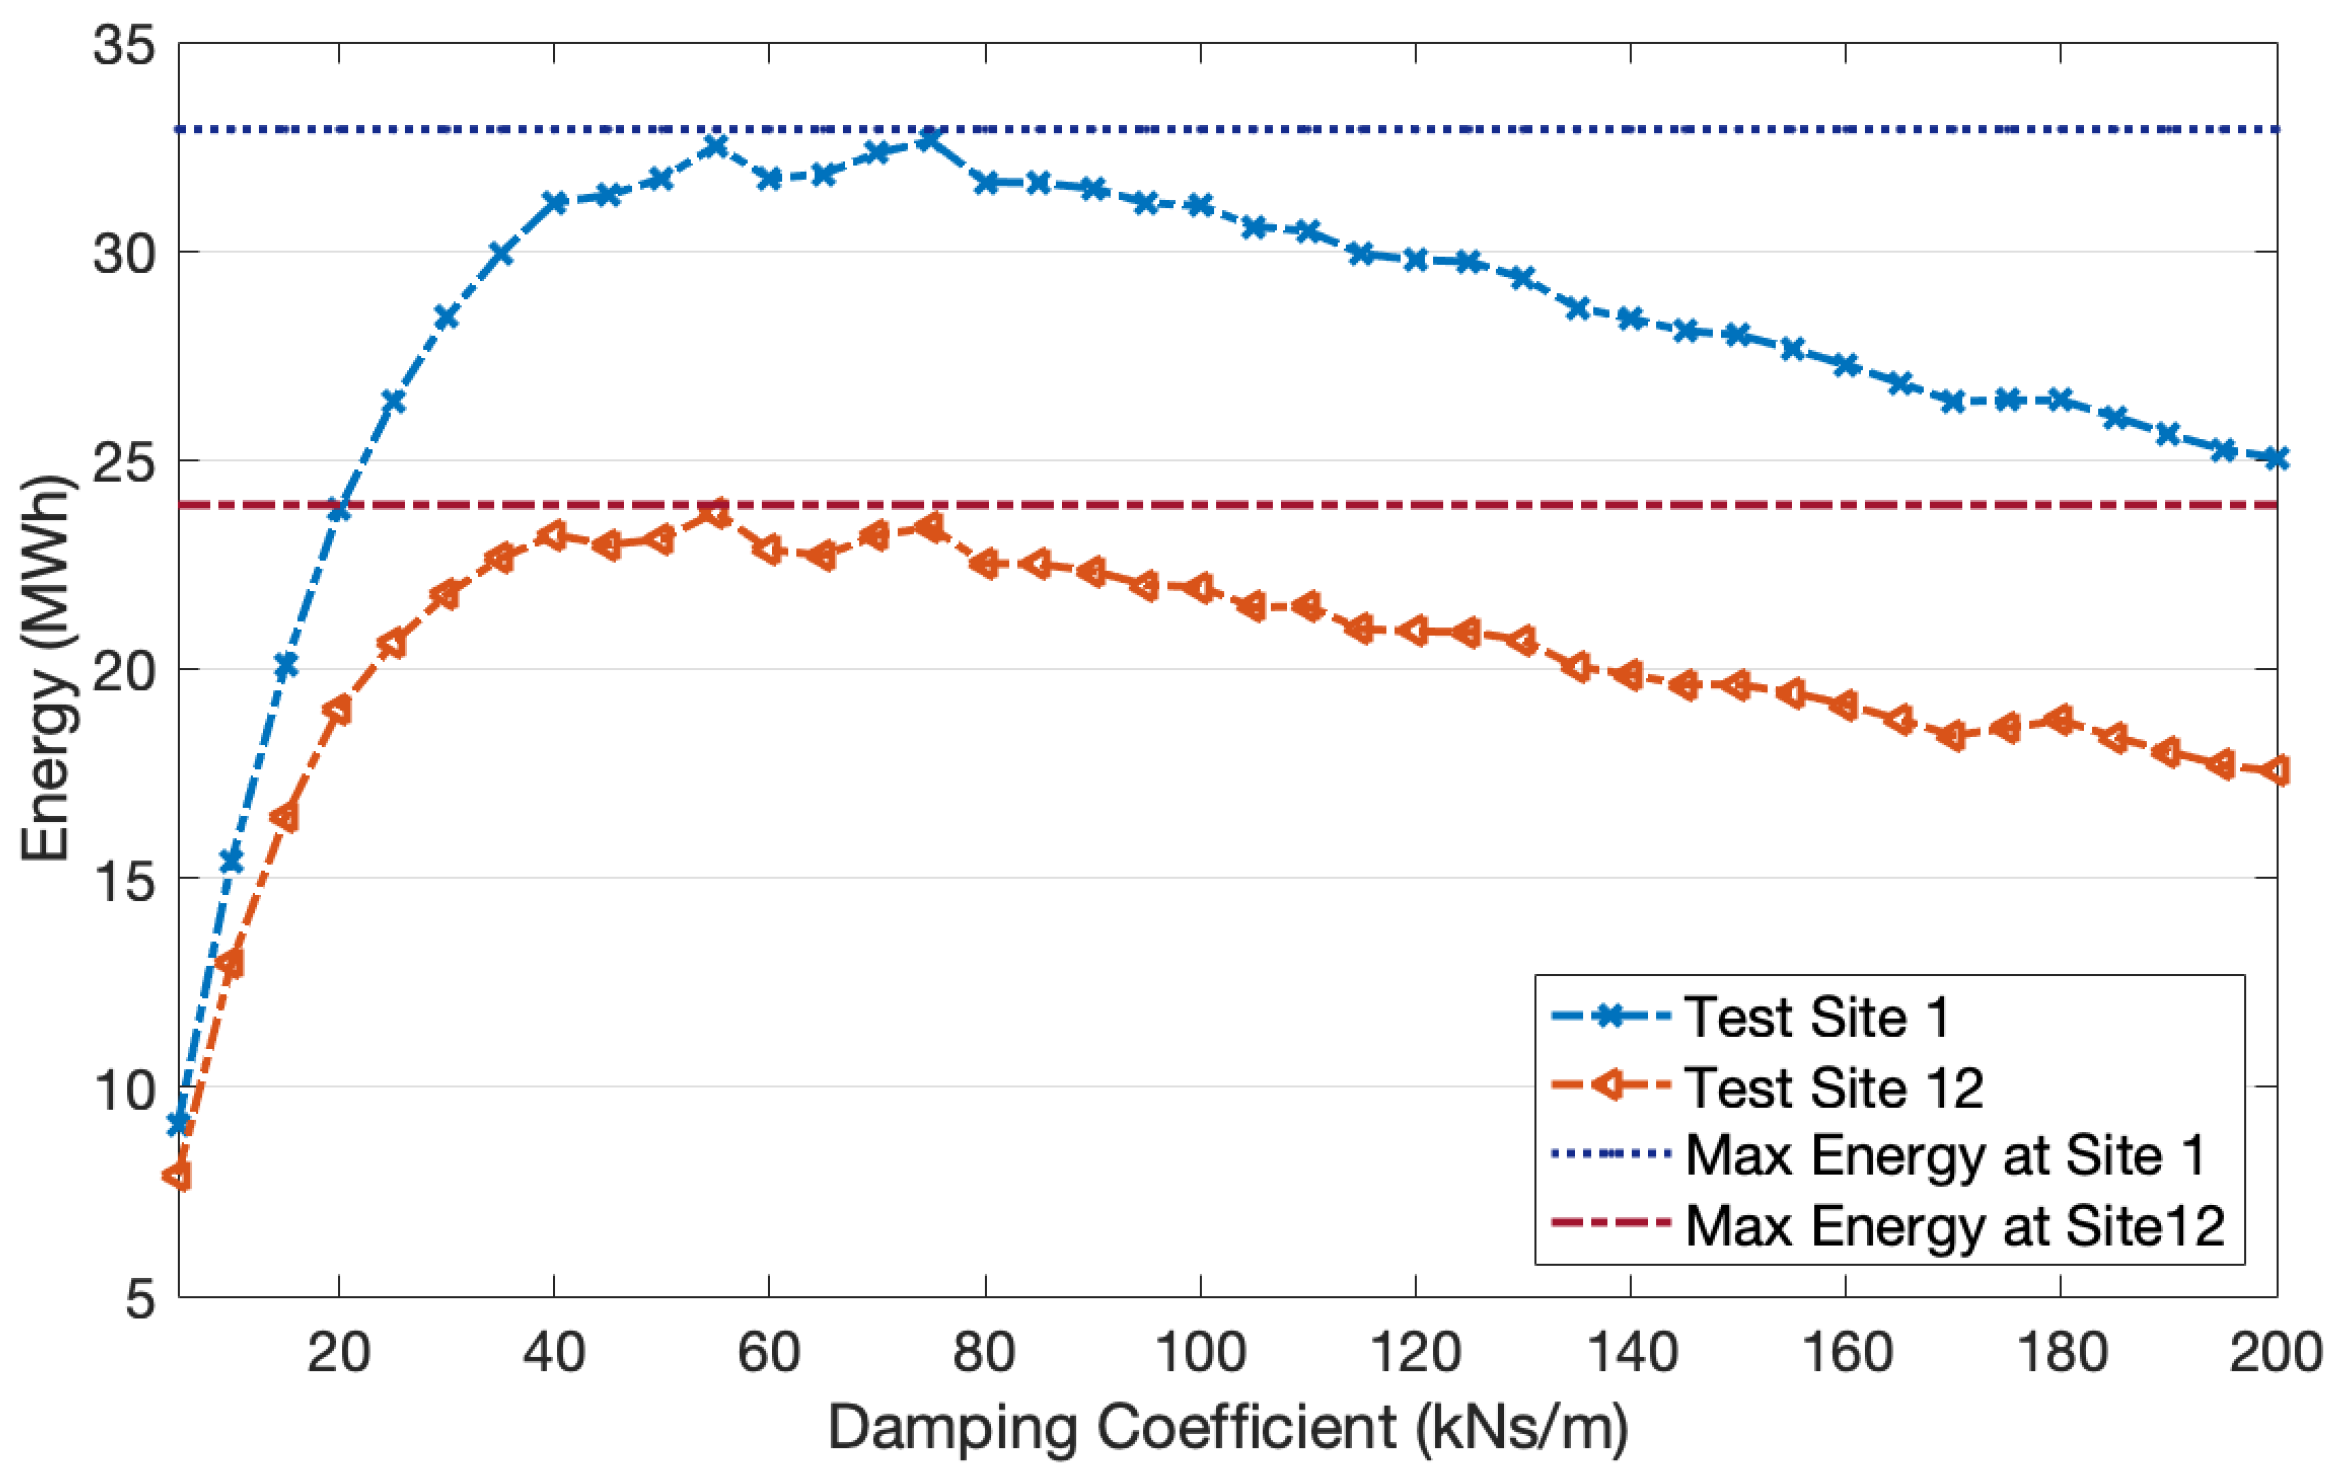
5.3. Damping Coefficient and Energy Production

Five cases of sea states were chosen to study the output power from the WEC. The reason to select these sea states was for a better comparison between the different wave heights and energy periods, respectively. For example, Case [5.5 s, 1.75 m] and Case [5.5 s, 2.25 m] both had identical energy periods, whereas Case [5.5 s, 2.25 m] and Case [6.5 s, 2.25 m] both had identical significant wave heights. A range of varying damping coefficients was also involved to better observe the impact on power production from the WEC model; the results of the five cases of sea states are presented in Figure 10.
In Figure 10, the power profiles for all five cases shared a similar shape. Power increased as the damping coefficient increased from the initial point at 5 kNs/m. When the damping coefficient increased and reached a specific value, the power reached the maximum accordingly. As the damping coefficient continued to increase, the power dropped to a slower pace; however, when reaching 200 kNs/m, it was still much higher than the initial power. Among these five cases, Case [5.5 s, 2.25 m] obtained the highest power production. Accordingly, the damping coefficient corresponding to the maximum power output is called the optimal damping coefficient. We observed that the optimal damping coefficient varied from different sea states; to investigate this further, a further study was carried out on the impact of sea states on the optimal damping coefficient.
Two research sites were chosen with different wave climates. These are both located offshore, on the west coast of Sweden (as seen in Section 2). In this investigation, the previous simulation method was used with over 80 cases of sea states.
Figure 11 and Figure 12 present the results on the optimal damping coefficient with respect to the wave climates at two test sites. We note that some sea states shared the same optimal damping coefficient for WEC, for example, in Figure 11, an area of sea states—wave height from 0.25 to 0.75 m and energy period from 1.5 to 6.5 s—shared the same optimal damping coefficient (i.e., 55 kNs/m). This suggests that an optimal damping coefficient with the highest occurrence can be utilized as a reference in the optimal damping for maximum power output. In such a case, this suggests that the real-time control of damping may be unnecessary.
However, regarding all sea states from both test sites, the annual occurrence is also important to take into account to estimate how much one specific optimal damping coefficient contributes to the overall annual energy.
Figure 13 and Figure 14 provide scatter diagrams on the annual energy production for the two research sites. The WEC was performed under optimal damping for both cases. We note that the damping coefficient differed with sea states, but not significantly. For Test Site 1, there were some squares of sea states that shared the same optimal damping coefficient (i.e., 55 kNs/m), whereas in Test Site 12, some squares shared the same optimal damping coefficient (i.e., 75 kNs/m).
The highest energy was observed around the sea state [4.5 s, 1.25 m] due to the highest occurrence at the test site. In this case, the overall energy production for each optimal damping coefficient was obtained (see Figure 13 and Figure 14).
From the results shown in Figure 13, the optimal damping coefficient mainly varied from 55 to 80 kNs/m, giving over 90% of contribution to the overall energy production (see Table 3, giving a list of sea states contributing to the most energy production at Site 1). In Figure 14, the optimal damping coefficient of 55 and 75 kNs/m took the most significant place in the overall energy contribution at Site 12, which, combined, added up to over 80% of energy production (see Table 4).
The energy production was calculated for each optimal damping coefficient that contributes to the overall energy production. Results for the overall energy production for Site 1 and Site 12 were 32.91 and 23.93 MWh, respectively. Accordingly, a bar graph comparison was made for the two sites (see Figure 15 and Figure 16).
In both Figure 15 and Figure 16, the x-axis gives a series of optimal damping coefficients observed from all the sea states that occurred at Site 1 and Site 12. The y-axis in Figure 15 displays the number of sea states for each optimal damping coefficient: the blue bar represents Site 1 and the violet bar represents Site 12. Concurrently, the energy production for each optimal damping coefficient is also presented on the y-axis; the yellow bar and green bar represent Site 1 and Site 12, respectively. In Figure 16, the y-axis shows how much percentage the energy of each optimal damping coefficient takes in relation to the overall annual energy; the orange bar and green bar represent Site 1 and Site 12, respectively.
As the wave energy density in Site 12 was less than that in Site 1, we note that the coverage of the optimal damping coefficient at Site 1 was from 55 to 135 kNs/m, and at Site 12, it was from 35 to 80 kNs/m. Between these two sites, we observed an overlap on a range of optimal damping coefficients, mainly from 55 to 80 kNs/m. Furthermore, for both sites, the damping coefficients 55 kNs/m and 75 kNs/m had high occurrence with respect to the number of sea states, and further, took the most energy production. Furthermore, we also observed an empty phenomenon in the range of 100–125 kNs/m. This is due to the hydrodynamic impact on the behavior of the linear generator. There are different factors that can contribute to such variation including the occurring frequency for both line slack and translator hitting the end stop, and also the long energy period causing a longer unmovable time pushing the end stop. In this case, a high optimal damping coefficient is necessary to keep the translator moving properly. Note that the maximum enduring force of the upper end stop was not included in the study.
Figure 16 presents the percentage of damping coefficients and their effect on energy production, at Site 1, they were 36.40% and 32.69% of the overall energy, respectively; in Site 12, they were 36.87% and 28.46%, respectively. Details are presented in Table 5 and Table 6 for Site 1 and Site 12, respectively.
In this case, the results suggest that 55 kNs/m contributed the most for Site 1 and 75 kNs/m for Site 12. We found that only minor coefficients contributed to most of the annual energy production for a site. For Site 1, four optimal damping coefficients (55, 65, 70, 75) made up 90.58% of the annual energy; in the case of Site 12, four other optimal damping coefficients (75, 55, 70, 40) made up 87.94% of the annual energy. This phenomenon suggests an option that, for some specific sites, a control under a selected area of damping coefficients may be a good choice for the WEC’s energy performance, instead of building up a complicated system for real-time control.
Note that the wave data of the two offshore test sites were both from the Swedish west coast. Despite being geographically similar, even these test sites had different wave climates; however, there were also similarities, for example, they both had the highest occurrence of sea state [4.5 s, 1.25 m], whereas huge waves (for example, with a higher significant height than 4.75 m) had less occurrence at the research sites. As part of future work, we are interested in investigating the optimal damping coefficient at more test sites to examine the different sea states.

5.4. Optimal Damping Versus Constant Damping

In light of the previous research on the WEC’s performance under optimal damping at Site 1 and Site 12, constant damping was also studied and presented in this section to evaluate if constant control would be a good idea for future designs using the control strategy. The results were compared to the results from the optimal damping case. The annual energy production with a constant damping coefficient of 55 kNs/m for both Site 1 and Site 12 are shown in Figure 17 and Figure 18. Note that the results were different than those in Figure 13 and Figure 14, which were attained by optimal damping control.
Further comparison was performed by calculating the difference between the results of constant 55 kNs/m and of optimal damping, as presented in Equation (9). Results are shown in Figure 19 and Figure 20 for the two sites, respectively. Figure 19 presents the comparison of energy production between the optimal damping control and constant damping of 55 kNs/m, in order to investigate the sea states, which may lead to the most energy variation at Site 1.
R E = W o p t i m a l W c o n s t a n t W o p t i m a l × 100 %
Results suggest that higher energy variation was mostly located where there was a longer energy period (8 s to 10 s) while significant wave height was around 2 to 5 m. The phenomenon is also of interest as most of the energy production occurred between a 3 to 7 s energy period and a significant wave height between 0.75 to 2.75 m. The reason for this phenomenon is partly due to the specific WEC parameters including the dimension of the buoy as well as its linear dimensions-stroke length, etc.
Figure 20 presents the comparison at Site 12. We observed that there was less variation in Figure 20 than in Figure 19. This can be explained by less variation with sea states at Site 12. We noted that most variation was located around 8 s of energy period and 10 m of significant wave height, which was quite far from the location with the highest energy density on the map.
Aside from 55 kNs/m, other damping coefficients were also studied. Thus, a series of damping coefficients varying from 5 to 200 kNs/m were investigated. As shown in Figure 21, two annual energy profiles were obtained under constant damping control varied from 5 to 200 kNs/m. The profiles represent Test Site 1 and Test Site 12, respectively. In addition, two straight lines representing the maximum energy under optimal control are also marked in Figure 21.
In Figure 21, two profiles shared some similarities with the results in Figure 10. The energies were both low due to the low damping coefficient from the beginning at 5 kNs/m. The energy kept increasing as the damping coefficient increased and then reached the maximum at a specific damping value. Afterward, as the damping coefficient kept increasing, the energy dropped to a slow pace.
For Site 1, the estimated annual energy of 75 kNs/m was 32.63 MWh, which was close to the maximum energy production under optimal control. As for Site 12, the same situation was observed with a damping coefficient of 55 kNs/m at Site 12, while the energy production was 23.76 MWh. The data are listed in Table 7. From the percentage presenting the difference, this phenomenon suggests that constant damping control may be good enough to take the place of optimal damping control for all sea states.
Furthermore, either for optimal damping or constant damping, the selection on the damping method is greatly dependent on full research on wave climates at test regions. Moreover, the PTO configuration of WEC is also an important reference for deciding the optimal damping coefficient under each sea state. Therefore, the research in this article was only valid for the PMLG type WEC with the specifications shown in Table 1. Note that the overall energy production did not vary much between the selection of Site 1 and Site 12. The main reason is that the wave energy density along the west coast of Sweden is gentle. A higher energy production will be obtained at sites with a higher wave energy density such as the test sites of European Marine Energy Centre (EMEC) or WaveHub; however, the upper limit of power generation should be considered with the WEC’s configuration. Energy production will not improve much if the available wave energy far exceeds the WEC’s limitation, and this case will be included in further studies.
Furthermore, the control methods were not specified in this research with two points of consideration. First, the purpose was to conduct preliminary research on optimal damping and how it affects the performance of PMLG-based WECs at offshore regions. Regardless of the control methods, the paper suggests further research on optimal damping under a variety of affecting factors such as nonlinear extreme waves, occurrence of line slack, and force limit. Second, a variety of control methods have been proposed in other studies, aiming to achieve damping control on the WECs. However, it is of great significance to investigate and compare among the control methods before selecting a proper method for the optimal damping control. The extra work will be huge as more factors should be involved, also suggesting a more comprehensive future work.

6. Conclusions

In this study, we focused on the research of the PMLG-type WEC’s performance in relation to the wave climates at the research sites. The optimal damping coefficient was figured out for the maximum power generation and varies under different sea states. In this case, two sites with varied wave climates were selected to investigate the WEC’s annual energy production. The estimated annual energy production was 32.91 and 23.93 MWh, respectively, suggesting a possible optimal control strategy may be applied for capturing higher energy with a real-time monitor. Meanwhile, it was discovered that a few damping coefficients existed and contributed the highest annual energy at the test sites. A damping coefficient of 55 kNs/m presented the highest percentage of 36.4% in annual energy production for Site 1, while 75 kNs/m was the highest for Site 12. The results hint that the varied impact from wave climates may be the benefit for using a more advanced control by applying a different loading dependent on the sea state. However, as the complexity of the control would lead to additional influences to the system and energy loss, constant damping is a way as a reference to compare with the optimal damping cases.
In the further study, comparisons of the WEC’s performance were made between optimal damping and constant damping. From the results in Table 7, constant damping control of 55 kNs/m (for Site 12) and 75 kNs/m (for Site 1) contributed the closest energy production to optimal damping. In this case, it suggests that for Site 1 and Site 12, overall optimal damping will be an ideal optimization, however, the overall energy production was not far enhanced from overall constant damping. The reason is that the available wave energy density is gentle in light of the researched locations. In this case, constant damping might be an option for enhancing energy production at both Site 1 and Site 12, considering that real time control might bring extra energy losses and complexity into the conversion system.
As this paper proposed a novel methodology based on the impact from the wave climate at research sites, future work with mathematical analysis could be carried out by including more sites with more diverse climates. Furthermore, tuning of the WEC’s mechanical parameters will be employed to study the influence on the optimal damping distribution at a site. Moreover, different techniques on damping control will be designed and analyzed as part of future research.

Author Contributions

Y.H. performed the numerical modeling and wrote the full paper; I.T. and J.P. reviewed and edited the full draft; M.E. conducted the hydrodynamic theory of the model; and C.B. supervised the work. All authors have read and agreed to the published version of the manuscript.

Funding

The work was supported by the Natural Science Foundation of SZU under grant 2110271, the National Natural Science Foundation of China under grant U1913214, ÅForsk (PA 17-550), Carl Tryggers Stiftelse, Uppsala University, StandUP for Energy, the Swedish Research Council (VR) under grant 2015-03126, and in part by the National Taipei University of Technology-Shenzhen University Joint Research Program under grants 2019002 and 2020004.

Institutional Review Board Statement

Not applicable.

Informed Consent Statement

Not applicable.

Data Availability Statement

Data is contained within the article.

Conflicts of Interest

The authors declare no conflict of interest.

References

  1. Girard, P. Pour Divers Moyens D’employr les Vagues de la mer, Comme Moteurs; Brevet D’invention De Quinze Ans: Paris, France, 1799. [Google Scholar]
  2. Mccormick, M.E. Ocean wave energy conversion. Renew. Energy 1970, 1, 1309–1319. [Google Scholar]
  3. Falcão, A.F.O. Wave energy utilization: A review of the technologies. Renew. Sustain. Energy Rev. 2010, 14, 899–918. [Google Scholar] [CrossRef]
  4. Astariz, S.; Iglesias, G. The economics of wave energy: A review. Renew. Sustain. Energy Rev. 2015, 45, 397–408. [Google Scholar] [CrossRef]
  5. Penalba, M.; Ringwood, J.V. A review of wave-to-wire models for wave energy converters. Energies 2016, 9, 506. [Google Scholar] [CrossRef] [Green Version]
  6. Ozkop, E.; Altas, I.H. Control, power and electrical components in wave energy conversion systems: A review of the technologies. Renew. Sustain. Energy Rev. 2017, 67, 106–115. [Google Scholar] [CrossRef]
  7. Nguyen, H.P.; Wang, C.M.; Tay, Z.Y.; Luong, V.H. Wave energy converter and large floating platform integration: A review. Ocean Eng. 2020, 213, 2–17. [Google Scholar] [CrossRef]
  8. Hong, Y.; Waters, R.; Boström, C. Review on electrical control strategies for wave energy converting systems. Renew. Sustain. Energy Rev. 2014, 31, 329–342. [Google Scholar] [CrossRef]
  9. Falnes, J. Ocean Waves and Oscillating Systems; Cambridge University Press: Cambridge, UK, 2002. [Google Scholar]
  10. Mueller, M.; Baker, N.J. A low speed reciprocating permanent magnet generator for direct drive wave energy converters. In Proceedings of the International Conference on Power Electronics Machines and Drives, Bath, UK, 16–18 April 2002. [Google Scholar]
  11. Waters, R. Energy from Ocean Waves. Full Scale Experimental Verification of a Wave Energy Converter. Ph.D. Thesis, Uppsala University, Uppsala, Sweden, 2008. [Google Scholar]
  12. Hong, Y. Numerical Modelling and Mechanical Studies on a Point Absorber Type Wave Energy Converter. Ph.D. Thesis, Uppsala University, Uppsala, Sweden, 2017. [Google Scholar]
  13. Ekström, R.; Ekergård, B.; Leijon, M. Electrical damping of linear generators for wave energy converters—A review. Renew. Sustain. Energy Rev. 2015, 42, 116–128. [Google Scholar] [CrossRef]
  14. Liu, Z.; Wang, X.; Shami, E.A.; Baker, N.J.; Ji, X. A study of a speed amplified linear generator for low-frequency wave energy conversion. Mech. Syst. Signal Process. 2021, 149, 1–18. [Google Scholar] [CrossRef]
  15. Wang, L.; Lin, M.; Tedeschi, E.; Engström, J.; Isberg, J. Improving electric power generation of a standalone wave energy converter via optimal electric load control. Energy 2020, 211, 1–9. [Google Scholar] [CrossRef]
  16. Teillant, B.; Gilloteaux, J.C.; Ringwood, J.V. Optimal damping profile for a heaving buoy wave energy converter. In Proceedings of the 8th IFAC Conference on Control Applications in Marine Systems, Rostock-Warnemünde, Germany, 15–17 September 2010. [Google Scholar]
  17. Son, D.; Yeung, R.W. Real-time implementation and validation of optimal damping control for a permanent-magnet linear generator in wave energy extraction. Appl. Energy 2017, 208, 571–579. [Google Scholar] [CrossRef]
  18. Zang, Z.; Zhang, Q.; Qi, Y.; Fu, X. Hydrodynamic responses and efficiency analyses of a heaving-buoy wave energy converter with PTO damping in regular and irregular waves. Renew. Energy 2018, 116, 527–542. [Google Scholar] [CrossRef]
  19. Zhao, X.; Ning, D.; Göteman, M.; Kang, H. Effect of the PTO damping force on the wave pressures on a 2-D wave energy converter. J. Hydrodyn. 2017, 29, 863–870. [Google Scholar] [CrossRef]
  20. Stålberg, M.; Waters, R.; Danielsson, O.; Leijon, M. Influence of generator damping on peak power and variance of power for a direct drive wave energy converter. J. Offshore Mech. Arct. Eng. 2008, 130, 1–4. [Google Scholar] [CrossRef]
  21. Eriksson, M.; Isberg, J.; Leijon, M. Hydrodynamic modeling of a direct drive wave energy converter. Int. J. Eng. Sci. 2005, 43, 1377–1387. [Google Scholar] [CrossRef]
  22. Pecher, A.; Kofoed, J. Handbook of Ocean Wave Energy; Springer Nature: Cham, Switzerland, 2017. [Google Scholar]
  23. Waters, R.; Stalberg, M.; Danielsson, O. Experimental results from sea trials of an offshore wave energy system. Appl. Phys. Lett. 2007, 90, 1–3. [Google Scholar] [CrossRef]
  24. Rodríguez, C.A.; Rosa-Santos, P.; Taveira-Pinto, F. Assessment of damping coefficients of power take-off systems of wave energy converters: A hybrid approach. Energy 2019, 169, 1022–1038. [Google Scholar] [CrossRef]
  25. Duclos, G.; Babarit, A.; Clément, A.H. Optimizing the power take off of a wave energy converter with regard to the wave Climate. J. Offshore Mech. Arct. Eng. 2005, 128, 56–64. [Google Scholar] [CrossRef]
  26. Edwards, S.J.; Coe, R.G. The effect of environmental contour selection on expected wave energy converter response. J. Offshore Mech. Arct. Eng. 2018, 141, 1–7. [Google Scholar] [CrossRef]
  27. Hong, Y.; Eriksson, M.; Boström, C.; Pan, J.; Liu, Y.; Waters, R. Damping effect coupled with the internal translator mass of linear generator-based wave energy converters. Energies 2020, 13, 4424. [Google Scholar] [CrossRef]
  28. Li, W.; Isberg, J.; Waters, R.; Engström, J.; Svensson, O.; Leijon, M. Statistical analysis of wave climate data using mixed distributions and extreme wave prediction. Energies 2016, 9, 396. [Google Scholar] [CrossRef] [Green Version]
  29. Temiz, I.; Leijon, J.; Ekergård, B.; Boström, C. Economic aspects of latching control for a wave energy converter with a direct drive linear generator power take-off. Renew. Energy 2018, 128, 57–67. [Google Scholar] [CrossRef]
  30. Lejerskog, E.; Boström, C.; Savin, A. Lysekil research site, Sweden: Status update. In Proceedings of the European Wave and Tidal Energy Conference 2011, Southampton, UK, 5–9 September 2011. [Google Scholar]
  31. Hong, Y.; Hultman, E.; Castellucci, V. Status update of the wave energy research at Uppsala University. In Proceedings of the European Wave and Tidal Conference 2013, Aalborg, Denmark, 2–5 September 2013. [Google Scholar]
  32. Parwal, A.; Remouit, F.; Hong, Y. Wave energy research at Uppsala University and the Lysekil research site, Sweden: A status update. In Proceedings of the European Wave and Tidal Energy Conference 2015, Nantes, France, 6–11 September 2015. [Google Scholar]
  33. Stålberg, M.; Waters, R.; Eriksson, M. Full-scale testing of PM linear generator for point absorber WEC. In Proceedings of the European Wave and Tidal Conference, Glasgow, UK, 29 August–2 September 2005. [Google Scholar]
  34. Chatzigiannakou, M.A.; Ulvgård, L.; Temiz, I.; Leijon, M. Offshore deployments of wave energy converters by Uppsala University. Sweden. Mar. Syst. Ocean Technol. 2019, 14, 67–74. [Google Scholar] [CrossRef] [Green Version]
  35. Boström, C. Electrical Systems for Wave Energy Conversion. Ph.D. Thesis, Uppsala University, Uppsala, Sweden, 2011. [Google Scholar]
  36. Hong, Y.; Eriksson, M.; Boström, C. Impact of generator stroke length on energy production for a direct drive wave energy converter. Energies 2016, 9, 730. [Google Scholar] [CrossRef] [Green Version]
  37. Hong, Y.; Eriksson, M.; Castellucci, V. Linear generator-based wave energy converter model with experimental verification and three loading strategies. IET Renew. Power Gener. 2016, 10, 349–359. [Google Scholar] [CrossRef] [Green Version]
  38. Waters, R.; Engström, J.; Isberg, J. Wave climate off the Swedish west coast. Renew. Energy 2009, 34, 1600–1606. [Google Scholar] [CrossRef]
  39. Boldea, I.; Nasar, S. Linear Electric Actuators and Generators; Cambridge University Press: Cambridge, UK, 1997. [Google Scholar]
  40. Wornom, S.F.; Welsh, D.J.S.; Bedford, K.W. On coupling the SWAN and WAM wave models for accurate nearshore wave predictions. Coast. Eng. J. 2001, 43, 161–201. [Google Scholar] [CrossRef]
  41. Bretschneider, C.L. On Wind Generated Waves, Topics in Ocean Engineering; Gulf Publishing: Houston, TX, USA, 2006. [Google Scholar]
Figure 1. Wave energy converters (WECs) categorized by mechanical structure.
Energies 14 00920 g001
Figure 2. (a) Map presenting the location of the Lysekil test site and other research sites [36]. In the map, Site 1 and Site 12 were the chosen research sites for our study; (b) scatter diagram for significant wave height and energy period at the Lysekil test site.
Energies 14 00920 g002
Figure 3. The wave energy converter (WEC) invented in the Uppsala University (UU) Project: (a) conceptual illustration of the point absorber type WEC; (b) the full-scale linear generators ready to be deployed at the Lysekil test site [37].
Energies 14 00920 g003
Figure 4. Scatter diagram for significant wave height and energy period at the two research sites. The locations of two research sites: (a) Site 1 and (b) Site 12 are presented in Figure 2a. In the diagrams, the number given in each square is the average occurrence in hours per year, which is based on an eight-year average [38].
Energies 14 00920 g004
Figure 5. The impulse response function for the radiation force acting on the buoy under the irregular waves of a wave period of 3.5 s and wave height of 0.75 m. The specific wave spectrum is presented in the sub-plot.
Energies 14 00920 g005
Figure 6. Phase voltage generated from the linear generator model: (a) Comparison of the phase voltage of simulation with the experimental result; (b) a draw-out from (a) with a duration of 5 s. The verification of the WEC model was also published in [12].
Energies 14 00920 g006
Figure 7. Generated power production from the WEC varies with the significant wave height (five cases of energy periods are chosen). Curves with data in grey are physically non-existed in ocean waves.
Energies 14 00920 g007
Figure 8. Generated power production from WEC varied with energy period (five cases of significant wave heights were chosen). Curves with data in grey are physically non-existent in ocean waves.
Energies 14 00920 g008
Figure 9. A three-dimensional map showing that the power distribution varies by sea state.
Energies 14 00920 g009
Figure 10. Power profiles vary with the damping coefficient from 5 to 200 kNs/m with an interval of 5 kNs/m (five cases of sea states are selected for comparison).
Energies 14 00920 g010
Figure 11. Scatter diagram displaying the distribution of optimal damping coefficients corresponding to the sea state from Site 1.
Energies 14 00920 g011
Figure 12. Scatter diagram displaying the distribution of optimal damping coefficients corresponding to the sea state from Site 12.
Energies 14 00920 g012
Figure 13. Scatter diagram on the annual energy distribution of the WEC under optimal control. The energy in each square corresponds to the sea state of Site 1.
Energies 14 00920 g013
Figure 14. Scatter diagram on the annual energy distribution of the WEC under optimal control. The energy in each square corresponds to the sea state of Site 12.
Energies 14 00920 g014
Figure 15. Comparison of the contribution of each optimal damping coefficient to overall annual energy: blue and violet stacks show the number of sea states at Site 1 and Site 12, respectively; the yellow and green stack represent Site 1 and Site 12, respectively; these bars represent the total energy for the corresponding optimal damping coefficient.
Energies 14 00920 g015
Figure 16. Contribution of each optimal damping coefficient to overall annual energy at Site 12. The orange stack and green stack represent the percentage for the energy of the corresponding coefficient toward the overall annual energy production, respectively.
Energies 14 00920 g016
Figure 17. Scatter diagram on the annual energy production for each sea state at Site 1 when the WEC was under a constant damping control of 55 kNs/m.
Energies 14 00920 g017
Figure 18. Scatter diagram on the annual energy production for each sea state at Site 12 when the WEC was under a constant damping control of 55 kNs/m.
Energies 14 00920 g018
Figure 19. A comparison of the annual energy production at Site 1 between two types of damping control: optimal damping and constant damping with a coefficient of 55 kNs/m (the numbers are presented in hundred percentage). Note that the difference was calculated for each sea state by Equation (9).
Energies 14 00920 g019
Figure 20. A comparison of annual energy production at Site 12 by the WEC under two types of damping control status: optimal damping and constant damping with a coefficient of 55 kNs/m (the presented numbers are in hundred percentage). Note that the calculation refers to Equation (9).
Energies 14 00920 g020
Figure 21. Overall annual energy production under constant damping control by varying the damping coefficient from 5 kNs/m to 200 kNs/m with an interval of 5 kNs/m.
Energies 14 00920 g021
Table 1. Wave energy converter (WEC) specifications.
ParameterValue
Generator resistance, R g [Ω] 1 ± 1.5 %
Generator inductance, L g [mH]20
Vertical stator length, l s [mm]2
Vertical translator length, l t [mm]2
Airgap, l ag [mm]3
Translator weight, m t [kg]5000
Buoy diameter, D [m]4
Buoy mass, m b [kg]6300
Table 2. Error analysis of the WEC model with the experimental results cited from [12].
AnalysisValue
Simulated average power, [kW]19.06
Experimental average power, [kW]19.51
Percentage error on the average power, [%]2.33
Standard deviation on average power, [kW]0.46
Standard deviation on phase voltage, [V]16.41
Table 3. Sea states (75 sea states in total) that contributed the most to the total annual energy at Site 1.
Site 1Wave Period
[s]
Wave Height
[m]
Annual Energy
[MWh]
Percentage 1
[%]
14.51.253.8811.80
25.51.753.8711.77
33.50.753.229.78
45.52.252.226.75
54.50.752.036.17
66.52.751.855.63
1 The percentage of overall annual energy.
Table 4. Sea states (31 sea states in total) that contributed the most to total annual energy at Site 12.
Site 12Wave Period
[s]
Wave Height
[m]
Annual Energy
[MWh]
Percentage 1
[%]
13.50.754.9620.74
22.50.253.8716.18
34.51.253.2413.54
44.51.753.1613.22
53.51.251.717.13
65.52.251.697.04
1 The percentage of overall annual energy.
Table 5. Optimal damping coefficients contributed the most to total annual energy.
Site 1Damping Coefficient
[kNs/m]
Sea States
[-]
Energy
[MWh]
Percentage 1
[%]
1551311.4236.40
2752010.2532.69
37044.6814.93
46552.066.56
1 The percentage of overall annual energy.
Table 6. Optimal damping coefficient contributed the most to total annual energy.
Site 12Damping Coefficient
[kNs/m]
Sea States
[-]
Energy
[MWh]
Percentage 1
[%]
17598.8236.87
25576.8128.46
37023.2913.73
44032.138.88
1 The percentage of overall annual energy.
Table 7. A comparison of the overall annual energy between optimal control and constant damping.
Site 1Damping Coefficient
[kNs/m]
Overall Energy under 75
[MWh]
Overall Energy Under Optimal
[MWh]
Percentage 1
[%]
Site 17532.6332.910.8
Site 125523.7623.930.7
1 The percentage of overall annual energy.
Publisher’s Note: MDPI stays neutral with regard to jurisdictional claims in published maps and institutional affiliations.

