1. Introduction
Renewable and energy-efficient energy systems can facilitate decarbonization, generate energy savings and therefore contribute to national, EU-wide and international energy and climate goals. Since the building sector accounts for almost 40% of the final energy consumption in the European Union, this sector holds significant energy saving potential [
1]. The current energy system is undergoing a major transformation from large centralized power plants to smaller, locally distributed energy generation units which are progressively implemented directly in or on buildings to increase shares of self-consumption. With this development, the novel concept of energy sharing/trading in individual buildings as well as beyond the building border, comes into focus. For such a development, adaptions of the existing legal framework are necessary, not the least to enable the establishment of new actors in the energy system and the creation of innovative business models.
The Clean energy for all Europeans package (CEP) [
2] of 2019 introduces prosumers as key players in the future energy system and foresees the establishment of energy communities as a crucial element of a sustainable energy future. Prosumers are understood as end-users that do not only consume energy, but also produce energy themselves. In the CEP, prosumers are referred to as ‘active customers’. Nationally, Austria has already enabled energy sharing between residents of individual multi-occupancy buildings through the amendment of the Electricity Industry and Organization Act (ElWOG) [
3] of 2017. Until 2021, novel legislation enabling energy sharing and trading between residents of multiple buildings is foreseen [
2]. Since investments in renewable or energy-efficient power generation technologies are accompanied with high upfront costs, contracting business models that help to overcome this financial barrier gain importance.
The following
Section 1.1 gives an overview of the current state-of-the-art concerning energy sharing between building residents and energy contracting. Furthermore, the objective of this work and its progress beyond the state of the art are outlined in
Section 1.2.
1.1. State-of-the-Art in Literature
The increasing application of renewable and decentralized energy technologies in/on buildings leads to the necessity of research concerning economic competitiveness, technical feasibility and the regulatory framework. Both energy sharing between building residents and energy contracting trigger new business models and thus enhance decarbonization by facilitating broad applicability of local energy usage in buildings and neighborhoods. Since this work focuses on energy sharing and different types of energy contracting, the provided literature review addresses recent studies concerned with these topics.
1.1.1. Sharing Concepts in Energy Communities
The changing legislative landscape in (European) countries leads to an increased application of energy sharing concepts in apartment buildings and urban neighborhoods, opening a novel business segment for energy contractors. There exist multiple options of energy sharing, although PV electricity sharing is by far the most common application. In the following, a selection of recent literature concerned with PV electricity sharing is provided. Additionally, recent articles focusing on energy sharing in general are discussed.
PV Electricity Sharing
PV electricity sharing enhances self-supply, while contributing to an increase in the shares of renewable generation and leading to financial benefits for building residents [
4]. Various business models for PV systems in multi-apartment buildings are discussed in [
5]. Different nuances of PV electricity sharing in districts and energy communities are analyzed in various studies such as [
6,
7,
8,
9,
10]. Despite various positive aspects of PV sharing concepts, such as self-sufficiency and financial benefits through increasing self-consumption, they still face multiple legal and technical barriers which are discussed in [
11]. The barriers include the either rigid or fast-changing regulatory framework conditions and power grid constraints. More specifically, policy and market challenges as well as financial support instruments for building PV systems are examined in [
12]. Business models for the deployment and operation of customer-sited PV systems by solar firms are compared in [
13].
General Energy Sharing
More generally, refs. [
14,
15] examine local energy sharing concepts for energy from cogeneration plants within mixed-usage buildings and communities. In [
16], the profitability for various heating systems in addition to electricity sharing is investigated. Various renewable energy technologies for community-level energy sharing are compared in [
17,
18]. Technical realization of energy sharing concepts is discussed in [
19], whereas [
20,
21] focus on implementation concepts and business models. One step further taken in [
22], where policy aspects for increased application of energy communities are investigated. From a social point of view, the effects of energy sharing are highlighted in [
23].
1.1.2. Energy Contracting
Energy contracting can be understood as a contractual energy service arranged between a building owner/building residents and a service provider (contractor) with the aim of reducing energy consumption and energy costs. Two main forms can be distinguished:
Energy performance contracting (EPC) aims at optimizing the energy system (energy generation and consumption), where energy savings are contractually guaranteed within a set time period. Upfront investment costs, as well as maintenance costs are refinanced by annual energy cost savings. Additional savings can be considered as a profit for the building owner/building residents [
24,
25,
26].
Energy supply contracting (ESC), in contrast, is an energy service, where the contractor is responsible for the planning, financing, construction, operation, maintenance and/or fuel purchase of the energy system. Costs (for service and investments) are refinanced through the sale of energy (e.g., heating, cooling, electricity, vapor, compressed air) to the building owner/building residents [
24,
25,
26].
There also exist mixed forms of energy contracting and altered concepts such as plant contracting (technical facility management) and financing contracting. However, these forms of contracting are not addressed in the following literature review.
Energy Supply Contracting
There exist limited research and literature concerning ESC models due to the just enacted legal changes enabling these concepts. Barriers of energy contracting in general and how ESC can reach broader application in this context are investigated in [
35]. Barriers for the application of the concept can include the administrative burden, inefficiencies throughout the contracting period and the functionality of the contracted equipment, as well as legal constraints. Nevertheless, as discussed in [
36], ESC can significantly reduce energy costs while contributing to energy efficiency and renewable energy targets. Similarly, Reference [
37] recommends policy actions to achieve ESC implementation. Combined application of EPC and ESC in public, residential, commercial and industrial buildings is presented in [
38]. Renewable energy business models for utilities on customer-properties are discussed in [
39].
1.2. Progress beyond the State-of-the-Art
The conducted literature review shows that existing studies focus mainly on (PV) electricity sharing, while less attention is paid to other electricity generation options and heating technologies. Additionally, while a major research emphasis concentrates on EPC, few studies have been conducted examining the profitability of ESC, especially concerning electricity supply.
The work described in this paper focuses on ESC and examines multiple business models for a diversity of contractor constellations. For all business cases, the key factor ‘profitability of the contractor’ is examined in detail because of its significance for a broad application of the concept. Being of similar importance, the economic viability for the building residents and building owner(s) is also taken into account. Therefore, the objective of this paper is to analyze the profitability of a selection of contracting business cases for both the contractor and the residents. ESC models are investigated within the scope of the novel concept of energy communities and thus bridge the gap between two different fields of research. In this work, the definition of energy communities includes energy sharing between multiple private and commercial residents within a neighborhood. In order to determine the profitability of different energy sharing concepts and investment decisions within the examined energy community, a mixed-integer linear optimization model is developed. Results are provided for a small-scale neighborhood of a residential building, a school building with a swimming pool and a commercial building including a supermarket. For the possible installation of electricity and heat generation technologies in/on the buildings, a solar photovoltaic (PV) system, a heat pump (HP) and a mini combined heat and power unit (mCHP) are considered. Additionally, two default heating systems (gas and district heating) are compared in terms of profitability. The objective is to achieve results, which allow derivation of recommendations and action plans for policy/decision makers as well as for contractors and clients. The innovation of this study therefore is the cross-domain and hence holistic consideration of energy contracting for renewable and energy-efficient technologies in the framework of energy communities, while exploiting energy demand synergies between residential, commercial and public buildings.
The paper is structured as follows:
Section 2 introduces the energy community configuration and the developed optimization model. Results and sensitivities elaborating on the profitability of the business cases are portrayed in
Section 3.
Section 4 provides a conclusion and an outlook for further research.
2. Materials and Methods
In the following, the energy community configuration and the contracting business cases are introduced. In
Section 2.1, the default settings of the buildings are presented.
Section 2.2 gives an overview of the examined contracting business cases in this work. Selected energy technologies and costs are shown in
Section 2.3. Following the presentation of the business cases, the developed optimization model and its mathematical formulation are outlined in
Section 2.4.
2.1. Buildings’ Default Settings
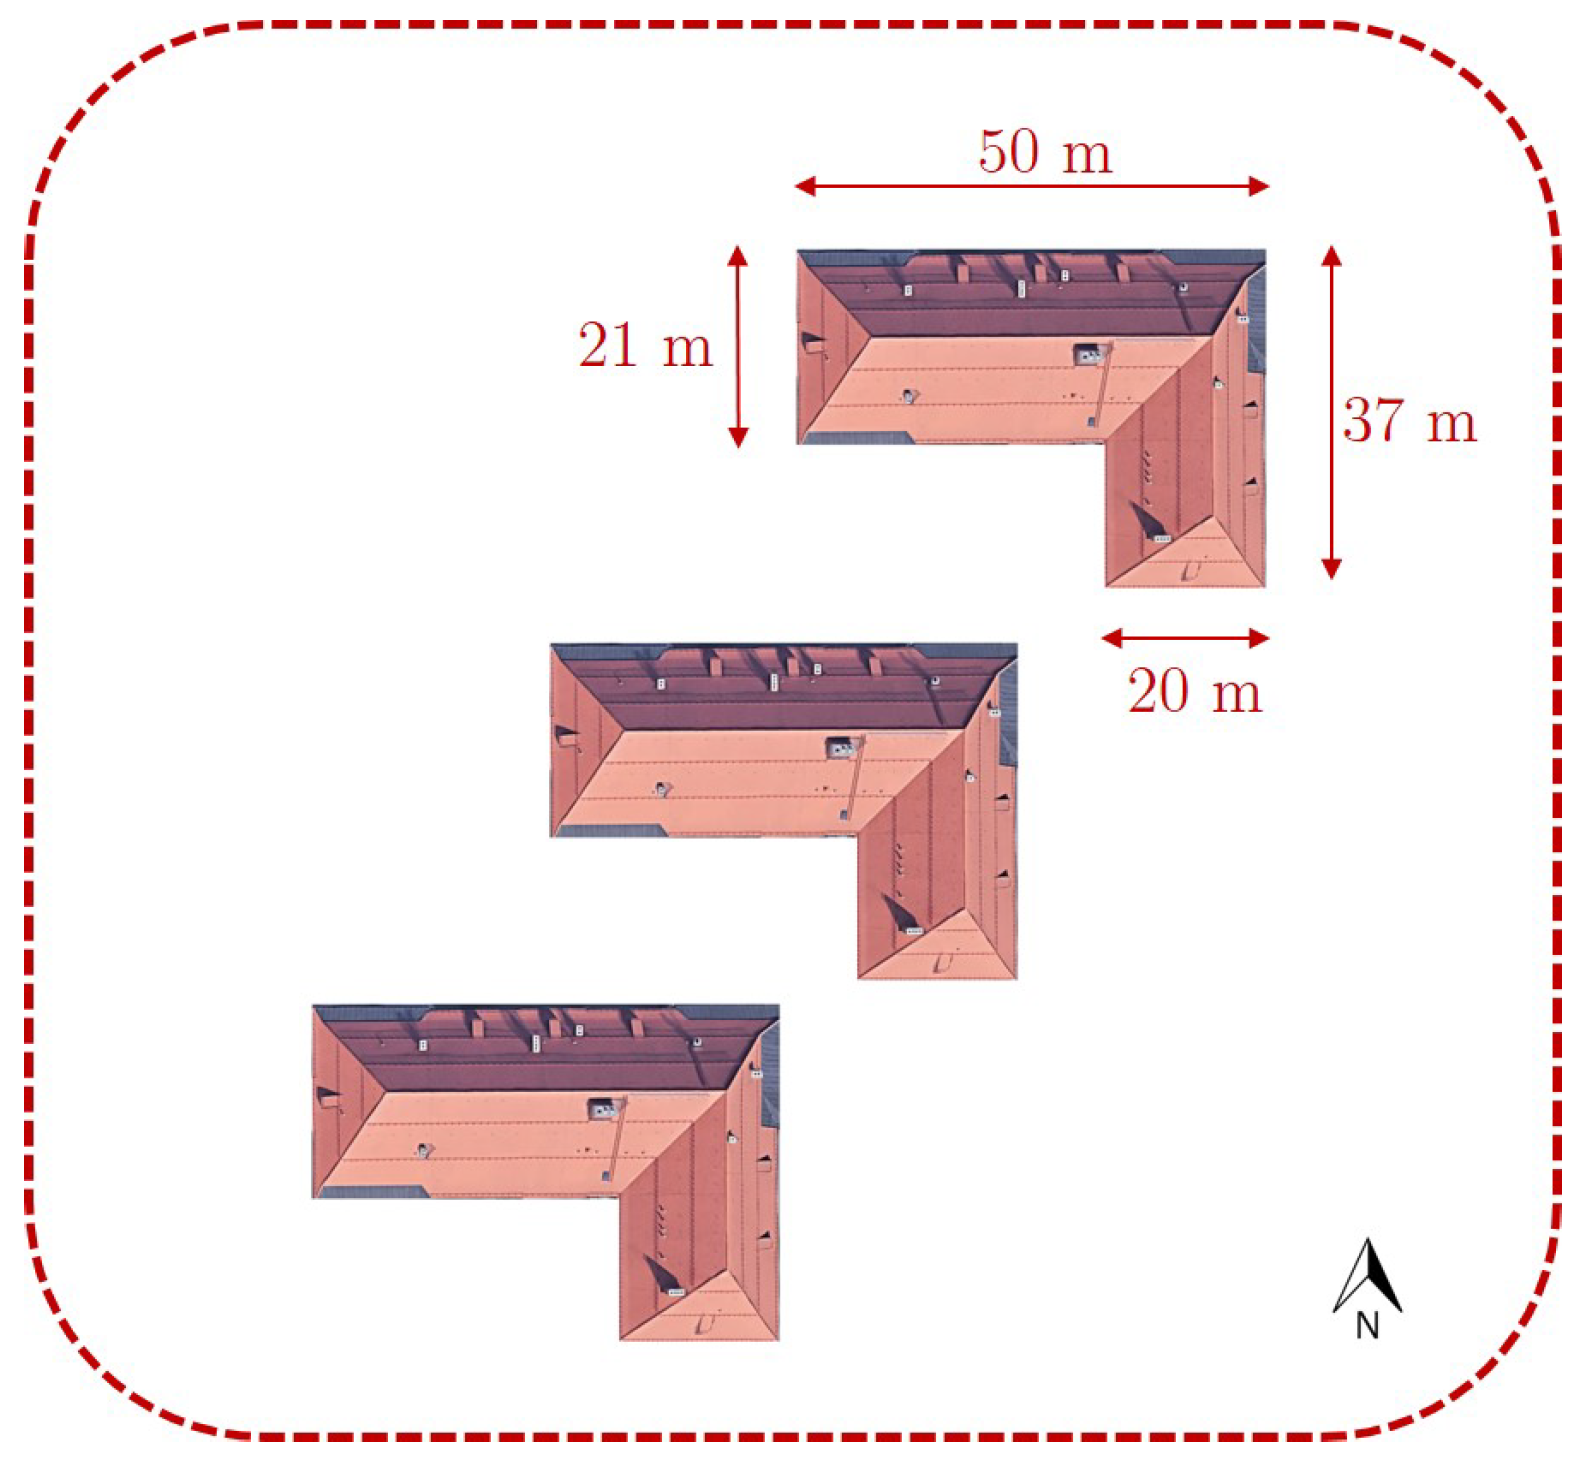
A neighborhood energy community consisting of three identical buildings—in terms of area, shape and orientation—is assumed for the following analyses. The first building is a residential building, the second building hosts offices along with a supermarket and the third building is a school building including a swimming pool (see
Figure 1). The net floor space of each building is approximately 7000
, resulting in 70 housing units of about 100
each for the residential building. The structure of each building is derived from [
40].
The annual electricity and heating demand of the buildings are listed in the following
Table 1.
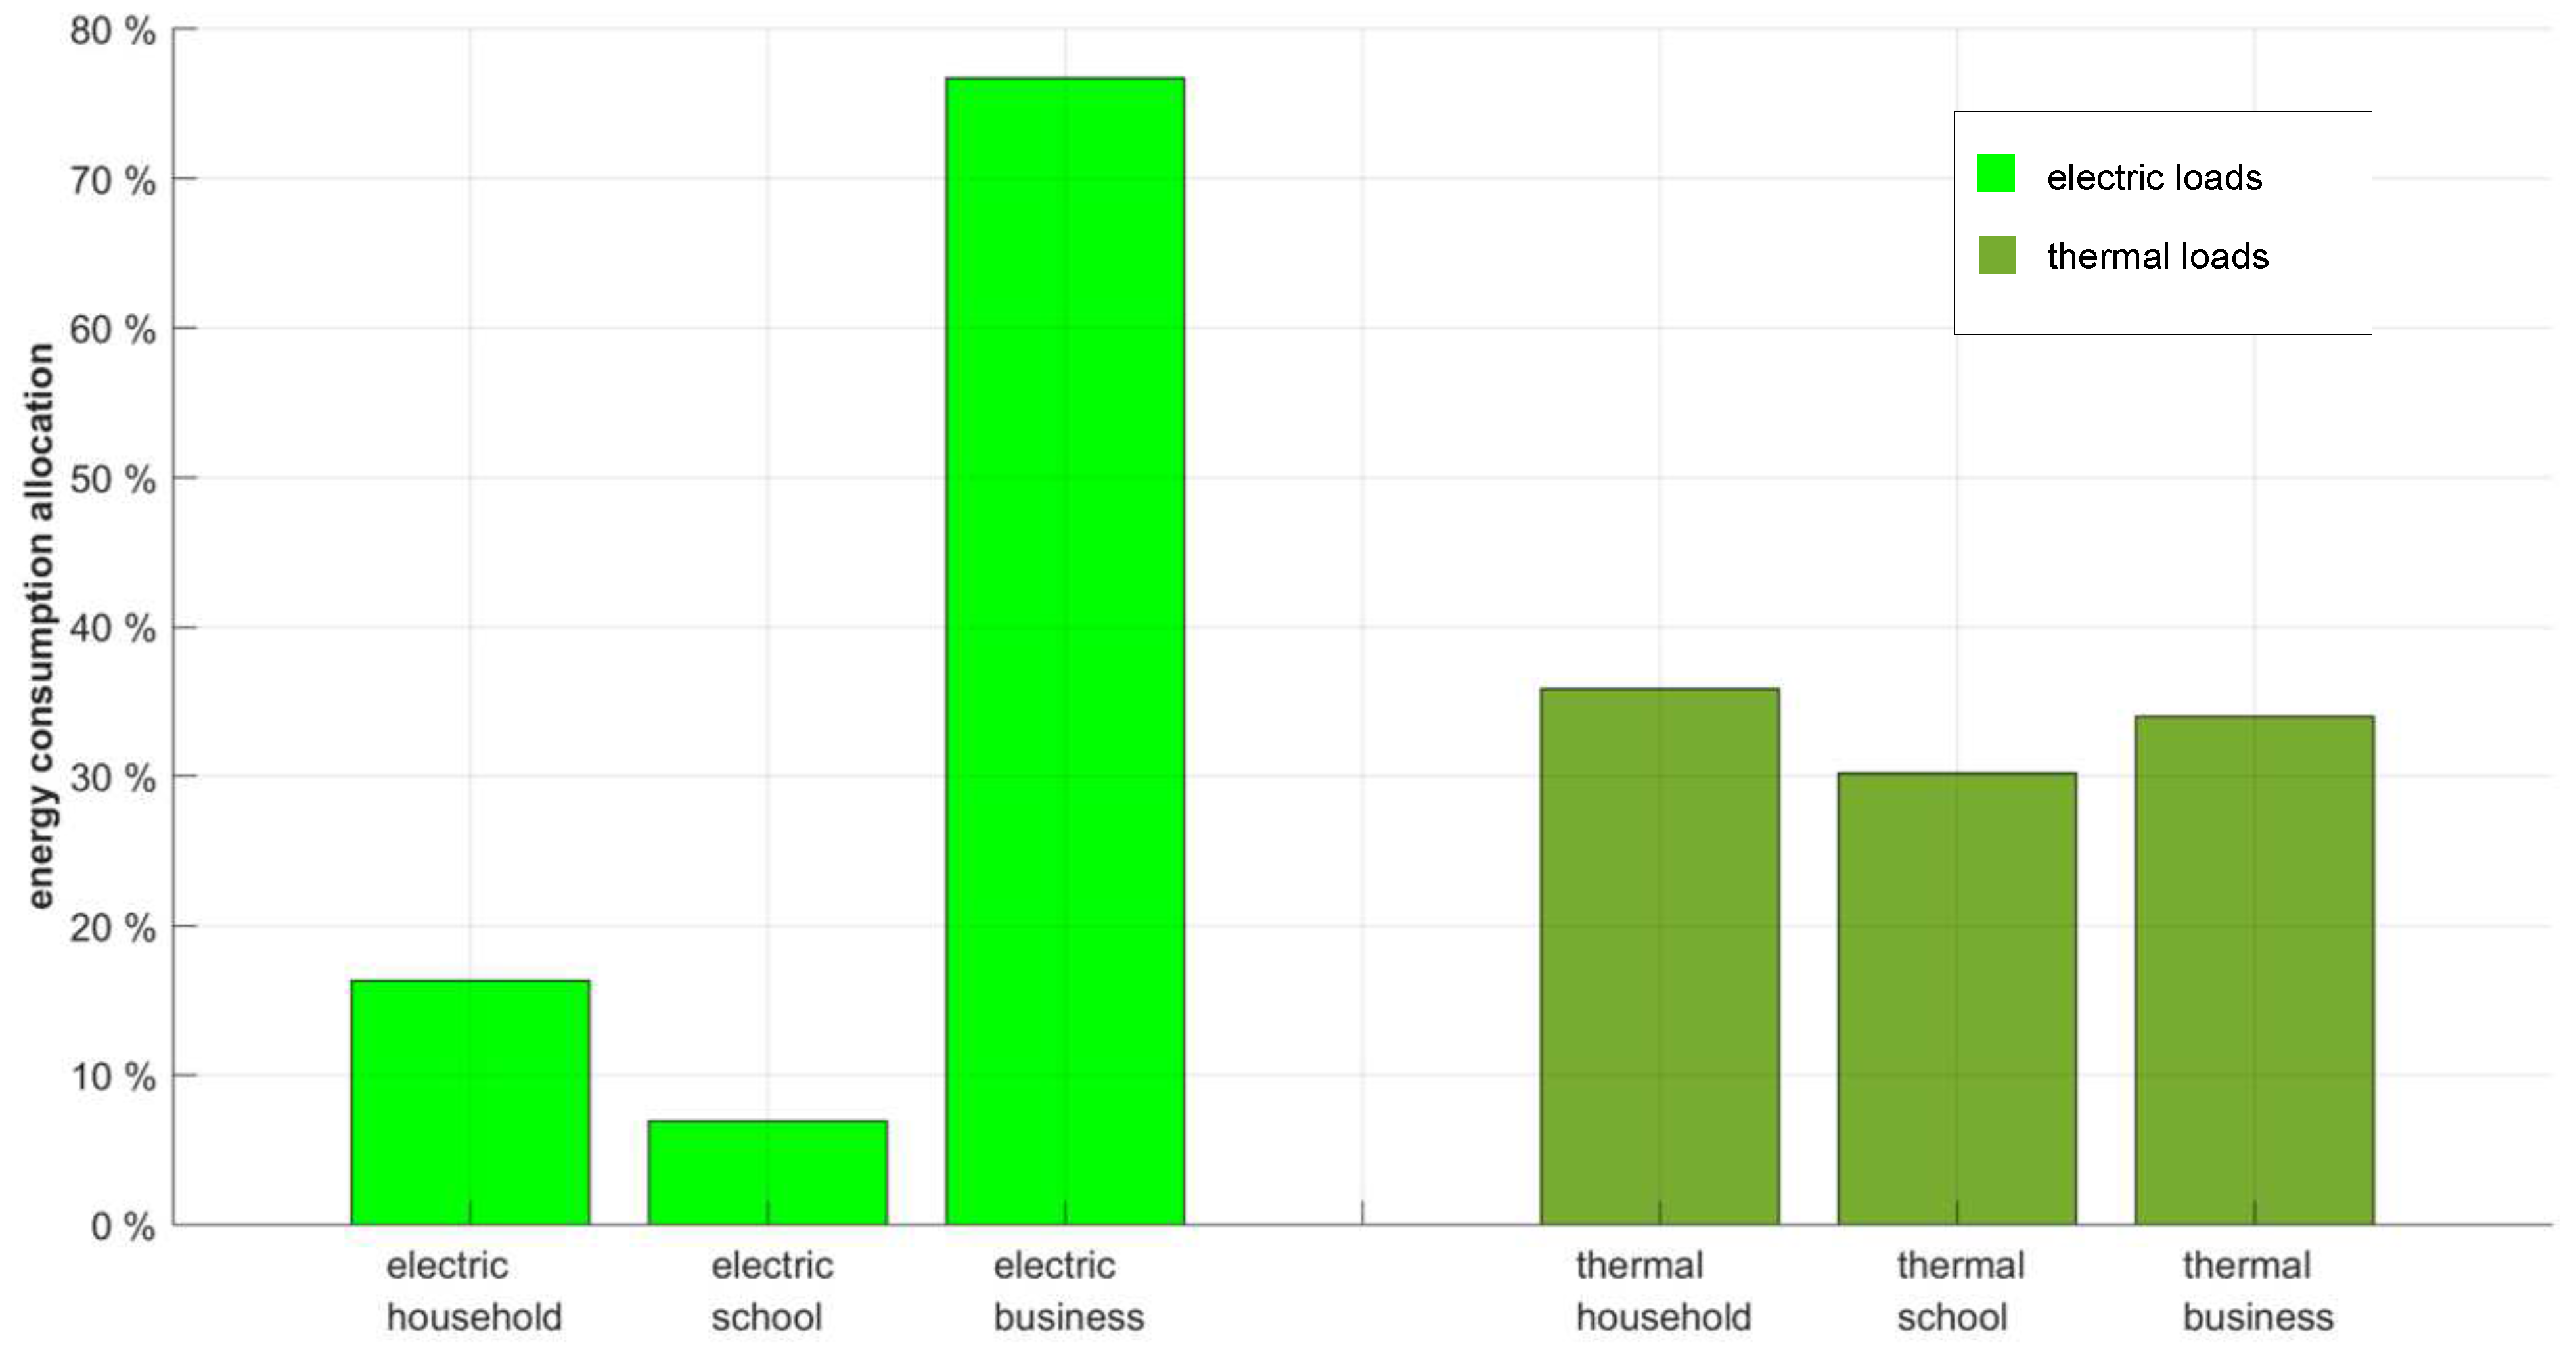
Figure 2 shows the allocation of electricity and heat consumption per building. A graphic representation of annual electricity and heat load profiles for the buildings can be found in
Appendix A.
2.2. Contracting Business Cases
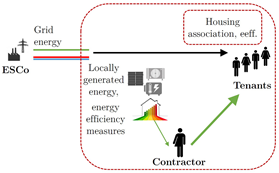
In the examined business cases, a housing association, an external contractor (third party) and an energy cooperative as contractors are compared. For the housing association, a variation of possible contracting models are investigated (see housing association in
Table 2). A housing association is not actually a ‘contractor’ by definition, but has the opportunity to provide the energy system, can make use of energy sharing models and is therefore also considered as a certain kind of contractor in this study.
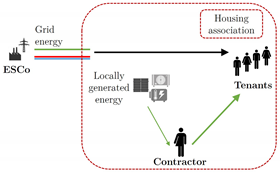
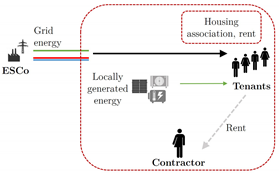
In comparison to the default contracting case of ‘Full Contracting’ (financing, installation, operation and maintenance of the local energy system), the housing association could also finance their investments in renewable and/or energy-efficient energy systems for the buildings by increasing the residents’ rent in order to facilitate billing processes (this business case is referred to as ‘Rent model’). In other words, the resident pays for renting parts of the electric and thermal energy system for ‘self-supply’. The residual energy needed to meet demand is supplied by the gas and electricity grid and is paid by the residents separately.
Additionally to the presented ESC considered in the ‘Full Contracting’ and ‘Rent model’ cases, the housing association could also apply energy efficiency measures in/on the buildings, leading to lower heat and electricity loads (see
Table 2). The financing of the investments is then not only guaranteed through selling locally generated energy to the residents, but additionally by the possibility of raising the energy costs. The investigated energy efficiency measures include additional building insulation as well as efficient LED lighting, leading to respective heat and electricity load reductions of 22% and 4%. This business case is referred to as ‘Full Contracting with energy efficiency measures’. The considered costs for the energy efficiency measures are listed in
Appendix B.
Furthermore, business cases for an external contractor and an energy cooperative are examined. The business case of the ‘external contractor’ investigates profitability for contractors that expect a high return on investment and a low depreciation time of the energy systems. In this specific case, the optimization model is adapted to maximize local energy self-supply, since contributing to the energy transition is often the key goal of such cooperatives (see, e.g., [
48]). The cash flow configuration for both the external contractor and the energy cooperative is equivalent to the one for the housing association’s ‘Full Contracting’ case (see
Table 2).
Table 2 lists the examined business cases compared within this work along with the main characteristics and the contractor’s cash flows of each case, while assumptions, such as interest rates (
i) and depreciation times (
n) are presented.
For all examined business cases, the residual grid electricity and grid gas is paid by the residential and commercial residents separately, which means that they have contracts for the residual grid energy with energy providers of their choice. Additionally, it is assumed in all business cases that the buildings have a connection to both the gas grid and the DH grid at all times, while only one of the systems covers the residual heat demand that is not met by local energy generation. The connections to the gas grid and the DH grid ensure the possible feed-in of surplus heat (from HP and mCHP generation) into the DH grid, while simultaneously enabling the operation of the gas-powered mCHP system in all cases. Furthermore, excess electricity and heat fed into the electricity grid and heating grid, respectively, are not remunerated.
2.3. Technology Set-Up and Cost Assumptions
Different energy generation technologies can be installed locally by the optimization in order to supply the previously defined energy community of three buildings (see
Section 2.1). The optimization determines the optimum capacities of 30
-tilted building-attached PV (BAPV) systems on the buildings’ roof in all cardinal directions, 90
-tilted building-integrated PV (BIPV) systems on buildings’ facades, a gas-fired mini combined heat and power (mCHP) unit and an air-to-water heat pump (HP) system for each business case.
The following full load hours (kWh/kWp) are assumed for the PV systems (see
Table 3), whereas the generation profile data are acquired from [
49].
Table 4 shows the investment costs (
), installation costs (
), maintenance costs (
) and the maximum installable capacities (for PV in all cardinal directions) for the local installable energy technologies:
The assumed grid electricity and gas/heat costs (
), costs for grid connection (
) and maintenance costs (
) paid by the contractor or the residents, as well as the contractor’s revenues for selling local energy to the building residents (
) are listed in
Table 5. The locally generated energy is sold to the building residents at 90% of the costs for energy from the grid in the majority of the examined business cases. For the business cases ‘Rent model’ and ‘Full Contracting with energy efficiency measures’ (see
Section 3), the costs for locally generated energy are determined by optimization. In these business cases, the building residents pay a sum (added to their monthly rent) to the contractor which still ensures energy cost savings of at least 10% in total. This maintains linearity of the optimization. Excess electricity and heat fed into the respective grids are assumed to be not remunerated.
The optimization determines whether individual generation technologies are installed, whereas the model selects only technologies that are profitable. This means that if it is not profitable to install a certain technology, the optimization determines the optimal technology capacity to be zero. Moreover, central gas heating and district heating (DH) are compared as default heating technologies to cover the residual heat demand that is not met by local energy generation. This comparison is made for the first business case of ‘Full Contracting’ of the housing association. It is examined, how the default heating system affects the profits for contractor and residents. Even though only one of the heating systems is used to cover the residual heat of the energy community residents, it is assumed that the buildings have a connection to both the gas and the DH grid at all times to operate the energy system.
2.4. Analytical Approach and Model
The developed optimization model is a mixed-integer linear program (MILP) coded in MATLAB [
63]. YALMIP is used as an optimizer and Gurobi as a solver [
64,
65]. A MILP optimization approach is used due the possible representation of the complex problem of variable technology capacities, with taking into account binary variables for the technologies under consideration. The computational time for the different optimizations lies between 30 min (default ‘Full Contracting’ case) and 3 h (for the ‘Rent model’ and ‘Full Contracting with efficiency measures applied’).
In the following
Section 2.4.1 the flow chart of the model is depicted and explained. In
Section 2.4.2, the objective function and the main constraints for the optimization are presented.
Section 2.4.3 presents the model’s validation.
2.4.1. Flow Chart
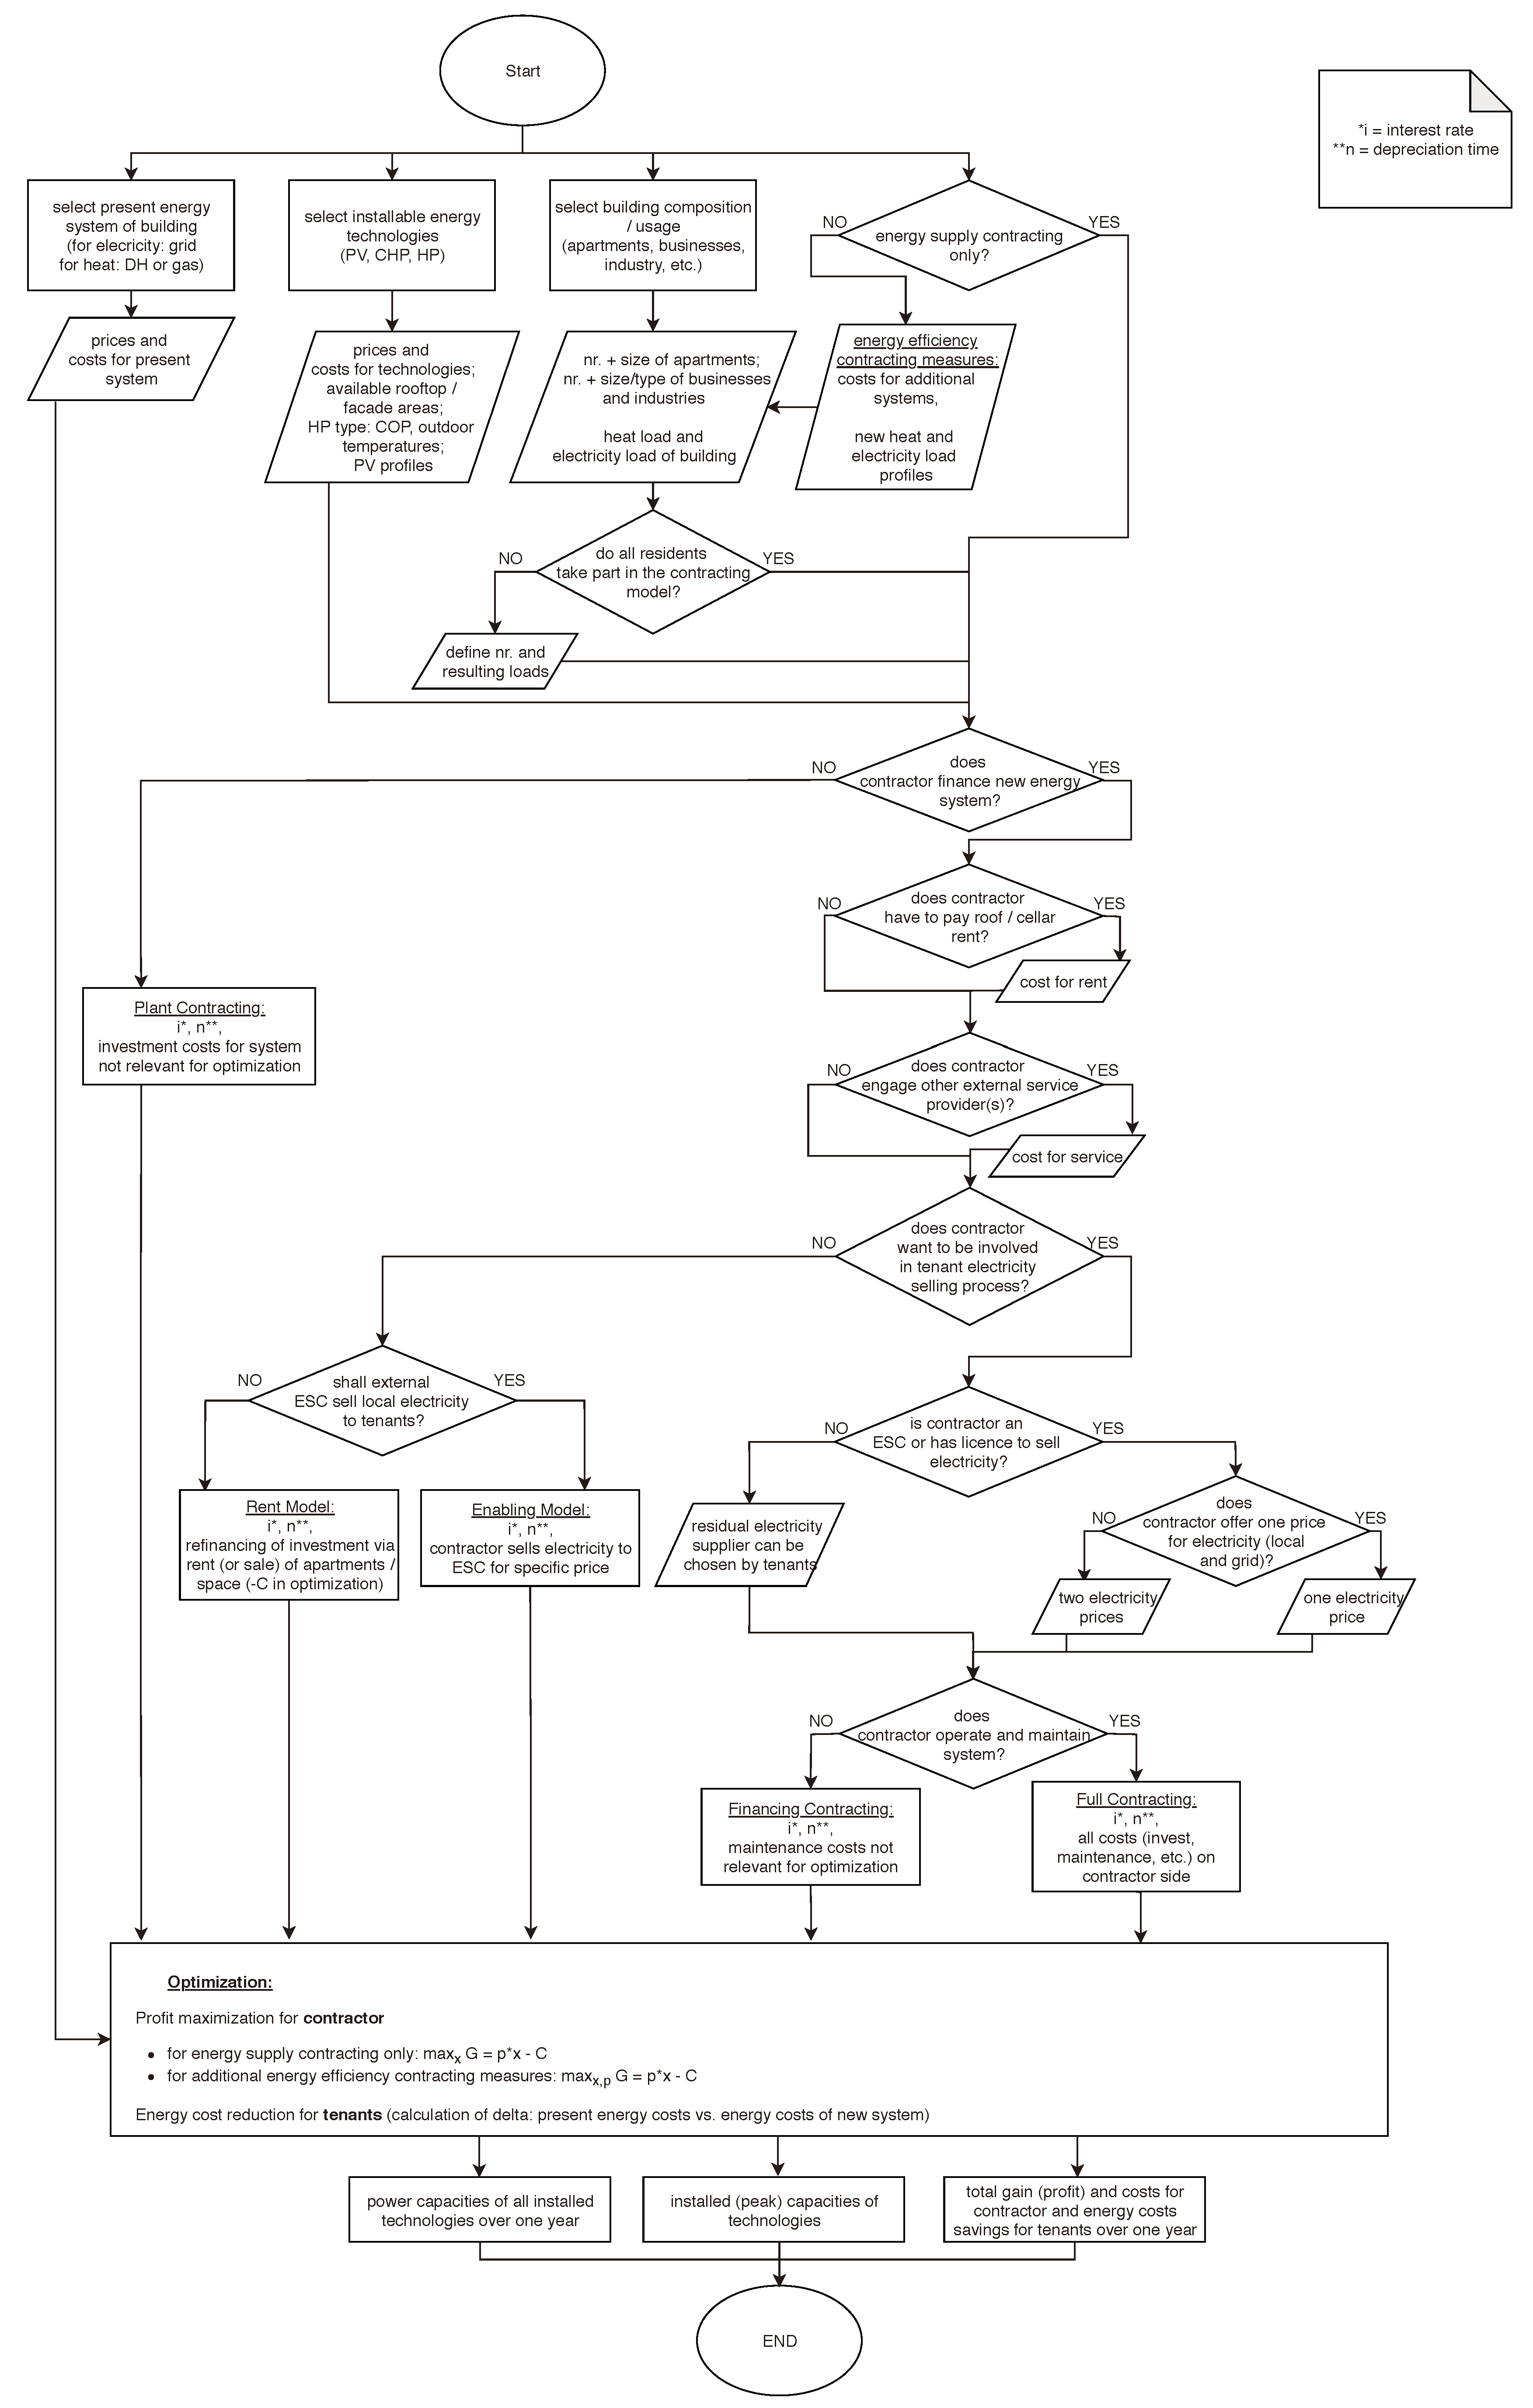
The flow chart (
Figure 3) provides an overview of the model’s sequence. The following steps can be distinguished:
Selection of the present energy system, the energy technology options considered for installation, the building composition and the type of energy contracting.
Determination of the contracting business case.
Optimization with the objective of maximizing the contractor’s profit, simultaneously providing a minimum of 10% reduction in energy costs to the residents.
2.4.2. Objective Function and Major Constraints
This section provides the equations and constraints for the default contracting business cases of the developed optimization model. The model maximizes the contractor’s financial gain (
G), referred to as profit, as given in Equation (
1). Solely for the business case of an energy cooperative (see Section (
Section 3)), the objective function is adapted to maximize local energy self-supply. The profit consists of the revenues for locally generated electricity (
) and heat sold to the building residents (
), diminished by variable and fixed costs (
and
).
The revenues for the selling of locally generated electricity and heat consist of the generated energy (as power in a specific time step
and
) and the connected grid capacities (
and
), multiplied with the energy component (
,
) and the power component of the energy costs (
,
), respectively (see Equations (
2) and (
3)). Solely for the business cases ‘Rent model’ and ‘Full Contracting with energy efficiency measures’ (see
Section 3), the contractor’s revenues for electricity and heat are not determined as power over a time period multiplied with the respective energy costs. Contrarily, the building residents pay a sum (added to their monthly rent) to the contractor which still ensures energy cost savings of at least 10% in total. This methodology is chosen in order to maintain linearity of the optimization model.
The variable costs (Equation (
4)) that need to be paid by the contractor consist of the grid electricity and gas to operate the HP and mCHP system. These costs are calculated by the grid power and gas (
) multiplied with the respective costs for each time step (
).
The contractor’s fixed costs are comprised of the electric and thermal connection capacity costs for grid energy to operate the local energy system (as capacity
multiplied by price
), the maintenance costs of the neighborhood energy system (
) and the investment costs for the PV, HP and/or mCHP system (investment costs
and annuity factor
), as can be seen in Equation (
5). The investment costs for the local energy technologies are taken into account through annuities (with different depreciation times per business case).
In the following, the most important constraints of the optimization model are shortly described (a comprehensive description of the model is provided in [
66]).
Energy costs of building residents have to be reduced by a minimum of 10% compared to the case with no local energy technology installations.
The electric and thermal load of the neighborhood as a whole has to be met at all times by some combination of local generation or grid supply.
The generated local electricity can be used to cover the electricity demand, supply the heat pump or can be fed into the electricity grid.
The generated local heat can be used to cover the heating demand or can be fed into the DH grid.
Electricity from the grid can be used at all times to supply the residual electricity load or the HP system.
Gas from the grid can be used at all times to supply the residual heat load or the mCHP system.
HP power is calculated by the electricity supply for the HP system multiplied by an outside-temperature-related coefficient of performance (COP).
Electric and thermal mCHP power is calculated by the gas supply for the mCHP system multiplied by the respective electric or thermal efficiency, respectively.
Additionally, non-negativity and maximum capacity constraints are taken into account.
2.4.3. Model Validation
For validation of the model, the electricity and heating technologies were added consecutively, whereas results were examined for each technology and technology-combination separately. All results have been compared with available real-world data and have been subject to sensitivities and varying data sets. Moreover, prices were set to significantly higher and lower values. This demonstrated that no technology capacities were determined in the case of high technology and local energy prices. Vice versa, the maximum possible capacities were determined when prices were set to minimum values.
3. Results
In the following sections, the results of the different business cases for a housing association (
Section 3.1), an external contractor (
Section 3.2) and an energy cooperative (
Section 3.3), respectively, are examined. The investigated business cases are described in
Table 2. Furthermore, a comparison of different default heating systems for residual heat supply is presented for the housing association’s ‘Full Contracting’ case (see
Section 3.1.1).
Section 3.4 gives a comparison of the results, while
Section 3.5 examines the main sensitivities of the model.
3.1. Housing Association
3.1.1. Full Contracting
In this case, the contractor’s profit is mainly generated by selling electricity to the building residents. Based on competitive electricity generation costs with PV and mCHP, high profits can be generated even at a selling price 10% below conventional grid costs. The contractor’s profit for electricity is highest in summer, when PV electricity generation is at its maximum, along with the electricity load due to electric cooling of the business building. The locally generated heat from HP production increases profitability, when locally generated electricity instead of grid electricity is used for operating the system. Contrarily, selling heat generated by an mCHP to the residents at a price that is 10% lower than gas grid costs lowers profitability. This is mainly due to the fact that the mCHP is operating electricity-driven. Nevertheless, the installation of an mCHP system is highly profitable due to electricity generation. The contractor’s revenues for heat are highest in the winter, when the heating demand of the neighborhood rises.
The residents’ total energy cost savings are comparably stable throughout the year, while the savings in summer are mainly based on electricity, and in winter on heat. This can be explained by the possibility to generate cheap electricity in summer through local PV (and also mCHP) generation.
The profit for the housing association and the residents’ energy cost savings are given in
Section 3.4, for comparative purposes. The optimal installation capacities of the local energy technologies are depicted in
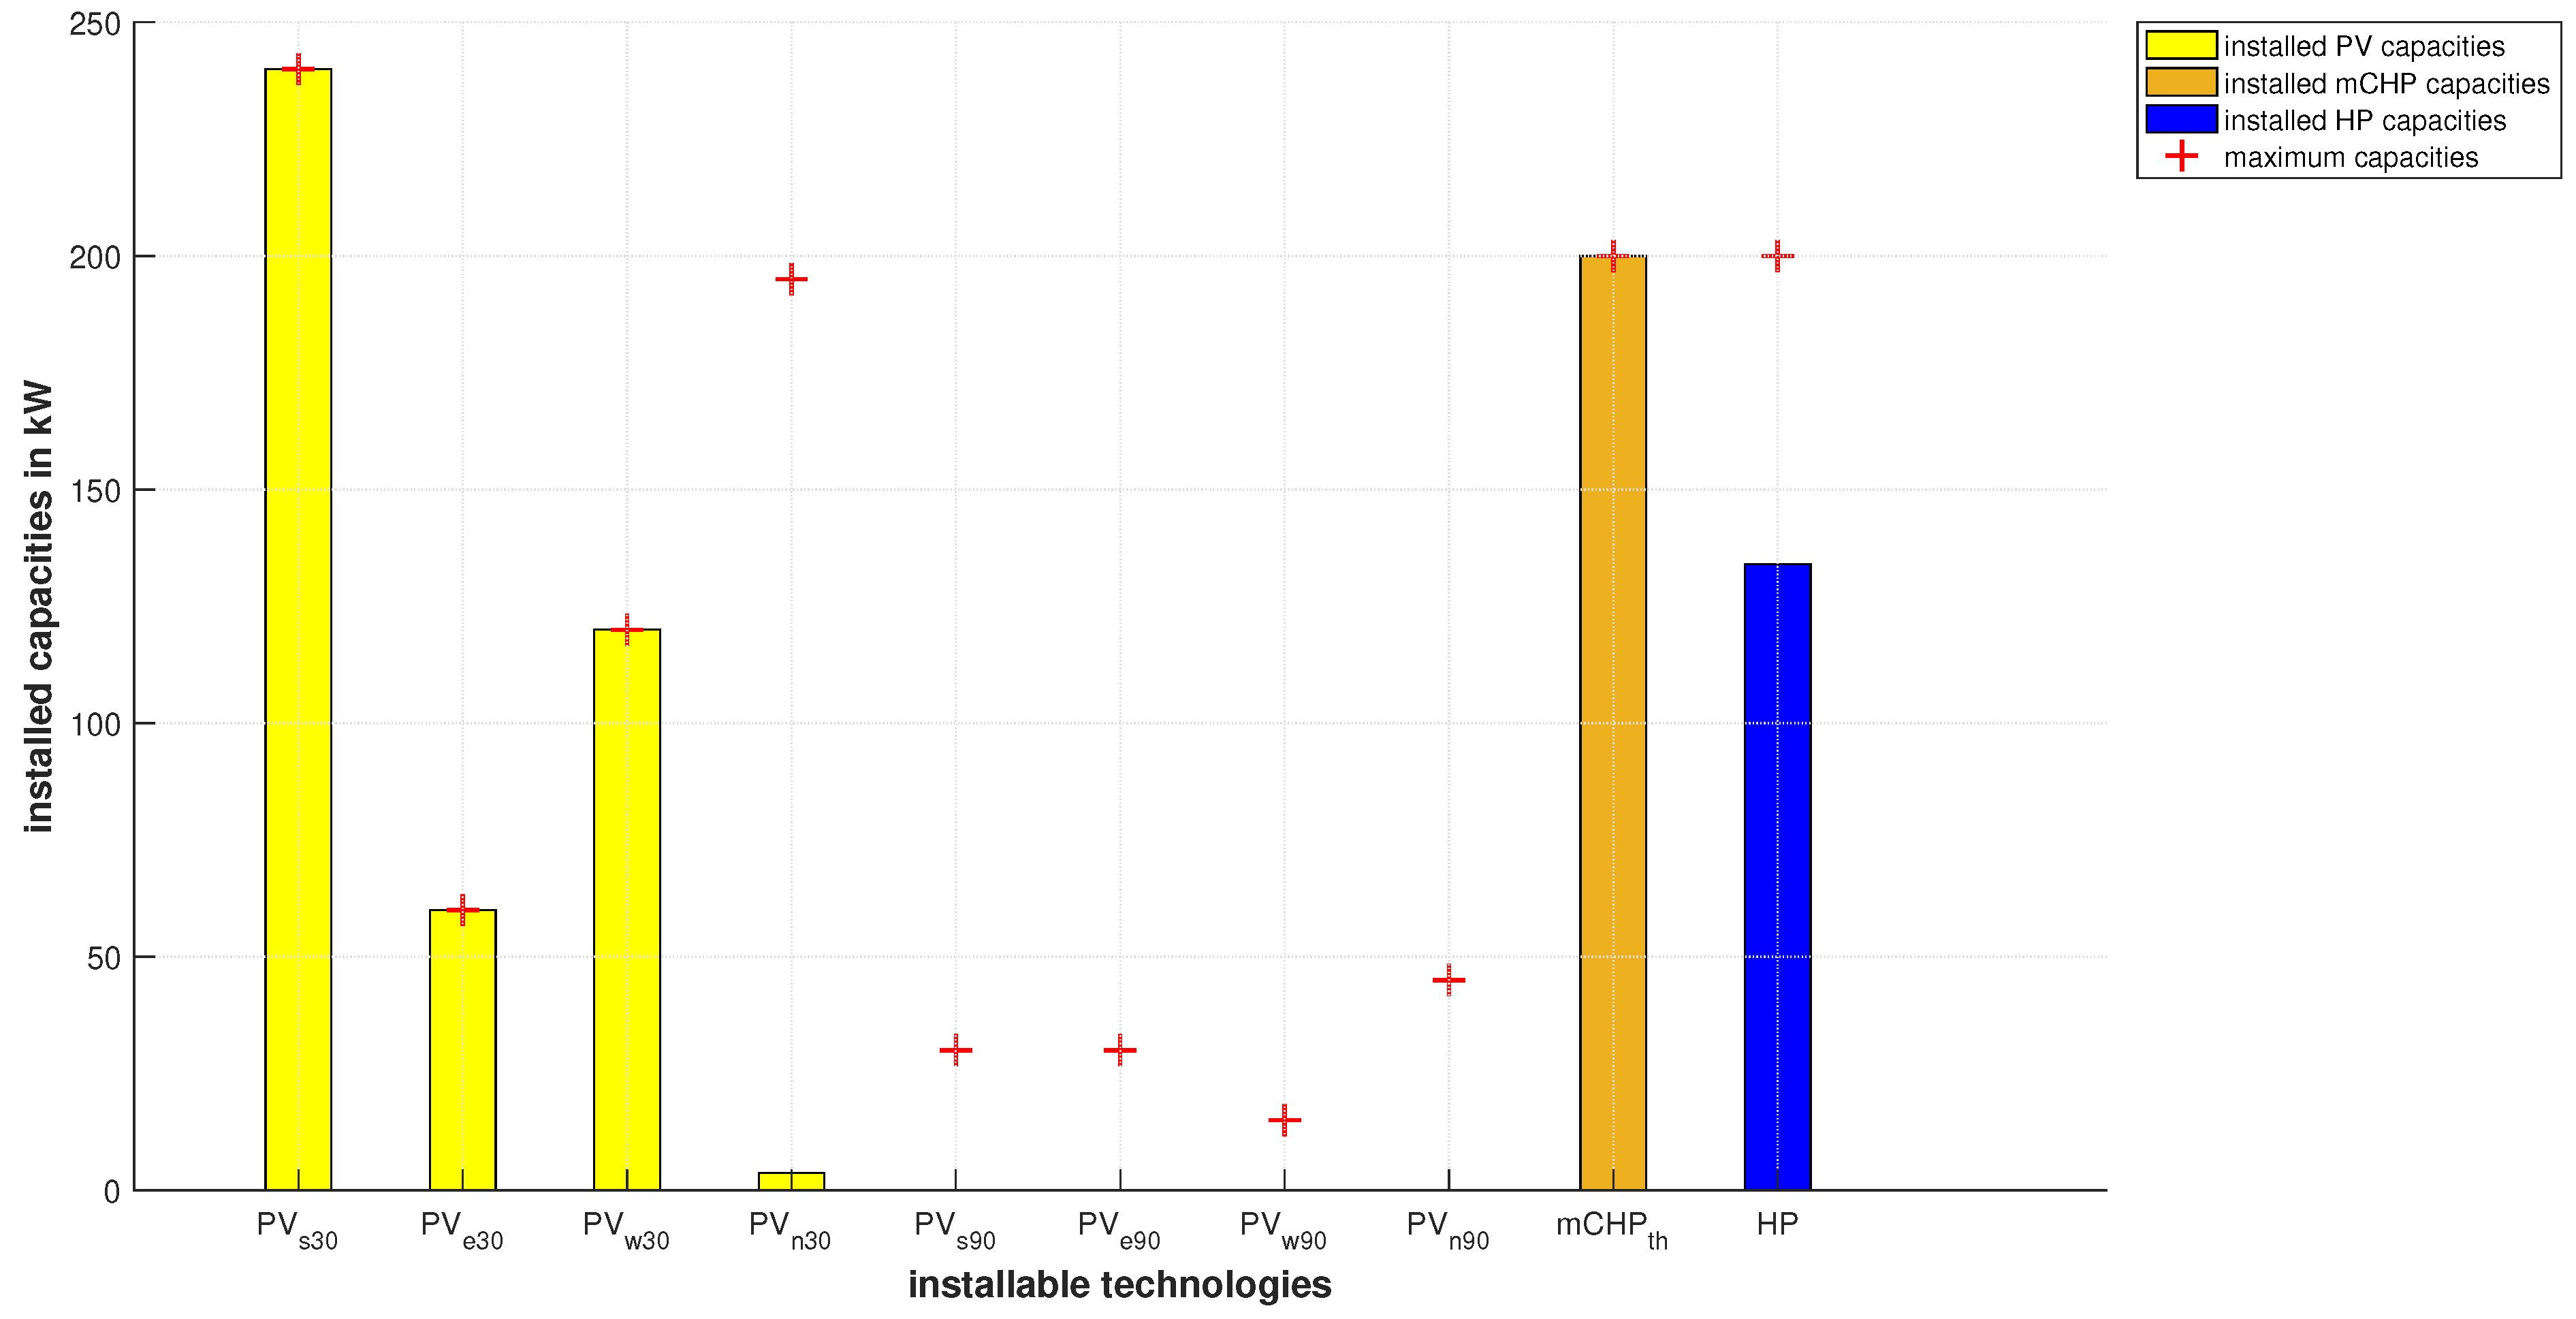
Figure 4. The available southern, eastern and western rooftop areas are entirely covered with PV. Additionally, 5 kWp of PV are determined optimal for installation on the northern roofs. The mCHP system is determined to be installed at maximum capacity ( 200 kWth), while 135 kW of HP capacity is installed. BIPV installation on the buildings’ facades is determined to not be profitable.
Additionally, it is examined how different default heating systems affect the profits for contractor and residents.
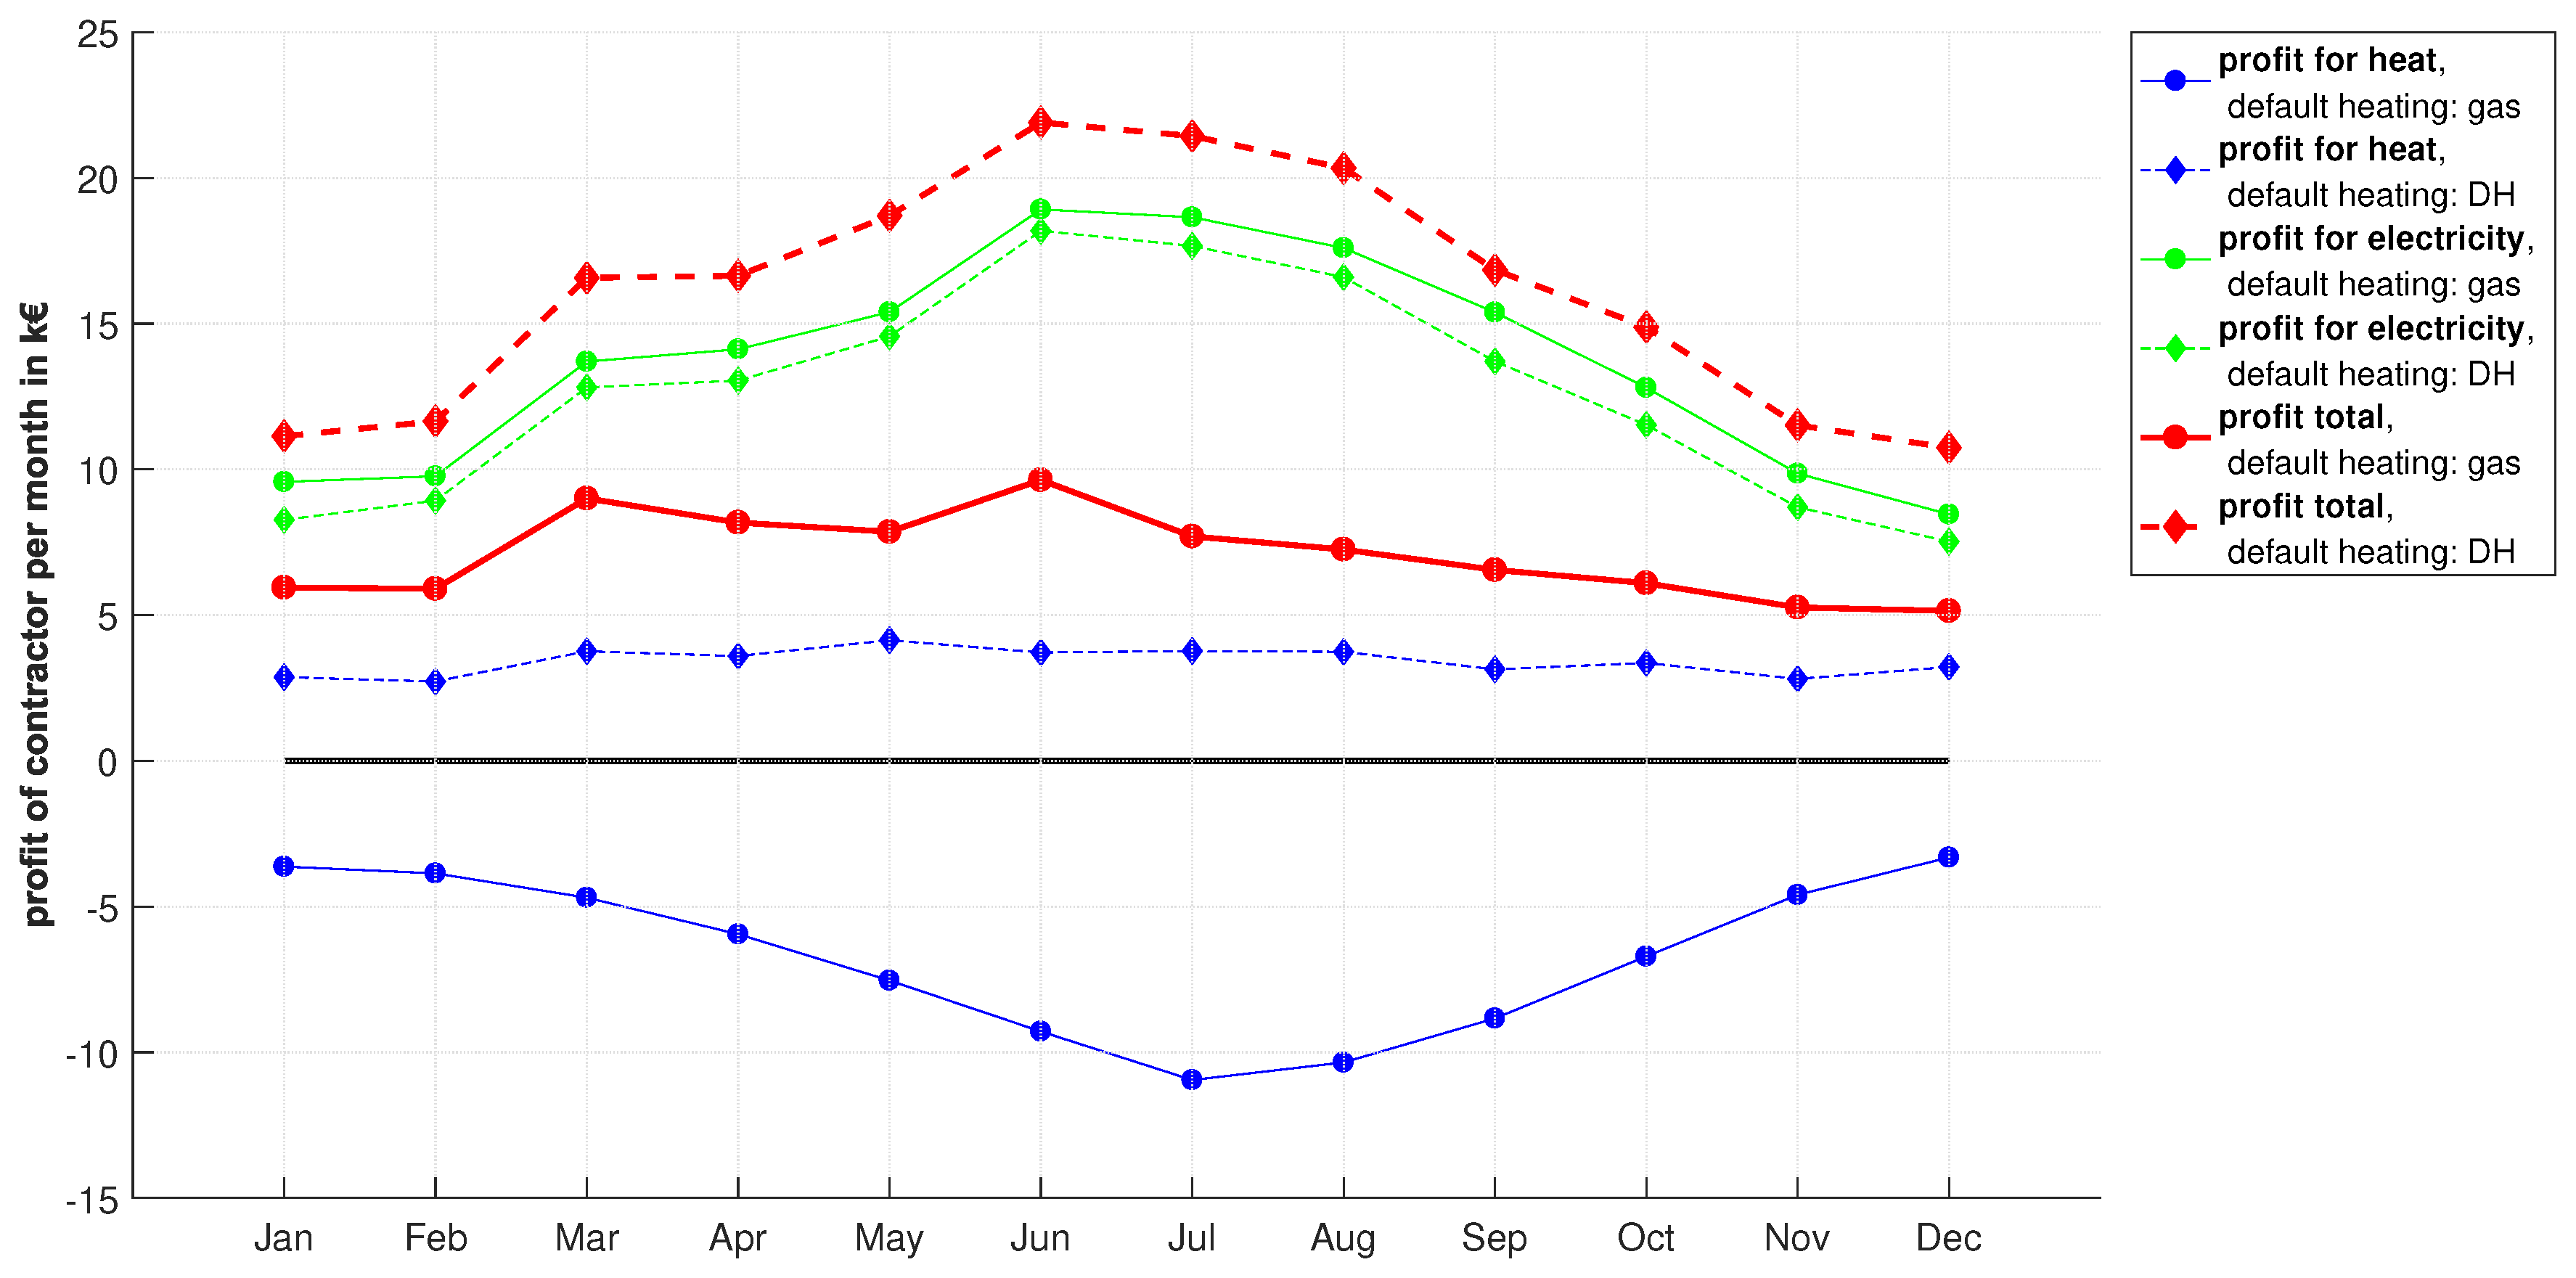
Figure 5 shows a comparison of the contractor’s potential profits for the two options of a gas and a DH system available to cover the buildings’ residual heat load. The comparison depicts that the low gas costs mitigate the profitability of the considered local heating technologies, leading to reduced profits for the contractor compared to using a DH system. Contracting is significantly more profitable for the case of a DH system covering residual heating demand. This is due to the increase in profitability for the local mCHP system that is powered by cheap gas. Larger HP capacities are installed if DH is the default heating system because the contractor can sell locally generated heat more expensively in comparison. However, this increases the cost of electricity for the contractor, which results in slightly lower revenues for electricity (see
Figure 5). When comparing the resident’s energy cost savings, results show that a 10% cost reduction for locally generated energy compared to grid energy leads to higher savings for a default DH system. This means that a costly default heating system leads to higher savings for the building residents.
For the following business cases ‘Rent model’, ‘Full Contracting with energy efficiency measures’ and the contractor variations ‘external contractor’ and ‘energy cooperative’, central gas heating is assumed as the default heating system to challenge the profitability of the local heating/energy technologies.
3.1.2. Rent Model
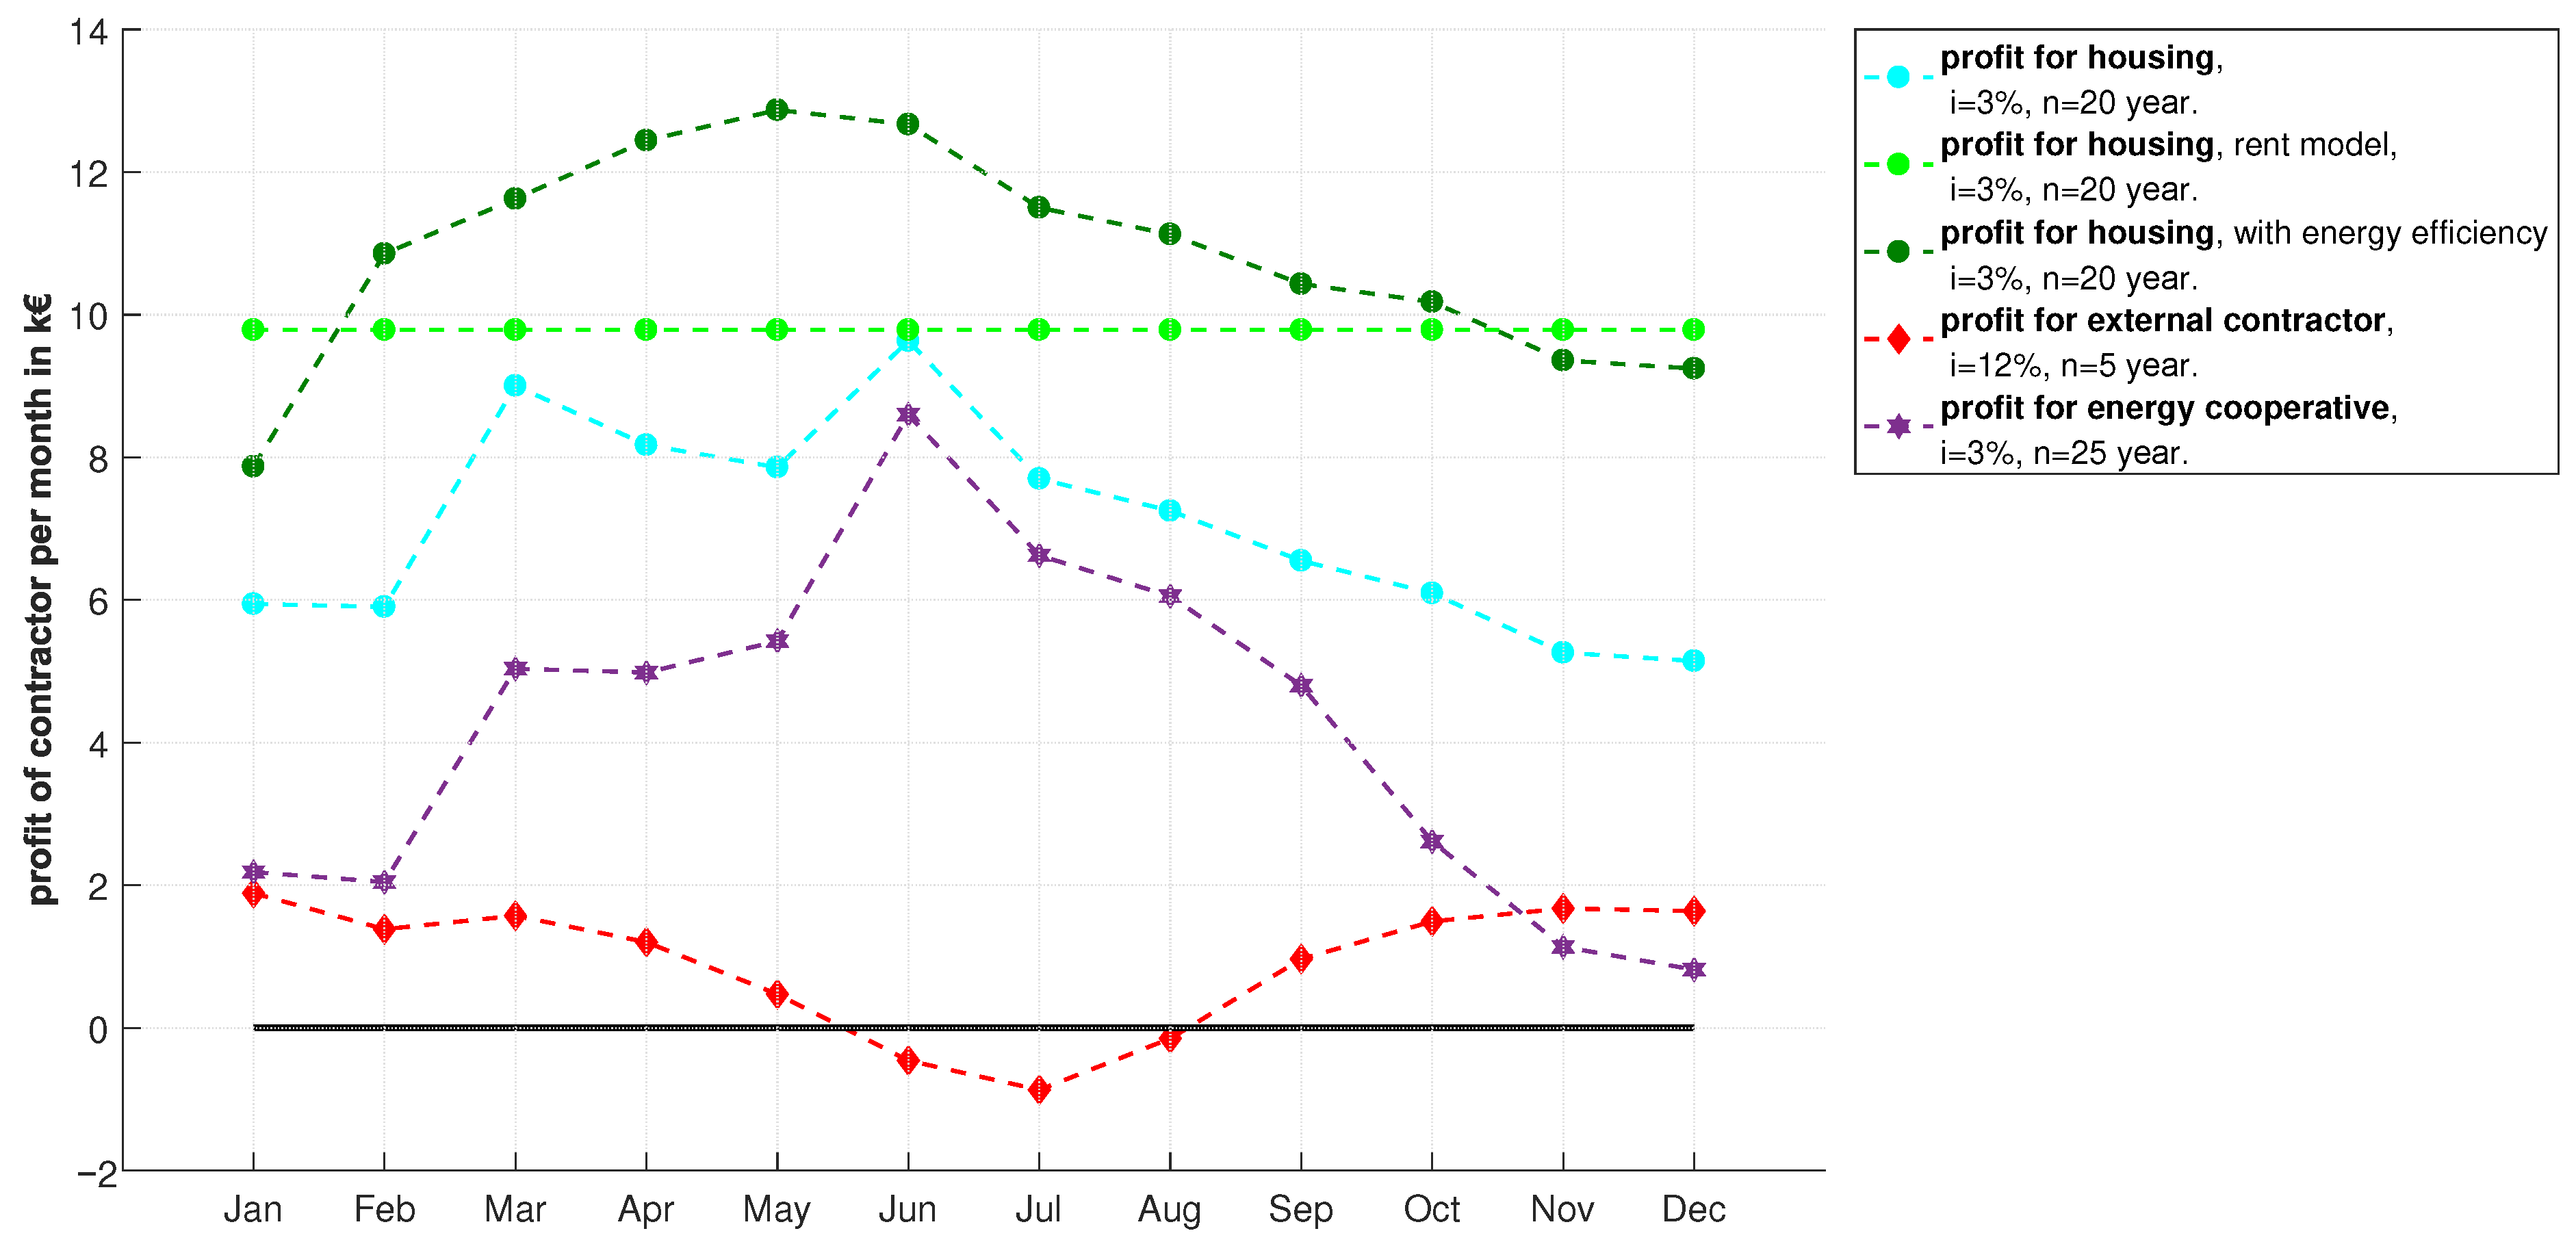
The ‘Rent model’ proves to be more profitable for both the housing association and the residents compared to the default case of ‘Full Contracting’. The contractor’s profit rises by 39%, while the residents’ energy cost savings are 13% higher than in the default case. This can be explained by the model finding an optimum between local energy costs and installed technology capacities. In this case, energy costs are determined by optimization.. The total energy costs—combined for electricity and heat—exclusively have to be 10% lower than those of the default case and are determined by optimization. The housing association’s profit and the residents’ energy cost savings are shown in
Section 3.4.
The housing association’s profit is evenly distributed throughout the year due to the monthly sum paid by the residents for renting the energy system. Contrarily, the energy cost savings for the building residents are produced only by consuming locally generated electricity. Negative cost savings for heat (i.e., additional costs for heat compared to no contracting) are outweighed by the high electricity cost savings, still generating significant overall energy cost savings for the residents in this business case. The energy costs determined by optimization, compared to the grid energy costs, are listed in
Table 6. It is visible that the optimally determined costs for local electricity are lower compared to electricity from the grid, whereas costs for heat are set higher by the optimization in comparison to grid gas.
In terms of installed energy technology capacities, an additional 30 kWp of PV capacity compared to the business case of ‘Full Contracting’ are determined profitable on the northern side of the roof. The capacity of the HP system is raised to the maximum installable capacity of 200 kW, as depicted in
Figure 4.
3.1.3. Full Contracting with Energy Efficiency Measures
This business case depicts an additional profit increase for the contractor of close to 10% compared to the ‘Rent model’ (without energy efficiency measures applied) by keeping the cost savings for the residents at the same level. The housing association’s profit and the residents’ energy cost savings are shown in
Section 3.4.
Concerning local energy technology capacities, additional 5 kWp of PV capacity are determined to be optimal for installation on the northern side of the roof compared to the default case of ‘Full Contracting’. The capacity of the HP system is raised to the maximum installable capacity. The following energy costs for the residents are determined by optimization (see
Table 7). Despite the higher energy costs compared to grid energy costs (
Table 7), savings are still realized due to lower heat and electricity loads. The energy cost savings for the residents are mainly generated in the winter due to improved building insulation.
3.2. External Contractor
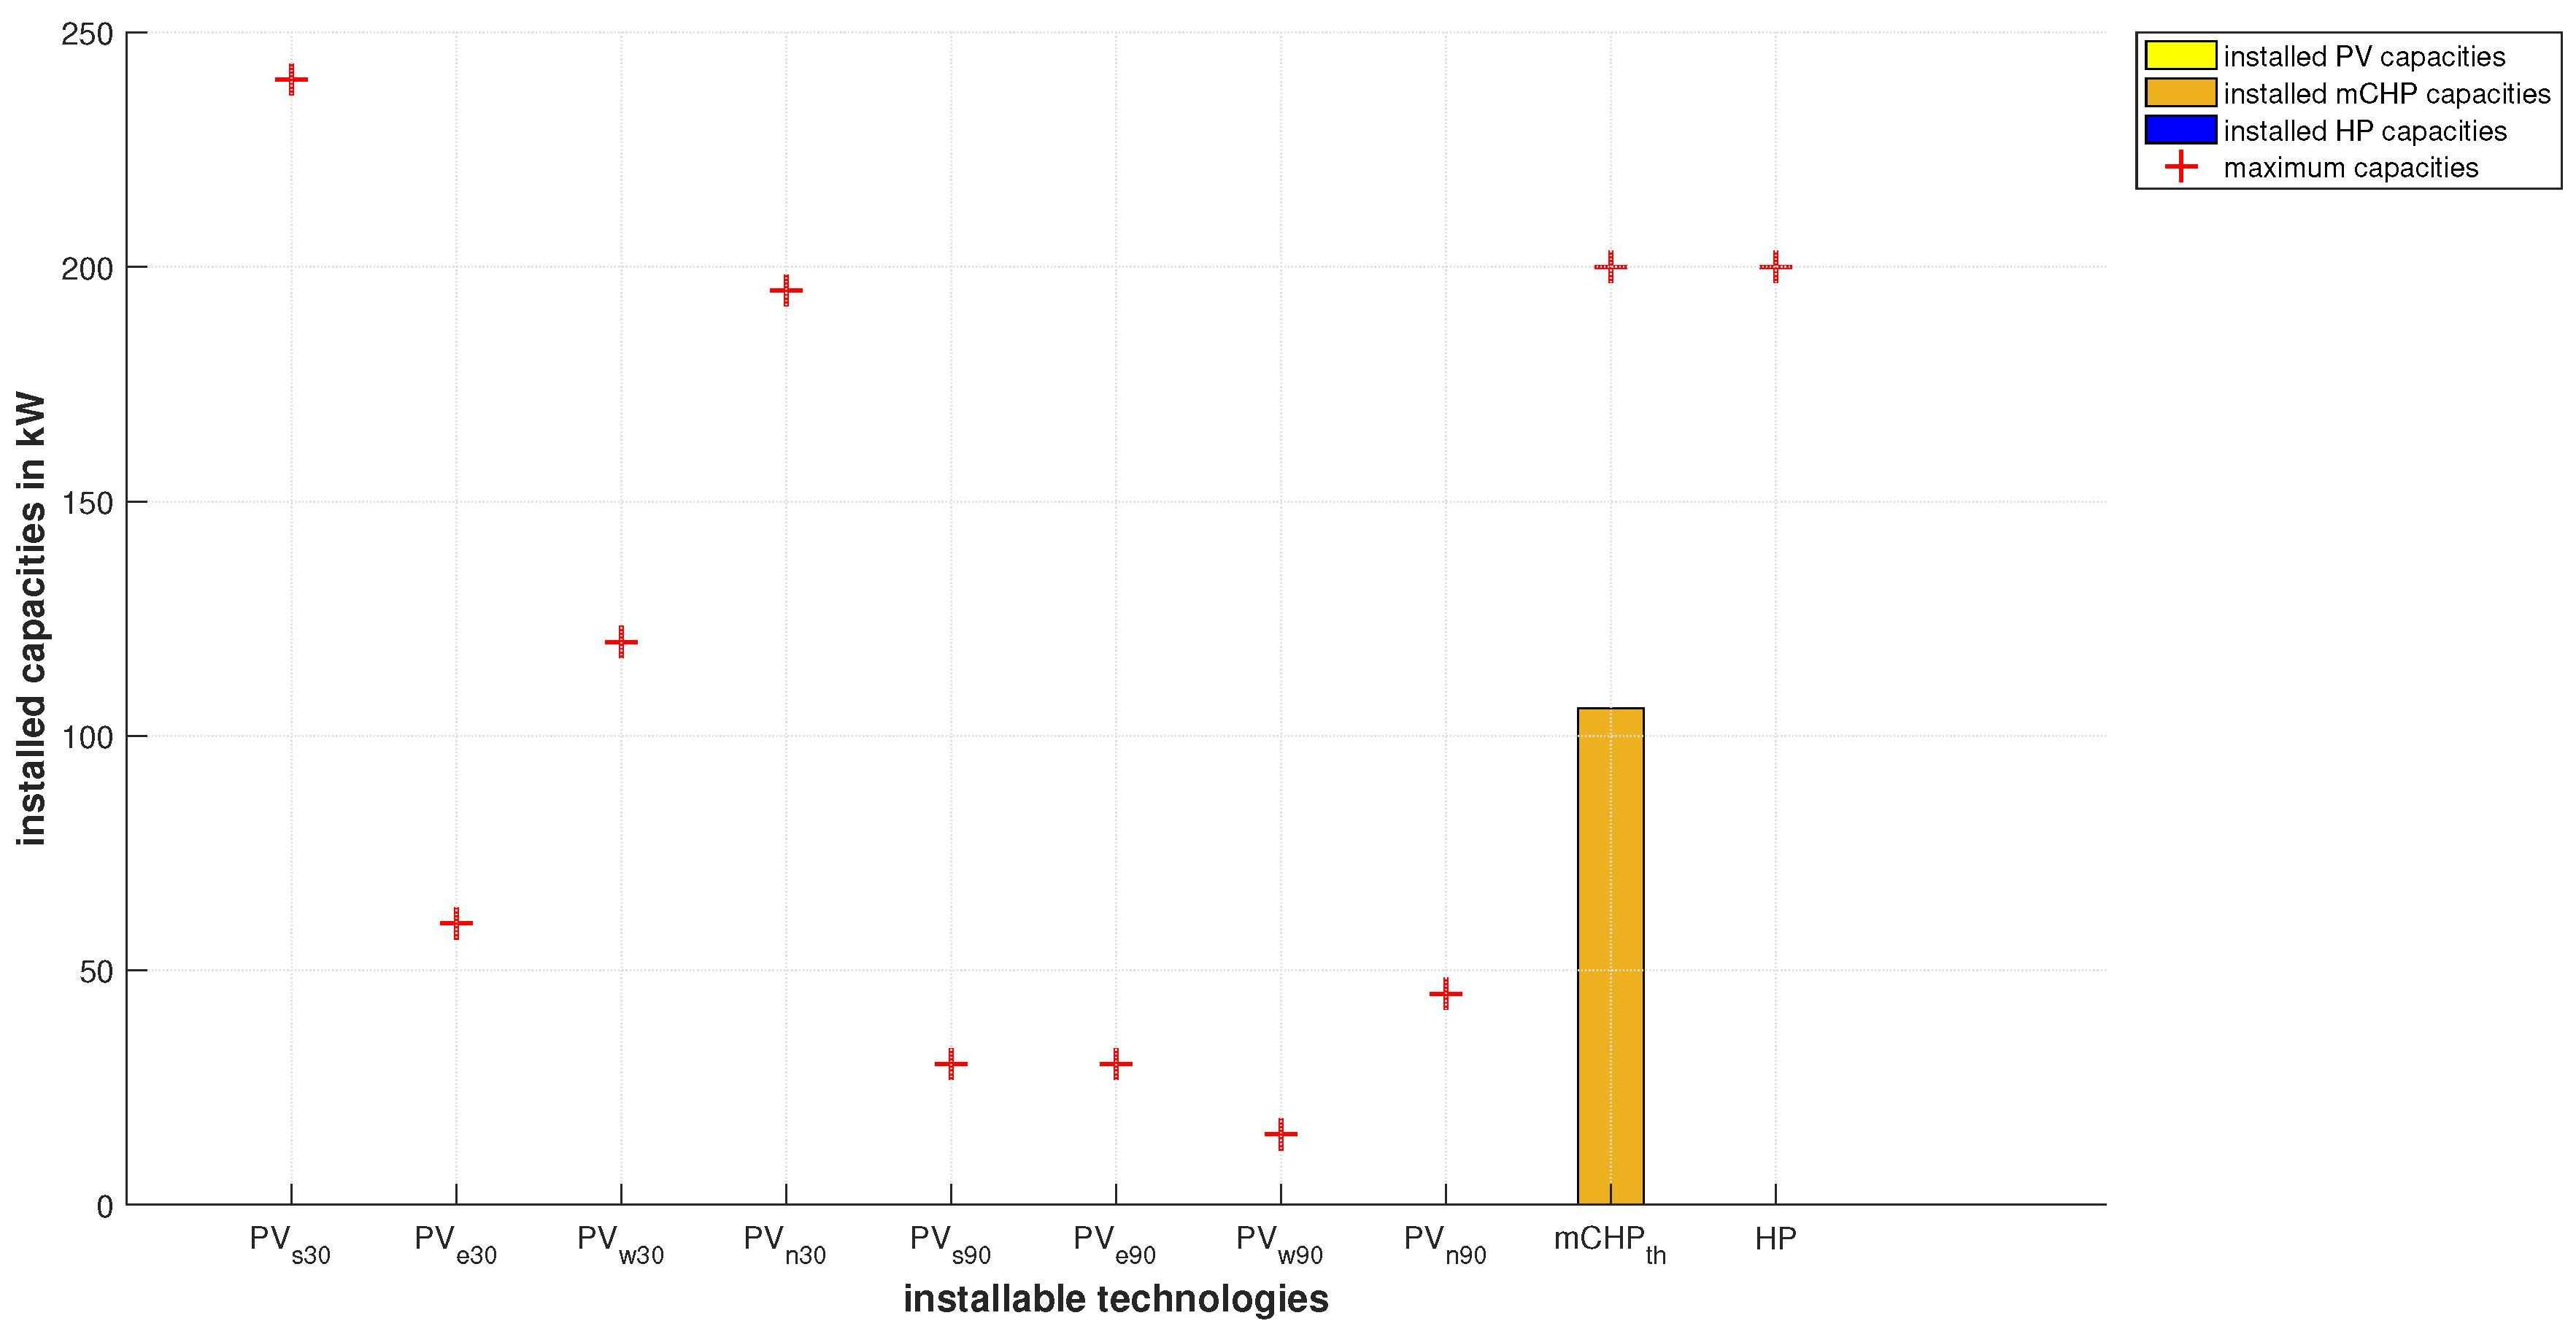
This business case shows a rapid decrease in the contractor’s profit by 87% compared to the default contracting case, caused by the enforced depreciation time of the installed local energy technologies of 5 years, leading to an installation of an mCHP system only (see
Figure 6). The profit is only generated by selling local mCHP electricity to the residents, while financial losses are accounted for supplying local heat. Energy cost savings for the residents also decrease significantly by 52%. Since the optimization determines PV systems not to be profitable, smaller energy cost savings are generated in the summer. The contractor’s profit and the residents’ energy cost savings are listed in
Table 8,
Section 3.4.
3.3. Energy Cooperative
It can be observed that the configuration is still profitable for both the contractor and the residents when the objective function of the optimization model is adapted to maximizing local energy self-supply. The contractor’s profit decreases by 40%, while the residents’ energy cost savings rise by 11%. The profits are shown in comparison to all other introduced business cases in
Section 3.4.
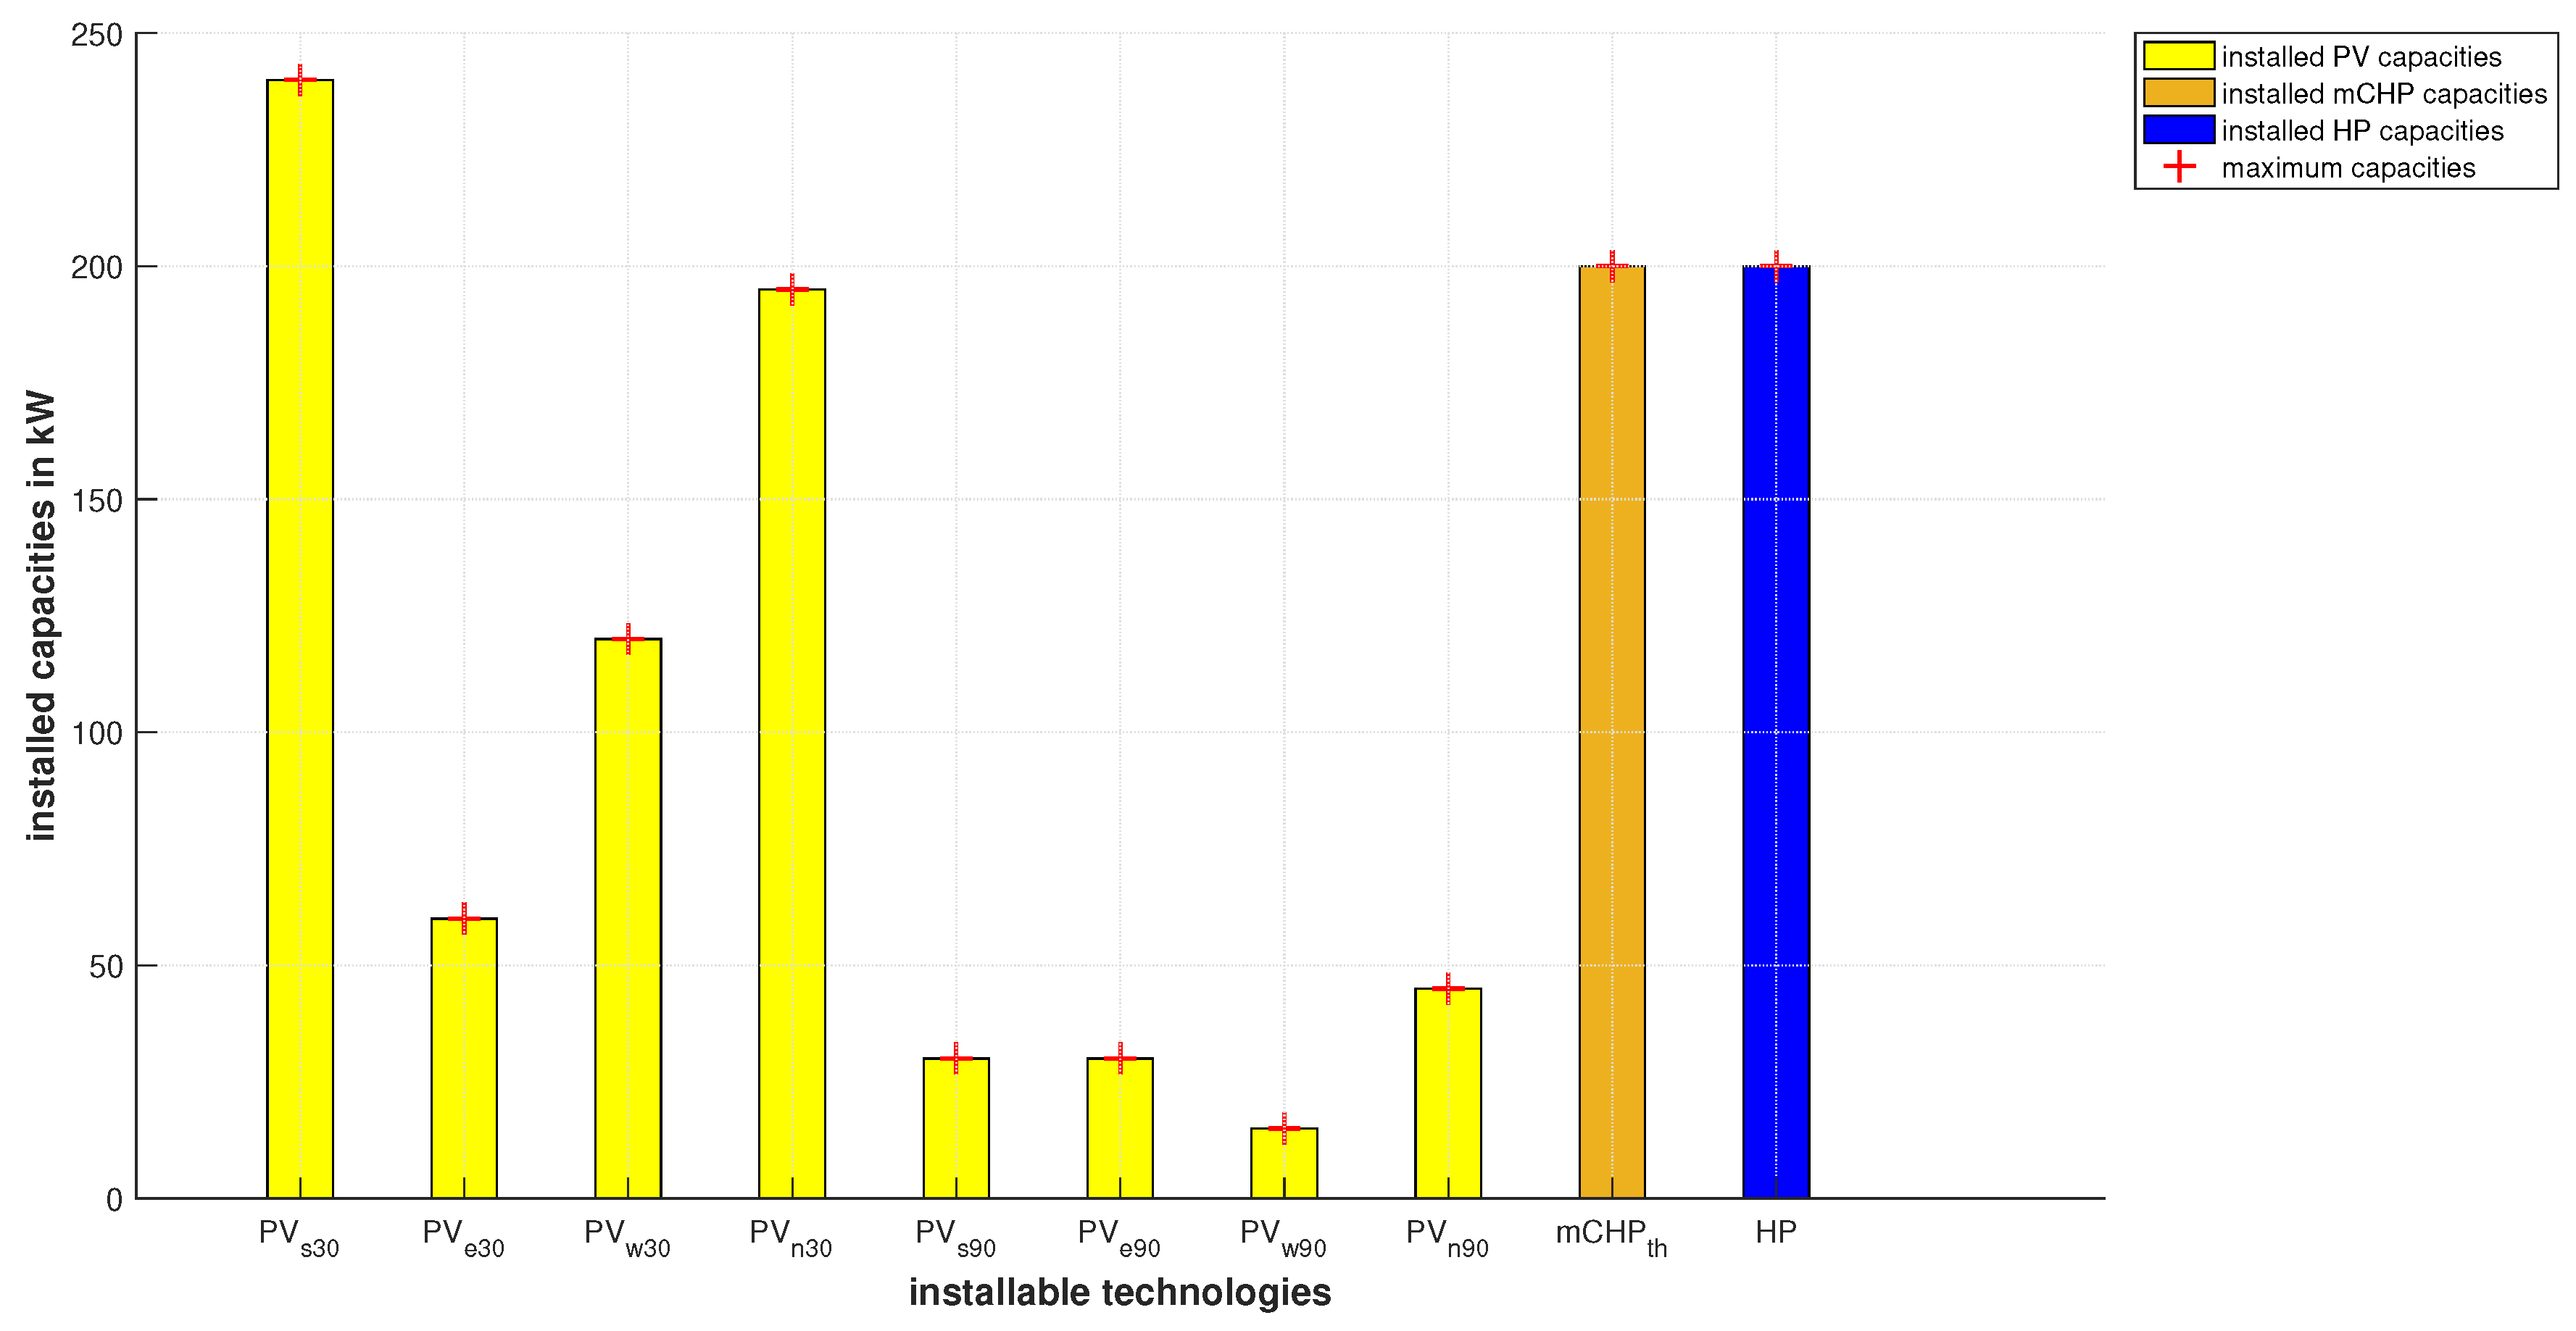
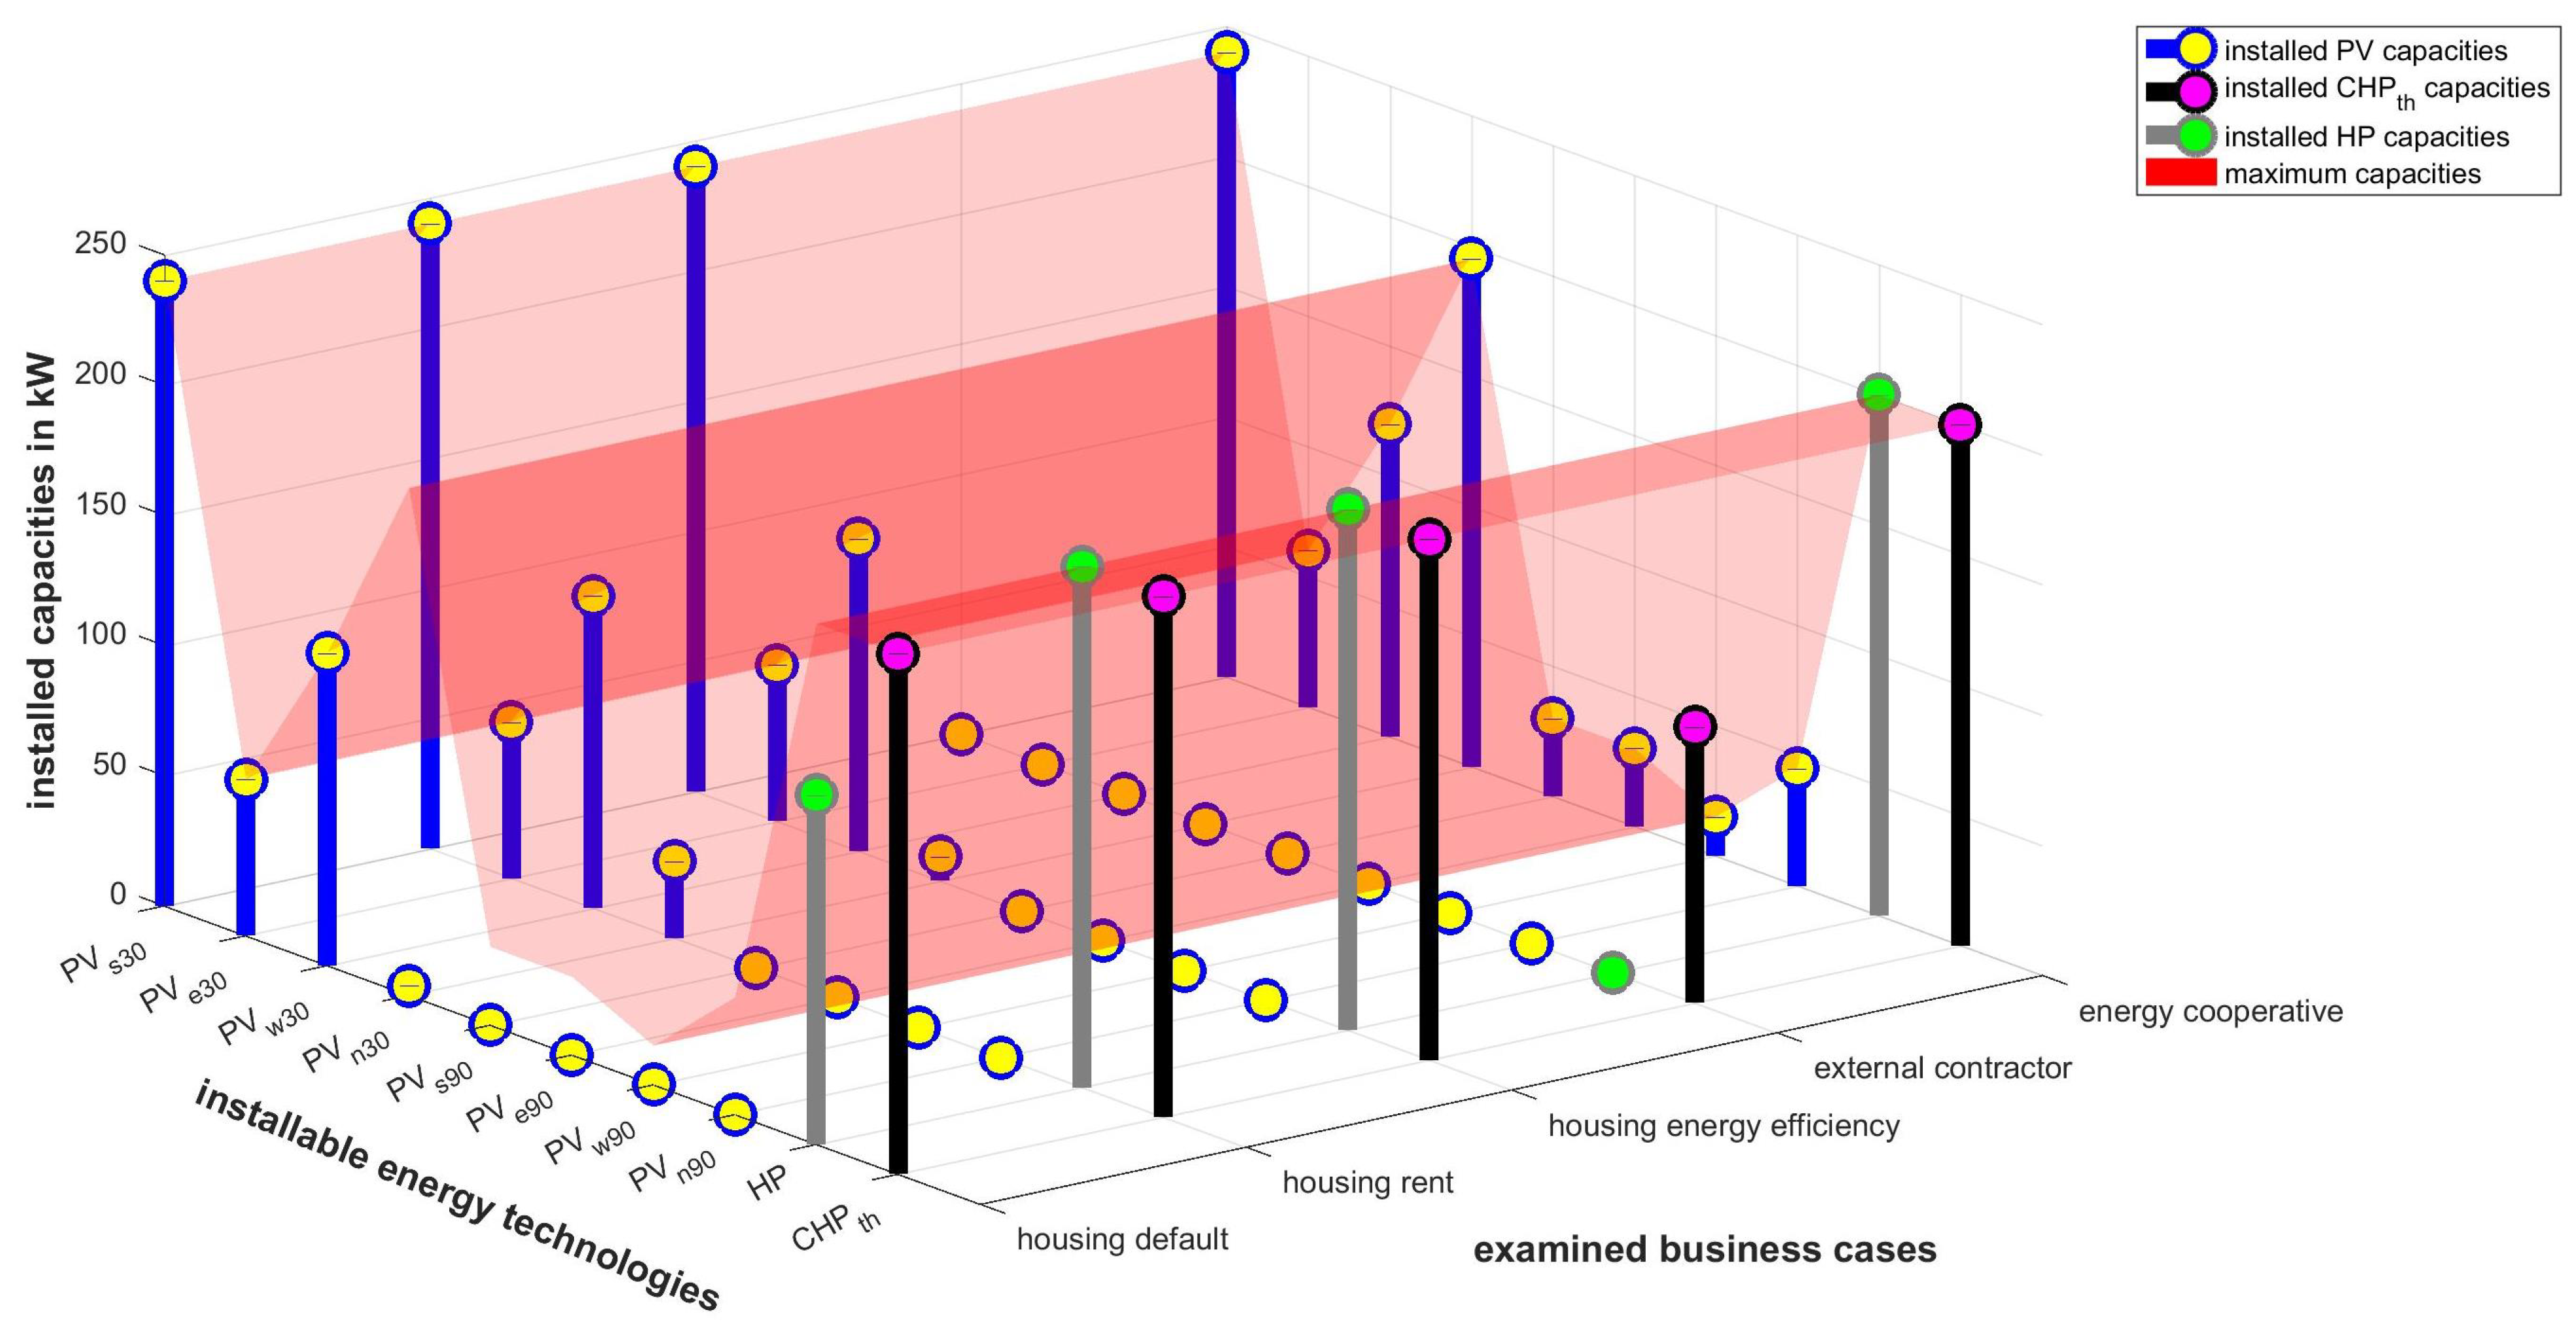
As expected due to the maximization of local energy self-supply in the objective function, the optimization model determines the assumed maximum capacities being optimal for all local energy technologies (see
Figure 7). In this case, it needs to be emphasized that even the buildings’ facades are used for PV electricity generation.
3.4. Synthesis of Results
The determined annual values for the contractor’s profit and the residents’ energy cost savings are depicted in
Table 8 for all examined business cases. In addition, the percentage deviations from the housing association’s default contracting case ’Full Contracting’ are shown. It can be seen that the ‘Rent model’ of the housing association business case shows a high profit for the contractor compared to the default ‘Full Contracting’ case. This can be explained by the removal of fixed (lower) energy costs for electricity and gas/heat. In contrast, an overall 10% reduction of energy costs for the residents is set as a constraint. Therefore, an optimal balance between local energy costs and installed energy capacities can be determined by the optimization. The housing association’s ‘Full Contracting with energy efficiency measures’ business case leads to an even higher profit compared to the other cases. The profits for the contractor for the individual business cases on a monthly basis are shown in
Figure 8.
Additionally,
Table 8 lists the determined energy capacities for each business case. The maximum capacities for the PV, HP and mCHP system are installed in the case of the energy cooperative due to the adapted objective function. No capacities apart from a comparably small mCHP system are installed for the business case of the external contractor because of the high interest rate and short depreciation time.
Furthermore, the determined energy technology capacities (including the maximum installable capacities) are compared graphically for all business cases in
Figure 9.
3.5. Sensitivity Analysis
For the following analyses, the ‘Full Contracting’ business case of
Section 3.1.1 is adapted to depict the main sensitivities of the contractor’s profit and the residents’ energy cost savings. Firstly, in order to show the impact of increasing retail electricity costs,
Section 3.5.1 investigates German standards with higher retail electricity prices than in Austria. Secondly,
Section 3.5.2 examines how reduced technology costs impact economic gains. Thirdly, the influence of increasing costs for CO
emissions (and thus increasing energy costs) is investigated in
Section 3.5.3.
3.5.1. Electricity Cost Increase
To examine the results’ sensitivity to higher retail electricity costs, costs of
€/kWh are assumed, while the costs for gas and all installation and maintenance costs are not changed. The electricity costs represent the current retail electricity costs of Germany [
67].
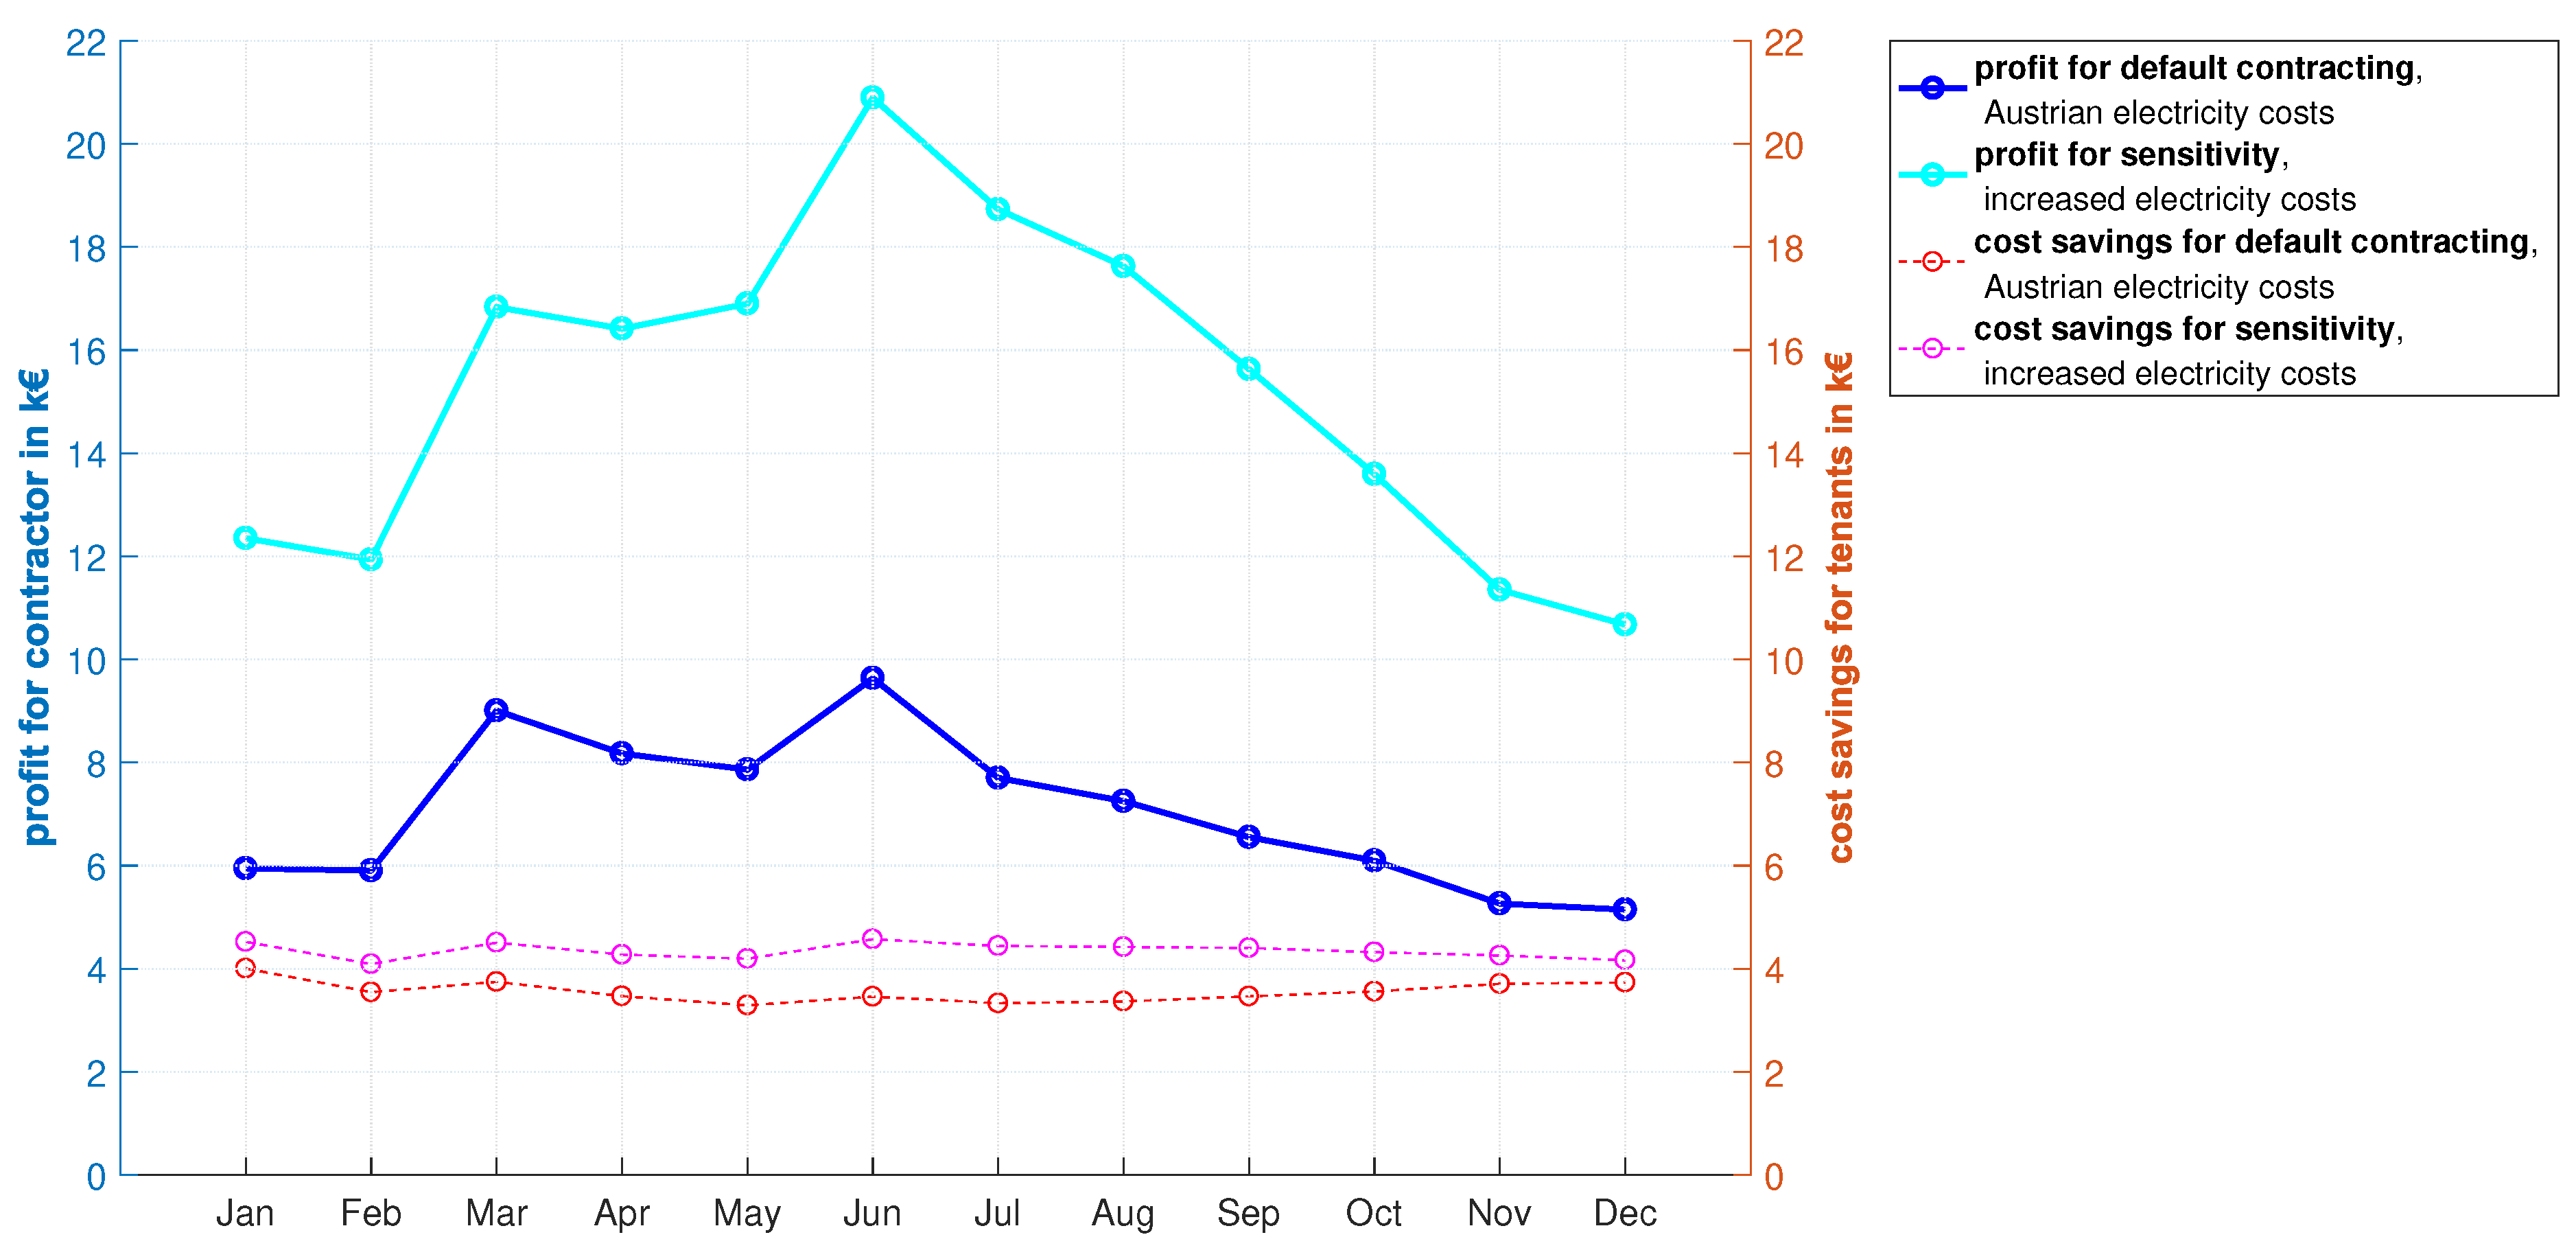
Figure 10 shows an increase in profit for the contractor of 116% to 182,917 € and an increase in the residents’ energy cost savings of 22% to 52,153 € within the period of one year. Thus, novel and energy-efficient electricity generation technologies become more profitable in case of higher retail electricity costs.
The installed capacities, in this case, are similar to the default business case, although more PV capacity is installed on the northern parts of the roofs (approximately 60 kWp in addition), while HP capacity is reduced by 20 kW, both due to the high retail electricity costs.
3.5.2. Lower Technology Costs
For this analysis, the investment costs of the BAPV, BIPV, HP and mCHP system are reduced by 30% in order to examine the change in optimally determined installation capacities and thus on profits and cost savings. The reduction of investment costs is assumed due to technological learning, improvements in manufacturing processes and efficiency gains. This corresponds to a PV price scenario for the next five years [
68].
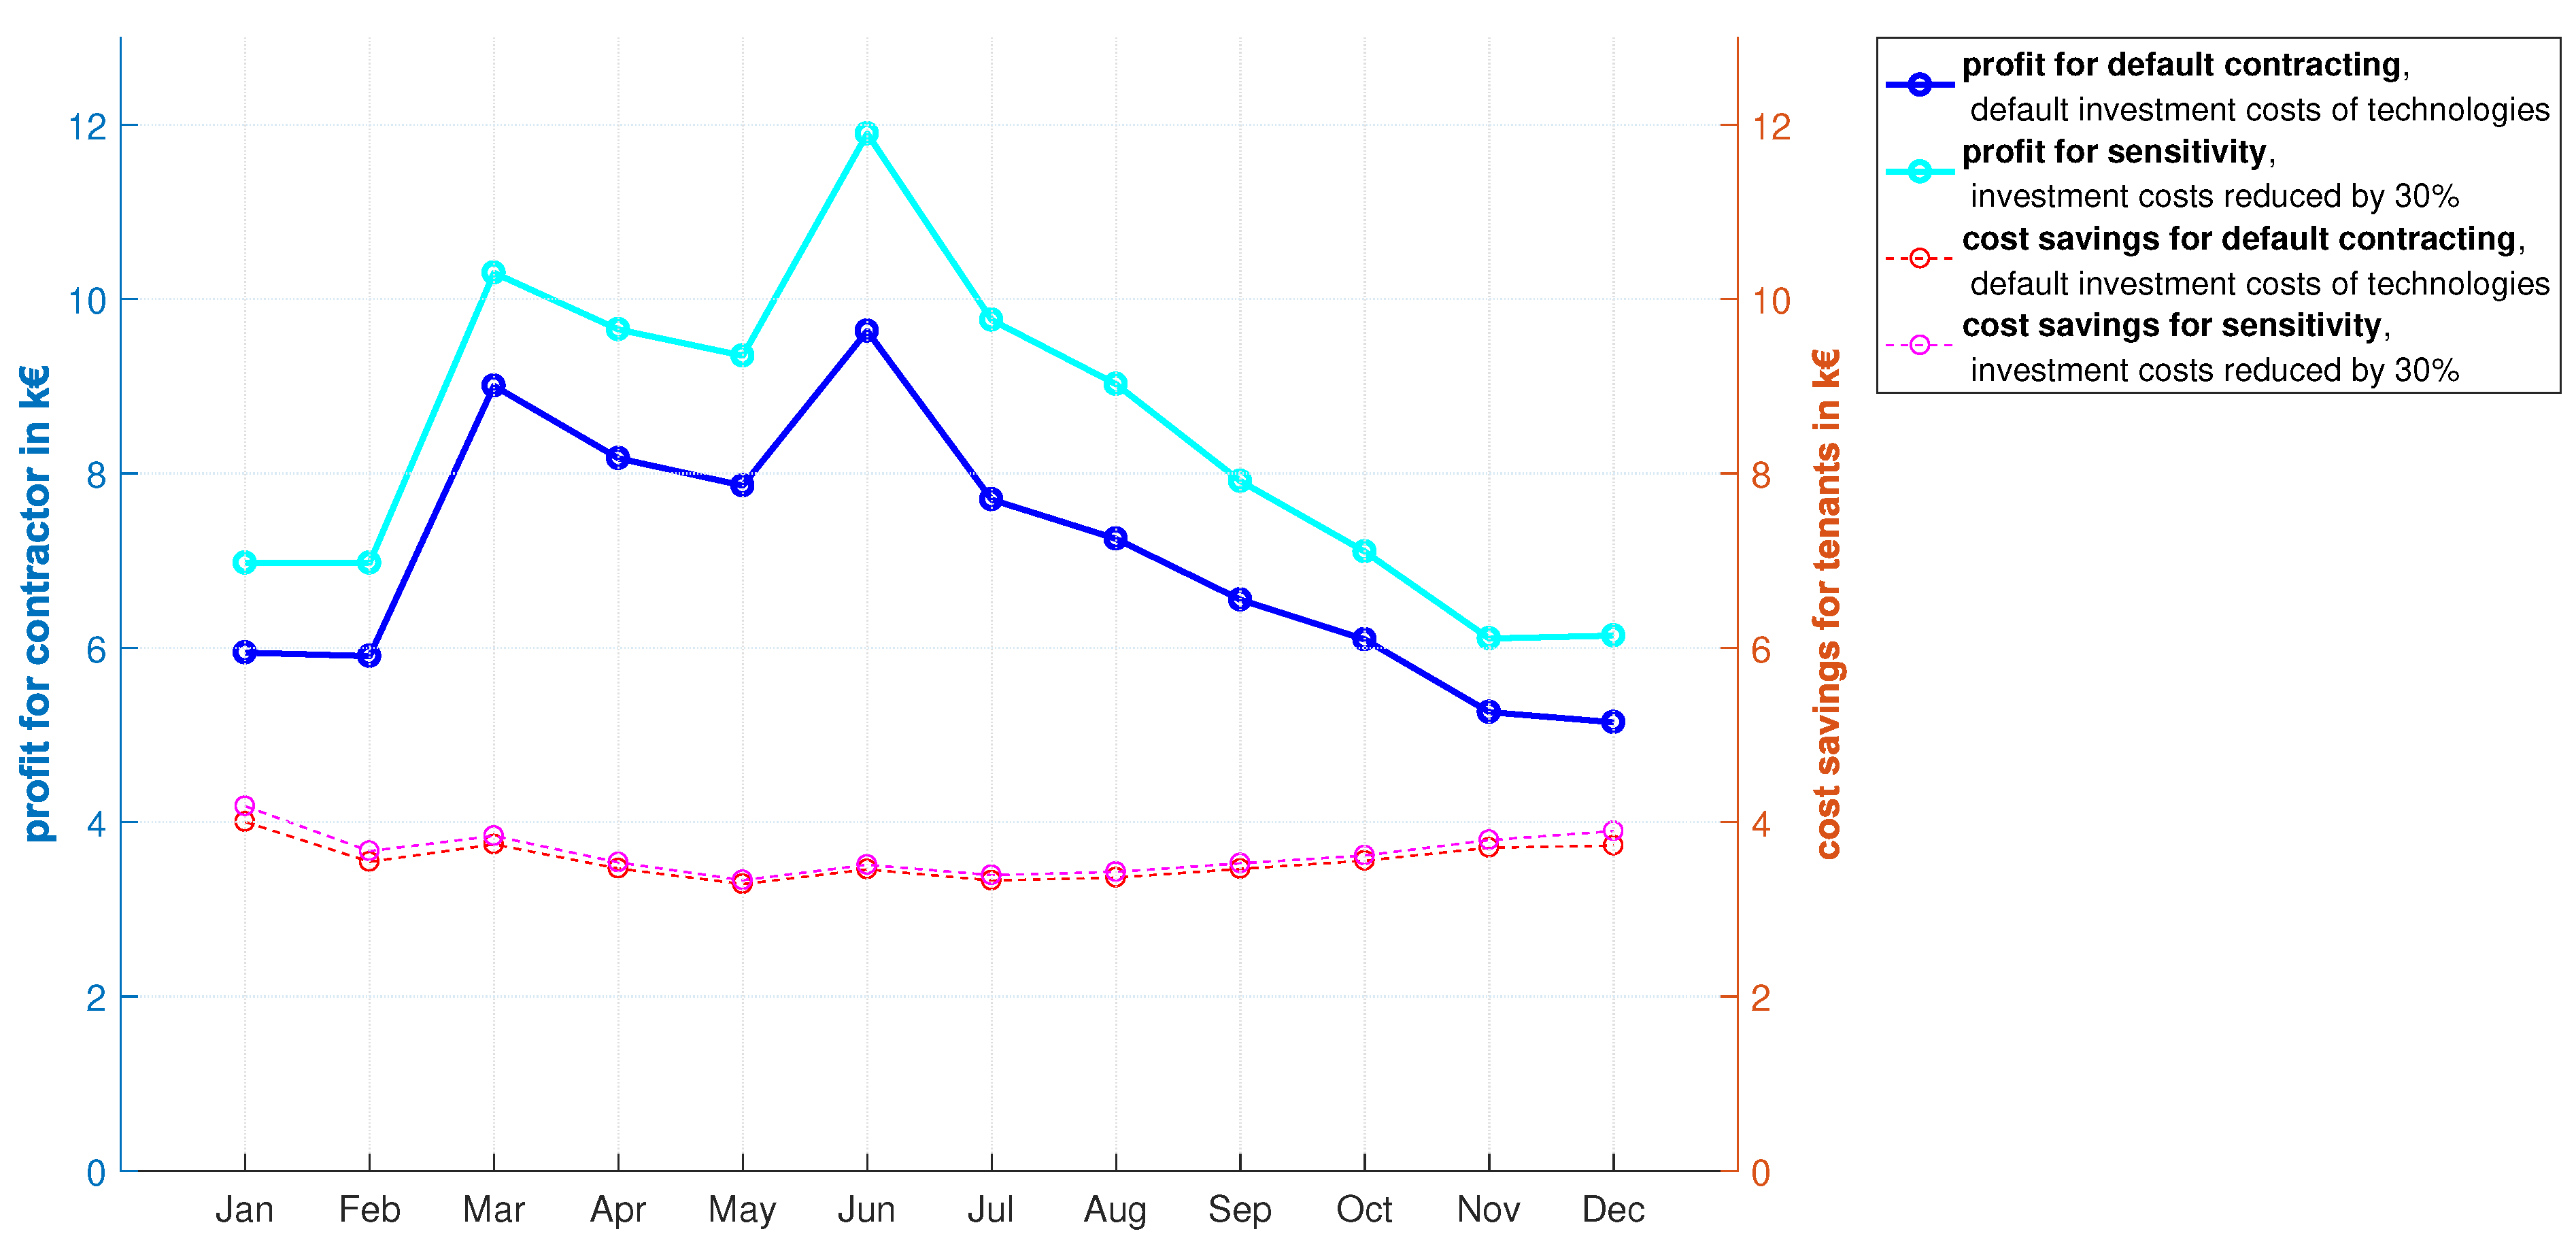
The results show that about 110 kWp of additional PV capacity is installed on the northern side of the roofs. However, the facade is not determined profitable for PV installation by the optimization model. The capacity of the HP increases by 50 kW in comparison to the default setting presented in
Section 3.1.1. The contractor’s profit is raised by 20% to 101,196 € (see
Figure 11), while changes in energy cost savings are insignificant for the residents.
3.5.3. Increasing CO Costs
In order to examine how rising CO
costs affect the profitability of contracting, the carbon dioxide emissions of the heating and electricity technologies are calculated. The annual CO
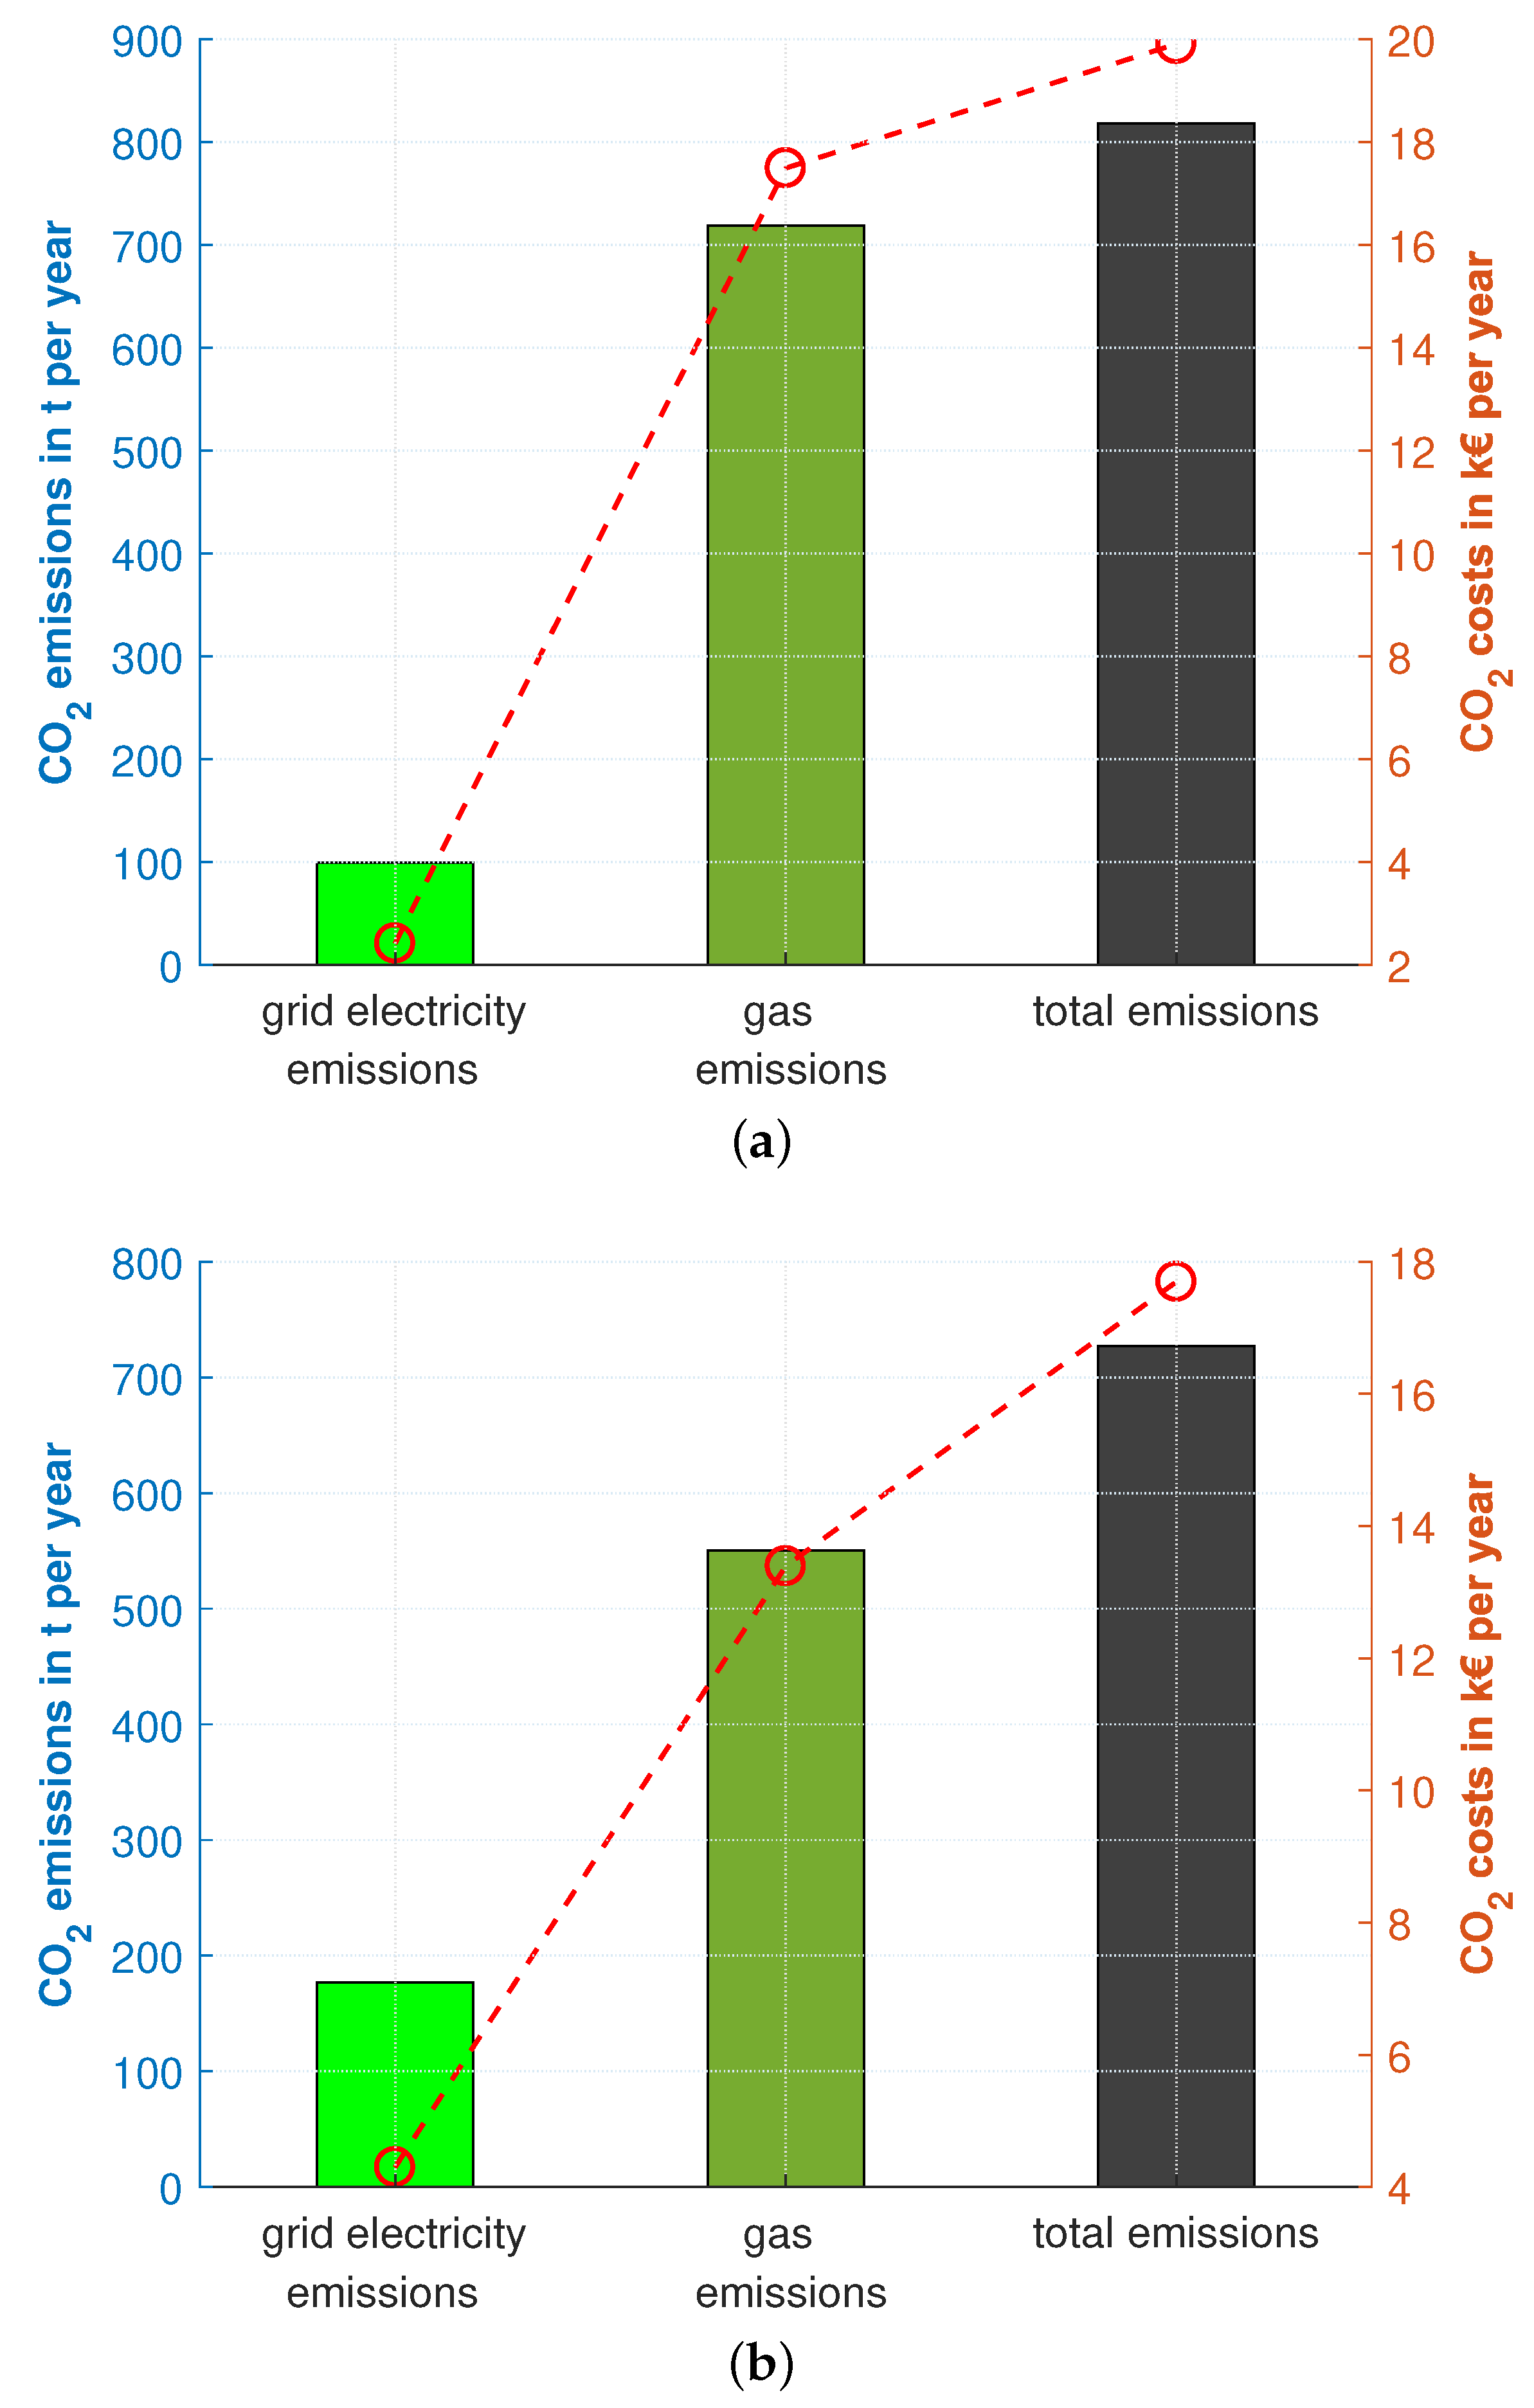
emissions for the whole neighborhood are calculated for the ‘Full Contracting’ housing association business case and are shown in
Figure 12a. The figure shows total emissions in the first
y-axis and cost on the second
y-axis. The latter was computed using the current European Emission Allowances (European Union Emission Trading System EU ETS) of 24 €/t
CO2 [
69].
As a next step, it is assumed that (EU ETS) CO
costs rise to 70 €/t
CO2 by 2030, which is in line with a high-cost scenario of [
70]. This depicts a CO
cost increase by 188% that leads to a rise in energy costs according to the conversion factors introduced in
Table 9. The electricity and gas costs for higher CO
costs compared to the default energy costs can be derived from
Table 10 and are in line with [
16,
71]:
Figure 12 depicts the emitted amount of CO
and the total annual costs for emissions. A comparison is presented for the default case with the case of the higher emission costs of 70 €/t
CO2.
The optimization determines an additional 40 kW of HP capacities to be optimal due to the higher CO
costs. Additionally, the optimization adds about 60 kWp of PV on the northern side of the roof to supply the HP system and to resell to the residents.
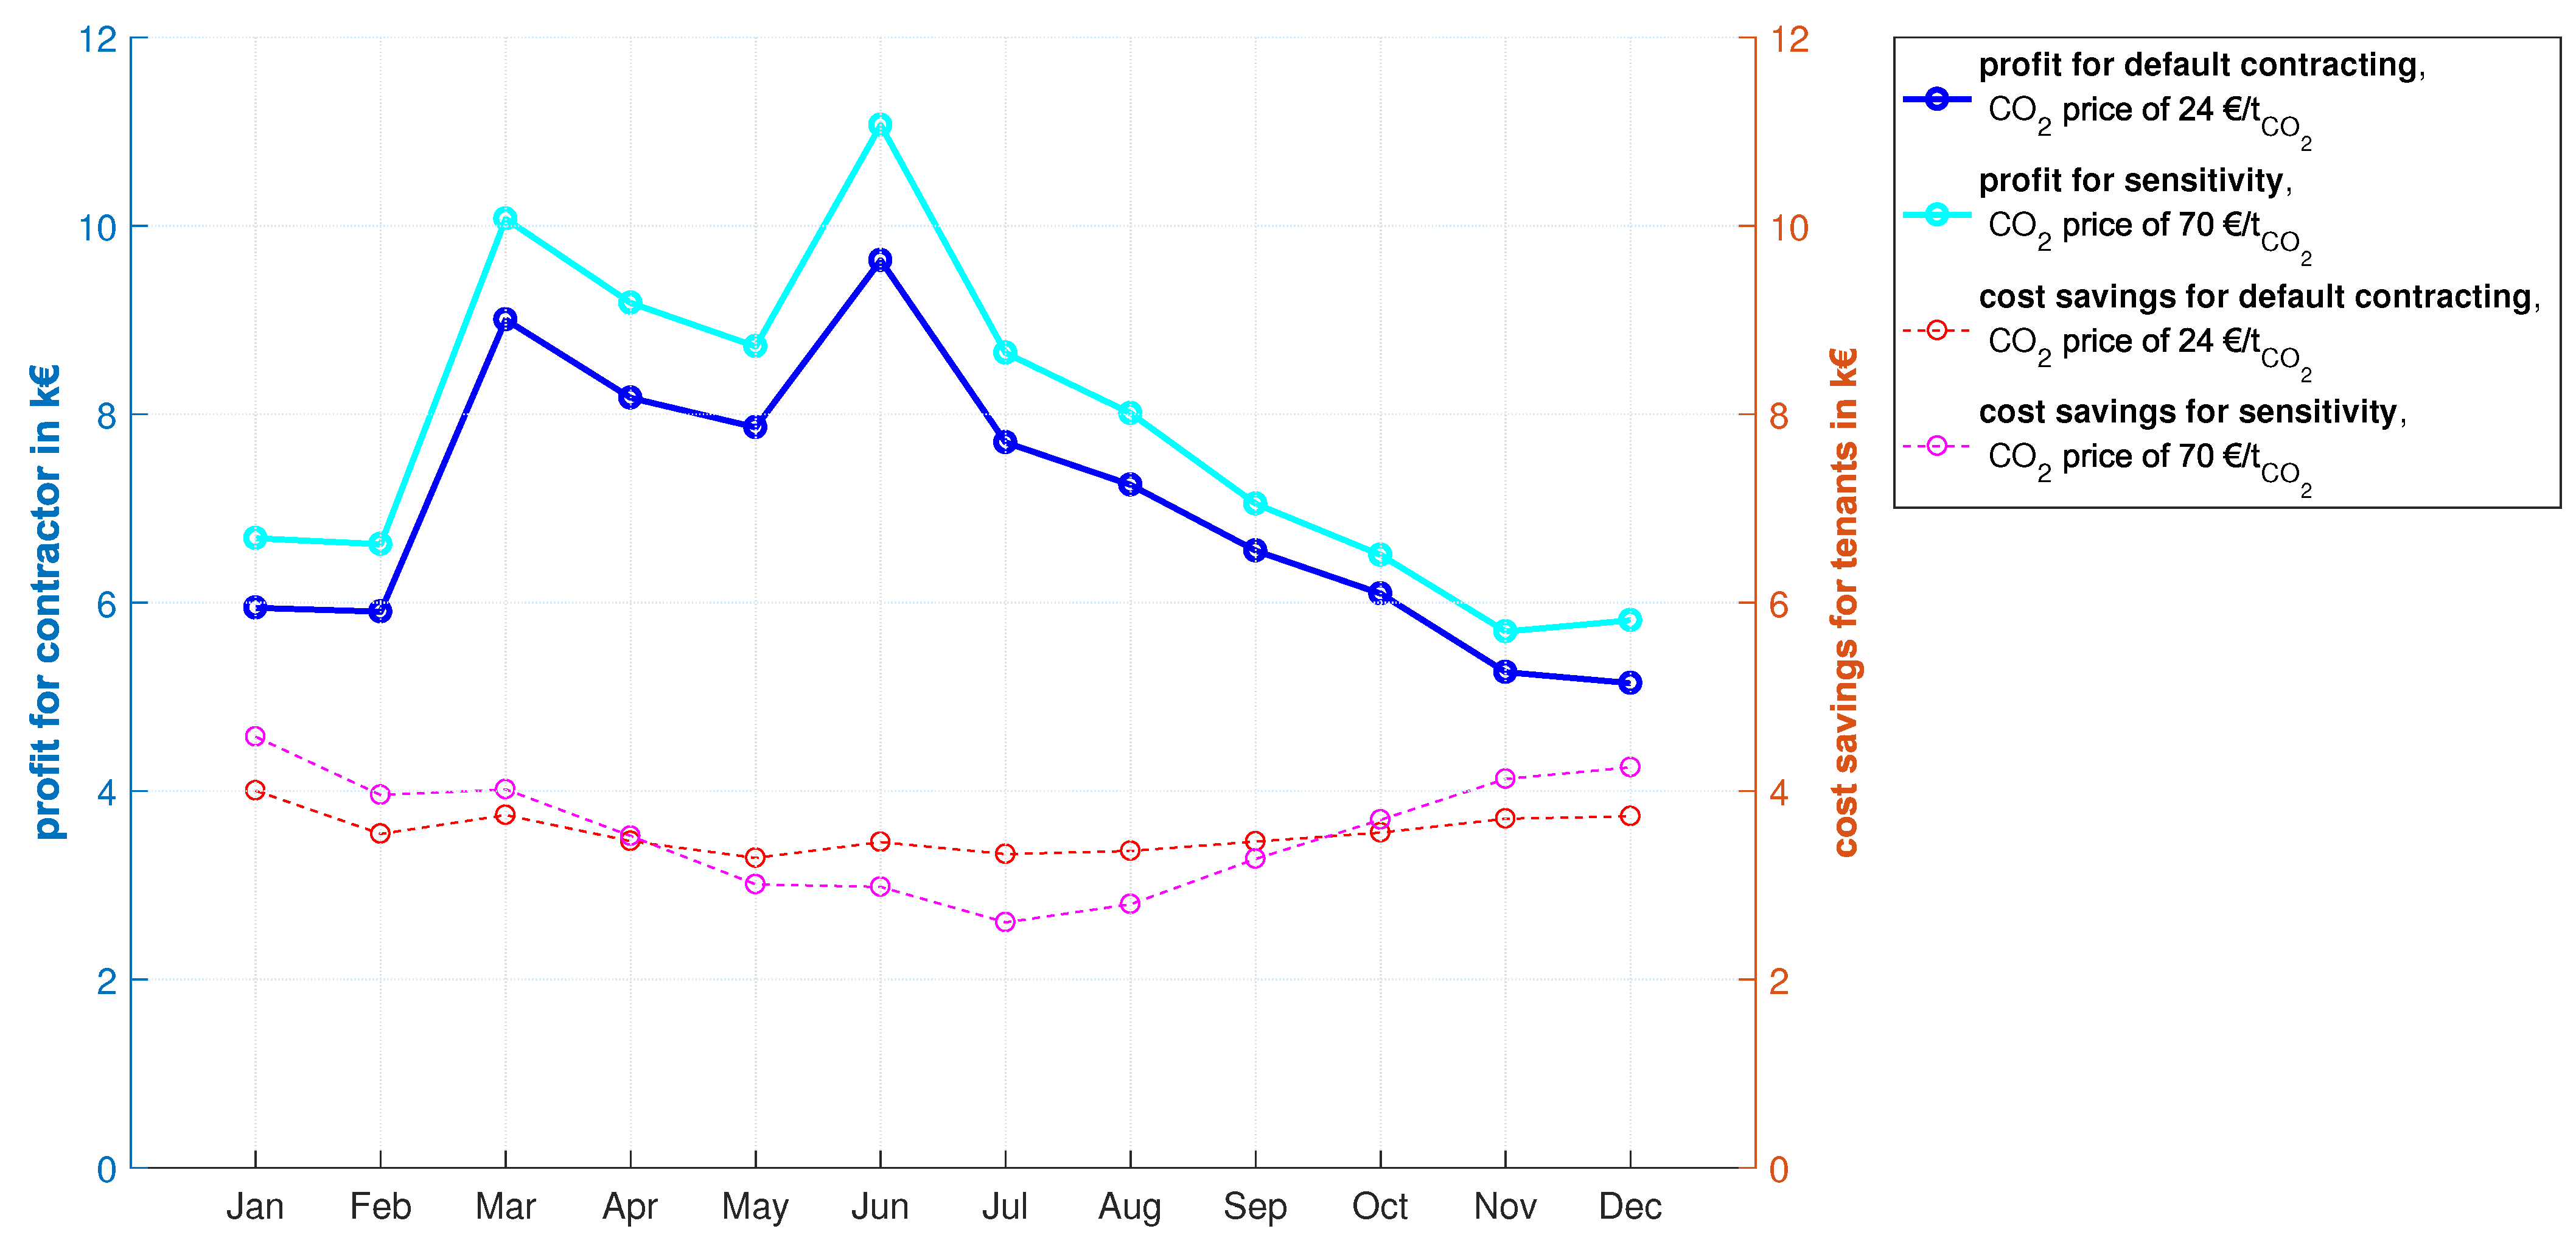
Figure 13 shows that the contractor’s profit rises by 11% to 94,073 €, while the residents’ energy cost savings remain almost the same (a rise of less than 1% to 42,822 €), in case the CO
costs are raised by 188%.
4. Conclusions and Outlook
In order to reach Austria’s ambitious energy and climate goals, the regulatory framework is currently being adapted to enable innovative business models that enhance the broad application of decentralized and local renewable and energy-efficient energy technologies. Thermal and electrical energy systems in buildings and neighborhoods, with their high upfront investment costs, but significant energy-saving potential, are destined to be financed, operated and/or retrofitted by contractors. The mixed-integer linear optimization (MILP) model that is developed to determine the contractor’s profitability of investments in local and renewable energy technologies has proven to be suitable. The MILP approach offers a beneficial trade-off between representable complexity and necessary computational time. A wide range of contracting business models is examined to provide results supporting decision and policy making.
The results show that profitability for an energy (supply) contractor and for energy sharing between residents is realized in all examined business cases. The extent of profitability, however, highly depends on the economic parameters of assumed interest rates and depreciation times. Furthermore, it is shown that a combined energy cost decreases for local electricity and heat leads to higher profits for the contractor and the residents. In contrast, a reduction in electricity and heating costs separately by a certain percentage is less profitable, since costs for gas heating are already comparatively low in the default case without contracting and cost reductions. Additionally, it is determined that considering energy-efficiency measures, such as building insulation and energy-efficient lighting, enhances profitability for the examined neighborhood as well as for the contractor.
The housing associations’ business case of ‘Full Contracting with energy efficiency measures’ is most profitable for the contractor as well as for the building residents. However, possible energy savings depend highly on the original building envelope and building infrastructure, which highlights the necessity of multiple business model options. Whether the energy contracting services of the future will be offered to clients for fixed and separated costs for electricity and gas or—as shown to be economically advantageous—through a monthly rent of the energy system, will be subject to organizational and legal considerations.
The results of this study demonstrate that developing adequate legal framework conditions to enable energy communities can facilitate innovative and particularly profitable business cases. The concept of energy supply contracting, which has historically been applied to supply heat, can thus be extended to the provision of electricity. It can reduce financing risks for energy system modernizations and additionally decrease building residents’ energy costs. It has been proved that the combination of energy contracting services can benefit both the contractor as well as the residents. Furthermore, it is shown that buildings and neighborhoods with diverse usages can provide high energy consumption synergies, contributing to self-consumption increase and grid stabilization.
Based on the literature review in
Section 1.1 and the findings of this study, it can be derived that there is still more research required in the field of energy contracting in an emerging energy community context:
The energy community should be expanded by the number of members and technologies to take advantage of synergies between a variety of load profiles and to address emerging synergies with various other technologies (including novel energy and storage technologies, such as P2X (power to gas, heat or liquid) technologies, the use of waste heat and other small local power/heat plants). It would also be important to examine the extent to which such changes would affect economic viability for contractors and residents.
Additionally, by increasing the size of the community, energy trading between clients should be established to increase the profitability of locally generated energy and thus incentivize increased participation of contractors and clients. Various business models need to be developed shortly, not only considering the actual trading between residents, but also taking into account the presence of a contractor.
Based on the findings of this study, it would be interesting to pursue research in the direction of considering electric vehicles in addition. The specific influence of electrifying privately owned vehicles on the profitability of energy contracting could be quantified. Moreover, it should be examined how and if using electric vehicles as flexible storage alters the results.
Author Contributions
C.M.: Conceptualization, methodology, software, validation, formal analysis, investigation, resources, data curation, writing—original draft preparation, writing—review and editing, visualization, project administration. B.F.: Validation, writing—review and editing, supervision, project administration. H.A.: Writing—review and editing, supervision, project administration. All authors have read and agreed to the published version of the manuscript.
Funding
This research received no external funding.
Institutional Review Board Statement
Not applicable.
Informed Consent Statement
Not applicable.
Data Availability Statement
Conflicts of Interest
The authors declare no conflict of interest.
Abbreviations
The following abbreviations are used in this manuscript:
| annuity factor |
| BAPV | Building-attached PV |
| BIPV | Building-integrated PV |
| CEP | Clean energy for all Europeans package |
| fixed costs of contractor |
| investment costs for local energy systems of contractor (as annuities) |
| variable costs of contractor |
| annual maintenance costs |
| COP | coefficient of performance of HP system |
| DH | District heating system |
| EPC | Energy performance contracting |
| ESC | Energy supply contracting |
| G | Financial gain (profit) |
| HP | Heat pump system |
| i | interest rate of examined business case |
| j | grid energy technologies |
| k | local energy technologies |
| mCHP | Mini combined heat and power system |
| n | depreciation time of examined entity |
| electric power (optimization variable for each technology and grid energy) |
| connection capacity of electricity grid (as maximum of ) |
| thermal power (DH or gas) (optimization variable for each technology and grid energy) |
| connection capacity of gas or DH grid (as maximum of ) |
| PV | Photovoltaic system |
| s/e/w/n | south, east, north or west direction of PV |
| 30/90 | 30-/90-tilt of PV |
| costs for energy from grids paid by contractor/residents |
| costs for grid capacity paid by contractor/residents |
| costs for local electricity as revenue for contractor |
| costs for local heat as revenue for contractor |
| revenues related to sell of electricity |
| revenues related to sell of heat |
| t | time steps in 15 min intervals |
| y | years |
Appendix A. Building Details
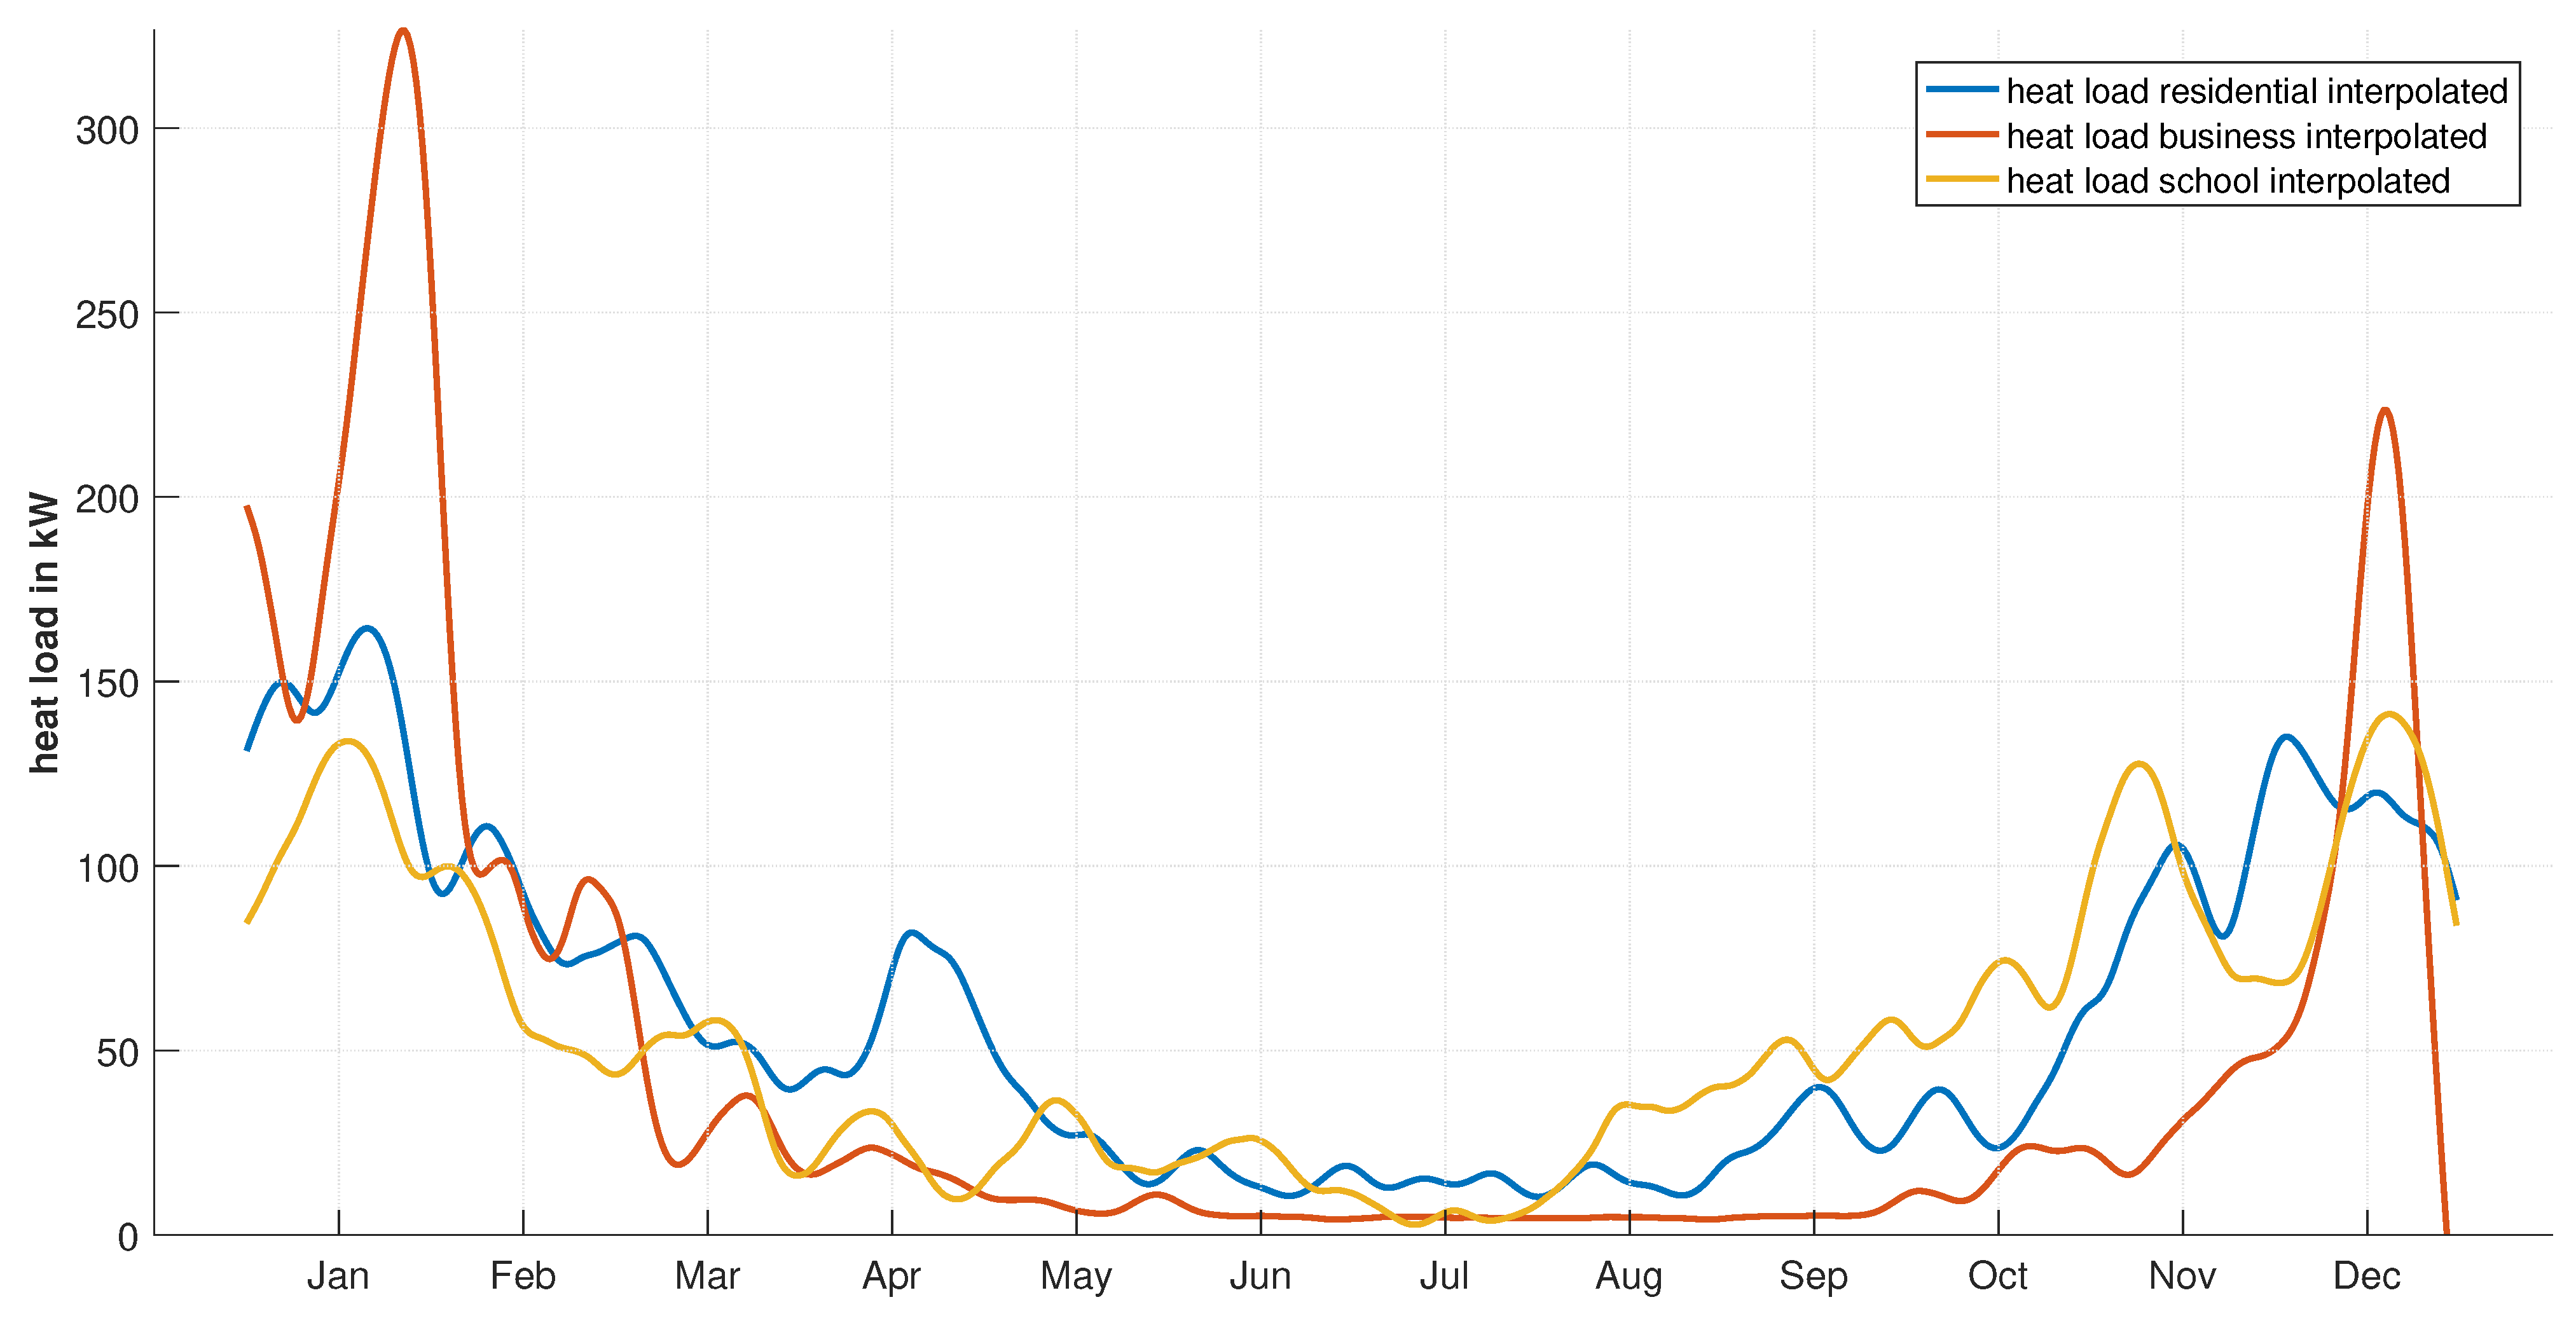
Figure A1 and
Figure A2 show interpolated electric and heat load data for the three buildings of the neighborhood over the year.
Figure A1.
Interpolated electric load of buildings.
Figure A1.
Interpolated electric load of buildings.
Figure A2.
Interpolated heat load of buildings.
Figure A2.
Interpolated heat load of buildings.
Appendix B. Costs for Energy Efficiency Measures
Table A1 lists the assumed costs for the housing association’s ‘Full Contracting with energy efficiency measures’ business case.
Table A1.
Energy efficiency measures applied.
Table A1.
Energy efficiency measures applied.
| | Costs
per Unit | Costs for
All Buildings | Resulting
Load Reduction |
|---|
| Energy efficiency measures for heat | |
| Insulation of facade of 13 cm [16] | 82 €/ | 137,760 € | |
| Insulation of top and ground floor ceiling [16] | 30 €/ | 123,300 € | 22% |
| Energy efficincy measures for electricity | |
| Efficient LED lighting | | | |
| (estimation based on [44,73,74,75]) | 20,000 €/building | 60,000 € | 4% |
References
- Rousselot, M. Energy Efficiency Trends in Buildings. 2018. Available online: https://www.odyssee-mure.eu/publications/policy-brief/buildings-energy-efficiency-trends.html (accessed on 10 December 2020).
- EU. Clean Energy for all Europeans Package. 2019. Available online: https://ec.europa.eu/energy/topics/energy-strategy/clean-energy-all-europeans_en (accessed on 10 December 2020).
- Bundesministerium fuer Digitalisierung und Wirtschaftsstandort. Elektrizitaetswirtschafts- und -Organisationsgesetz 2010. 2017. Available online: https://www.ris.bka.gv.at/GeltendeFassung.wxe?Abfrage=Bundesnormen&Gesetzesnummer=20007045 (accessed on 15 December 2020).
- Roberts, M.B.; Bruce, A.; MacGill, I. A comparison of arrangements for increasing self-consumption and maximising the value of distributed photovoltaics on apartment buildings. Sol. Energy 2019, 193, 372–386. [Google Scholar] [CrossRef]
- Fina, B.; Fleischhacker, A.; Auer, H.; Lettner, G. Economic Assessment and Business Models of Rooftop Photovoltaic Systems in Multiapartment Buildings: Case Studies for Austria and Germany. J. Renew. Energy 2018, 2018, 1–16. [Google Scholar] [CrossRef]
- Akter, M.; Mahmud, M.; Haque, M.; Oo, A.M. An optimal distributed energy management scheme for solving transactive energy sharing problems in residential microgrids. Appl. Energy 2020, 270, 115133. [Google Scholar] [CrossRef]
- Perger, T.; Auer, H. Fair Energy Sharing in Local Communities: Dynamic Participation of Prosumers. In Proceedings of the 17th International Conference on the European Energy Market, Stockholm, Sweden, 16–18 September 2020. [Google Scholar]
- Fina, B.; Auer, H.; Friedl, W. Cost-optimal economic potential of shared rooftop PV in energy communities: Evidence from Austria. Renew. Energy 2020, 152, 217–228. [Google Scholar] [CrossRef]
- Liu, N.; Yu, X.; Wang, C.; Li, C.; Ma, L.; Lei, J. Energy-Sharing Model with Price-Based Demand Response for Microgrids of Peer-to-Peer Prosumers. IEEE Trans. Power Syst. 2017, 32, 3569–3583. [Google Scholar] [CrossRef]
- Awad, H.; Gül, M. Optimisation of community shared solar application in energy efficient communities. Sustain. Cities Soc. 2018, 43, 221–237. [Google Scholar] [CrossRef]
- Roberts, M.; Bruce, A.; MacGill, I. Opportunities and barriers for photovoltaics on multi-unit residential buildings: Reviewing the Australian experience. Renew. Sustain. Energy Rev. 2019, 104, 95–110. [Google Scholar] [CrossRef]
- Zhang, F.; Deng, H.; Margolis, R.; Su, J. Analysis of distributed-generation photovoltaic deployment, installation time and cost, market barriers, and policies in China. Energy Policy 2015, 81, 43–55. [Google Scholar] [CrossRef]
- Strupeit, L.; Palm, A. Overcoming barriers to renewable energy diffusion: Business models for customer-sited solar photovoltaics in Japan, Germany and the United States. J. Clean. Prod. 2016, 123, 124–136. [Google Scholar] [CrossRef]
- Kayo, G.; Hasan, A.; Siren, K. Energy sharing and matching in different combinations of buildings, CHP capacities and operation strategy. Energy Build. 2014, 82, 685–695. [Google Scholar] [CrossRef]
- Liu, N.; Wang, J.; Wang, L. Hybrid Energy Sharing for Multiple Microgrids in an Integrated Heat-Electricity Energy System. IEEE Trans. Sustain. Energy 2019, 10, 1139–1151. [Google Scholar] [CrossRef]
- Fina, B.; Auer, H.; Friedl, W. Profitability of active retrofitting of multi-apartment buildings: Building-attached/integrated photovoltaics with special consideration of different heating systems. Energy Build. 2019, 190, 86–102. [Google Scholar] [CrossRef]
- Karunathilake, H.; Hewage, K.; Mérida, W.; Sadiq, R. Renewable energy selection for net-zero energy communities: Life cycle based decision making under uncertainty. Renew. Energy 2019, 130, 558–573. [Google Scholar] [CrossRef]
- Petersen, J.P. Energy concepts for self-supplying communities based on local and renewable energy sources: A case study from northern Germany. Sustain. Cities Soc. 2016, 26, 1–8. [Google Scholar] [CrossRef]
- Zafar, R.; Mahmood, A.; Razzaq, S.; Ali, W.; Naeem, U.; Shehzad, K. Prosumer based energy management and sharing in smart grid. Renew. Sustain. Energy Rev. 2018, 82, 1675–1684. [Google Scholar] [CrossRef]
- Zhou, Y.; Wu, J.; Long, C. Evaluation of peer-to-peer energy sharing mechanisms based on a multiagent simulation framework. Appl. Energy 2018, 222, 993–1022. [Google Scholar] [CrossRef]
- Rathnayaka, A.J.D.; Potdar, V.M.; Hussain, O.; Dillon, T. Identifying prosumer’s energy sharing behaviours for forming optimal prosumer-communities. In Proceedings of the 2011 International Conference on Cloud and Service Computing, Hong Kong, China, 12–14 December 2011. [Google Scholar] [CrossRef]
- Romero-Rubio, C.; de Andrés Díaz, J.R. Sustainable energy communities: A study contrasting Spain and Germany. Energy Policy 2015, 85, 397–409. [Google Scholar] [CrossRef]
- Dóci, G.; Vasileiadou, E.; Petersen, A.C. Exploring the transition potential of renewable energy communities. Futures 2015, 66, 85–95. [Google Scholar] [CrossRef]
- Deutsche Energie-Agentur. Contracting Modelle. 2019. Available online: http://www.kompetenzzentrum-contracting.de/contracting/contracting-modelle/ (accessed on 13 October 2020).
- Deutsche Energie-Agentur. Contracting: Welche Chancen Energiedienstleistung Bietet. 2019. Available online: https://www.dena.de/themen-projekte/energieeffizienz/gebaeude/sanierungsstrategien-und-immobilienwirtschaft/contracting/ (accessed on 13 October 2020).
- Polarstern. Mieterstrom: Contracting als Renditeturbo. 2019. Available online: https://www.polarstern-energie.de/magazin/mieterstrom-contracting-als-renditeturbo (accessed on 13 October 2020).
- Polzin, F.; von Flotow, P.; Nolden, C. What encourages local authorities to engage with energy performance contracting for retrofitting? Evidence from German municipalities. Energy Policy 2016, 94, 317–330. [Google Scholar] [CrossRef]
- Shang, T.; Zhang, K.; Liu, P.; Chen, Z. A review of energy performance contracting business models: Status and recommendation. Sustain. Cities Soc. 2017, 34, 203–210. [Google Scholar] [CrossRef]
- Lee, P.; Lam, P.; Lee, W. Performance risks of lighting retrofit in Energy Performance Contracting projects. Energy Sustain. Dev. 2018, 45, 219–229. [Google Scholar] [CrossRef]
- Faggianelli, G.A.; Mora, L.; Merheb, R. Uncertainty quantification for Energy Savings Performance Contracting: Application to an office building. Energy Build. 2017, 152, 61–72. [Google Scholar] [CrossRef]
- Xu, P.; Chan, E.H.W.; Qian, Q.K. Success factors of energy performance contracting (EPC) for sustainable building energy efficiency retrofit (BEER) of hotel buildings in China. Energy Policy 2011, 39, 7389–7398. [Google Scholar] [CrossRef]
- Fina, B.; Auer, H.; Friedl, W. Profitability of contracting business cases for shared photovoltaic generation and renovation measures in a residential multi-apartment building. J. Clean. Prod. 2020, 265, 121549. [Google Scholar] [CrossRef]
- Mayer, A.; Supple, D.; Kuhn, V.; Lines, S. Energy Performance Contracting in the European Union: Creating common “model” definitions, processes and contracts. Institute for building efficiency. An initiative of Johnson Controls. 2010. Available online: http://www.buildup.eu/sites/default/files/content/InstituteBE-EnergyPerformanceContractingintheEU-Commonmodelsdefinitions,Contracts,Processes.pdf (accessed on 20 December 2020).
- Zhou, Y.; Evans, M.; Yu, S.; Sun, X.; Wang, J. Linkages between policy and business innovation in the development of China’s energy performance contracting market. Energy Policy 2020, 140, 111208. [Google Scholar] [CrossRef]
- Sorrell, S. The economics of energy service contracts. Energy Policy 2007, 35, 507–521. [Google Scholar] [CrossRef]
- Sorrell, S. The Contribution of Energy Service Contracting to a Low Carbon Economy; Tyndall Centre for Climate Change Research: Norwich, UK, 2005. [Google Scholar]
- Klinke, S. The determinants for adoption of energy supply contracting: Empirical evidence from the Swiss market. Energy Policy 2018, 118, 221–231. [Google Scholar] [CrossRef]
- Bleyl-Androschin, J.W. Conservation First! The New Integrated Energy-Contracting Model to Combine Energy Efficiency and Renewable Supply in Large Buildings and Industry; European Council for an Energy Efficient Economy. Grazer Energieagentur: Graz, Austria, 2011. [Google Scholar]
- Richter, M. Utilities’ business models for renewable energy: A review. Renew. Sustain. Energy Rev. 2012, 16, 2483–2493. [Google Scholar] [CrossRef]
- Stephan, A. Bachelorthesis: Eigenverbrauchsoptimierung einer oeffentlichen Schule mit Schwimmbad durch optimale Dimensionierung von PV und BHKW mit Hilfe von Simulationen in Matlab, Hochschule fuer Angewandte Wissenschaften Hamburg and Baureferat Muenchen, Germany. 2016. Available online: https://reposit.haw-hamburg.de/handle/20.500.12738/7608 (accessed on 20 September 2020).
- Google Maps. 2020/2009 GeoBasis-DE/BKG, GeoContent, Maxar Technologies, Kartendaten 2020 COWI. 2019. Available online: https://www.google.at/maps/place/F%C3%B6rderverein+der+Grundschule+an+der+Bergmannstra%C3%9Fe+36+e.V./@48.1354713,11.5364927,55m/data=!3m1!1e3!4m5!3m4!1s0x479dd8a8f0398b7b:0x5e7a6a63d1c8cf05!8m2!3d48.1355104!4d11.5370332 (accessed on 15 September 2020).
- LPG, Noah Pflugradt. LoadProfileGenerator. 2019. Available online: https://www.loadprofilegenerator.de/ (accessed on 10 October 2020).
- Office of Energy Efficiency & Renewable Energy (EERE). Commercial and Residential Hourly Load Profiles for all TMY3 Locations in the United States. 2013. Available online: https://openei.org/doe-opendata/dataset/commercial-and-residential-hourly-load-profiles-for-all-tmy3-locations-in-the-united-states (accessed on 10 October 2020).
- OeGUT. Energiefluesse in Buerogebaeuden—(NEWID-IST). 2014. Available online: https://www.oegut.at/downloads/pdf/e_newid-endbericht.pdf (accessed on 8 October 2020).
- Hayner, M.; Ruoff, J.; Thiel, D. Faustformel Gebaeudetechnik Fuer Architekten. 2010. Available online: https://www.randomhouse.de/leseprobe/Faustformel-Gebaeudetechnik/leseprobe_9783421037398.pdf (accessed on 8 October 2020).
- winenergy, Wirtschaftskammer OOe, Oekologische Betriebsberatung, O.Oe. Energiesparverband. Energiekennzahlen und -Sparpotenziale Fuer Buerogebaeude. 1997. Available online: http://www.win.steiermark.at (accessed on 8 October 2020).
- AGCS. Lastprofile 2019. Available online: https://www.agcs.at/de/clearing/technisches/lastprofile (accessed on 10 October 2020).
- Netzwerk Energiewende jetzt. Energiegenossenschaften Gruenden. 2020. Available online: https://www.energiegenossenschaften-gruenden.de/energiegenossenschaften.html (accessed on 7 July 2020).
- Pfenninger, S.; Staffell, I. renewables.ninja 2019. Available online: https://www.renewables.ninja/ (accessed on 10 October 2020).
- OOe Energiesparverband. PV-Eigenverbrauchsanlagen Checkliste & Planungshilfe. Available online: https://www.energiesparverband.at/fileadmin/esv/Broschueren/PV-Eigenverbrauchsanlagen-Betriebe.pdf (accessed on 5 October 2020).
- SolaranlagenPortal. Die Kosten Fur Eine Photovoltaikanlage. 2019. Available online: https://www.solaranlagen-portal.com/photovoltaik/kosten (accessed on 5 October 2020).
- Solarfassade. Wirtschaftlichkeitsrechner. Available online: http://www.solarfassade.info/de/rechner/scenario.php (accessed on 12 August 2020).
- Solarfassade. Kosten. Available online: http://www.solarfassade.info/de/wirtschaftlichkeit/kosten/index.php (accessed on 12 August 2020).
- Stadtwien.at. Photovoltaikanlagen: So sind die Preise in Oesterreich. Available online: https://www.stadt-wien.at/immobilien-wohnen/photovoltaik/preise.html (accessed on 12 August 2020).
- BDEW. ITG Institut fuer Technischen Gebaeudeausruestung Dresden Forschung und Anwendung GmbH, Germany. BDEW-Heizkostenvergleich Altbau 2017. 2018. Available online: https://www.bdew.de/media/documents/Heizkostenvergleich_Altbau.pdf (accessed on 11 October 2020).
- KWH Preis U. Heizsparer. Available online: https://www.weber-kg.at/images/pagecontent/feuerungsanlage/Zentralheizungskessel/545231_ratgeber-bhkw.pdf (accessed on 11 October 2020).
- Wagenblass, D. Welche BHKW Kosten Fallen in der Anschaffung und Beim Betrieb an. 2017. Available online: https://partner.mvv.de/blog/welche-bhkw-kosten-fallen-in-der-anschaffung-und-beim-betrieb-an (accessed on 11 October 2020).
- Stuttgart, Germany. Baukosteninformationszentrum Deutscher Architektenkammern (BKI). BKI Kostenplaner 21. Available online: https://bki.de/kostenplaner.html (accessed on 11 August 2020).
- SOLARier Gesellschaft fuer erneuerbare Energie mbH. Energieprofis Fuer’s Haus. Available online: https://www.solarier.at/ (accessed on 12 August 2020).
- Greenhouse Media GmbH. Energie-Experten. Available online: https://www.energie-experten.org/ (accessed on 12 August 2020).
- Verbund. Abrechnung—Strom (Own Private Electricity Bill). 2019. Available online: https://www.verbund.com/de-at/privatkunden (accessed on 1 July 2019).
- Stadtwerke Klagenfurt. RechnungWaerme (Own Private Heating Bill). 2017. Available online: https://www.stw.at/privat/energie/fernwaerme/ (accessed on 1 July 2017).
- MATLAB, The MathWorks, Natick, MA, USA. MATLAB-R2016b. 2016. Available online: https://de.mathworks.com/products/matlab.html (accessed on 30 December 2020).
- Loefberg, J. YALMIP: A Toolbox for Modeling and Optimization in MATLAB 2004. Available online: https://yalmip.github.io/ (accessed on 30 December 2020).
- Gurobi Optimization, Beaverton, Oregon, USA Gurobi 7.0.1. 2019. Available online: https://www.gurobi.com (accessed on 30 December 2020).
- Monsberger, C. Profitability of Energy Supply Contracting and Tenant Electricity Sharing Models In a Mixed Urban Neighborhood. Master’s Thesis, Technische Universitaet Wien, Vienna, Austria, 2020. Available online: https://repositum.tuwien.at/handle/20.500.12708/1241 (accessed on 10 October 2020).
- Bundesnetzagentur. Wie Setzt Sich der Strompreis Zusammen. 2019. Available online: https://www.bundesnetzagentur.de/SharedDocs/FAQs/DE/Sachgebiete/Energie/Verbraucher/PreiseUndRechnungen/WieSetztSichDerStrompreisZusammen.html (accessed on 7 July 2020).
- Ullrich, S. Anlagenpreise Sinken bis 2030 auf Fast die Haelfte. 2015. Available online: https://www.erneuerbareenergien.de/archiv/anlagenpreise-sinken-bis-2030-auf-fast-die-haelfte-150-436-88875.html (accessed on 7 July 2020).
- EEX. European Emission Allowances. 2019. Available online: https://www.eex.com/de/marktdaten/umweltprodukte/spotmarkt/european-emission-allowances (accessed on 25 November 2019).
- WIFO; Kratena, K.; Meyer, I.; Sommer, M. Alternative Szenarien zur Entwicklung des Energieverbrauchs in Oesterreich Der Einfluss der CO2- und Energiepreise bis 2030. 2014. Available online: https://www.wifo.ac.at/jart/prj3/wifo/resources/person_dokument/person_dokument.jart?publikationsid=47268&mime_type=application/pdf (accessed on 7 August 2020).
- Breitschopf, B.; Waschsmuth, J.; Schubert, T.; Ragawitz, M.; Schleich, J. ECOFYS, Fraunhofer ISI, CASE Prices and costs of EU Energy—Annex 2 Econometrics. 2016. Available online: https://ec.europa.eu/energy/sites/ener/files/documents/annex2_ecofys2016.pdf (accessed on 7 August 2020).
- OIB RL 6. OIB Richtlinie 6—Energieeinsparung und Waermeschutz. 2011. Available online: https://www.oib.or.at/sites/default/files/rl6_061011_2.pdf (accessed on 11 November 2020).
- OOe Energiesparverband. LED—Gute und Effiziente Beleuchtung Fuer Betriebe. Available online: https://www.richtig-hell.at/fileadmin/redakteure/Richtig-Hell/LED-Beleuchtung-Betriebe-2014.pdf (accessed on 7 August 2020).
- co2online. Beleuchtung in Unternehmen: Mit zwei Beispielen Einfach Energie sparen. Available online: https://www.co2online.de/energie-sparen/energiesparen-im-unternehmen/beleuchtung-in-unternehmen/ (accessed on 7 August 2020).
- Wagenblass, D. Stromfresser Beleuchtung: So Sparen Unternehmen Energie ein 2018. Available online: https://partner.mvv.de/blog/stromfresser-beleuchtung-so-sparen-unternehmen-energie-ein (accessed on 23 September 2020).
Figure 1.
Assumed neighborhood with building dimensions (picture detail from [
41]).
Figure 1.
Assumed neighborhood with building dimensions (picture detail from [
41]).
Figure 2.
Electricity and heating demand allocation.
Figure 2.
Electricity and heating demand allocation.
Figure 3.
Flow chart of the optimization framework.
Figure 3.
Flow chart of the optimization framework.
Figure 4.
Installed local energy capacities for the housing associations’ business case ‘Full Contracting’.
Figure 4.
Installed local energy capacities for the housing associations’ business case ‘Full Contracting’.
Figure 5.
Comparison of monthly profits of contractor for gas heating and district heating (DH).
Figure 5.
Comparison of monthly profits of contractor for gas heating and district heating (DH).
Figure 6.
Installed local energy capacities for the external contractor business case.
Figure 6.
Installed local energy capacities for the external contractor business case.
Figure 7.
Installed local energy capacities for the energy cooperative business case.
Figure 7.
Installed local energy capacities for the energy cooperative business case.
Figure 8.
Comparison of monthly profits of contractor for examined business cases.
Figure 8.
Comparison of monthly profits of contractor for examined business cases.
Figure 9.
Comparison of installed and maximum capacities for the examined business cases.
Figure 9.
Comparison of installed and maximum capacities for the examined business cases.
Figure 10.
Comparison of monthly profit for contractor and cost savings for residents between the Austrian default and higher retail electricity costs in Germany.
Figure 10.
Comparison of monthly profit for contractor and cost savings for residents between the Austrian default and higher retail electricity costs in Germany.
Figure 11.
Comparison of monthly profit for contractor and cost savings for residents between default and 30% reduced investment costs of the local energy technologies.
Figure 11.
Comparison of monthly profit for contractor and cost savings for residents between default and 30% reduced investment costs of the local energy technologies.
Figure 12.
Resulting annual CO emissions and costs for: (a) default contracting case; (b) higher emission costs of 70 €/tCO2.
Figure 12.
Resulting annual CO emissions and costs for: (a) default contracting case; (b) higher emission costs of 70 €/tCO2.
Figure 13.
Comparison of monthly profit for contractor and cost savings for residents between default and higher emission costs of 70 €/t.
Figure 13.
Comparison of monthly profit for contractor and cost savings for residents between default and higher emission costs of 70 €/t.
Table 1.
Energy demand of the buildings.
Table 1.
Energy demand of the buildings.
| | Energy Demand per Year | Source and Explanation |
|---|
| Electricity demand of the neighborhood | |
| Residential building | 222 MWh | The simulated data are generated with [42] for 70 housing units for the location of Vienna |
| Business building | 1043 MWh (163 MWh for supermarket, 880 MWh for offices) | The simulated load profile is collected from [43] for the location of Boston in the US (due to climate conditions similar to Austria), while the data are adapted to Austrian conditions in line with [44,45,46] |
| School building (including a swimming pool) | 95 MWh | The profile is derived from [40] as measured data for the location of Munich, Germany (similar climate conditions to Austria) |
| Heating demand of neighborhood | |
| Residential building | 700 MWh | The data are acquired from [47] as Austrian standard load profiles for 70 housing units of 10,000 kWh demand each |
| Business building | 664 MWh (62 MWh for supermarket, 602 MWh for offices) | The simulated load profile is collected from [43] for the location of Boston in the US (due to climate conditions similar to Austria), while the data are adapted to Austrian conditions in line with [44,45,46] |
| School building (including a swimming pool) | 590 MWh | The profile is derived from [40] as measured data for the location of Munich, Germany (similar climate conditions to Austria) |
Table 2.
Considered business cases, interest rates and depreciation times.
Table 2.
Considered business cases, interest rates and depreciation times.
| | i | n | Description |
|---|
| Housing association | |
| Full Contracting | 3% | 20 y | Housing association is considered a contractor in this study (can provide energy systems and profit from energy sharing). Contractor finances, installs, operates and maintains local energy system. Residents pay 10% less for local compared to grid energy.
![Energies 14 00921 i001 Energies 14 00921 i001]() |
| Rent model | 3% | 20 y | Residents pay a fixed monthly sum for local energy for the purpose of renting parts of the electric and thermal energy system for ‘self-supply’ of locally generated energy. Grid electricity for HP and grid gas for mCHP are paid by No explicit distinction between local electricity and heat costs.
![Energies 14 00921 i002 Energies 14 00921 i002]() |
| Full Contracting with energy efficiency measures | 3% | 20 y | Additional energy efficiency measures (insulation, efficient lighting) paid and applied by contractor (lower heat and electricity loads). Residents pay 10% less for energy compared to default contractor has higher profit due to higher local energy costs.
![Energies 14 00921 i003 Energies 14 00921 i003]() |
| External contractor | |
| Full Contracting | 12% | 5 y | |
| Energy cooperative | |
| Full Contracting | 3% | 25 y | |
Table 3.
PV full load hours.
Table 3.
PV full load hours.
| | South-Facing PV | East-Facing PV | West-Facing PV | North-Facing PV |
|---|
BAPV full load hours
30-tilted | 1200 h | 996 h | 1032 h | 796 h |
BIPV full load hours
90-tilted | 873 h | 668 h | 726 h | 422 h |
Table 4.
Costs and maximum capacities for new energy system technologies.
Table 4.
Costs and maximum capacities for new energy system technologies.
| | | | | max. Capacity |
|---|
| PV system | |
| BAPV (roof) | 994 €/kWp [50] | 500 €/kWp [51] | | 240 kWp (S) |
| | | | | 60 kWp (E) |
| | | | | 120 kWp (W) |
| | | | | 195 kWp (N) |
| BIPV (facade) | 2800 €/kWp [52] | 710 €/kWp [53] | | 30 kWp (S) |
| | | | | 30 kWp (E) |
| | | | | 15 kWp (W) |
| | | | | 45 kWp (N) |
| | | | 250 €/year [54]
(for all PV) | |
| mCHP system (gas-fired) | |
| | 1084 €/kW [55] | 5000 € [56] | 1000 €/year [57] | 200 kW |
| HP system (air-to-water) | |
| | 859 €/kW [55,58] | 1000 € [59] | 67 €/year [60] | 200 kW |
Table 5.
Costs for energy system.
Table 5.
Costs for energy system.
| | (€/kWh) | (€/kW) | (€/year) | (€/kWh) |
|---|
| Costs for electricity | |
| Electricity grid | 0.21 [61] | 16 [61] | 50, based on estimation | 0.9 × 0.21 |
| Costs for heat | |
| Gas grid | 0.06 [61] | 9 [61] | 50, based on estimation | 0.9 × 0.06 |
| DH grid | 0.08 [62] | 29 [62] | 50, based on estimation | 0.9 × 0.08 |
Table 6.
Grid energy costs and local energy costs for ‘Rent model’.
Table 6.
Grid energy costs and local energy costs for ‘Rent model’.
| | Energy Grid Costs
Default Case (€/kWh) | Energy Costs for
‘Rent Model’ (€/kWh) |
|---|
| Electricity | 0.213 | 0.190 |
| Gas/heat | 0.061 | 0.079 |
Table 7.
Grid energy costs and local energy costs with energy efficiency measures.
Table 7.
Grid energy costs and local energy costs with energy efficiency measures.
| | Energy Grid Costs
Default Case (€/kWh) | Energy Costs after Energy
Efficiency Measures (€/kWh) |
|---|
| Electricity | 0.213 | 0.245 |
| Gas/heat | 0.061 | 0.070 |
Table 8.
Comparison of contractor’s and residents’ annual profits for examined business cases.
Table 8.
Comparison of contractor’s and residents’ annual profits for examined business cases.
| | Housing
Association | External
Contractor | Energy
Cooperative |
|---|
| | Full
Contracting | Rent Model | Energy
Efficiency
Measures | Full
Contracting | Full
Contracting |
Profit
contractor | 84,526 € | 117,454 €
(+39%) | 130,183 €
(+54%) | 10,818 €
(−87%) | 50,322 €
(−40%) |
Energy
cost savings
residents | 42,660 € | 48,036 €
(+12%) | 48,036 €
(+12%) | 20,508 €
(−52%) | 47,311 €
(+11%) |
| Capacity | | | | | |
| PV | 240 kWp | 240 kWp | 240 kWp | 0 kWp | 240 kWp |
| PV | 60 kWp | 60 kWp | 60 kWp | 0 kWp | 60 kWp |
| PV | 120 kWp | 120 kWp | 120 kWp | 0 kWp | 120 kWp |
| PV | 4 kWp | 29 kWp | 9 kWp | 0 kWp | 195 kWp |
| PV | 0 kWp | 0 kWp | 0 kWp | 0 kWp | 30 kWp |
| PV | 0 kWp | 0 kWp | 0 kWp | 0 kWp | 30 kWp |
| PV | 0 kWp | 0 kWp | 0 kWp | 0 kWp | 15 kWp |
| PV | 0 kWp | 0 kWp | 0 kWp | 0 kWp | 45 kWp |
| Capacity | | | | | |
| mCHP | 200 kWth | 200 kWth | 200 kWth | 106 kWth | 200 kWth |
| Capacity | | | | | |
| HP | 137 kW | 200 kW | 200 kW | 0 kW | 200 kW |
Table 9.
CO conversion factors used in calculations.
Table 9.
CO conversion factors used in calculations.
| | Conversion Factor (kg/kWh) [72] |
|---|
| Electricity from grid | 0.417 |
| Gas from grid | 0.236 |
Table 10.
Energy costs’ increase due to an increase of CO costs.
Table 10.
Energy costs’ increase due to an increase of CO costs.
| | Default Energy Costs
(€/kWh) | Assumed Energy Costs 2030
(€/kWh) |
|---|
| Electricity from grid | 0.213 | 0.232 |
| Gas from grid | 0.061 | 0.071 |
| Publisher’s Note: MDPI stays neutral with regard to jurisdictional claims in published maps and institutional affiliations. |
© 2021 by the authors. Licensee MDPI, Basel, Switzerland. This article is an open access article distributed under the terms and conditions of the Creative Commons Attribution (CC BY) license (http://creativecommons.org/licenses/by/4.0/).

