1. Introduction
Countries around the world are in the process of energy transition, which involves electricity as the preferred energy source. It is beneficial in terms of both renewability and energy efficiency. Electricity is an efficient energy carrier, and it becomes a clean source of energy when obtained from renewable energy sources (RES). The share of electricity in the total world final energy consumption (
TFEC) is about one-fifth, but it is much higher in high-income countries and is growing rapidly in developing countries [
1,
2,
3]. In second place in terms of greenhouse gas emissions is electricity, which is still closely related to fossil fuel sources. An important part of this process is the commitment of countries around the world to reduce the negative effects of climate change. The share of RES in the global demand for electricity in the next decade will reach 80%, and by 2025 will exceed the share of coal in total electricity production. By 2030, solar photovoltaics, wind energy, hydropower, bioenergy, geothermal energy, and a combination of solar and marine energy will provide about 40% of electricity supply [
4]. The coming decade may be crucial as the cost of renewable energy continues to fall [
5]. Renewables can provide two-thirds of the world total energy demand and contribute to the majority of greenhouse gas emissions reduction required by 2050 to keep average global surface temperatures below 2 °C [
6]. New and innovative solutions are required to ensure sustainable energy supply and security while successfully integrating developing countries into the global economic system [
7]. This problem becomes highly relevant in the context of increased regionalization, acute global competition, pressing problems of energy efficiency, and high intensity of comparative energy production [
8,
9,
10,
11,
12,
13,
14].
Variable RES, such as solar photovoltaic power and wind energy, are key technologies to achieve decarbonization of the energy sector. However, they differ significantly from conventional power generation sources. As the share of renewable energy variables increases, these differences lead to numerous problems in energy systems [
15]. Failure to address these problems can undermine the reliability of the energy system or the achievement of decarbonization goals [
16,
17]. Variable sources of renewable energy are not only supply-side variables but also virtually free of irregular costs [
18]. A significant share of renewable energy production comes from renewable energy variables (e.g., wind and solar), which are increasingly installed in decentralized structures. Thus, for a further successful increase in renewable energy share, it is necessary to integrate it into the existing supply and demand structures [
19,
20].
The share of electric power systems based on RES is constantly increasing, which has led to several new problems. Namely, the transition from traditional fossil fuel sources to renewable energy, operational challenges due to frequent and more abrupt surges, and the need to reconcile the dynamic demand for electricity [
21,
22].
Energy transition includes both successes and failures. Favorable energy policy frameworks developed by governments can accelerate energy transitions and determine their direction. Well-designed transition policies consider the characteristics of energy systems and cover energy demand and supply [
23,
24].
For any power system in modern conditions, the need for compensation capacities that would cover peak overloads is also actualized. The introduction of regenerative generation has exacerbated the need for additional high-speed compensation capacities that can not only absorb fluctuations in current demand but also eliminate the temporary daily, seasonal, and summer instability of such generation [
25,
26]. This is especially true for renewable energy sources. Among them, solar stations and wind installations of various bases are being introduced most quickly. However, electricity storage systems can and should perform additional functions that are designed to stabilize the operation of the power system, improve the quality of power supply, maintain voltage and frequency, balance, prevent the consequences of accidents on power grids, and quickly redistribute electricity for the population and industry [
27].
The process of greening the economies of EECCA countries should take into account the development needs of each by elaborating on effective production and consumption systems. Today, due to limited resources and harmful emissions, the pressing issue is the complete elimination of dependence on materials for economic growth and the use of energy resources [
28]. The Russian Federation, which has one of the largest fossil fuel resources in the world, is accelerating the deployment of solar and wind energy through auctions to create benefits for employment, science, technology, and energy security for isolated populations [
29]. Between 2013 and 2018, more than 5 GW of wind and solar energy has been produced, indicating that the country is likely to surpass its 2024 target of 5.9 GW of installed renewable energy capacity (including geothermal) [
30].
The penetration of RES in liberalized markets has a limit. The ability of the decentralized market to provide transparency of relevant market signals is restricted. Complete decarbonization of the energy sector is unattainable [
31,
32]. Traditional technologies play a principal role in the deployment of RES and, as a consequence, indirectly in decarbonization [
33].
Along with the successful transformation of energy, the possibilities for its storage are being updated. This will require appropriate policies and fundamental policy changes in the context of a concerted and coordinated effort to integrate global issues into local and national policy priorities, such as climate change, health, pollution, energy access, and energy security [
34,
35,
36,
37]. Thus, comprehensive policy development will be required to identify cost-effective multifunctional solutions that can perform multiple tasks simultaneously [
38,
39]. This study is aimed at filling this gap in science, based on the fact that the decarbonization of the energy sector, and an increase in the share of RES, in particular, is one of the main ways to create a successful program for achieving climate goals. All the aforementioned contributed to the objective of this study, which is to determine the extent to which changes in the share of RES, their structural complex, and the level of energy security of EECCA countries in the medium- and long-term are interrelated.
The following hypotheses have been formed on the basis of the research goal:
Hypothesis 1 (H1). Increasing the share of RES contributes to the energy security of EECCA countries;
Hypothesis 2 (H2). Increasing the share of renewable sources contributes to the expansion of energy resources diversification in EECCA countries.
The work is organized as follows:
- −
the regression dependence of the level of energy security and the share of renewable sources in the studied countries was determined and paired linear regression models were formed;
- −
possible structural changes in the complex of energy resources of the studied countries were identified on the basis of a scenario approach in the context of increasing the share of renewable energy sources;
- −
for each scenario, a hierarchical synthesis, a comparative analysis of the results obtained, and justification of the hypotheses were made.
2. Materials and Methods
This research is based on forecast data from the International Renewable Energy Agency (IRENA), REmap’s renewable energy roadmap. It uses two options for predicting the share of renewable energy in the power generation of countries: the scenario of planned energy development (
PES) and the scenario of energy transformation (
TES) [
40,
41]. The scenario of planned energy development is the main reference example for this study, presenting the energy system perspective based on current government energy plans and other planned goals and policies (as of 2020) unless the country has a more recent climate and energy goals or plans. The scenario of energy transformation describes an ambitious yet realistic energy conversion path, based on RES and a steady improvement in energy efficiency (although not limited to these technologies alone).
The share of renewable energy in this study is calculated on the basis of the total final energy consumption indicator. This indicator can be used to calculate the share of energy from renewable sources cumulatively for all sectors or each of them (industry, transport, housing, commercial sector, and agriculture). The share of electricity production from RES is also calculated. At the same time, the calculation of the share of energy from renewable sources by the indicator of total final energy consumption differs from calculations based on the gross final energy consumption. Calculations of the share of energy from renewable sources based on the total final energy consumption indicator and gross final energy consumption indicator have two main differences:
Firstly, the gross final energy consumption indicator includes energy consumed by end-users, the amount of electricity from RES consumed by power plants, and distribution losses, whereas the total final energy consumption indicator includes only total energy used by end-consumers;
Secondly, the RES electric power consumed by the transport sector is added as an application of energy from renewable sources to the volume of electric power production from RES in the indicator of gross final energy consumption, while it is already taken into account in the indicator of total final energy consumption from renewable sources.
Consumption of renewable energy (
) is calculated as follows (in PJ/year):
for a k-number of power generation technologies, where
is the use of energy from RES
l (PJ/yr);
R2 and
F2 are total electricity production based on renewable and fossil fuels.
Share of RES (
) is estimated as follows (%):
where
RE is the total renewable energy consumption (PJ/yr),
is the energy consumption with the use of renewable energy technology i for n technologies, and PJ is the energy use according to the renewable energy technology J (PJ/yr).
E1 is the final energy consumption in the reference case (PJ/yr) for an amount m of electricity production technologies, but considering the changes in total energy demand from the implementation of additional renewable energy technologies in comparison with traditional ones, and
TFEC is final energy consumption according to REmap (PJ/yr) [
42].
The study is based on materials from EECCA countries, as their policies are becoming more and more focused on supporting green growth. For example, Belarus, Kazakhstan, and Kyrgyzstan have approved and committed to long-term programs for transition to a green economy and sustainable development. Belarus, Georgia, Moldova, and Ukraine have introduced low-carbon development strategies and/or national energy efficiency action plans.
For estimating the level of energy security, the study uses an indicator that reflects the ratio of shares of separate principal energy sources in the complex of energy resources that are primarily used in the economy of EECCA countries (natural gas, crude oil, solid fuels, biofuels, waste, nuclear, solar, geothermal, hydro, and wind energy). This indicator is referred to as the Energy Security Coefficient (
ESC) and is determined based on the Shannon–Wiener index [
43] as follows:
where
ESC is an indicator of the structural diversity of the energy complex in a particular country,
N is the total number of energy sources in the structure of the energy complex of this country, and
is the specific weight of the
n-th energy source in the energy supply of the country. The specific share of each energy source is determined as a part of the total volume of energy produced from all energy resources of the country.
The advantage of using the Shannon-Wiener coefficient is the ability to determine the level of diversification of the state’s energy resources and compare it with other countries or regions. In this case, a limitation arises, expressed in the dependence of the level of this indicator on the share of energy resources.
The maximum value of the indicator is close to zero, i.e., the lower this indicator is, the higher the level of energy security. Thus, the study assumes that a high level of energy diversification indicates the energy security of an individual country or, in this case, a group of countries—EECCA, which forms a regional market. The
ESC may not be normalized and reduced to a single measurement scale, so it is used directly as a normalized, dimensionless indicator. A fragment of the starting data used for the calculations is given in
Table 1.
The initial data in
Table 1 were formed on the basis of country profiles provided by the International Renewable Energy Agency.
The methodological approach to modeling was based on solving the problem of nonlinear optimization by selecting a certain scenario.
In the first stage, the regression dependence of the energy security level in two approaches (yPES and yTES) on the share of renewable sources (x) in the studied countries was determined.
In the second stage, the paired linear regression model yn = an + bn × x was determined. For identification of possible structural changes in the complex of energy resources of EECCA countries towards RES, three scenarios were proposed on the basis of PES and TES. These scenarios foresee an increase in the share of renewable sources in the energy complex on a growing basis in 2030, 2040, and 2050. Thus, yPES and yTES estimates for each scenario have been defined.
In the third stage, the specific weight of the optimality criteria was determined, that is, yPES and yTES were ranked according to their importance. The following grading levels were used: equal criteria—1; a moderate advantage of one criterion over another—3; a strong advantage of one criterion over another—6; a very strong advantage of one criterion over another—9.
The fourth stage was rationing. For this purpose, the arithmetic mean was determined for each indicator of yPES and yTES, and the specific weight for each scenario is the arithmetic mean of the sum of shares, which is the actual way to calculate PESn and TESn.
In the fifth step, the formula determines the weighted sum of each scenario, the hierarchical synthesis (HSI), and the comparative characteristics of the results obtained.
The proposed methodological approach provides an opportunity to assess the degree of influence of renewable energy sources on the level of energy security of countries in the context of energy resources diversification. Considering that the level of energy security may depend on many other factors and risks, the proposed methodological approach can be part of the toolkit for substantiating the energy security policy of countries and regions.
3. Results
In EECCA countries, hydropower is considered the most common renewable source. The main renewable sources of hydropower (over 95%) are located in Armenia, Georgia, Kyrgyzstan, Russia, Tajikistan, Turkmenistan, and Uzbekistan. In Tajikistan, Turkmenistan, and Kyrgyzstan, hydropower is the only renewable source of energy (
Figure 1). The highest level of installed capacity in 2019 was registered in Russia (52,578.5 MW), Tajikistan (5243.45 MW), and Ukraine (4809 MW). Despite the prevalence of hydropower in Turkmenistan as the only source of renewable energy, installed capacity there is the lowest among the countries studied, accounting for 1.2 MW.
Wind and solar power industries are developed in most EECCA countries. The highest level of installed capacity in 2019 was observed in Ukraine, namely 1257.77 MW for wind and 5935.69 MW for solar electricity. Additionally, a high level of installed capacity of solar electricity is typical for Russia, amounting to 1065.82 MW. The development of off-net solar photovoltaic capacity continues to reflect a combination of contrasting major trends in EECCA countries. Retailers of solar lighting and home systems are moving to new markets and consumers are switching to larger systems in some existing markets. However, mini-networks continue to face difficulties in raising finance, while network expansion in some places is reducing demand for off-net power.
Among the EECCA countries, Azerbaijan stands out due to the development of renewable energy based on municipal waste (44 MW). Among the main instruments for power plants operating on RES in Moldova, projects with a capacity of less than 1 MW are supported through Feed-in Tariffs (FiT), while rewards for larger projects are determined at auctions.
For small installations in the Republic of Moldova (with power less than 4 MW in the case of wind and 1 MW in the case of other technologies), first of all, an administrative FiT must be issued. It is assumed that the total capacity of those projects, which will benefit from FiT, will be 55 MW. The government intends to organize tenders for specific technologies with a total capacity of 113 MW (80 MW of which is allocated for wind power and 25 MW for solar photovoltaic stations), which will guarantee fixed tariffs for 15 years [
46]. In addition, in Moldova, the share of biogas is quite high. For example, a sugar company in Drochia processes the waste generated by sugar extraction from sugar beet into biogas (further used to generate electricity and heat) and organic fertilizers [
47].
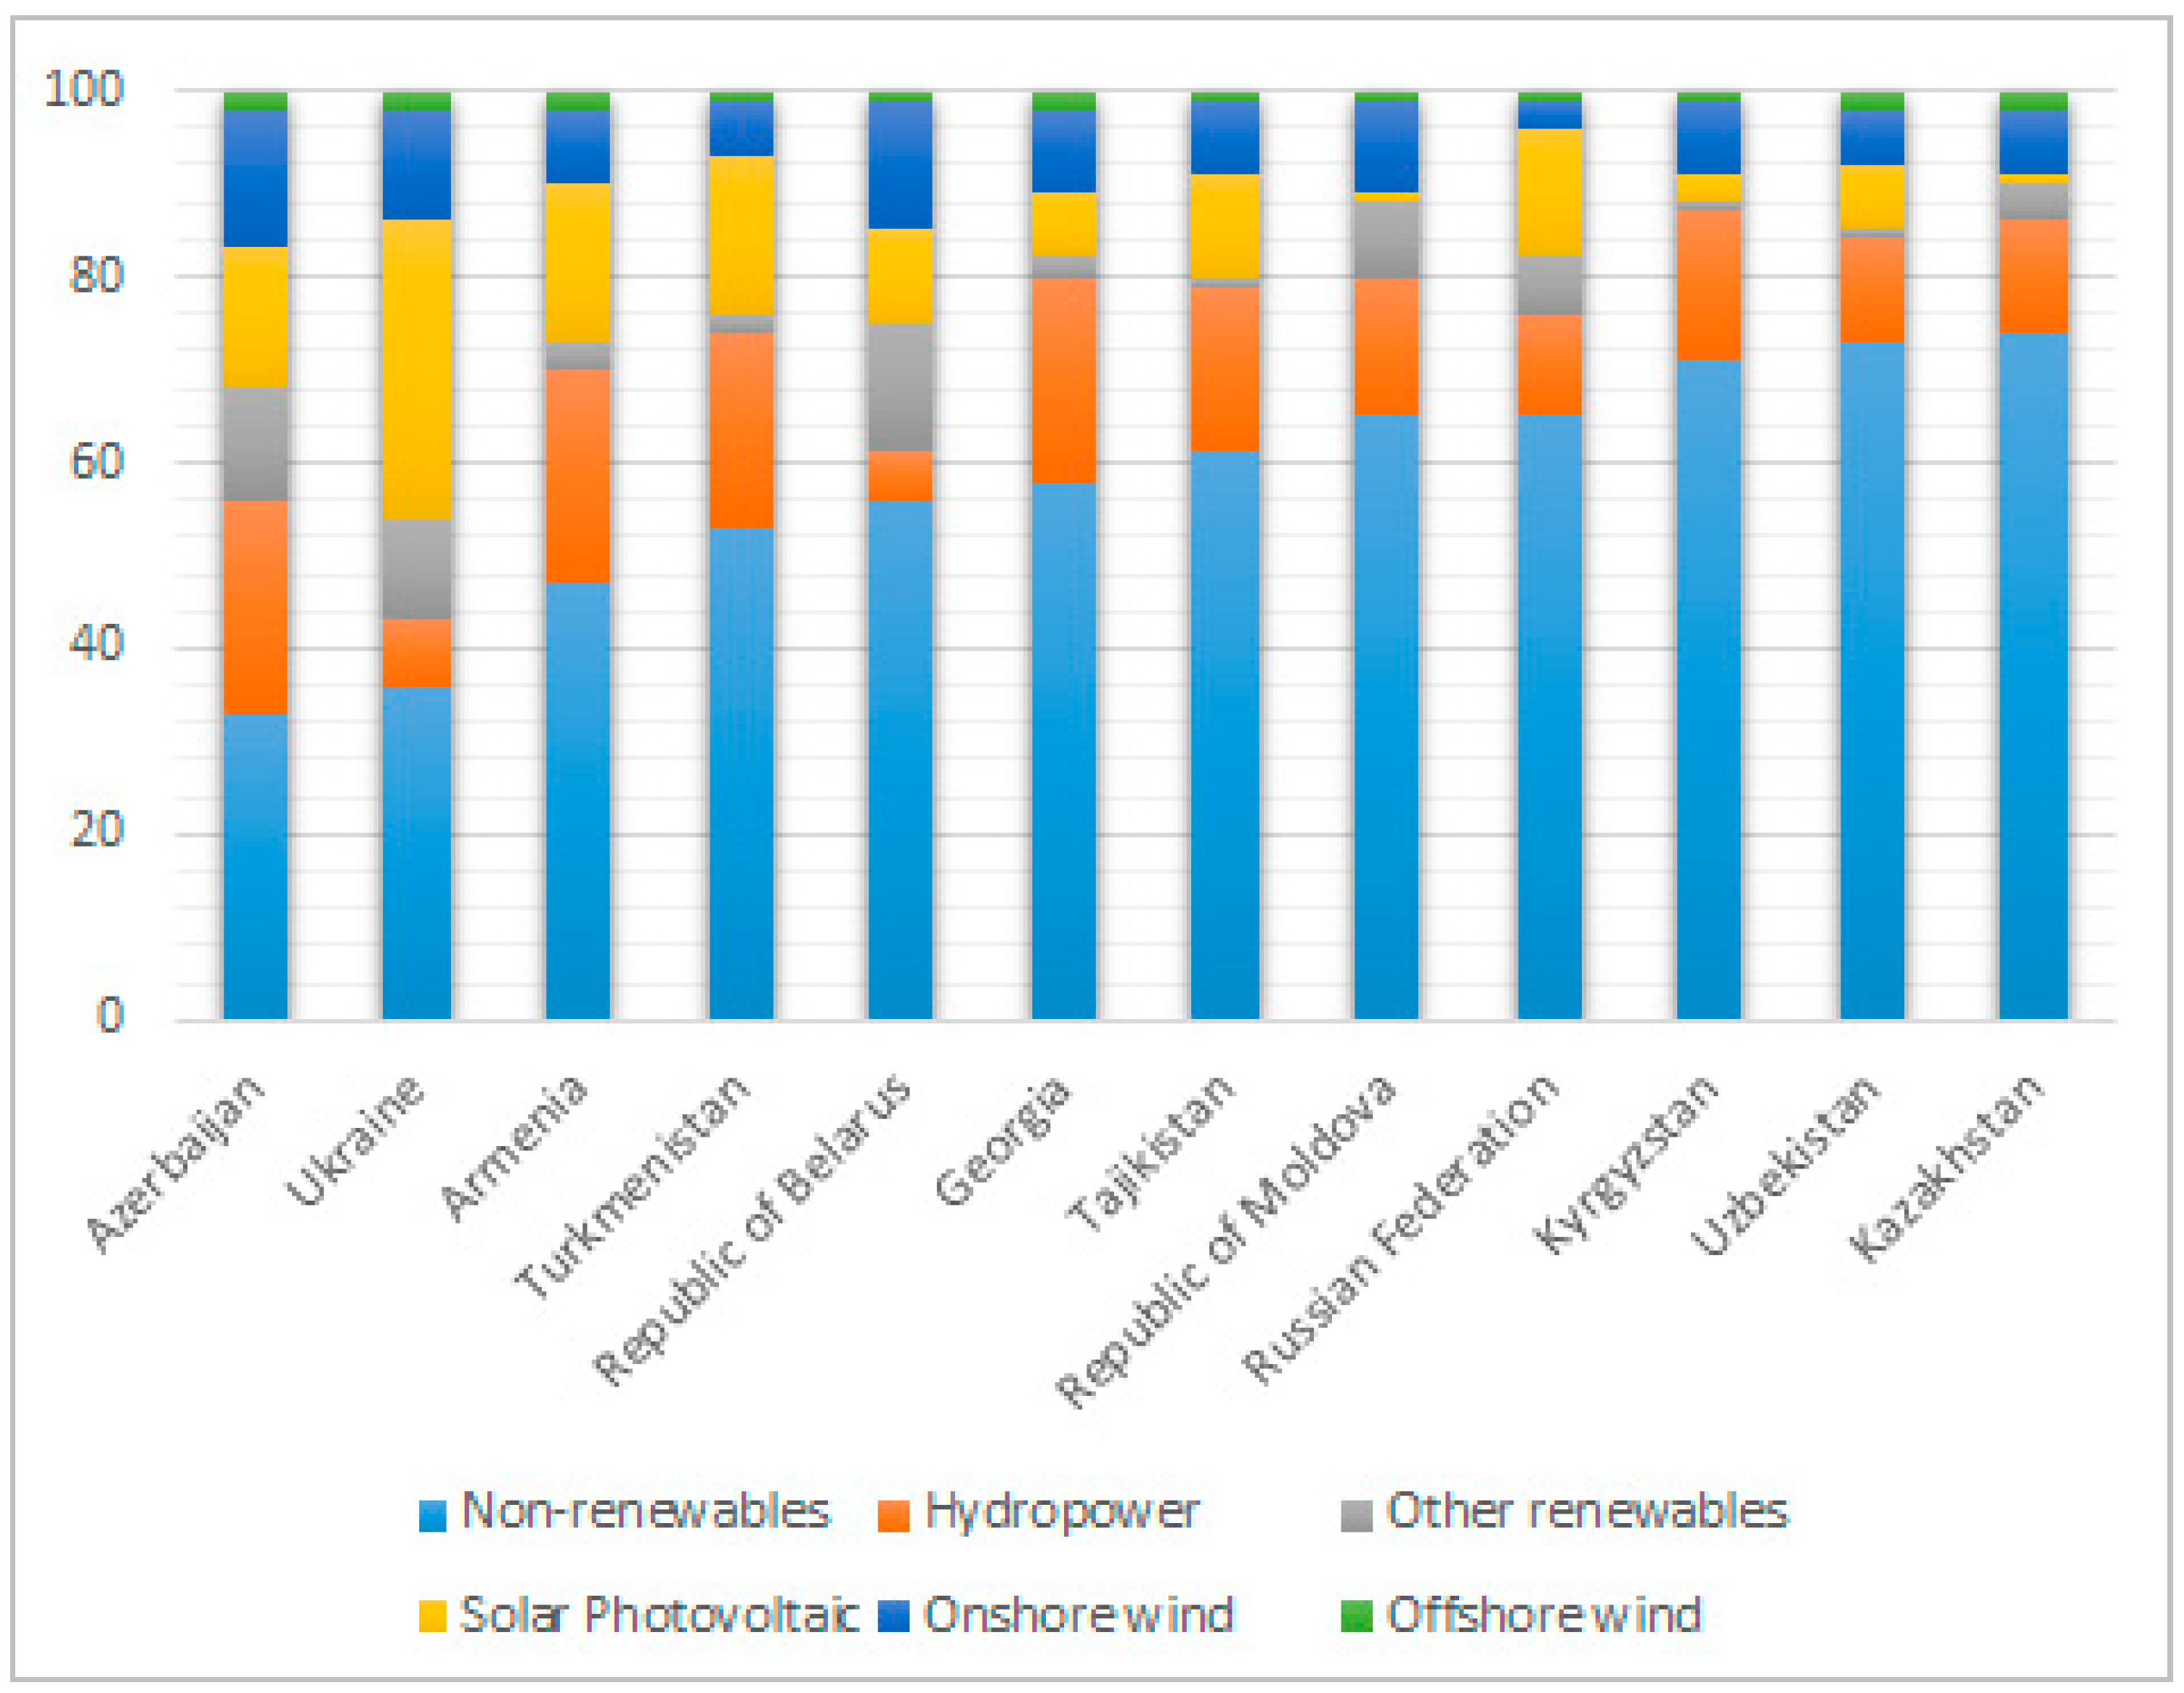
Transformational transition issues should be considered at both the micro and macro levels, creating structures that provide alternatives allowing those individuals and regions trapped in fossil fuel dynamics to participate in the benefits of the transition. Therefore, according to the planned development scenario, the share of renewable sources in the structure of electricity production by 2050 does not exceed 50% in EECCA countries (
Figure 2).
The PES considers the current and planned country policies. It includes commitments and other planned targets based on current government forecasts and their energy plans. At the same time, a significant increase in the share of renewable energy is expected in Azerbaijan (to 67%) and Ukraine (to 64%) through the development of solar energy. The share of solar energy is also assumed to increase significantly in Russia, Kazakhstan, Turkmenistan, and Armenia.
The transforming scenario implies the intensification of renewable energy development and a significant reduction in the share of traditional energy sources in EECCA countries (
Figure 3).
According to TES, the share of RES in Russia can reach 73% (compared to PES—35%) through the development of solar and hydropower. In addition, a significant increase in the share of RES (up to 87–89%) is expected in Armenia, Azerbaijan, Ukraine, and Turkmenistan mainly due to solar energy. In most EECCA countries, hydropower will continue to occupy a significant share (from 11 to 32%) in the energy source structure.
Favorable interaction opens the opportunities to obtain maximum benefits from the transition. Although this analysis focuses on a specific scenario, the pathways to transition may vary, as may the transformation of the socio-economic system itself. Regardless of the specific path chosen by governing bodies, the socio-economic footprint of an overall transition provides adequate tools to measure its effectiveness. Socio-economic benefits from transition (welfare) go far beyond improving GDP and are largely dominated by social and environmental benefits (reduction of local air pollution and reduction of climate impacts by reducing greenhouse gas emissions). At the regional level, the outcome of energy transition depends on a combination of its regional ambitions and the socio-economic structure of EECCA countries. Different regional socio-economic traces as a result of energy development in EECCA countries under different energy transition scenarios may lead to asymmetry in the share of energy sources with clear renewable energy leaders and outsiders, as well as to increased inequality that may eventually develop in transition barriers. Countries with socio-economic systems that depend on oil exports or weak socio-economic structures (e.g., Moldova, Ukraine, Georgia) may experience a decrease in GDP and employment rates. The ability of EECCA countries to benefit from the long-term indirect and induced advantages of the transition period depends on the extent to which their domestic supply chains facilitate the deployment of energy transformation and induced economic activity. Maximal application of social and economic benefits from energy transformation requires increasing the transition ambition, internalization of climate external effects (carbon taxes, phasing out fossil fuel subsidies), and stimulation of diversification and strengthening of deep domestic supply chains [
48,
49,
50].
To determine the relationship between energy security and the share of renewable sources in the energy mix of EECCA countries as of 2019, a regression analysis was performed (
Figure 4).
Tajikistan, Georgia, and Kyrgyzstan have a high level of energy security in the context of the use of renewable energy sources, namely, as a result of the development of hydropower. A high level of energy security is observed in the Russian Federation, Armenia, Ukraine, and Kazakhstan. This can be attributed to an active expansion of renewable energy resources in these countries through strategic decisions and related programs from the state in recent years. It allowed diversifying the types of RES to promote their active introduction and use. The largest share of renewable sources is found in Kyrgyzstan, Tajikistan, and Georgia. The main prerequisite for this is the widespread use of hydroelectricity. It can be argued that the energy complexes of these countries depend on this particular energy resource. However, insufficient attention is paid to the development of other renewable sources.
PES and
TES were used for scenario modeling, based on which the energy safety indicator and projected share of RES were calculated. Forecast results are shown in
Figure 5 and
Figure 6.
The high level of energy security of Kyrgyzstan, Tajikistan, and Georgia is a consequence of the high share of renewable sources in the structure of the energy balance of these countries. At the same time, the negative side of this phenomenon can be considered the mono-directionality of the development of renewable energy in the context of diversification of energy resources.
According to the results of PES and TES, the Russian Federation, Ukraine, Kazakhstan, and Armenia remain the leaders in terms of energy security, and the share of renewable sources in the structure of the energy complex prevails in Tajikistan, Kyrgyzstan, and Georgia, while Turkmenistan mainly uses natural gas. At the same time, for Turkmenistan and Belarus, the low level of energy security is the result of the use of a small variety of non-renewable sources. This has a negative impact on both the development of renewable energy and the level of diversification of energy resources in these countries.
In order to determine how the level of energy security depends of the share of renewable resources for the EECCA countries as a whole, scenario modeling was carried out on a progressive basis until 2050 (
Table 2).
The increase in the share of renewable sources has an impact on the energy security in EECCA countries following both scenarios (PES and TES), which demonstrates the trend of decreasing energy dependence throughout the three scenarios (2030–2050) and promotes energy security, thus confirming the first hypothesis. However, the degree of this influence is relatively high (18%). A 1% increase in the share of RES will increase energy security by 2% according to PES and by 2.5% according to TES. This confirms the second hypothesis of this study, although the performance on indicators is quite low. Therefore, EECCA countries should not only increase the share of renewable sources but also attach strategic importance to the structural content of the state energy complex.
4. Discussion
The advantage of this study is the determined relationship and the degree of influence of the share of RES on the level of energy security of countries in quantitative terms. This provides an opportunity to assess the potential of the formed national and regional programs and targets of states and their associations. Based on the findings, incentive policies and regulatory frameworks can be adapted to mobilize a six-fold acceleration in renewable energy growth. The structural content of renewable sources in each country should also be taken into account. For example, the largest growth is estimated in wind power and solar photovoltaic technologies, complemented by high levels of energy efficiency [
51,
52].
The limitation of this study is the likely development of new technologies that can significantly affect such a long-term forecast. However, to ensure that carbon dioxide emissions are eliminated, new technologies and innovations will be required, especially in the transport and manufacturing sectors, which are largely ignored in international discussions [
53,
54].
This study can be a good complement to the assessment and monitoring of energy transition. At the same time, the range of countries studied should be broadened, since the scale of the required transition is such that it can only be carried out within the framework of a joint process with the participation of the whole society. To ensure effective involvement, it is necessary to ensure a fair distribution of costs and benefits associated with the energy transition, and the transition itself should be carried out on an equitable basis. Universal access to energy is a principal component of a fair and equitable transition. In addition to access to energy, there is currently a huge disparity in energy services provided in different regions. The transition process will be completed only when energy services are combined in all regions. Transition scenarios and planning should consider access and convergence issues. The social accounting system that visualizes the contribution and obligations of individuals, communities, countries, and regions to the transition process should be encouraged and simplified. Progress should be made in defining fair transition costs [
55,
56].
This study refutes the view that the efficient penetration of RES can be a victim of its own success. With the current market architecture, the future use of renewable energy is bound to be less expensive and more scalable. However, to increase the share of renewable technologies, they must coexist with fossil fuel technologies. by If EECCA countries will ignore these results, it may slow down relevant policy decisions and increase the cost of deploying new renewable technologies. Moreover, there is a long-term relationship between conventional and renewable energy, and both sources of energy have a positive impact on energy efficiency, but renewable energy is more profitable than conventional energy in terms of energy efficiency [
57]. Increased use of RES and energy efficiency will stimulate economic growth and create new working places [
58,
59,
60].
The limitation of this study is also the unpredictability of the post-crisis energy development. Recovery measures after the COVID-19 pandemic may include flexible power networks, efficient solutions, charging of electric vehicles, energy storage, integrated hydropower, green hydrogen, and other investments in technologies that are consistent with long-term energy and climate sustainability [
61,
62]. Appropriate goals and policies are required to develop strong renewable energy supply chains and manage the socio-economic impacts of the energy transition [
63]. All this can affect the deviation of the results obtained. However, the proposed methodological approach can be implemented as a monitoring tool to control the achievement of the set goals during the energy transition.
In the future, this study can be deepened in the direction of expanding the constituent components of the energy security indicator, the formation of its variations, and the combinatorics of an increase of the share of different renewable sources to varying degrees. The study can also be expanded on the basis of studying the presented problems in different regions of the world [
64,
65,
66].
5. Conclusions
Among RES in EECCA countries, hydropower accounts for a significant share. The principal renewable source (over 95%) of hydropower is in Armenia, Georgia, Kyrgyzstan, Russia, Tajikistan, Turkmenistan, and Uzbekistan. The highest level of installed capacity in 2019 was in Russia, Tajikistan, and Ukraine. Wind and solar power is being developed in most EECCA countries. The development of off-grid solar photovoltaic capacity continues to reflect a combination of contrasting major trends in these countries. Among the EECCA countries, Azerbaijan stands out due to the development of renewable energy based on municipal waste. Among the main instruments for power plants operating on RES in Moldova, projects with a capacity of less than 1 MW through FiT are supported, while rewards for larger projects are determined at auctions.
According to the planned development scenario, the share of renewable sources in the structure of electricity production for 2050 does not exceed 50% in EECCA countries. At the same time, a significant increase in the share of RES is assumed in Russia, Kazakhstan, Turkmenistan, Armenia, Azerbaijan, and Ukraine due to the development of solar energy. According to TES, the share of RES in Russia may reach 73% (compared to PES—35%) through the development of solar power and hydropower. In addition, a significant increase in the share of RES (up to 87–89%) is expected in Armenia, Azerbaijan, Ukraine, and Turkmenistan mainly due to solar energy. In most EECCA countries, hydropower will continue to occupy a significant share (from 11 to 32%) of the energy source structure. However, TES cannot be considered separately from the associated socioeconomic system. The interaction between them determines the overall transition results both in each state and in the EECCA region as a whole. Regardless of the specific path chosen by decision makers, the socioeconomic trace of the general transition provides adequate means to measure its efficiency. Different regional socioeconomic traces as a result of energy development in EECCA countries under different energy transition scenarios may lead to asymmetry in the share of energy sources with renewable energy leaders and outsiders, as well as to increased inequality, which may eventually develop into transition barriers. The ability of EECCA countries to take advantage of the long-term indirect and induced benefits of the transition period depends on the extent to which their domestic supply chains facilitate the deployment of energy transformation and induced economic activity. Maximal application of the social and economic benefits of energy transformation requires increasing the transition ambition, internalizing climate externalities (carbon taxes, phasing out fossil fuel subsidies), and stimulating diversification and strengthening of deep domestic supply chains.
The growing share of RES affects the energy security of EECCA countries in both scenarios (PES and TES), indicating a decreasing trend in energy dependence in all three scenarios. This increases energy security, but the level of this impact is very low. Therefore, the EECCA countries should now not only increase the share of RES, but also attach strategic importance to the structural maintenance of their energy complex.
The main limitation of this study is the focus on energy security in the context of the diversification of energy resources of the studied countries. However, the level of energy security in a broad sense can be influenced by many other factors and risks. Therefore, the results of this study can be useful in the formation of a policy for the development of renewable energy sources, as a part of the energy security of countries and regions. This study is limited through the formation of scenarios based on a proportional increase in the share of renewable resources, which narrows the level of variability of the conducted research but has no significant impact on the final result. In the future, this research can be expanded to studying the components of the energy security index, the formation of its variations, the combinatorial increase of the share of different renewable sources to different degrees, as well as supplemented by examining the presented problems in different regions of the world. It is also possible to deepen research in the direction of determining the relationship between the development of renewable energy technologies, energy storage, and the level of energy security of countries and regions.
The methodological approach proposed in the study can be tested in other countries. At the same time, it is possible to compare the final indicators of the efficiency of increasing the share of renewable sources and diversifying energy resources of different countries and regions to formulate a policy and strategy for the development of their energy complex.


