Article

Breaking-Down and Parameterising Wave Energy Converter Costs Using the CapEx and Similitude Methods

by
Ophelie Choupin
1,*,
Michael Henriksen
2,
Amir Etemad-Shahidi
1,3 and
Rodger Tomlinson
1
1
School of Engineering and Built Environment, and Griffith Centre for Coastal Management, Griffith University, Gold Coast, QLD 4222, Australia
2
Wavepiston, Helsingør, 3000 Hovedstaden, Denmark
3
School of Engineering, Edith Cowan University, Joondalup, WA 6027, Australia
*
Author to whom correspondence should be addressed.
Energies 2021, 14(4), 902; https://doi.org/10.3390/en14040902
Submission received: 6 January 2021 / Revised: 29 January 2021 / Accepted: 2 February 2021 / Published: 9 February 2021
(This article belongs to the Section C: Energy Economics and Policy)

Abstract

:
Wave energy converters (WECs) can play a significant role in the transition towards a more renewable-based energy mix as stable and unlimited energy resources. Financial analysis of these projects requires WECs cost and WEC capital expenditure (CapEx) information. However, (i) cost information is often limited due to confidentiality and (ii) the wave energy field lacks flexible methods for cost breakdown and parameterisation, whereas they are needed for rapid and optimised WEC configuration and worldwide site pairing. This study takes advantage of the information provided by Wavepiston to compare different costing methods. The work assesses the Froude-Law-similarities-based “Similitude method” for cost-scaling and introduces the more flexible and generic “CapEx method” divided into three steps: (1) distinguishing WEC’s elements from the wave energy farm (WEF)’s; (2) defining the parameters characterising the WECs, WEFs, and site locations; and (3) estimating elements that affect WEC and WEF elements’ cost and translate them into factors using the parameters defined in step (2). After validation from Wavepiston manual estimations, the CapEx method showed that the factors could represent up to 30% of the cost. The Similitude method provided slight cost-overestimations compared to the CapEx method for low WEC up-scaling, increasing exponentially with the scaling.

1. Introduction

The Paris Agreement was adopted by 196 parties at COP 21 on 12 December 2015. The legally binding treaty sets a goal to limit global warming to 1.5 °C compared to pre-industrial levels. This target requires most countries to transition to a more renewable energy mix. Electrification of the transport sector including cars [1,2] and aviation [3,4] will heavily increase the need for sustainable energy [5] achievable through multi-renewable-energy systems. Renewable energies are increasingly employed in the challenge against climate change [6,7]. However, the energy transition process is complex, especially due to the variety of actors, the diversity of supports it can receive (from crowdfunding to grants and landing, through infrastructure or production incentive and awareness) [8], and side effects it can create [9,10]. A just transition would involve social (and cultural), policy and civil changes towards a more democratised society at both centralised and decentralised levels [11]. Indeed, this transition is achievable if it involves all actors of the public (from macro—governments—to micro scale–municipalities) and private sectors, including housing, producers, distributors, providers and stakeholders (e.g., universities, research centers, trade associations, and environmental organisation to name a few) [11,12]. Policy has a major role to help this transition and Falcone et al. [12] estimated that policy procurement, taxes on traditional fuels and cooperation are the key elements to empower the niche mechanisms and especially the expectations. In this context, the exploitation of marine renewable energies (such as tides, waves, and offshore wind) provides an interesting potential, and yet wave energy is rarely considered [13] and often neglected [10,11,14]. Wave energy has a significant potential worldwide [15] for both decentralised [16] and centralised [17] approaches [18]. Although, wave renewables receive the abovementioned supports, including international collaborations and enhancing events such as the Wave Energy Prize [19] and the MARINET programs [20], this field is still at an early stage of development in comparison to other renewables such as the offshore wind. Therefore, methods must be elaborated to enable faster and more reliable calculations of the major economic indexes used to compare renewables [21,22], and thereby to foster the communication of wave renewables in order to increase the expectations. The levelised cost of energy (LCoE) is one of the most important metrics used to compare renewables [18]. The LCoE of a wave energy farm (WEF) is defined as the division of the levelised cost of the WEF over its entire lifecycle by the levelised energy produced for the same time period [23]. LCoE estimation is challenging for WEFs [24], and when estimated, it results in higher values compared to those of other renewables [25].
The device harvesting the ocean wave energy is the wave energy converter (WEC) [26]. WECs have very different designs [19], which is the main reason behind its lag in use compared to other renewables. This is due particularly to the complex resource wave climate system [27,28,29]. Therefore, pairing WEC and wave climate based on proper cost estimation and power production is an everyday challenge, and so is attracting investment in wave renewable energy. Pairing WEC and installation location requires selecting the WEC configuration (specific size and dimensions) [30]. Consequently, the WEC and location pairing also involves calculating the energy production component (or annual energy production, AEP) and cost over the different WEC configurations. A large part of the research in wave renewables is dedicated to AEP [28,31,32] and its calculation [25]. Therefore, AEP is probably the most reliable metric of LCoE [33,34] to date, whereas the cost remains a source of uncertainty. The cost is composed of the operation and maintenance costs (or operational expenditure, OpEx) and the capital expenditure (CapEx) that gathers all the other costs of LCoE [35]. Due to a lack of experience in WEF trials and despite the broad literature, the estimations of the OpEx are hardly trustworthy [36,37,38]. In contrast, wave energy companies know precisely most of the costs related to the CapEx, and OpEx has occasionally been estimated as a percentage of the CapEx [31,39,40,41,42]. Consequently, the assessment of the cost part of LCoE can be reduced to the CapEx.
This research aims to provide a systematic and comprehensive method for cost calculation adaptable to all WECs. The developed method enables automatic WEF cost, and thereby CapEx estimations for large datasets of WEC-configuration and site characteristics. This work investigates the integration of WEC, WEF, and site characteristics directly in the cost calculations. This calculation method could eventually improve WEC configuration-location pairing and selection. This pairing is often reduced to either an energy-based approach or to a small number of locations and WEC/WEF designs as:
(a)
The manual cost estimation of large WEC configuration-location databases is time-demanding.
(b)
CapEx is often defined for a fixed design of WEC and WEF by first distinguishing the CapEx from the WEF costs, and second by providing a breakdown of CapEx into its main components [31,43]. LaBonte et al. [44] also provided a clear decomposition of the CapEx. Their method is implemented within the National Renewable Energy Laboratory (NREL) System Advisor Model (SAM) tool [45] strongly linked to the study of Neary et al. [46] on the Reference Model Projects (RMP). Similarly, Chozas et al. [41] developed a cost of energy (COE) calculation tool. However, in these cases, no process is developed to calculate the costs for large datasets of WEC configurations. Besides, site, WEF, or WEC characteristic parameters can only be changed one at a time; these methods and programs cannot be used to compare the costs for large databases.
(c)
Chang et al. [24] amongst others [35,47,48], have estimated the cost for most of the devices investigated by Barbarit et al. [49]. Furthermore, specific costs have also been provided for CorPower Ocean [50,51], Pelamis and Wavestar [52], Wave Dragon [53], Floating Power Plant A/S [54], M4 [55], and Seabased Industry AB [56], to name a few. These studies mainly used selected economic indicator-based equations such as the LCoE. Despite providing detailed costs, they did not offer clear methodologies to calculate these expenses to adapt to other machines or if present, the parameterisation of the costs, at least regarding WEC configuration scaling, remains limited.
(d)
Since the number of governing parameters affecting the costs is large [43,48], studies often focus on a particular aspect of CapEx such as the mooring costs [57], or cable expenses to link the WEF to the grid [25,43,58,59,60]. These studies sometimes highlight the impact of parameters including site characteristics, or wave and weather conditions on the diverse component and their costs. Yet, they do not provide calculation methods, and a single and synthetic methodology is not available.
(e)
CapEx is sometimes provided as a single number depending on the power production capacity of the WEF [61,62,63]. This number multiplied by the WEF rated power provides the CapEx in euros. However, this global approach provides a rough average of the final CapEx and lacks understanding and control on the calculation of the costs within CapEx.
(f)
WEF element costs such as the WEC and moorings have also been parameterised using a single number depending on the WEC, or the WEC element, weight or characteristic mass [24,41]. For example, de Andres et al. [31] used the cost of steel from Myhr et al. [64], and they multiplied it by the WEC weight to estimate the WEC cost. However, steel prices are quite variable [64] so the cost estimation based on this approach remains approximate. Moreover, WECs are often composed of many different elements of various materials. Furthermore, WECs’ dimensions are required to obtain the volume and so the mass of steel of the WEC, while they are rarely available. In some cases, the volume may need to be approximated due to complex shapes or multi-component design of the WEC. To sum up, this method can only be applied to a couple of elements from the WEF, enabling only a partial flexibility of the CapEx calculations.
(g)
For a given WEC, de Andres et al. [50] provided a method (also applied by Pascal et al. [30]) scaling the CapEx with references to the Froude law similitude [65] used initially to scale marine structures in different sizes. In their study, de Andres et al. [50] adapted the Froude law for its application to CapEx. Yet, this approach remains global and lacks specific control in the calculation of the cost composing CapEx.
This work provides a comprehensive but concise synthesis of WEC and WEF cost breakdown and estimation guidelines. Moreover, these calculation methods lack the flexibility to integrate the many characteristics of WEC and site, in the cost calculation. Subsequently, this study introduces the new generic “CapEx method” for WECs, which is based on the synthesis of previous guidelines and methods. The aim is to develop a systematic techno-economic approach for CapEx and more importantly, the CapEx sub-cost calculations for large databases of WEF/WEC-configuration and site characteristics. The calculation aspect of this method could be implemented in the CapEx-calculation aspect of the software developed, for instance, by Castro-Santos and Filgueira-Vizoso [66] in the NREL-SAM-RMP and perhaps also enhance the COE tool. This calculation method is assessed alongside that of de Andres et al. [50] referred to as the “Similitude method” in the rest of the study.
The absence of information to obtain CapEx is partially driven by confidentiality matters relating to most companies. This study investigates Wavepiston [67] firstly because the company provided access to its WEC structural and economic details. Secondly, its 1:2 scale prototype has been tested in Denmark at Hanstholm test site [68], and it is planned to carry out full-scale testing at PLOCAN (Canary Islands—Spain) by the end of 2022 for possible farm installation to supply a desalinisation plant in the North of Gran Canaria [69].
In Section 2, the CapEx and Similitude methods are fully described. Section 3 shows the application of the two methods to the complex database of Wavepiston WEC configurations. Section 4 conducts the comparison and discussion between the CapEx and Similitude method for Wavepiston, including examining the effect of the different WEC-configuration and site-characteristic parameters before concluding in Section 5.

2. Methods

Figure 1 shows the main steps of the CapEx (left) and Similitude (right) methods that are presented in this section. In both approaches, the CapEx consists of overnight costs. Interest is therefore not considered in both methods’ cost-calculations and is scarcely discussed in Section 2.1.1.

2.1. CapEx Method

This section describes the CapEx method, which is organised into three steps (Figure 1, left-hand-side). It is worth noting that since this research is dedicated to wave renewables, the description of the method is associated with WEC and WEF examples, yet, the CapEx method can also be applied to other renewables.

2.1.1. Step 1: Elements and Costs Breakdown

To be able to distinguish the costs of CapEx and especially those of the WEC, it is essential to understand first the overall costs of a WEF project. These can be split into three parts:
(a)
Development cost gathers all expenses from the WEC concept to WEF final design for a particular location. It includes the costs for the WEC development through all the phases of the WEC lifecycle, as well as the pre-installation costs from Clark et al. [43] including investments [31,58]. The expenses for location assessment, such as (i) bathymetry and seabed conditions, (ii) wave and weather climate, and (iii) energy demand infrastructures are also added. These three aspects will then help to select the most appropriate WEF design for the location of interest, which includes decisions on the number of WECs and the WEC configuration [35,48,51,53,54,70]; the installation location [61,71,72,73], the WEF arrangement, particularly regarding park effects and wave direction impact [72]; and the selection of cables, moorings, and anchors [25,57,60,74].
(b)
Construction and installation costs of the WEF for each location. It accounts for the price to purchase and/or manufacture the WEF elements, deploy, install, and connect the WEF to the grid [58,75] following the WEF design decisions mentioned in part 1.
(c)
Decommissioning costs is the budget allocated to WEF disconnection, uninstalling, and decommissioning. Often the disconnection and uninstall are included in the decommissioning. Clark et al. [43] broke down the decommissioning cost.
Additional WEF project costs also occur during its lifetime such as insurances, taxes, rent of the location, amongst others [56,76], but these are less substantial. CapEx can be seen as the estimation of the costs of the beginning and the end of the WEF lifetime, while the operations and maintenance costs are spent during the WEF lifetime until the moment it is decommissioned [77]. CapEx usually gathers points b. and c., and occasionally the aforementioned additional costs, whereas the operation and maintenance cost often includes location rent and associated insurances [38]. It is worth noting that the LCoE calculation is linked to a specific farm project, and the cost of development might be spread over many projects, explaining the possible disregard of point a. within CapEx. This is also the reason why the interest is commonly excluded from the CapEx calculations, although LaBonte et al. [44] provided a “fixed charge rate” factor that accounts for the interest and multiplies the overnight CapEx. Overall, financial supports for wave renewables are diverse (see Section 1) in origin (e.g., from international to local), type, and length [8,78]. They may address the WEF project either in whole or on specific and more focused aspects. The interest is challenging to estimate also considering that such a niche requires a smoother transition and inclusion of the diverse supports [8]. Furthermore, WEF construction and installation (and decommission) durations and associated interests may often be difficult to estimate due to lack of experience, and they may vary from one WEC to another [53,69,79]. In general, interest is considered in the net-present value (NPV) calculation, as a way to discount the future cash flow, but the period used for this calculation is the entire WEF lifetime and CapEx (as overnight costs) is assumed to be paid at year zero [40].
Once CapEx costs are distinguished and the clear definition of which cost is considered in the study, the complex WEF system must be transformed into simple elements that are easier to assess economically. This task also involves the WEC design breakdown [80]. This transformation consists of: (i) clearly defining the above different costs that will be considered in the CapEx; and (ii) determining which components belong to the WEC and which to the WEF. Then each major element of the WEC and WEF can be divided into sub-elements.
Moreover, similar to the tidal farms [75], each component and sub-component may be associated with the following tasks: costs of manufacturing, assembly (onshore or offshore), deployment, installation, connection, and decommission that includes the disconnection and uninstallation. The first four tasks happen at the beginning of the WEF lifetime, and the last one at the end. Additionally, tasks may be associated with sub-tasks, and so in the following, both components and tasks are called elements and sub-components and sub-tasks sub-elements.
The level of detail of element and sub-element analysis is in line with the user knowledge accumulated about WEC and WEF design. This level of experience and knowledge can be measured using the technology readiness levels (TRL) [81,82] or the WEC company phase [83].

2.1.2. Step 2: Parameter Selection

The second step of the CapEx method is the selection of the parameters for the cost parameterisation. Each WEC is characterised by significant dimensions (e.g., WEC width and length, and number of energy-collectors if more than one) that are part of parameters. The sites’ wave climates and particular characteristics, as well as additional features from the WEC, should be translated into parameters that may be required for the parameterisation.

2.1.3. Step 3: Cost Estimation and Parameterisation

The last step of the CapEx method is the cost parameterisation. Once elements and tasks are sorted between the WEC and WEF, their base or default cost can be estimated. This base cost is obtained for WEC-WEF simplest and smallest conceivable design for commercialisation.
The total cost of an element is composed of a base cost, and the margin the WEC company expects to profit from selling this piece. Hence, each WEF and WEC element total cost is as follows:
Element Total Cost = Element Base Cost (1 + Element Margin)
where the margin is in percentage (e.g., for a margin of 5% the element margin equals 0.05), and the base and total costs in €. For WEF projects under TRL5, companies may not consider the margin since it requires a certain experience to be estimated. If the margins were neglected, then, total cost would equal base cost. It is worth noting that the base cost may fundamentally be dependent on a specific variable; for example, the cost of underwater cables is often provided in €/m [25,32]. In such a case, the base cost may be divided into two components with a fixed part and a part multiplied by the considered variable value, in this example, the distance to shore [77].
In the CapEx method, at the level of the CapEx or WEC/WEF main elements, the base costs are large sums of the total costs of the sub-elements, similar to the cost calculation shown by Clark et al. [43] and Castro-Santos et al. [77]. In contrast, at the level of sub-element total cost, the base cost, in this method, is the cost estimated for the smallest conceivable; but for marketable, size of the device. The value of the sub-element base costs can often be determined from subcontractors’ catalogues and quotes.
A new cost in each element total cost function called factors can be introduced as:
Element Total Cost = (Element Base Cost + Element Total Factor) (1 + Element Margin)
These factors try to capture future WEF local environmental, legislative, and economic phenomena. Depending on the reasoning of the company, the factors may be assessed in different ways. The objective is to provide the initial description of how to obtain the final estimation of each element for the considered parameterised WEF/WEC problem. The factors can be used in five different ways, from the simplest (first parameterisation of the costs), to the expert approaches through the intermediary and advanced levels with increasing flexibility and thereby complexity.

2.1.3.1. Simplest Approach for the Factors and First Parameterisation

The simplest approach of the factors is dedicated to companies with a small TRL. In the simplest approach, each element’s total factor would be a single number estimated from the user’s experience according to the element configuration or size and the site’s characteristics. For instance, sites with challenging weather and high wave conditions require costlier factors than for calmer sites. However, this approach is strictly based on the developers’ experience saying in a location the conceivable farm would cost this much and at the other location the cost was increased by a certain percentage due, for instance, to a rougher weather and wave climate.
The first parameterisation method consists of a single factor that is the total factor. The factor is the multiplication of a parameter, amongst those selected in step 2, by a weight that illustrates the impact of this parameter on the cost. The weight may be in the order of the base cost so that the associated factor (multiplication of the weight and parameter) could be translated as a percentage of the base cost. Examples of such factors could be based on the mass-method (item f) in Section 1) such that the parameter would be the mass, and the weight the cost of mass.

2.1.3.2. Intermediary and Advanced Parameterisation

Assuming that the company is gaining more experience with WEF costs, the total factor may take the form of a sum of nf factors improving the first parameterisation process described in Section 2.1.3.1:
Total   factor = i = 1 n f Factor i =   i = 1 n f Weight i   Parameter i
Each factor is associated with a specific phenomenon impact on the cost such that the factor’s parameter is the direct translation of the phenomenon impact and the weight the strength of this phenomenon. Phenomena can be scaling, site location, alongside weather and wave-climate conditions, amongst others. It is worth mentioning that when examining the phenomenon affecting each WEC and WEF element and sub-element costs, the list of parameters determined in step 2 might be extended when there is no parameter representative enough of the phenomena.
Following Clark et al. [43] and Castro-Santos et al. [77] who decomposed the costs of a fixed hybrid offshore wind-wave farm (or from Segura et al. [75] for tidal farms), the CapEx calculation can be parameterised by:
(a)
Determining all the phenomena affecting each cost,
(b)
Translating these phenomena into factors, and
(c)
Adding the sum of the resulting factors to each cost.
The intermediary approach of the factors is the implementation of more physical and concrete phenomena including scaling based on the WEC and WEF sizes, site characteristics as the distance to shore amongst others [25], and local or regional (example of the labour price) impacts on the costs [58].
In the advanced approach, more abstract phenomena could be considered, such as economies of scale, power absorption, and weather and wave climate effect on the costs. For instance, a factor could be based on the power-method (item e) in Section 1) such that the parameter would be the WEC rated power and the weight cost per kilowatt. Furthermore, using the example of the weather and wave conditions, a factor could be the multiplication of the average wind speed, U10 (m/s), or significant wave height, Hs (m), respectively. Then, tests could be conducted to estimate failures and need for WEC size change for different U10 and Hs values and thereby changes in the WEC (or the considered element) cost change compared to its smallest marketable design. Often when WEC companies start to investigate the costs for LCoE estimations, they have already conducted tests from calm waters to real offshore conditions, enabling them to have a great understanding on how such parameters affected the need of WEC sizing involving cost change.

2.1.3.3. Expert Approach of the Factors

A more experienced company could consider more complex weight factors as functions of other parameters by using learning curve effects often encapsulating the economies of scale [40,84,85], amongst others. Such improvement could similarly be made for the weather and wave terms, as well as the other factors in general.

2.2. Similitude Method

The Similitude method from de Andres et al. [50] uses the Froude law similitude principles [65] to scale the CapEx. Using the example of the CapEx calculation from Clark et al. [43], Castro-Santos et al. [77], and Segura et al. [75], or any other cost calculation, the Similitude method similar to the CapEx method consists of three steps (Figure 1, right-hand-side):
(1)
Conduct the element distinction similar to (Step 1 of the CapEx method) as carried out in these studies,
(2)
Prepare the data for calculation:
(a)
Determine the source-dependency of the functionality of the modules associated with the costs. Table 1 provides a list of different dimensions (also referred to as quantities or sources), and their scaling parameter from the Froude law similitude (Sheng et al. [65] and Hughes [86] provided additional sources).
(b)
Average all the scaling parameters to obtain the “weighted scale coefficient” shown in Equation (4), and
(3)
Conduct the cost-calculation using the final CapEx estimation from these studies which would be interpreted as the CapExBase cost in Equation (4) and be multiplied by the new scale of the farm power the weighted scale coefficient following Equation (4):
CapExTotal cost = CapExBase cost ScaleWeighted scale coefficient.
Yet, the wave- and wind-related elements and related CapEx might need to be separated for the wave and offshore-wind different representative dimensions (such as the WEC length and the windmill circumference, respectively) and thereby scaling factor.
It is worth noting that in the study of de Andres et al. [50] CapExBase cost was obtained for a WEC with a rated power of 25 kW. It is recommended to use the smallest marketable design of the WEF for CapExBase cost so that the scaling would only apply for larger WEF designs. The Similitude method could be compared to the CapEx first parameterisation one; the CapEx method parameters would be the scaling factors between the referenced and scaled design of the same WEC [80], and the scale parameters the weights.

3. Materials and Application of the Methods to Wavepiston Wave Energy Converter

Since one of the objectives of this work is to illustrate an example of how to handle complex and limited databases of WEC-configuration and site characteristics, this study’s factorisation level is intermediate to emphasise the description of the dataset. The CapEx method and then the Similitude method are applied to Wavepiston.

3.1. CapEx Method Applied Wavepiston WEC

3.1.1. Step 1: Wavepiston WEC Breakdown into Elements

Figure 2 (Wavepiston is currently developing a new version of their WEC without the string, but this version has not been computed yet. However, this should have little effects on costs and theoretical energy production.) shows the Wavepiston WEC, often simply called Wavepiston, and its sub-elements.
The WEC is a string of hinged energy collectors with the ability to move back and forth in a limited space along the string [87]. The string is attached to two buoys that are anchored to the seabed (Figure 2).

Collector

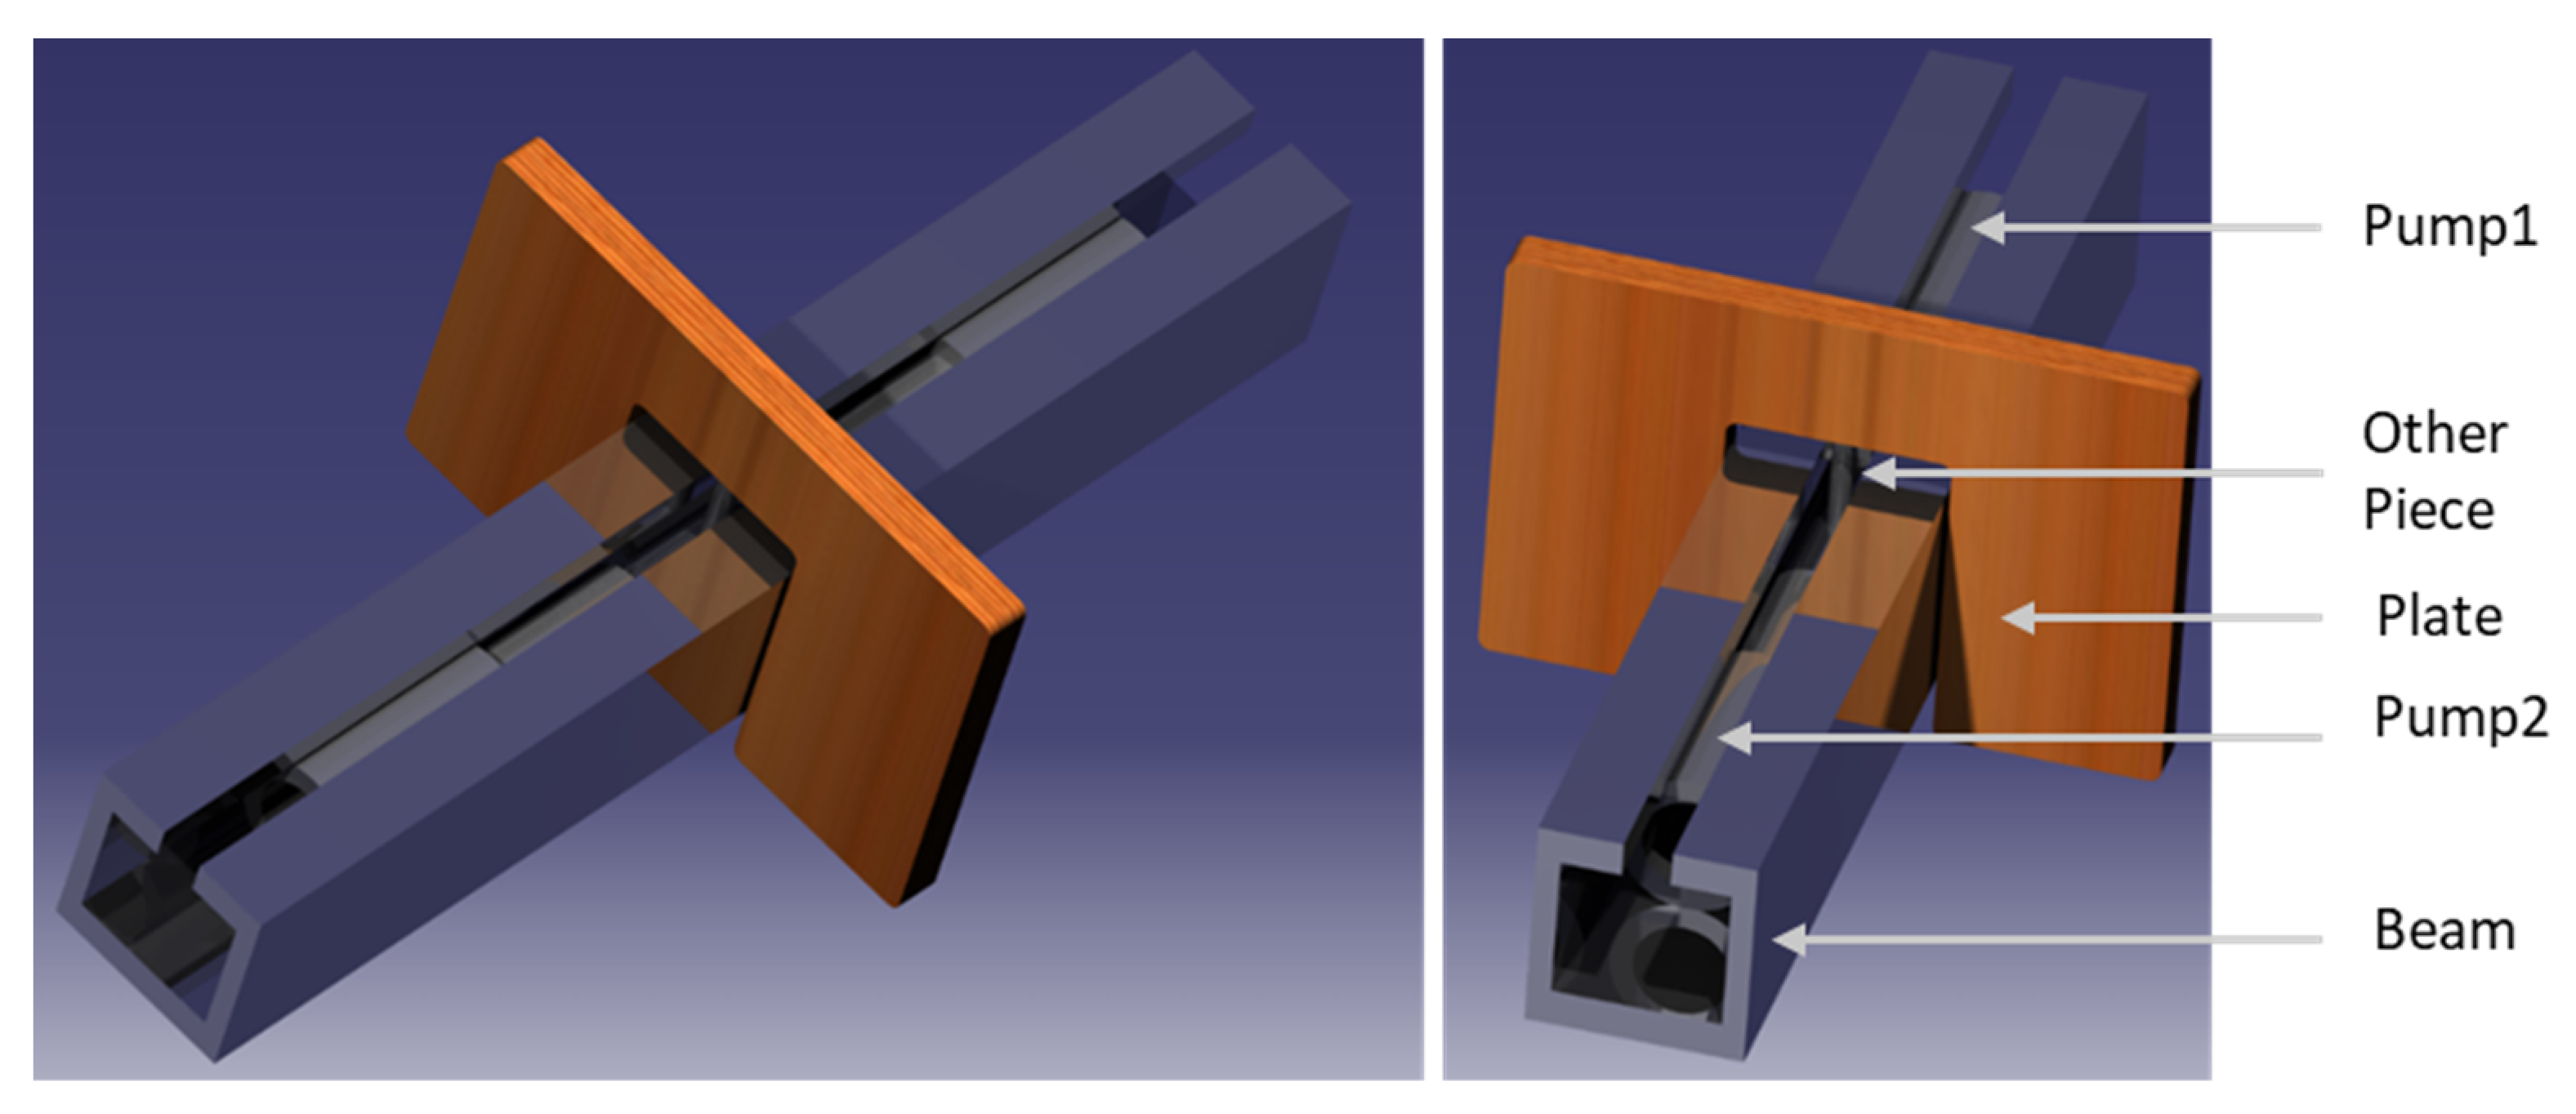
The collectors are Wavepiston’s Power Take-Off systems (PTOs) illustrated in Figure 3. They are made of a plate that moves using a wagon (not shown in Figure 3) along a beam. This movement actions two pumps connected to each side of the plate, so that they pump the water that is transferred to the string through the valves and the pipe [87].
The pipes and valves are part of the “other pieces” in Figure 3, which also include bolts, joints, to name a few. Additional manufacturing is considered for the assembly of the collector.

String and Moorings

The string accounts for the two buoys and attached moorings including the anchors. The string is made of wire and rope alongside a pipe joined to the collectors using connectors, and valves. The pipe transmits the flux of water that will be used eventually to spin the turbine of the generator. Additionally, the string needs shackles and connectors to attach the collectors, buoys, and moorings. Furthermore, the string’s elements gather the monitoring and control systems.
The moorings were distinguished as a sub-element of the string since filling a very particular purpose of holding the string. They are made of rope, chain, and wire [74] alongside the use of shackles. As well as for the collector, additional pieces (risers, fasteners, amongst others) are included in the string’s elements that encapsulate both the additional pieces of the moorings and the string.

Summary and Tasks

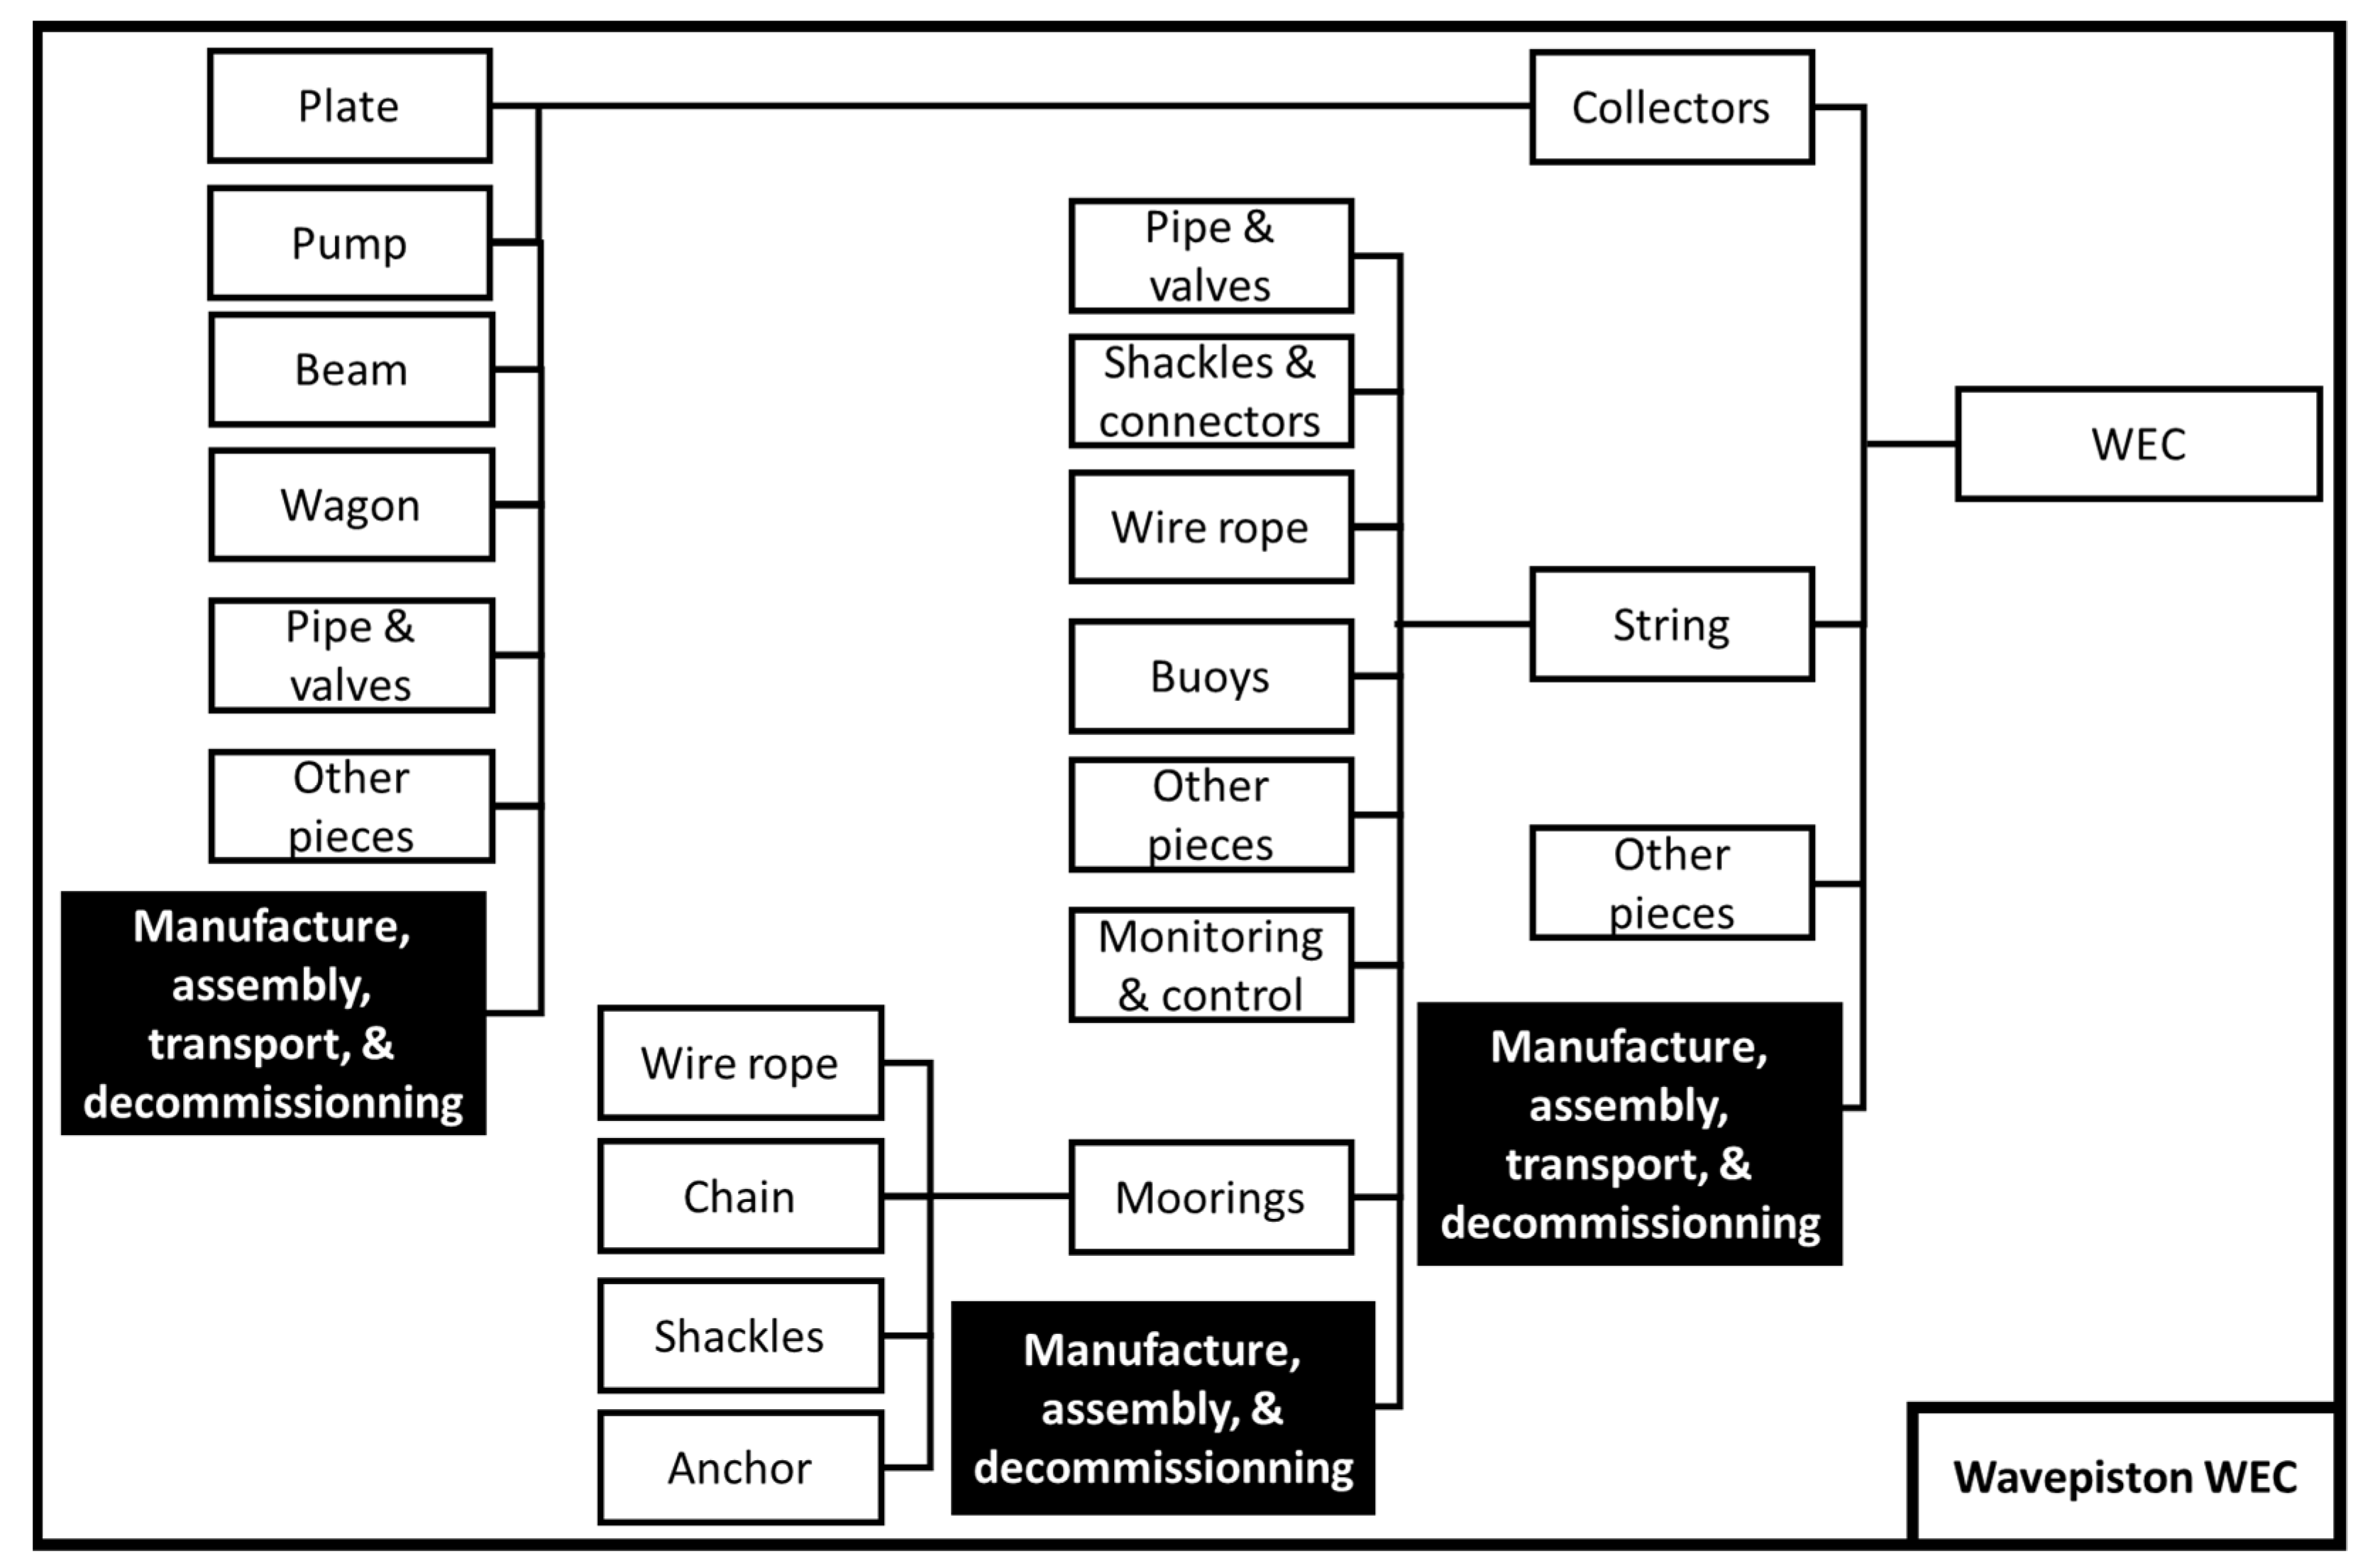
Figure 4 illustrates the division of a Wavepiston WEC into elements and tasks such that all pieces combined are sub-elements or tasks of the right column element to which they are linked.
Wavepiston manufacturing (Figure 4) cost is estimated as the sum of the Np collectors, including their attachment to the string. The transport task implies boats’ use to bring to shore either a Wavepiston or just a collector from it. Hence, the transport does not appear in the task box of the string sub-elements. Furthermore, the mooring elements possess no tasks because string elements integrate moorings, thence the actions apply the entire moorings and not its pieces individually. Tasks including deployment connection and disconnection alongside elements such as connecting cables to onshore power stations, as well as turbines and generators belong to the WEF hence are not considered here.

3.1.2. Step 2: Wavepiston WEC and Site Parameters

The parameters that determine a Wavepiston WEC configuration are: the plate shape, ps (--), and its dimensions: plate area, pa (m2), plate width, pw (m), and depth, pd (m); as well as the number of plates (and thereby collectors) per string, Np (--), and the distance between the plates called plate-location configuration, plc (m) [87]. This study also includes the water depth at site, s, the wamit water depth, h, which is a parameter of the WEC configuration (for the numerical simulations [87]), and the site water depth, d, which is the expected water depth where the farm is installed, and the distance to the coastline, q (m).
The parameters used for the WEC model are Np, plc, ps, pw, pd, and h. They are mentioned in the following as the Wavepiston WEC configuration parameters and are the only “internal” parameters defining each WEC configuration. Table 2 display their values and combinations.
Table 2 also shows that there are 184 combinations of the Np, plc, ps, pw, pd, and h parameters, for 53 configurations excluding h. The elliptical plates contain only diameters of pw = pd = 3 m and pw = pd = 6.7 m, which makes them in fact circular. The biggest circular plate is assessed by the four h scenarios, whereas the first is only evaluated for h >> 100 m. The rectangular equivalent exists only for ps = pd = 3 m. Most of the combinations of Np, plc, pw, and pd parameters for rectangular plates are provided for h = 20 m. The smallest plates below 4.5 m2 are only assessed as rectangular plates, for plc = 0, 13.5, 16 m, and for the extreme h >> 100 m or h = 20 m. Finally, most of the plates above 6 m2 are assessed by all the combinations of Np-plc.
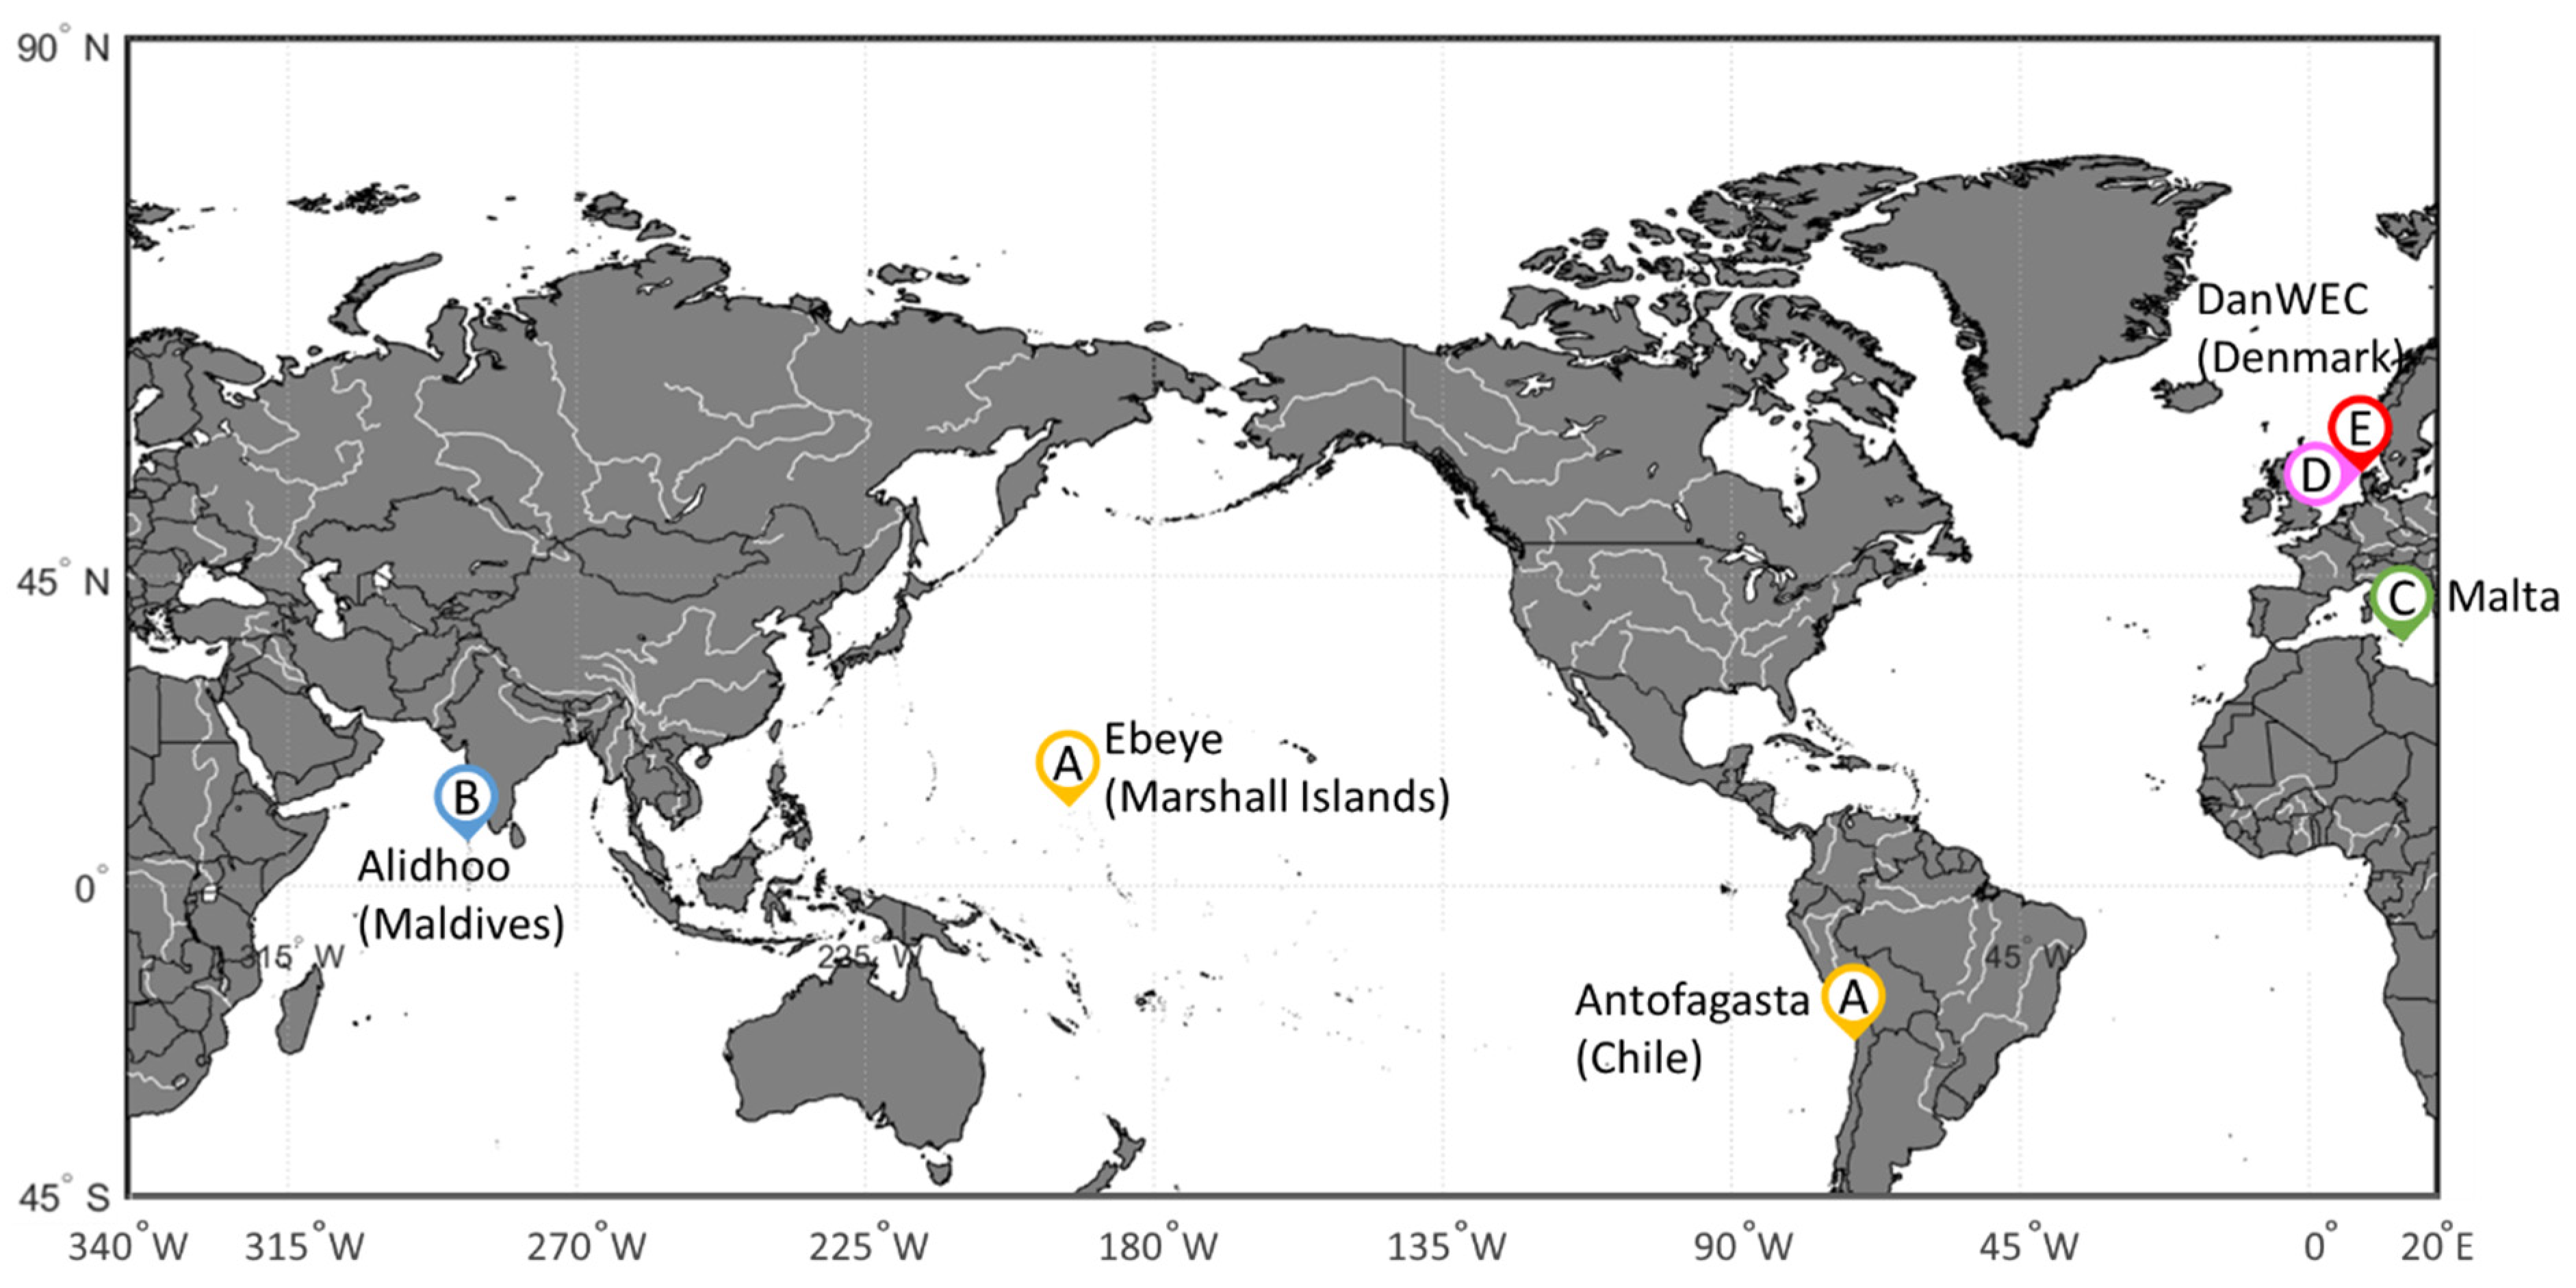
Figure 5 shows the considered sites and the classes they belong to with reference to Table 3’s first column. Table 3 provides a review of combinations of the parameters (d, s, and q) considered in this research.
In Table 3, only d provides a unique value per line. Therefore, d is solely used in the following to display the impact of the site parameters.

3.1.3. Step 3: Wavepiston WEC Cost Parameterisation

The total Wavepiston WEC cost, WECTotal cost, (and its elements and sub-elements) is structured following Figure 4 and calculated as follows:
WECTotal cost = WECBase cost = (Np [CollectorTotal cost + COATotal cost] + StringTotal cost + MooringsTotal cost + WECTotal factor) (1 + WECMargin)
with Np the number of plates, CollectorTotal cost the total cost of a single collector and COATotal cost the cost of onshore assembly. Wavepiston Company estimated that the WEC dimensions and site characteristics would not impact COATotal cost and that no margin could be obtained from such a task, thus, COATotal cost equals its base cost COABase cost. StringTotal cost and MooringsTotal cost are the total costs of the string and mooring, respectively. Additionally, the factors estimated for the WEC sub-elements are representative enough to the several phenomena affecting the costs, and so no factors were added to the overall WEC cost. As Wavepiston estimated the margin over the entire WEF, the value of the margin is not distributed among the WEF and WEC elements or their sub-elements. Thus, WECMargin equals zero and to simplify the equations, the margins factors are not shown in the other equations since they are ineffective.
In the following, the equation for the cost of the three main elements of the WEC, namely, the collector, string, and moorings are investigated. The sub-element costs of the collector, string, and moorings, and the factors’ weights were originally estimated from a detailed analysis of the subcontractor prices for the Wavepiston prototype, including the first 1 m × 1 m plate offshore test at DanWEC and the 8-plate prototype tested at Nissum Bredning [88]. During the testings of Wavepiston at scale 1:4 and 1:2, with different plate shapes at Hanstholm [68] these estimations were adjusted. Finally, these tests also provided the values of all the base costs from the smallest marketable design of Wavepiston consisting of one string with one rectangle plate of size 1 m × 1 m.

Collector

The equation of the total collector cost is:
CollectorTotal cost = CollectorBase cost + CollectorTotal factor,
with:
CollectorBase cost = PlTotal cost + PuTotal cost + BeTotal cost + WaTotal cost + PVTotal cost + COPTotal cost + CAMTotal cost.
Following step 1 of the CapEx method, the total costs of the collector’s sub-elements relate to plate and pump (PlTotal cost and PuTotal cost), beam (BeTotal cost), wagon (WaTotal cost), pipe and valves (PVTotal cost), collector’s other pieces (COPTotal cost), and collector’s assembly and manufacturing (CAMTotal cost). Most of the sub-elements of the collector only consist of their base cost to which is added the total factor composed of a single factor, following Equation (2) with the margins equal to zeros, as mentioned before. These are summarised in Table 4. CAMTotal cost equals zero because the assembly and manufacturing are carried out by Wavepiston. WaTotal cost and PVTotal cost are equal to their base cost. Indeed, they are designed to support any size plate, and so their price is fixed. WaTotal cost costs 550 € and PVTotal cost 800 €. For each sub-element of the collector, the base costs are the costs associated with a string composed of a single rectangular plate of size 1 m × 1 m.
Many of these factors are based on the plate width because as a terminator-type of device, the Wavepiston power absorption most influencing parameter is the length of the device facing the wave crest, which is the plate width. The pipe must be capable of gorging the flow actioned by the plate movement. Hence, the pump factor depends on the plate width.

String

The equation for the string total cost is:
StringTotal cost = StringBase cost + StringTotal factor,
with:
StringBase cost = SWTotal cost + SPTotal cost + SCTotal cost + MCTotal cost + BuTotal cost + SOPTotal cost + SAMTotal cost.
Following step 1 of the CapEx method, the string base cost is the sum of the string’s sub-elements total costs: string’s wire (SWTotal cost), string’s pipe (SPTotal cost), shackles and connectors (SCTotal cost), monitoring and control (MCTotal cost), buoy (BuTotal cost), string’s other pieces (SOPTotal cost), string’s assembly and manufacturing that also account for the moorings’ (SAMTotal cost). SCTotal cost, MCTotal cost, BuTotal cost, and SOPTotal cost, were estimated to remain the same irrespective of the string size or number of plates and so they equal their base cost. The cost of SCTotal cost is 600 €, MCTotal cost 3 K€, and SOPTotal cost 4.5 K€. BuTotal cost is 8 K€, the cost of the two buoys (one at each end of the string):
SWTotal cost = SWBase cost per meter Np plc + SWTotal factor,
where SWBase cost per meter is 12 €/m, the price per meter of string length that is then multiplied by the total length of the string obtained as the product of the number of plates and the distance between them. Similarly, to the string wire, the string pipe base cost depends on the string length and its base cost per meter of string length (SPBase cost per meter) is 9 €/m. The factors of both sub-elements are summarised in Table 5:
SPTotal cost = SPBase cost per meter Np plc + SPBase cost + SPTotal factor.

Moorings

The total moorings cost is:
MooringsTotal cost = MooringsBase cost + MooringsTotal factor,
with:
MooringsBase cost = MWTotal cost + ChTotal cost + ShTotal cost + AnTotal cost.
Following step 1 of the CapEx method, the total costs of the moorings’ sub-elements relate to moorings’ wires (MWTotal cost), chains (ChTotal cost), shackles (ShTotal cost), and anchors (AnTotal cost). The moorings already designed to handle extreme conditions are not associated with additional factors, however, they depend on site characteristics:
MWTotal cost = MWBase cost per meter 4 d+ MWBase cost,
where MWBase cost per meter is 7 €/m and MWBase cost 1.1 K€. Dunnet and Wallace [62] estimated the length of the mooring lines as three times the site water depth. In the case of Wavepiston, this was extended to four so that it becomes three times the site water depth in addition to the original site water depth. It assumed that 40 m of chain is required per moorings and therefore ChTotal cost is:
ChTotal cost = 40 ChBase cost per meter,
with ChBase cost per meter equals to 110 €/m. Such as BuTotal cost, the base costs, costs per meter, are for two mooring’s wires for MWTotal cost and two chain for ChTotal cost. Similarly, AnTotal cost is the cost of the two anchors of 40 K€, and ShTotal cost gathers the total cost of the eight shackles (four shackles per moorings) that is of 7.5 K€.

3.2. Similitude Method Applied to Wavepiston WEC

The first step of the Similitude method from de Andres et al. [50] is very similar to the first step of the CapEx method. Therefore, the (sub)element-decomposition used here is the one shown in Figure 4. As for the second step, Table 6 provides the dimension of the source-dependency of each element and sub-element of Wavepiston WEC (summarised in Figure 4) following the example provided by de Andres et al. [50] using CorPower WEC. Despite being similar, some elements from CorPower do not have the same functionality as for Wavepiston. For instance, CorPower WEC’s buoy functionality dimension is the area because it is the contact of the buoy surface area with the waves that enables harvesting the wave power [50], whereas Wavepiston WEC’s buoys (and attached moorings) functionality is to maintain the tension in the string and so the buoy functionality dimension is the force.
Four approaches to calculate the weighted scale coefficient in Equation (4) are investigated here. The first consists of averaging all scale parameters to estimate the weighted scale parameter. In addition, the average is calculated for all elements of Table 6 (index 1 in Table 7), as well as only the sub-elements (index 2). Index 3 averages is the total average of the average of the elements’ average of its sub-element functionality dimensions include the element’s scale parameter. The last approach (index 4) relies on the Wavepiston WEC’s elements designed scale parameters.
Finally, for this study two parameters are selected to be the “Scale” from Equation (4), to apply the Similitude method to Wavepiston, following Froude law similitude representative dimension: Wavepiston plate width and total length.

4. Results and Discussion

This section is divided into two. The first sub-section first presents and discusses the sub-element cost and factor values obtained for Wavepiston dataset, and then Wavepiston WEC cost using the CapEx method is investigated. The second sub-section presents Wavepiston WEC cost obtained using the Similitude method and the discussion aims to discuss these results in relation to the Froude law similitude, as well as comparing them with the results from the CapEx method.

4.1. Wavepiston WEC Cost and Sub-Costs Using the CapEx Method

The effect of the factors on the sub-element costs are first investigated in this section. Then, the costs of Wavepiston WEC for the whole database are provided.

4.1.1. Wavepiston WEC Elements’ Costs

To summarise Section 3.1.3., the collector’s factors mostly depend on the plate size (its area and width), the string’s on the number of plates and distance between the plates, and the moorings’ on the distance to shore. Table 8 provides the total collector cost in function of the parameters above, Table 9 for the string, and Table 10 for the moorings. To help with the reading of the following tables, a heat map was added with red representing the highest costs and blue the lowest, which applies separately for each column of Table 8 and Table 9, and over all the columns of Table 10.
Table 8 shows that Wavepiston PTO, which is its collector, is below the 6 K€ estimated by Clark et al. [43]. The Wavepiston PTO cost is very close to the oscillating water column (OWC) and fixed oscillating wave surge converter (OWSC) from de Andres et al. [31] obtained from the reversed LCoE method giving PTO values around 1.1 K€. In contrast, these values are above the PTO of floating OWSC, and for the overtopping and heaving WEC around 5.5 K€ (conversion from British pound sterling, £1 = 1.1005 €) [31].
Most of the factors in Table 8 are consistent with the dependency of the collector cost on the parameters, aside from the rectangle plates from 9 m2 with pw = 4.5 m to 25 m2. All the factors of these lines have colors that no longer match those of the collector cost. Especially, the factors of the pump, beam, and other pieces are reversed for 9 m2 and 16 m2, in the sense that where the collector cost is higher for 16 m2, and lower for 9 m2, these factors have higher value for 9 m2 instead. This is also the case for 15 m2 and 25 m2, and it is due to their dependency on pw. Moreover, the plate total factors are also reversed for the 16 m2 and for 15 m2. Therefore, despite being linear functions, the factors can diverge from each other and result in an even different behaviour of the total cost.
Table 9 shows that generally, the trend of the string total cost can be divided into three categories of costs for each number of plates. Then, as 8-plate and 24-plate categories are characterised by diverse distances between plates, the string total cost is nuanced within these categories, increasing with this distance. Disregarding the margin effect, the sum of the total factors represent approximatively 4% for 1-plate, 21% for 8-plate, and 39% for 24-plate, of the string cost, which is mostly affected by the wire factors (the string pipe contribution increasing linearly by only 0.6% from 0.1% for Np = 1). Consequently, the more plates there are on the string, the more the factors affect the string cost.
Although mooring costs are often provided for the entire WEF [40] or as a function of length [43] or unit of force [76], de Andres et al. [22] estimated a 0.4 M€ for an attenuator-type WEC. However this seems to be slightly high if considering that for a combined wind-wave farm Astariz et al. [89] estimated the mooring-costs from 318–390 K€ that would lead to 11.25–11.47 K€ if they were to be divided by the number of WECs of each farm. The low mooring cost (Table 10) is due to Wavepiston WEC Force-Cancellation characteristic [90] that enables the WEC and especially the moorings to endure more loads for less extra design (and cost) requirement, compared to other WECs [19,91] as mentioned in Section 3.2.
All in all, Table 8, Table 9 and Table 10 confirm the expectations that the element costs increase greatly with the number of plates (thereby collectors), reasonably with the plate size (especially its width), marginally with the distance between plates, and slightly with the water depth. In this situation, it is worth noting that the moorings have the lowest rate of change under the effect of the present parameterisation (Table 10), which is probably due to the absence of factors. Indeed, despite the obvious cost increase with parameter size (since all weights are positives), independently or combined, the factors have various, and possibly strong, impacts on the costs. Therefore, the factorisation should be conducted carefully with consideration of upper and lower effects on the costs for each type of WEC and its elements.

4.1.2. Wavepiston WEC Cost

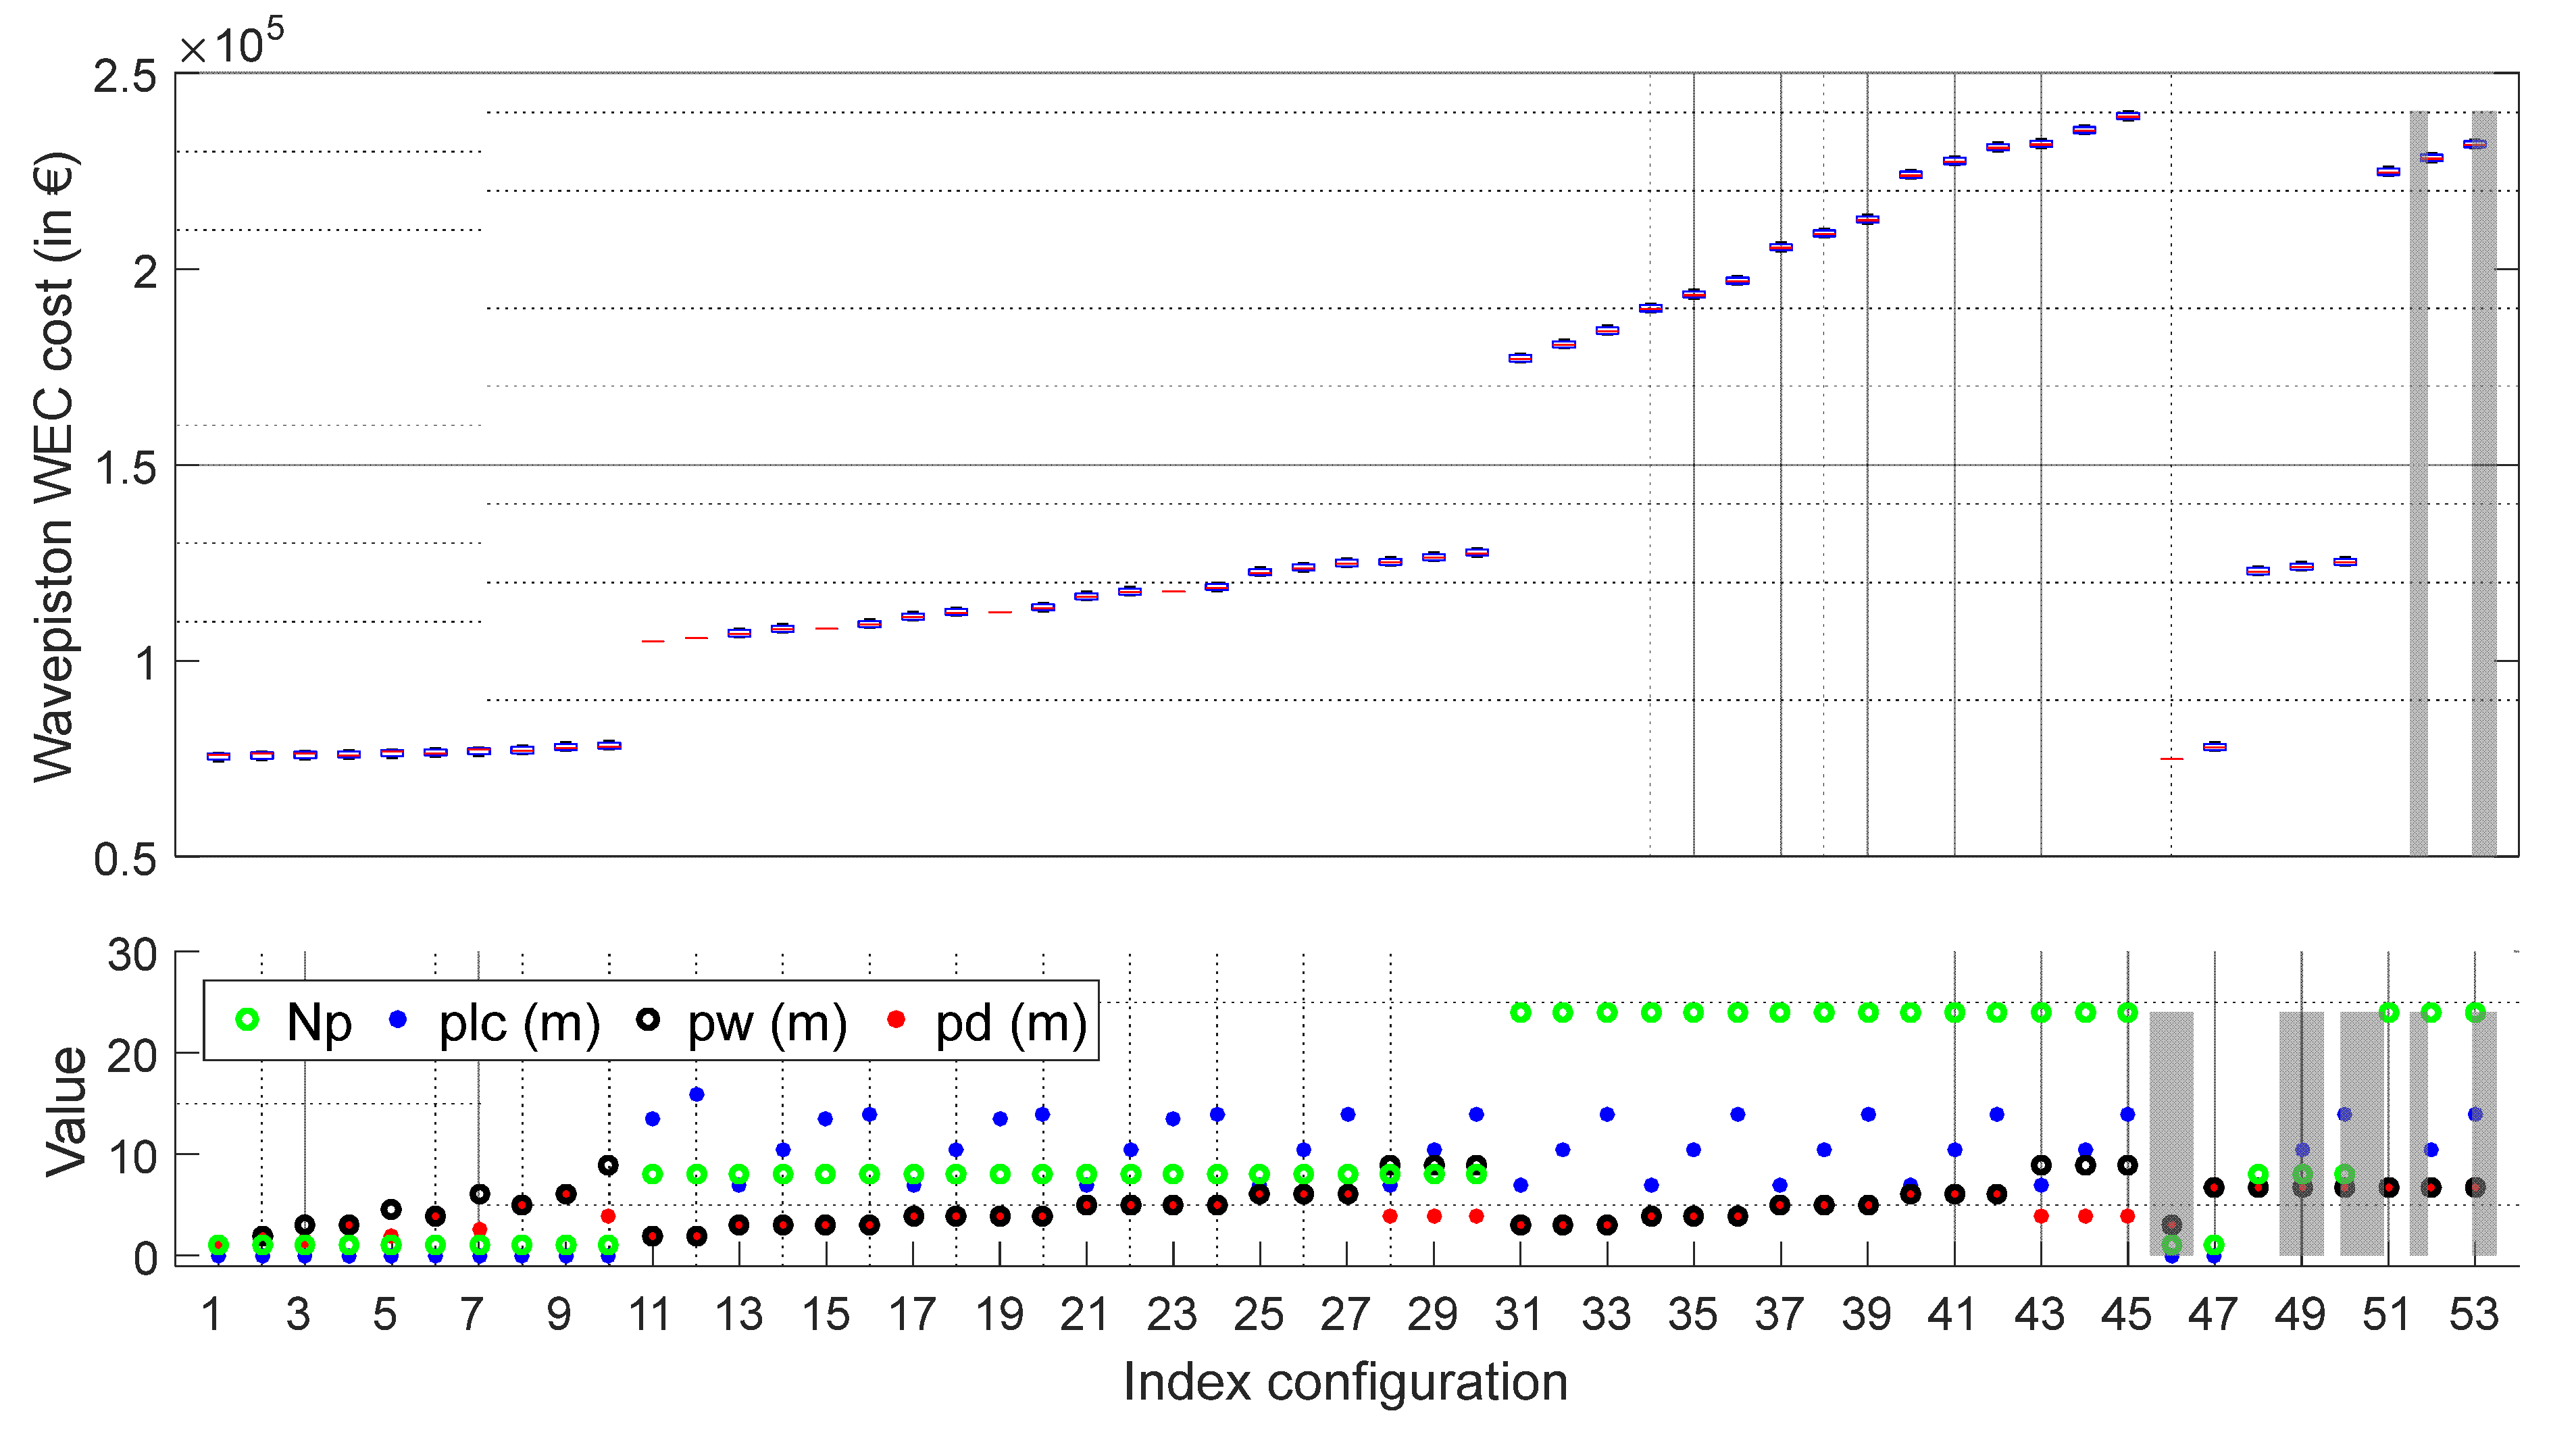
Figure 6 provides the spread of the Wavepiston WEC costs using Equation (5) over the site water depth parameters (top panel) for the different configurations of Wavepiston (Table 2) that are shown in the bottom panel of the figure.
In Figure 6, all configurations are based on the Wavepiston WEC configuration parameters, excluding the wamit water depth (h) such that the spread of the boxplot is only affected by the site parameters and h. This spread is very narrow in comparison to the rate of overall change of the clusters from the effect of the number of plates and plate distance (Np and plc, respectively), and the plate width and depth (pw and pd, respectively). This is mostly due to small mooring costs variations visible in Table 10. Consequently, h and site parameters have little impact on the Wavepiston WEC cost.
Figure 6 shows that Np has the most definite impact on the WEC cost. An increase of Np increases the influence of all other parameters. The second parameter is the plate area and, more specifically, the plate width. For instance, the 9-4 plate is more expensive than the 6-6 and 6.7-6.7 plates. This aligns with the collector cost from Table 8. Additionally, elliptical plates (in fact, circular plates since pw = pd) cost less than the rectangular. This price difference decreases with a decrease in the pw and pd values. The weakest parameters to influence the WEC price are h and d. The fewer collectors there are on the string, the less plc affects the WEC cost, but can eventually make it a weak parameter as well.
Eventually, the Wavepiston WEC cost for the largest device is similar to the estimation calculated manually from Wavepiston. It is worth noting that the company expects to reduce the mooring expenses by half with time and experience. Wavepiston has requested that this estimation remains confidential.
It is worth noting that one of the major contributions of this research is the presentation of the Wavepiston WEC costs and this is because (especially for confidentiality issues) WEC costs are often difficult to grasp from the literature as they are often directly included to the CapEx, are not provided in currency but in another dimension, or are considering more or fewer elements. For instance, Astariz et al. [89] used the 0.44 MW WEC cost of 918 K€ although this is exempt from the PTO and moorings (estimated for combined wind-wave farm) as it is only for the WEC structure. In 2015, Astariz and Iglesias [76] used [92] 16.8 M€ for 7 MW Wave Dragon [93], 25 M€ for 700 kW Pelamis [94], and 200 K€ for 250 kW Aquabuoy [95], but these may be overestimations. Indeed, O’Connor et al. [52] used 1.6 M€ for Pelamis and Wavestar based on 750 kW Pelamis [96], de Andres et al. [22] estimated 11 M€ for a 1 MW multi-point-absorber and 4.2 M€ for a 750 kW attenuator, and Piscopo et al. [32] 25–35 K€ for a 10 kW point-absorber. Therefore, it seems that, although the literature suggests a reduction of WEC cost estimations through time, the largest Wavepiston WEC cost, 240 K€, stands fairly below other renewables. Yet, this is without counting that Wavepiston estimates a marketable system to presumably contain 32 plates instead of the maximum 24-plate (1.17 MW) considered here. This price-difference is mostly explained by Wavepiston low mooring-cost (Table 10) from the WEC Force-Cancellation [90] that generally affects the whole WEC and reduces its overall cost.

4.2. Wavepiston WEC Costs Using the Similitude Method and Comparison with Wavepiston WEC Costs from the CapEx Method

The cost of a rectangular 1 m × 1 m 1-plate Wavepiston WEC is 67,564 €. Table 11 and Table 12 provide Wavepiston WEC cost obtained from the Similitude method using Equation (4) with the “Scale” being the plate width and the string length, respectively as mentioned in Section 3.2, and weighted factors (Table 7). In both tables, a heat map, from red to white to blue, was provided so that the darkest red cell is the highest value of the entire table, and the darkest blue reflects the lowest.
Table 11 provides for each plate width (left column) the results of the Similitude method scaling using the weighted scale coefficients for the four approaches presented in Section 3.2. Table 11 shows that the greater the scaling factor, the higher the difference between the results of larger weighted scale coefficients, which leads to more expensive WECs. The weighted factor providing the closest results to the CapEx method is the first entitled ”Sub-elements only”, which consists of averaging the scale parameters for all sub-elements excluding the element designed function dimension. It seems to be the most consistent application of the Similitude method with the approach of the last column (average over the designed function dimensions only), although the last-column approach provides the highest results. Henceforth, only these two approaches are presented and discussed below.
As the Similitude method scales up the entire system cost, the costs increase exponentially as the parameter increases. In fact, the strict application of the Froude law implies a linear increase of all parameters with the coefficient of increase provided as the scaling factor to a power associated with the dimension of the considered quantity (see Table 1). For instance, for pw = 2 m (scale factor of 2), then pd = 1 × 21 = 2 m and pa = 1 × 22 = 4 m. As such, each line of Table 11 (and Table 12) is associated with a very precise WEC configuration and especially they are associated with the number of plates (Np) equals to 1 since the WEC base cost is for Np = 1; and because Np is dimensionless, it does not scale up as the scale parameter equals zero (Table 1). Therefore, from Table 11, only the costs for pw below 3 m could be approximated to the CapEx method with Np = 1.
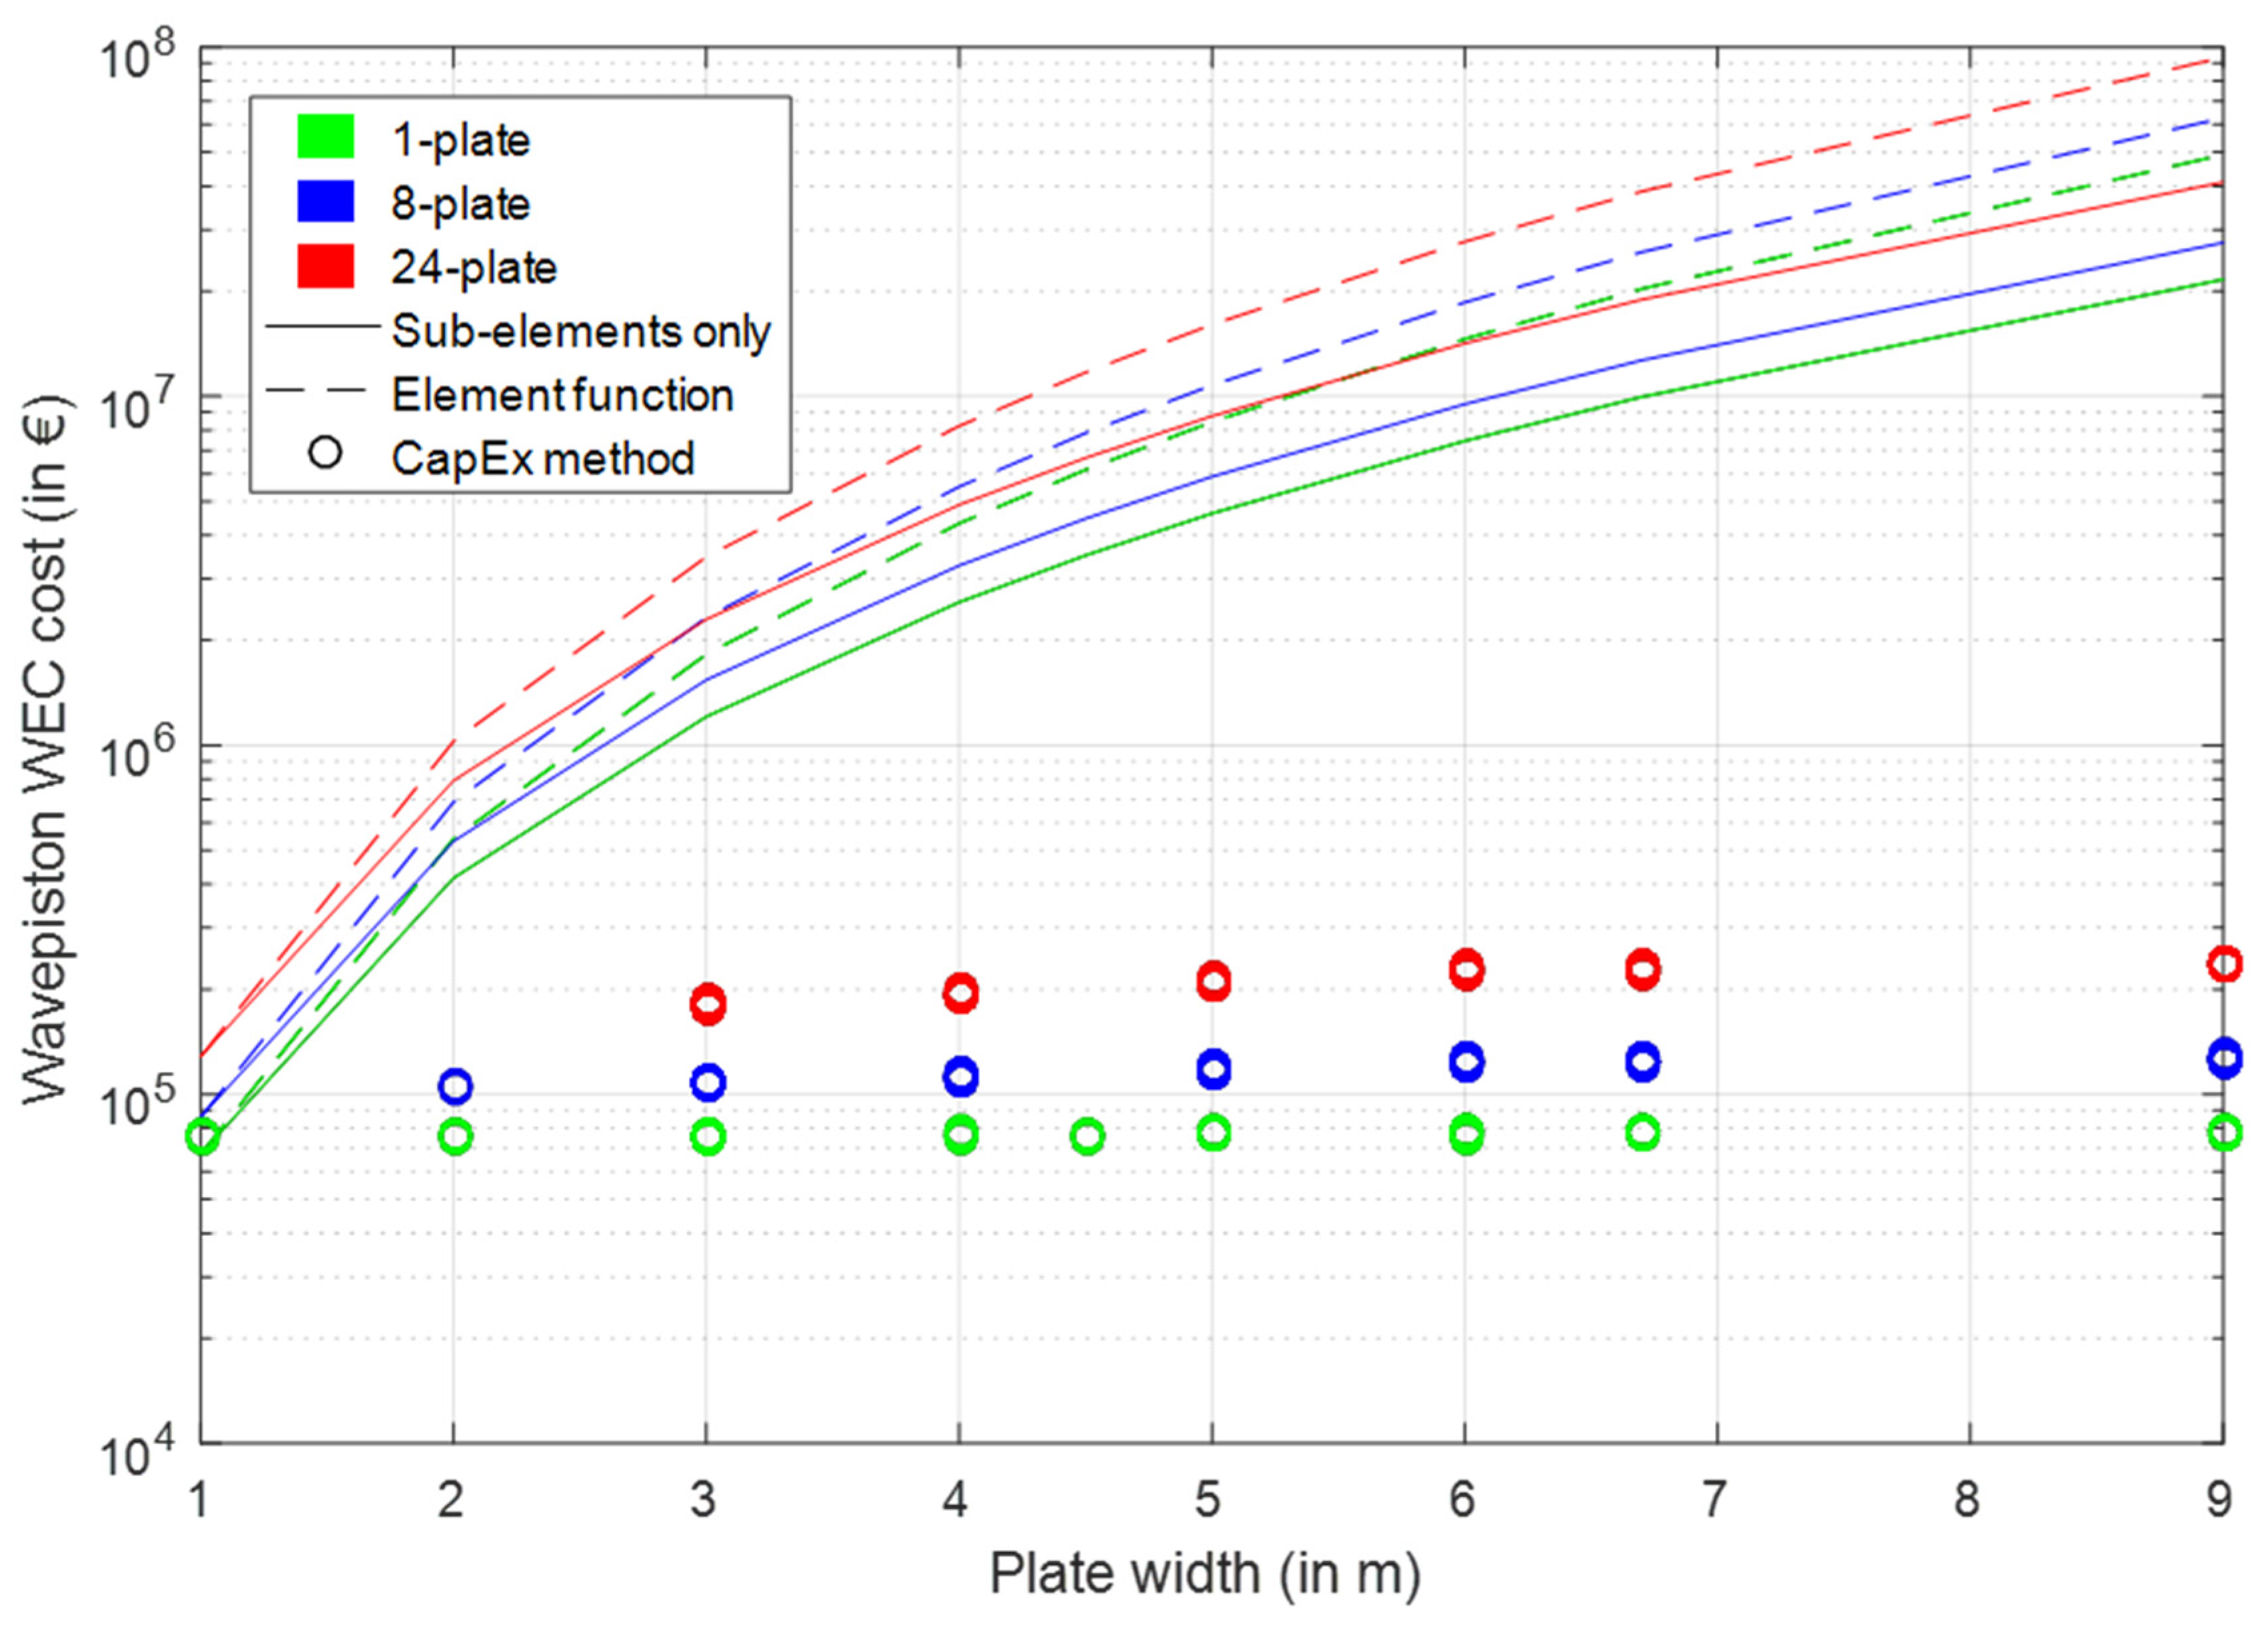
Moreover, due to the strong dependency of Wavepiston on Np, to estimate the values of scaled up Wavepiston for Np different from 1, the same process used to obtain Table 11 should be applied to a base cost still estimated for 1 m × 1 m plate but for the enquired number of plates. The simplest design of 8-plate and 24-plate Wavepiston WEC are obtained for plates distanced (plc) by 7 m, which must also be considered alongside the number of plates. Indeed, some element base costs (see Section 3.1.3.) depend on plc. For the 8-plate design the base cost is estimated to be 86,093 € and for 24-plate, 128,445 €, for which the results are provided in Figure 7. Eventually, for plate width of 1 m, the Similitude method results equal the base cost resulting in a starting point always below the CapEx method minimum boundaries for each category of number of plates.
Figure 7 shows a clear discrepancy between the results of the Similitude and CapEx methods such that the results obtained with the Similitude method can be 5–529 times higher than those of the CapEx method. In fact, the difference between the two methods reduces with increasing number of plates and the “Element function” provides the most significant difference. Considering the “Sub-element only” weight scale coefficient, the Similitude method’s results reach up to 146 times of those of the CapEx method, for the 24-plate configuration, and 232, for the 1-plate. This difference is reduced to 36 for 24-plate and 58 for 1-plate. In effect, the Similitude method based on the plate width parameter can be compared to Wavepiston for size below 3 m, and the larger number of plate is, the closer are the results from the two methods. Yet, due to the limited dataset, no concrete conclusion can be provided to determine a limit of number of plates over which the Similitude method, simpler to apply, could be used instead of the CapEx method, more complex, to estimate Wavepiston WEC costs.
It is reasonable to notice that given the values of the parameters, any Wavepiston WEC cost above 10 M€ is unrealistic. Therefore, the results from Table 12 shows that the string length parameter tested as an alternative “Scale” parameter (Equation (4)) to apply the Similitude method cannot be used for Wavepiston. A third parameter consisting of the plate width multiplied by the number of plates was also considered as a combination of the two major parameters for Wavepiston power absorption; however, similarly to Table 12, all results were above a billion euros and so were disregarded from the study. Consequently, amongst the three different “Scale” parameters tested to apply the Similitude method to Wavepiston, the closest results to the CapEx method are obtained from the plate width. Henceforth, the other parameters’ analysis is not extended to the 8-plate and 24-plate Wavepiston.
In the case of Wavepiston, each parameter has a specific impact on the energy absorption, sizing of the WEC, and thereby costs, which was found to diverge from the Froude law scaling concerning the costs. Consequently, the Similitude method is less appropriate to scale the costs of Wavepiston than the CapEx method that enables the selection of specific parameters impact on the costs.

5. Summary and Conclusions

This study presents the generic “CapEx method” with application to the wave renewable energy field. The CapEx method aims to provide a systematic and comprehensive approach for WEC and WEF cost parameterisation to enable future calculations of large datasets of WEC, WEF, and site characteristics to select optimised pairs of WEC/WEF configuration and site. This method distinguishes WEC and WEF elements and sub-elements, an element and sub-elements being a system, module, component, piece, or task, in the calculations. Then, tasks such as manufacturing and assembling, are assigned to the different parts. For each element and sub-element, a base cost, a margin, and one or more factors are estimated. In its simplest form, the calculation part of the CapEx method appears as an ordinary cost estimation leading to an overall sum of costs with margins. In the alternative approach, the factors enable the encapsulation of several phenomena concerning site characteristics, and WEC and WEF configurations. In its advanced form, more abstract elements can be included such as economies of scale and weather and wave climate influence on the costs of the element and sub-elements of the WEC and WEF, through the factors leading to the complex parameterised CapEx calculation.
In this article, the CapEx method was applied to a Wavepiston farm to estimate the Wavepiston WEC cost for different WEC-configuration and site characteristics. This example is an intermediate use of the CapEx method to allow the research to focus more on the CapEx method’s two first steps. Indeed, one of the significant challenges of this research was to handle limited and complex databases of configurations such as the one provided by Wavepiston. This complexity is due to the selected parameters and their limited number of combinations. Consequently, one of this study’s contribution is the approach to describe, understand, and use such a database as required by the first two steps of the CapEx method.
The cost of Wavepiston WEC for the limited configurations available from the database ranges between 66 K€ (for 1-plate 1 m × 1 m Wavepiston WEC) to 240 K€ (for 24-9 m × 4 m plates distanced by 14m) bearing in mind that these WEC dimensions are more theoretical than practical as Wavepiston estimates the first commercial system to consist of 32 plates or energy collector. The number of plates was found to be the most influencing parameter on the WEC cost, also increasing other parameters effect as it increases. The plate dimensions and especially the plate width were the second most influent parameters. It was also found that the factors could represent more than 30% of the costs and their combination could lead to cost trends over the parameters differing from each factor trend. Finally, the study showed that Wavepiston WEC cost parameterised using the CapEx method resulted in the site’s parameters having little effect on the WEC and WEC element costs, in comparison to other parameters such as Wavepiston’s number of plates and plate width, more related to the WEC configuration.
The results from the CapEx method in line with manual estimations from Wavepiston, were also compared to the method of de Andres et al. [50] referred to as the “Similitude method”. It was found that (a) when considering sub-elements of the WEC main elements, the weighted scale coefficient should be estimated only over the sub-elements regardless the dimension associated with the top-element; (b) the plate width is the most reliable parameter to apply the method to Wavepiston; (c) for low values of the plate width, the Similitude and CapEx methods provide close costs; (d) the more plates there are on the string, the closer the costs estimated by the CapEx and Similitude methods are; and (e) despite that, due to its multi-parameterised configuration design, Wavepiston cost is better estimated using the CapEx method than by the method of de Andres et al. [50] that provides results up to 36 times those from the CapEx method. Yet, it is important to notice that the Similitude may be less appropriate to Wavepiston than to other devices especially for Wavepiston’s particularity of being a multi-energy-collector-based WEC instead of single-energy-collector-based devices as the one used to develop this method.
Although WEC cost estimation seems to have decreased over time, probably from learning processes, Wavepiston WEC costs (for high energy production potential around 1.17 MW) were below the reported values from literature. The Similitude method (as well as other widely-used methods including based on mass or power parameterisation) has can potentially overestimate costs. Consequently, the current LCoE of the wave energy field, higher compared to other renewables, may be overestimated since WEC costs (including the moorings) represents 33% of the LCoE [97] and replacement (including WEC cost) 45% of the OpEx [38], itself representing 40% of the LCoE [85,97].
Windows of improvements of the WEC cost estimations based on the CapEx method consist of including forces and loads effects, such as the moorings’ effects on the string. Indeed, the size and strength of different pieces relate to the loads they are expected to endure; thus, even if this could be thought of more as an operational-and-maintenance-related phenomenon, it also influences the capital costs. This is also the case of the effect of weather and wave climates, and economies of scale, which can be included using the advanced or expert levels of the CapEx method cost-calculation. For instance, in future work, the impact of availability and protection mode could be considered for the device elements and sub-elements fatigue influencing their strength, and thereby cost.
The CapEx method enables flexible selection of parameters to translate different phenomena affecting the costs. Still, a comprehensive application of this method requires much experience from the user to be accurate, which is currently difficult to reach due to the Research and Development stage of the field. Therefore, the automated CapEx estimated using the CapEx method should be considered for a single type of WEC at a time to select the most accurate configuration for a given site, and vice-versa, and not between WECs. Once the selection is made, a final CapEx estimation is recommended based on a more precise analysis of the local subcontractors’ prices and the costs of the pieces requiring importation from other regions or countries. The CapEx method’s primary limitation is the need for complete access to the WEF and WEC elements and sub-elements details, and this is often confidential information. Notably, the costs of the different elements are usually not accessible. Future work should provide Wavepiston CapEx and particularly the costs for the Wavepiston WEF elements and sub-elements, giving a sense of translating the impact of the wave climate on the WEF. For instance, this phenomenon would affect the sizing of the WEF through the need for the WEC to have the capacity to absorb the yearly wave energy. Applying the CapEx method for WEF cost estimations could help to better assess the direct impact that WEFs could have on diversifying the energy renewable mix. Moreover, the application of the CapEx method to the operation and maintenance cost estimation should be investigated. Indeed, operation and maintenance tasks can be evaluated for each WEC and WEF element and sub-element, and for each task, factors could be estimated for the calculation of the operation and maintenance costs. The occurrence of each task within the WEF lifecycle is an example of a parameter for these factors. In turn, the operation and maintenance cost alongside the CapEx and AEP could enable the calculation of several selected economic indicators such as the aforementioned LCoE as well as the NPV, and their comparison with the research from de Andres et al. [50].
The Similitude method is more rigid than the CapEx method but requires less information. It is worth noting that originally the Similitude method is applied to the entire CapEx of a WEF, whereas in this case, the application was reduced to the Wavepiston WEC cost. The sensitivity of the WEC cost using the Similitude method may be increased as the scaling effect’s implication is shared amongst a few components compared to the total WEF and WECs number of pieces involved in the CapEx calculation. Additionally, more research should be undertaken about the Similitude method to determine which approach (amongst the four proposed in this study) represents the system weighted scale coefficient best. Future work could provide two extensions of the Similitude method that align with the CapEx method to make the Similitude method more flexible: (a) Simplest extension: The method could be extended to each cost rather than the final CapEx. Each cost would then be multiplied by the scaling factor power of the selected scaling parameter. By doing so, the overall representative dimension, and thereby the scaling factor, may no longer be representative enough of each module; hence, for each cost, a new dimension should be determined. (b) Advanced extension: In order to include more than one parameter affecting the costs, two extensions could be investigated: setting SS as the scaling factor power of the scaling parameter, the total factor could either be (1) the sum, or (2) the multiplication of these SSs. However, in both cases, each SS’s contribution to the total factor and the cost is hardly traceable or transparent, and is difficult to understand and control, since the resulting total factor multiplies the base cost. The multiplying effect is the reason why in the presence of more than one parameter translating more than one phenomena affecting cost estimations, Equations (2) and (3) may bring more transparency for a more fundamental understanding and assessment of the final costs.
For WEC scaling, this study extended the method of de Andres et al. [50] to parameterise the cost in the case of limited access to the WEF and WEC elements and sub-elements information and costs. However, the application to multi-parameter WECs is limited and should be conducted carefully. For a more complete access to information and costs, the CapEx method was found to be a robust framework that enables flexible and transparent cost calculations for both simple and complex cost parameterisations. This method has the benefit to generate automatically the costs for large databases of pairs of sites and WEC configurations. Even though the manual estimation may be more accurate, (more research is required to assess both methods uncertainty levels) this method enables assessing site-WEC configuration pairing worldwide, which cannot be carried out manually due to the tremendous amount of information.

Author Contributions

Conceptualisation, O.C. and M.H.; methodology, O.C. and M.H.; software, O.C.; validation, M.H.; formal analysis, O.C. and M.H.; investigation, O.C. and M.H.; resources, M.H.; data curation, M.H. and O.C.; writing—original draft preparation, O.C.; writing—review and editing, O.C., A.E.-S., R.T., and M.H.; visualisation, O.C., A.E.-S., and R.T.; supervision, M.H., A.E.-S., and R.T.; project administration, M.H., O.C., and R.T.; funding acquisition, M.H. and R.T. All authors have read and agreed to the published version of the manuscript.

Funding

This research received no external funding.

Institutional Review Board Statement

Not applicable.

Informed Consent Statement

Not applicable.

Data Availability Statement

All data generated or analysed during this study are provided within the text. This includes the complete dataset including the costs, factors, and equations used to undertake these calculations.

Acknowledgments

Most of this research did not receive any specific grant from funding agencies in the public, commercial, or not-for-profit sectors. However, the first author would like to acknowledge the support from Griffith University through a Postgraduate Research Scholarship. Wavepiston provided the dataset and first raw estimations of the element costs. The Technical University of Denmark, provided the Energy Tool to assess the energy of Wavepiston pairs of site and configuration. The authors would like to acknowledge the Institute of Advanced Industrial Technologies (ESTIA) that enabled this research. A final thanks to Harry Bingham, Robert Read, Karl Jenkins, Fernando Pinheiro Andutta, Christophe Chazot, and Ingrid Florentin, who provided many constructive comments and feedback to improve the study.

Conflicts of Interest

The authors declare they have no competing interest.

Nomenclature

List of Symbols
dmSite water depth
hmWamit water depth
HsmWave significant height
TpsWave peak period
Np--Wavepiston number of plates
pdmWavepiston plate depth
plc-- and m Wavepiston plate location configuration (associated with the distance between the plates)
ps--Wavepiston plate shape
qmDistance to shore
smData water depth
θpdegreesWave peak direction
List of Abbreviation /Nomenclature
AEPMWh/yearAnnual Energy Production
CapExEurosCapital Expenditure
LCoEEuros/kWLevelised Cost of Energy
List of Abbreviations
2D2-Dimensional space based on Hs and Tp
3D3-Dimensional space that adds θp to Hs and Tp
PMPower Matrix
PTOPower-Take-Off
TRLTechnology Readiness Levels
WECWave Energy Converter
WEFWave Energy Farm

References

  1. Electric Cars, Solar & Clean Energy|Tesla Australia. Available online: https://www.tesla.com/en_AU/ (accessed on 26 January 2021).
  2. BMW Electromobility: Overview|BMW.Com.Au. Available online: https://www.bmw.com.au/en/topics/electromobility/electromobility.html (accessed on 26 January 2021).
  3. Pipistrel Aircraft. Available online: https://www.pipistrel-aircraft.com/ (accessed on 1 January 2021).
  4. Wright Electric—Transforming the Aviation Industry with Electric Planes. Available online: https://weflywright.com/ (accessed on 26 January 2021).
  5. Nakata, T.; Silva, D.; Rodionov, M. Application of energy system models for designing a low-carbon society. Prog. Energy Combust. Sci. 2011, 37, 462–502. [Google Scholar] [CrossRef]
  6. Kenny, R.; Law, C.; Pearce, J.M. Towards real energy economics: Energy policy driven by life-cycle carbon emission. Energy Policy 2010, 38, 1969–1978. [Google Scholar] [CrossRef]
  7. 7MacKay, D.J.C. Sustainable Energy—Without the Hot Air; Green Books: Cambridge, UK, 2009; ISBN 978-0-9544529-3-3. [Google Scholar]
  8. Owen, R.; Brennan, G.; Lyon, F. Enabling investment for the transition to a low carbon economy: Government policy to finance early stage green innovation. Curr. Opin. Environ. Sustain. 2018, 31, 137–145. [Google Scholar] [CrossRef]
  9. Kokkinos, K.; Karayannis, V.; Moustakas, K. Circular bio-economy via energy transition supported by Fuzzy Cognitive Map modeling towards sustainable low-carbon environment. Sci. Total Environ. 2020, 721, 137754. [Google Scholar] [CrossRef] [PubMed]
  10. Ram, M.; Aghahosseini, A.; Breyer, C. Job creation during the global energy transition towards 100% renewable power system by 2050. Technol. Forecast. Soc. Chang. 2020, 151, 119682. [Google Scholar] [CrossRef]
  11. Thombs, R.P. When democracy meets energy transitions: A typology of social power and energy system scale. Energy Res. Soc. Sci. 2019, 52, 159–168. [Google Scholar] [CrossRef]
  12. Falcone, P.M.; Lopolito, A.; Sica, E. Instrument mix for energy transition: A method for policy formulation. Technol. Forecast. Soc. Chang. 2019, 148, 119706. [Google Scholar] [CrossRef]
  13. García, P.Q.; Ruiz, J.A.C.; Sanabria, J.G. Blue energy and marine spatial planning in Southern Europe. Energy Policy 2020, 140, 111421. [Google Scholar] [CrossRef]
  14. Dietzenbacher, E.; Kulionis, V.; Capurro, F. Measuring the effects of energy transition: A structural decomposition analysis of the change in renewable energy use between 2000 and 2014. Appl. Energy 2020, 258, 114040. [Google Scholar] [CrossRef]
  15. Gunn, K.; Stock-Williams, C. Quantifying the global wave power resource. Renew. Energy 2012, 44, 296–304. [Google Scholar] [CrossRef]
  16. Clemente, D.; Rosa-Santos, P.; Taveira-Pinto, F. On the potential synergies and applications of wave energy converters: A review. Renew. Sustain. Energy Rev. 2021, 135, 110162. [Google Scholar] [CrossRef]
  17. Allan, G.; Bryden, I.; McGregor, P.; Stallard, T.; Swales, J.K.; Turner, K.; Wallace, R. Concurrent and legacy economic and environmental impacts from establishing a marine energy sector in Scotland. Energy Policy 2008, 36, 2734–2753. [Google Scholar] [CrossRef]
  18. Robertson, B.; Bekker, J.; Buckham, B. Renewable integration for remote communities: Comparative allowable cost analyses for hydro, solar and wave energy. Appl. Energy 2020, 264, 114677. [Google Scholar] [CrossRef]
  19. Lehmann, M.; Karimpour, F.; Goudey, C.A.; Jacobson, P.T.; Alam, M.-R. Ocean wave energy in the United States: Current status and future perspectives. Renew. Sustain. Energy Rev. 2017, 74, 1300–1313. [Google Scholar] [CrossRef]
  20. Marinet. Available online: https://marinet.org/ (accessed on 1 January 2021).
  21. Guillou, N.; Lavidas, G.; Chapalain, G. Wave Energy Resource Assessment for Exploitation—A Review. J. Mar. Sci. Eng. 2020, 8, 705. [Google Scholar] [CrossRef]
  22. De Andres, A.; MacGillivray, A.; Roberts, O.; Guanche, R.; Jeffrey, H. Beyond LCOE: A study of ocean energy technology development and deployment attractiveness. Sustain. Energy Technol. Assess. 2017, 19, 1–16. [Google Scholar] [CrossRef]
  23. Allan, G.; Gilmartin, M.; McGregor, P.; Swales, K. Levelised costs of Wave and Tidal energy in the UK: Cost competitiveness and the importance of “banded” Renewables Obligation Certificates. Energy Policy 2011, 39, 23–39. [Google Scholar] [CrossRef]
  24. Chang, G.; Jones, C.; Roberts, J.D.; Neary, V.S. A comprehensive evaluation of factors affecting the levelized cost of wave energy conversion projects. Renew. Energy 2018, 127, 344–354. [Google Scholar] [CrossRef]
  25. Astariz, S.; Iglesias, G. The economics of wave energy: A review. Renew. Sustain. Energy Rev. 2015, 45, 397–408. [Google Scholar] [CrossRef]
  26. Shadman, M.; Silva, C.; Faller, D.; Wu, Z.; Assad, L.P.D.F.; Landau, L.; Levi, C.; Estefen, S.F. Ocean Renewable Energy Potential, Technology, and Deployments: A Case Study of Brazil. Energies 2019, 12, 3658. [Google Scholar] [CrossRef] [Green Version]
  27. De Andres, A.; Guanche, R.; Weber, J.; Costello, R. Finding gaps on power production assessment on WECs: Wave definition analysis. Renew. Energy 2015, 83, 171–187. [Google Scholar] [CrossRef]
  28. Prendergast, J.; Li, M.; Sheng, W. A Study on the Effects of Wave Spectra on Wave Energy Conversions. IEEE J. Ocean. Eng. 2018, 45, 271–283. [Google Scholar] [CrossRef]
  29. Mackay, E.B.; Bahaj, A.S.; Challenor, P.G. Uncertainty in wave energy resource assessment. Part 1: Historic data. Renew. Energy 2010, 35, 1792–1808. [Google Scholar] [CrossRef]
  30. Pascal, R.C.; Gorintin, F.; Payne, G.S.; Cliquet, V. The Right Size for a WEC: A Study on the Consequences of the Most Basic Design Choice. In Proceedings of the 7th International Conference on Ocean Energy, Cherbourg, France, 12–14 June 2018. [Google Scholar]
  31. De Andres, A.; Medina-Lopez, E.; Crooks, D.; Roberts, O.; Jeffrey, H. On the reversed LCOE calculation: Design constraints for wave energy commercialization. Int. J. Mar. Energy 2017, 18, 88–108. [Google Scholar] [CrossRef]
  32. Piscopo, V.; Benassai, G.; Della Morte, R.; Scamardella, A. Cost-Based Design and Selection of Point Absorber Devices for the Mediterranean Sea. Energies 2018, 11, 946. [Google Scholar] [CrossRef] [Green Version]
  33. Hiles, C.; Beatty, S.; De Andres, A. Wave Energy Converter Annual Energy Production Uncertainty Using Simulations. J. Mar. Sci. Eng. 2016, 4, 53. [Google Scholar] [CrossRef] [Green Version]
  34. Mérigaud, A.; Ringwood, J.V. Power production assessment for wave energy converters: Overcoming the perils of the power matrix. Proc. Inst. Mech. Eng. Part M J. Eng. Marit. Environ. 2018, 232, 50–70. [Google Scholar] [CrossRef]
  35. Castro-Santos, L.; Silva, D.; Bento, A.R.; Salvação, N.; Soares, C.G. Economic Feasibility of Wave Energy Farms in Portugal. Energies 2018, 11, 3149. [Google Scholar] [CrossRef] [Green Version]
  36. Guanche, R.; De Andres, A.; Losada, I.J.; Vidal, C. A global analysis of the operation and maintenance role on the placing of wave energy farms. Energy Convers. Manag. 2015, 106, 440–456. [Google Scholar] [CrossRef]
  37. Lavidas, G.; Agarwal, A.; Venugopal, V. Availability and Accessibility for Offshore Operations in the Mediterranean Sea. J. Waterw. Port Coastal Ocean Eng. 2018, 144, 05018006. [Google Scholar] [CrossRef] [Green Version]
  38. O’Connor, M.; Lewis, A.; Dalton, G. Operational expenditure costs for wave energy projects and impacts on financial returns. Renew. Energy 2013, 50, 1119–1131. [Google Scholar] [CrossRef] [Green Version]
  39. De Andres, A.; Maillet, J.; Todalshaug, J.H.; Möller, P.; Bould, D.; Jeffrey, H. Techno-Economic Related Metrics for a Wave Energy Converters Feasibility Assessment. Sustainability 2016, 8, 1109. [Google Scholar] [CrossRef] [Green Version]
  40. Guanche, R.; De Andrés, A.; Simal, P.; Vidal, C.; Losada, I.J. Uncertainty analysis of wave energy farms financial indicators. Renew. Energy 2014, 68, 570–580. [Google Scholar] [CrossRef]
  41. Chozas, J.F.; Kofoed, J.P.; Jensen, N.E.H. User Guide–COE Calculation Tool for Wave Energy Converters: Ver. 1.6—April 2014, 1st ed.; DCE Technical Reports; Department of Civil Engineering, Aalborg University: Aalborg, Denmark, 2014. [Google Scholar]
  42. Somasundaram, S.; Tay, A.A.O. Performance study and economic analysis of photo-voltaic thermal system under real-life thermal loads in tropical climate. Sustain. Environ. Res. 2019, 29, 1–10. [Google Scholar] [CrossRef] [Green Version]
  43. Clark, C.; Miller, A.; Dupont, B. An analytical cost model for co-located floating wind-wave energy arrays. Renew. Energy 2019, 132, 885–897. [Google Scholar] [CrossRef]
  44. LaBonte, A.; O’Connor, P.; Fitzpatrick, C.; Hallett, K.; Li, Y. Standardized Cost and Performance Reporting for Ma-rine and Hydrokinetic Technologies. In Proceedings of the 1st Marine Energy Technology Symposi-um (METS13), Washington, DC, USA, 10–11 April 2013; pp. 10–11. [Google Scholar]
  45. Marine Energy—System Advisor Model (SAM). Available online: https://sam.nrel.gov/marine-energy.html (accessed on 7 December 2020).
  46. Neary, V.S.; Lawson, M.; Previsic, M.; Copping, A.; Hallett, K.C.; LaBonte, A.; Rieks, J.; Murray, D. Methodology for Design and Economic Analysis of Marine Energy Conversion (MEC) Technologies; Sandia National Lab. (SNL-NM): Albu-querque, NM, USA, 2014. [Google Scholar]
  47. Lavidas, G.; Venugopal, V.; Friedrich, D. Wave energy extraction in Scotland through an improved nearshore wave atlas. Int. J. Mar. Energy 2017, 17, 64–83. [Google Scholar] [CrossRef] [Green Version]
  48. Castro-Santos, L.; Bento, A.R.; Soares, C.G. The Economic Feasibility of Floating Offshore Wave Energy Farms in the North of Spain. Energies 2020, 13, 806. [Google Scholar] [CrossRef] [Green Version]
  49. Babarit, A.; Hals, J.; Muliawan, M.J.; Kurniawan, A.; Moan, T.; Krokstad, J. Numerical benchmarking study of a selection of wave energy converters. Renew. Energy 2012, 41, 44–63. [Google Scholar] [CrossRef]
  50. De Andres, A.; Maillet, J.; Todalshaug, J.H.; Möller, P.; Jeffrey, H. On the Optimum Sizing of a Real WEC From a Techno-Economic Perspective. Ocean. Eng. 2016, 7, V006T09A013. [Google Scholar]
  51. De Andrés, A.; Guanche, R.; Meneses, L.; Vidal, C.R.; Losada, I.J. Factors that influence array layout on wave energy farms. Ocean Eng. 2014, 82, 32–41. [Google Scholar] [CrossRef]
  52. O’Connor, M.; Lewis, T.; Dalton, G. Techno-economic performance of the Pelamis P1 and Wavestar at different ratings and various locations in Europe. Renew. Energy 2013, 50, 889–900. [Google Scholar] [CrossRef]
  53. Beels, C.; Troch, P.; Kofoed, J.P.; Frigaard, P.; Kringelum, J.V.; Kromann, P.C.; Donovan, M.H.; De Rouck, J.; De Backer, G. A methodology for production and cost assessment of a farm of wave energy converters. Renew. Energy 2011, 36, 3402–3416. [Google Scholar] [CrossRef]
  54. Izquierdo-Pérez, J.; Brentan, B.; Izquierdo, J.; Clausen, N.-E.; Pegalajar-Jurado, A.; Ebsen, N. Layout Optimization Process to Minimize the Cost of Energy of an Offshore Floating Hybrid Wind–Wave Farm. Processes 2020, 8, 139. [Google Scholar] [CrossRef] [Green Version]
  55. Moreno, E.C.; Stansby, P. The 6-float wave energy converter M4: Ocean basin tests giving capture width, response and energy yield for several sites. Renew. Sustain. Energy Rev. 2019, 104, 307–318. [Google Scholar] [CrossRef] [Green Version]
  56. Chatzigiannakou, M.; Temiz, I.; Leijon, M. Offshore Deployments of Wave Energy Converters by Seabased Industry AB. J. Mar. Sci. Eng. 2017, 5, 15. [Google Scholar] [CrossRef]
  57. Thomsen, J.B.; Ferri, F.; Kofoed, J.P.; Black, K. Cost Optimization of Mooring Solutions for Large Floating Wave Energy Converters. Energies 2018, 11, 159. [Google Scholar] [CrossRef] [Green Version]
  58. Teillant, B.; Costello, R.; Weber, J.; Ringwood, J.V. Productivity and economic assessment of wave energy projects through operational simulations. Renew. Energy 2012, 48, 220–230. [Google Scholar] [CrossRef] [Green Version]
  59. Flocard, F.; Ierodiaconou, D.; Coghlan, I.R. Multi-criteria evaluation of wave energy projects on the south-east Australian coast. Renew. Energy 2016, 99, 80–94. [Google Scholar] [CrossRef]
  60. Bonnard, C.-H.; Blavette, A.; Bourguet, S.; Charmetant, A. Modeling of a wave farm export cable for electro-thermal sizing studies. Renew. Energy 2020, 147, 2387–2398. [Google Scholar] [CrossRef]
  61. Behrens, S.; Hayward, J.; Hemer, M.; Osman, P. Assessing the wave energy converter potential for Australian coastal regions. Renew. Energy 2012, 43, 210–217. [Google Scholar] [CrossRef]
  62. Dunnett, D.; Wallace, J.S. Electricity generation from wave power in Canada. Renew. Energy 2009, 34, 179–195. [Google Scholar] [CrossRef]
  63. Monds, J.R. Multicriteria Decision Analysis for Wave Power Technology in Canada. J. Energy Resour. Technol. 2013, 136, 021201. [Google Scholar] [CrossRef]
  64. Myhr, A.; Bjerkseter, C.; Ågotnes, A.; Nygaard, T.A. Levelised cost of energy for offshore floating wind turbines in a life cycle perspective. Renew. Energy 2014, 66, 714–728. [Google Scholar] [CrossRef] [Green Version]
  65. Sheng, W.; Alcorn, R.; Lewis, T. Physical modelling of wave energy converters. Ocean Eng. 2014, 84, 29–36. [Google Scholar] [CrossRef]
  66. Castro-Santos, L.; Filgueira-Vizoso, A. A Software for Calculating the Economic Aspects of Floating Offshore Renewable Energies. Int. J. Environ. Res. Public Health 2019, 17, 218. [Google Scholar] [CrossRef] [PubMed] [Green Version]
  67. Wavepiston. Available online: http://www.wavepiston.dk/ (accessed on 11 February 2020).
  68. Wavepiston A/S. Wavepiston—Next Generation Wave Power; ForskEL: Hanstholm, Denmark, 2019; pp. 1–16. [Google Scholar]
  69. Schallenberg-Rodríguez, J.; Del Río-Gamero, B.; Melián-Martel, N.; Alecio, T.L.; Herrera, J.G. Energy supply of a large size desalination plant using wave energy. Practical case: North of Gran Canaria. Appl. Energy 2020, 278, 115681. [Google Scholar] [CrossRef]
  70. Behrens, S.; Hayward, J.A.; Woodman, S.C.; Hemer, M.A.; Ayre, M. Wave energy for Australia’s National Electricity Market. Renew. Energy 2015, 81, 685–693. [Google Scholar] [CrossRef]
  71. Morim, J.; Cartwright, N.; Hemer, M.; Etemad-Shahidi, A.; Strauss, D. Inter- and intra-annual variability of potential power production from wave energy converters. Energy 2019, 169, 1224–1241. [Google Scholar] [CrossRef]
  72. Aristodemo, F.; Ferraro, D.A. Feasibility of WEC installations for domestic and public electrical supplies: A case study off the Calabrian coast. Renew. Energy 2018, 121, 261–285. [Google Scholar] [CrossRef]
  73. Onea, F.; Rusu, L. Evaluation of Some State-Of-The-Art Wind Technologies in the Nearshore of the Black Sea. Energies 2018, 11, 2452. [Google Scholar] [CrossRef] [Green Version]
  74. Harris, R.E.; Johanning, L.; Wolfram, J. Mooring Systems for Wave Energy Converters: A Review of Design Issues and Choices. In Proceedings of the 3rd International Conference on Marine Renewable Energy (Marec2004), Blyth, UK, 7–9 July 2004; pp. 1–10. [Google Scholar]
  75. Segura, E.; Morales, R.; Somolinos, J.A. Cost Assessment Methodology and Economic Viability of Tidal Energy Projects. Energies 2017, 10, 1806. [Google Scholar] [CrossRef] [Green Version]
  76. Astariz, S.; Iglesias, G. Enhancing Wave Energy Competitiveness through Co-Located Wind and Wave Energy Farms. A Review on the Shadow Effect. Energies 2015, 8, 7344–7366. [Google Scholar] [CrossRef]
  77. Castro-Santos, L.; Martins, E.; Soares, C.G. Cost assessment methodology for combined wind and wave floating offshore renewable energy systems. Renew. Energy 2016, 97, 866–880. [Google Scholar] [CrossRef]
  78. Falcone, P.M. Analysing stakeholders’ perspectives towards a socio-technical change: The energy transition journey in Gela Municipality. AIMS Energy 2018, 6, 645–657. [Google Scholar] [CrossRef]
  79. Giassi, M.; Castellucci, V.; Göteman, M. Economical layout optimization of wave energy parks clustered in electrical subsystems. Appl. Ocean Res. 2020, 101, 102274. [Google Scholar] [CrossRef]
  80. Pecher, A.; Kofoed, J.P. (Eds.) Handbook of Ocean Wave Energy, 1st ed.; Springer: Berlin/Heidelberg, Germany, 2016. [Google Scholar]
  81. López, I.; Andreu, J.; Ceballos, S.; De Alegría, I.M.; Kortabarria, I. Review of wave energy technologies and the necessary power-equipment. Renew. Sustain. Energy Rev. 2013, 27, 413–434. [Google Scholar] [CrossRef]
  82. Weber, J. WEC Technology Readiness and Performance Matrix–Finding the Best Research Technology Development Trajectory. In Proceedings of the 4th International Conference on Ocean Energy, Dublin, Ireland, 17 October 2012; Volume 17. [Google Scholar]
  83. Parker, R.P.M.; Harrison, G.P.; Chick, J.P. Energy and carbon audit of an offshore wave energy converter. Proc. Inst. Mech. Eng. Part A J. Power Energy 2007, 221, 1119–1130. [Google Scholar] [CrossRef] [Green Version]
  84. Dalton, G.; Alcorn, R.; Lewis, T. A 10 year installation program for wave energy in Ireland: A case study sensitivity analysis on financial returns. Renew. Energy 2012, 40, 80–89. [Google Scholar] [CrossRef]
  85. Astariz, S.; Iglesias, G. Wave energy vs. other energy sources: A reassessment of the economics. Int. J. Green Energy 2015, 13, 747–755. [Google Scholar] [CrossRef]
  86. Hughes, S.A. Physical Models and Laboratory Techniques in Coastal Engineering; World Scientific: Singapore, 1993; ISBN 978-981-4502-70-2. [Google Scholar]
  87. Read, R.; Bingham, H. Time- and Frequency-Domain Comparisons of the Wavepiston Wave Energy Converter. In Proceedings of the 33rd International Workshop on Water Waves and Floating Bodies (IWWWFB 2018), Guidel-Plages, France, 4–7 April 2018. [Google Scholar]
  88. Wavepiston A/S. Wavepiston MK I Test at Nissum Bredning; Wavepiston A/S: Helsingør, Denmark, 2013; pp. 1–15. [Google Scholar]
  89. Astariz, S.; Perez-Collazo, C.; Abanades, J.; Iglesias, G. Co-located wave-wind farms: Economic assessment as a function of layout. Renew. Energy 2015, 83, 837–849. [Google Scholar] [CrossRef]
  90. von Bulow, M.; Glejbol, K.; Mersebach, F.D. Apparatus for Converting Ocean Wave Energy. WO2010031405A2, 16 July 2013. [Google Scholar]
  91. Falnes, J. A review of wave-energy extraction. Mar. Struct. 2007, 20, 185–201. [Google Scholar] [CrossRef]
  92. Medel, S. Study of the Introduction of Wave and Tidal Technologies as Small Ways of Electricity Generation; University of Chile: Santiago, Chile, 2010. [Google Scholar]
  93. Sorensen, H. WaveDragon-from the 20 KW to the 7 MW Prototype Device. In Proceedings of the EU Contactors’ Meeting, Bremerhaven, Germany, 16–18 May 2006; Volume 25. [Google Scholar]
  94. Anderson, C. Pelamis WEC–Main. In Body Structural Design and Materials Selection; V-06/00197/00/00/REP; DTI-URN-03/1439, TRN: GB0420274; Ocean Power Delivery Ltd.: London, UK, 2003. Available online: https://www.osti.gov/etdeweb/biblio/20455933 (accessed on 1 May 2015).
  95. AquaBuOY in Portugal; AquaEnergy Group Ltd. Finavera Renewables. Available online: https://aquaenergygroup.com.au/ (accessed on 1 May 2015).
  96. Dalton, G.; Alcorn, R.; Lewis, T. Case study feasibility analysis of the Pelamis wave energy convertor in Ireland, Portugal and North America. Renew. Energy 2010, 35, 443–455. [Google Scholar] [CrossRef]
  97. Morim, J.; Cartwright, N.; Etemad-Shahidi, A.; Strauss, D.; Hemer, M. A review of wave energy estimates for nearshore shelf waters off Australia. Int. J. Mar. Energy 2014, 7, 57–70. [Google Scholar] [CrossRef] [Green Version]
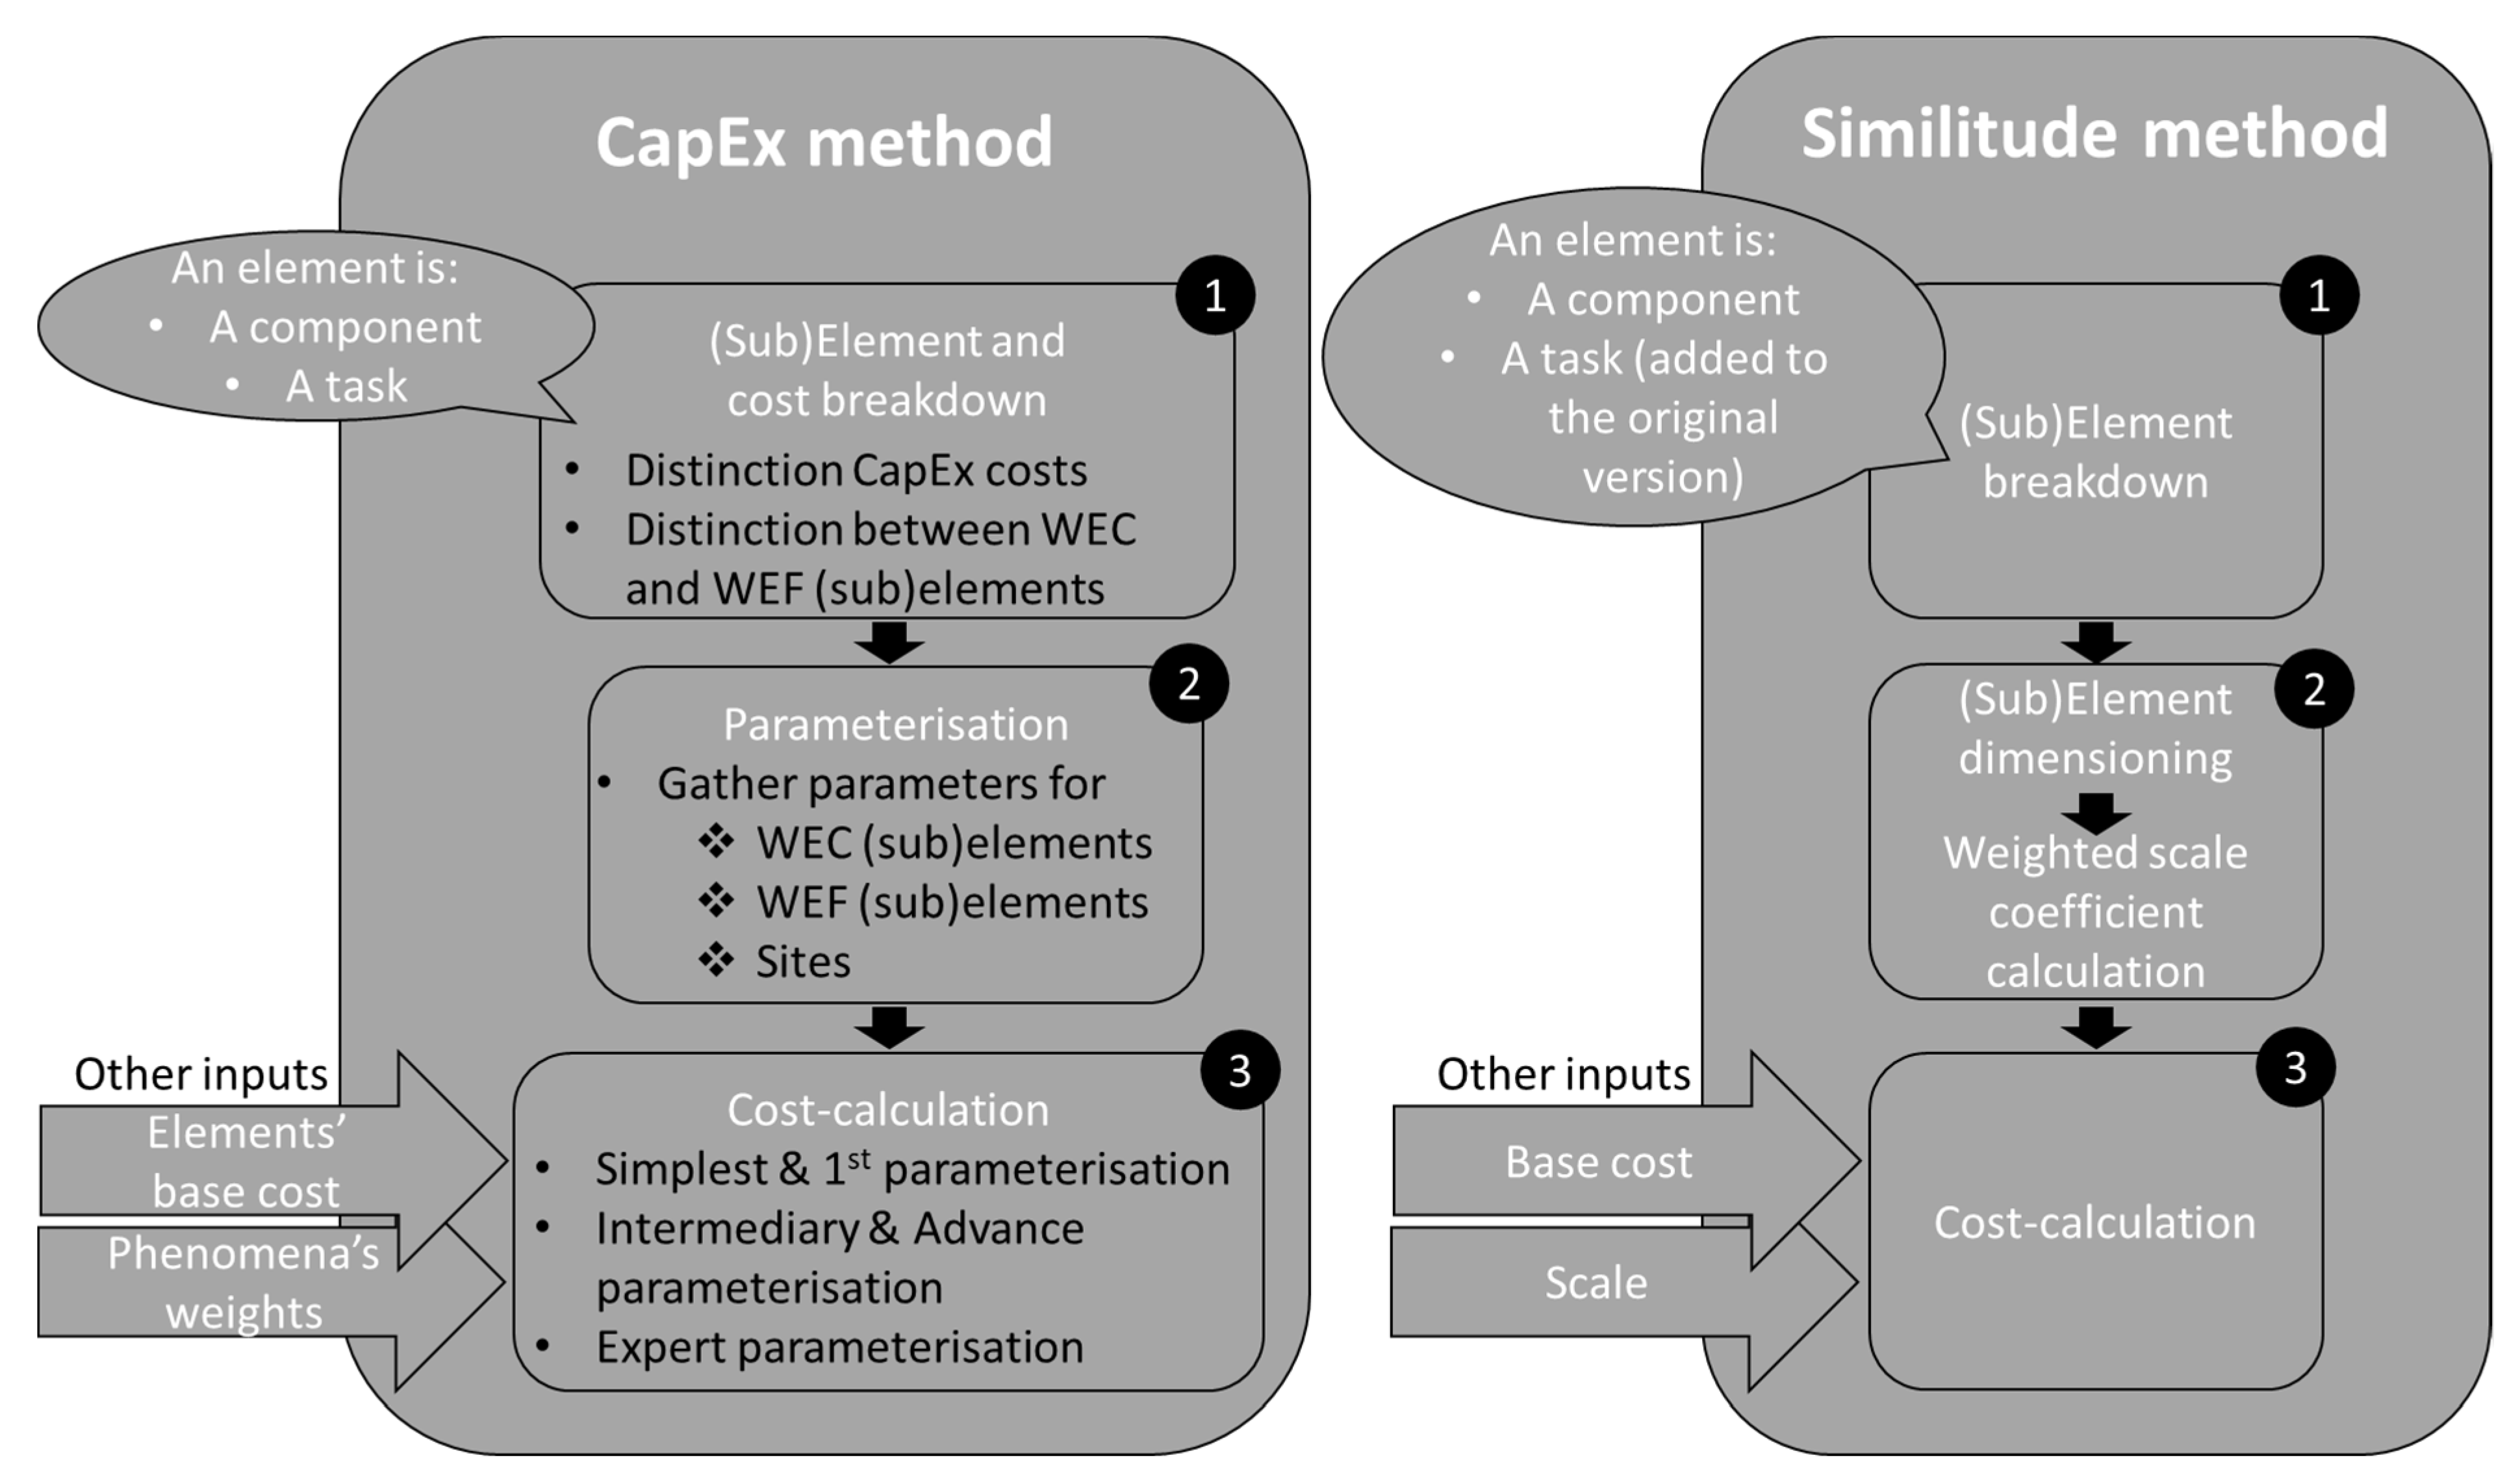
Figure 1. CapEx and Similitude method flow-chart.
Energies 14 00902 g001
Figure 2. Wavepiston visual description.
Energies 14 00902 g002
Figure 3. Collector artistic representation.
Energies 14 00902 g003
Figure 4. Wavepiston WEC main pieces and components (white cells) and tasks (dark cells) gathering tasks.
Energies 14 00902 g004
Figure 5. Sites’ location and class with reference to Table 3.
Energies 14 00902 g005
Figure 6. Boxplot that shows the spread of the WEC cost (in €) over the site water depth (see Table 3) clustered per similar configuration of Wavepiston of the other Wavepiston WEC configuration parameters (see Table 2 and Table 3 for parameter definition and values), the grey sections for the elliptical plates.
Energies 14 00902 g006
Figure 7. Wavepiston WEC cost (in €) using the Similitude method over the plate width for the “Sub-element only” and “Element function” weighted scale coefficient results from the CapEx method for the three values of number of plates from the dataset.
Energies 14 00902 g007
Table 1. Scale parameter of the Froude law similarity adapted from [65,86].
Function DimensionScale Parameter
Acceleration0
Area2
Force3
Length1
Mass/Volume3
Power3.5
Pressure1
Dimensionless quantity (such as efficiency)0
Volume flow rate2.5
Table 2. Distribution of the wamit water depth, h, for the Wavepiston WEC configuration parameters. When a configuration assesses all h, the cell number is “4”; otherwise, the underlined numbers show the exact h value(s).
Plate Shape (ps)EllipseRectangle
Number of Plates (Np)18241824
Plate Width (pw, in m) Plate Location
Configuration
(plc,
in m)
0710.514710.51401613.5710.514710.514
Plate Depth
(pd, in m)
11 −1 & 20
22 −1 & 202020
31.5 −1 & 20
33−1 4 20444444
44 4 20444444
4.52 −1 & 20
55 4 20444444
62.5 −1 & 20
66 4 444444
6.76.74444444
94 4 444444
Table 3. External parameters relationship of the sites.
Class of Combination of Site ParametersBuoy/Hindcast
Water Depth
(s, in m)
Site Water Depth
(d, in m)
Wamit Water Depth
(h, in m)
Distance from the Site to Shore
(q, in m)
AIf s ≥ 200 m100−11700
BElse if s ≥ 75 m80−11700
CElse if s ≥ 40 m50504250
DElse if s ≥ 25 m30304250
EElse s < 25 m20204250
Table 4. Collector’s sub-elements’ base cost and factor.
Sub-Element Name and VariableSub-Element VariableBase Cost (in €)Total Factor NameFactor WeightFactor ParameterComments
PlatePlTotal cost400Plate total factor60 €/m2paThis factor translates the quantity of material to add to the plate
PumpPuTotal cost100Pump total factor60 €/mpwThis factor is associated with the scaling of the pipe to engorge more or less flow
Other piecesCOPTotal cost100Other pieces total factor20 €/mpwThis factor expresses increase of the other pieces for more energy extraction in relation to the plate width
BeamBeTotal cost400Beam total factor30 €/mpwThis factor is associated to the material required per extra meter of plate
Table 5. String’s sub-elements’ base cost and factor.
Total Factor NameTotal Factor VariableNumber of FactorsFactor NameFactor VariableFactor WeightFactor ParameterComments
String wire total factorSWTotal factor2String wire factor 1SWFactor 1400 €NpThis factor expresses the cost impact of the sockets and start-up of the wire production
String wire factor 2SWFactor 2300 €NpThis factor translates the cost impact of fishplates and specific non-standard shackles
String pipe total factorSPTotal factor1String pipe factorSPFactor20 €NpAn additional base cost of 20 € is added to the base cost per meter for the end caps
Table 6. Functionality-related dimension of Wavepiston WEC elements and sub-elements (organised as in Figure 4) following de Andres et al. [50].
Wavepiston WEC ElementsFunction DimensionCollector Sub-ElementsFunction DimensionString Sub-ElementFunction DimensionMooring Sub-ElementsFunction Dimension
CollectorForcePlateAreaPipe and valvesVolume flow rateWire ropeForce
StringForcePumpPressureShackles and connectorsForceChainForce
Other piecesForceBeamForceWire ropeForceShacklesForce
TasksMass/VolumeWagonAccelerationBuoysForceAnchorForce
Pipe and valvesVolume flow rateOther piecesForce
Other piecesAreaMonitoring and controlPower
TasksMass/VolumeMooringsForce
TasksMass/Volume
Table 7. Weighted scale factors.
Weighted Scale Coefficient
Calculation Approach Index
Weighted Scale Coefficient
Calculation Approach
Weighted Scale
Coefficient Value
1Average over elements and sub-elements2.674
2Average over all the sub-elements2.625
3Average of the sub-elements’ averages2.866
4Average over the elements3
Table 8. Collector cost—Equation (6)—and their total factors for the combination of the relevant parameters. The darkest red cell is the highest value per column, and the darkest blue reflects the lowest one.
Plate Shape
(ps, in --)
Plate Width
(pw, in m)
Plate Depth
(pd, in m)
Plate Area
(pa, in m2)
Collector Total Cost
(in €)
Plate Total Factor
(in €)
Pump Total Factor
(in €)
Beam Total Factor
(in €)
Other Pieces Total Factor
(in €)
rectangle111237060603020
rectangle22426602401206040
rectangle31.54.528002701809060
ellipse337.0729544241809060
rectangle33930705401809060
rectangle4.529323554027013590
rectangle4416360096024012080
rectangle62.5153760900360180120
rectangle552542501500300150100
rectangle663650202160360180120
ellipse6.76.735.2650522115402201134
rectangle943653502160540270180
Table 9. String cost—Equation (8)—and their total factors obtained for the relevant parameters. The darkest red cell is the highest value per column, and the darkest blue reflects the lowest one.
Number of Plates
(Np, in --)
Distance between Plates
(plc, in m)
String Total Cost (in €)String Pipe Total Factor
(in €)
String Wire Factor 1
(in €)
String Wire Factor 2
(in €)
1018,71725400300
8725,47220032002400
810.526,64820032002400
813.527,65620032002400
81427,82420032002400
81628,49620032002400
24741,77660096007200
2410.545,30460096007200
241448,83260096007200
Table 10. Mooring cost—Equation (12)—in function of the relevant parameters. The darkest red cell is the highest value of the entire table, and the darkest blue reflects the lowest one.
Wamit Water Depth
(h, in m)
Mooring Total Cost (in €) Per
Site Water Depth (d, in m)
d = 100d = 80d = 50d = 30d = 20
h ≥ 10055,80055,240------
50----54,400----
30------53,840--
20--------53,560
Table 11. 1-plate-based Wavepiston WEC cost (in €) using the Similitude method over the plate width. The darkest red cell is the highest value of the entire table, and the darkest blue reflects the lowest one.
Plate Width
(pw, in m)
Weighted Scale Coefficient
Sub-Elements
Only
2.625
Elements and
Sub-Elements
2.674
Elements Averaged
2.866
Elements Function
3
2416,792431,191492,569540,512
31,208,2551,275,0801,574,5081,824,228
42,571,1232,751,8443,591,0324,324,096
4.53,502,6623,770,5585,032,9486,156,770
54,618,6134,997,5966,807,1208,445,500
67,453,5378,137,51511,478,80914,593,824
79,957,76110,930,48415,748,73720,320,751
921,607,37224,063,55736,692,25349,254,156
Table 12. Wavepiston WEC cost (in €) using the Similitude method over the string length. The darkest red cell is the highest value of the entire table, and the darkest blue reflects the lowest one.
Plate-Location Configuration (plc, in m)Number of Plates
(Np, in --)
Weighted Scale Coefficient
Sub-Elements Only
2.625
Elements Function
3
784,985,523,57222,556,997,120
10.5814,452,744,62876,129,865,280
13.5827,954,682,319161,803,707,840
14830,754,913,691180,455,976,960
16843,665,996,277269,368,688,640
72489,156,716,886609,038,922,240
10.524258,460,168,2062,055,506,362,560
1424549,993,815,7574,872,311,377,920
Publisher’s Note: MDPI stays neutral with regard to jurisdictional claims in published maps and institutional affiliations.