1. Introduction
Ever since society has called for a more sustainable life, renewable energy has been hailed as a reliable alternative to traditional energy and as a key to designing paths for achieving the goals of the Paris Agreement, for creating a circular economy and for playing its part in the energy revolution. The shift to renewables triggers a repositioning in terms of infrastructure (industrial and residential), technology, production processes, policies, and strategies.
At the macroeconomic level, the idea of performance assessment refers to verifying the extent to which a country carries out its activities to meet targets set at the national, regional or global level. In the field of energy, the performance study involves finding dimensions that contribute to optimizing key elements, such as energy consumption from renewable sources, energy efficiency, less polluting transport, energy security, and infrastructure needed to support the transition to a new energy era.
Developing a performance assessment framework in the bioenergy field is a challenge, a process which, once completed, can provide a tool with multiple uses. Such a tool is capable of revealing a transparent view of the bioenergy field performance and of facilitating comparisons among countries. At the same time, it may offer relevant information on the current status of development in this field and keep track of changes in the performance level in time.
The present paper is structured as follows: first, a conclusive review of the relevant literature is conducted, revealing contributions in the bioenergy field from an international perspective. Second, a well-developed methodological section explains the modelling assumptions for creating the performance assessment framework. The contributions made by this paper are discussed in the results section, while both policy implications and further research directions are provided in the conclusion.
2. Literature Review
Studies on performance evaluation at national level can be revealed for health systems where the concept is understood and treated in terms of five dimensions: quality, efficiency, access, sustainability, and equity [
1], or in terms of only three components: effectiveness, equity, and efficiency [
2]. Moreover, other research efforts provide indexes designed for influencing stakeholders’ decisions in a specific field. For instance, the Environmental Performance Index (EPI) is a biannually issued index of researchers from Yale University, which “ranks countries’ performance on high-priority environmental issues in two areas: protection of human health and protection of ecosystems” [
3]. Also, as an example, the Aggregated Energy Security Performance Indicator (AESPI) is used to describe Thailand’s energy security status. It is calculated using 25 indicators on three dimensions (economic, social, and environmental), and among them, only two indicators are characteristic to renewable energy [
4]. The World Energy Council has developed an indicator called the Energy Trilemma Index to study performance at the national level, taking into account three dimensions [
5]: energy security, energy sustainability, and energy equity, each with a 30% weighting in the overall score, while the remaining 10% is added from three other elements: macroeconomic stability, a favorable environment for investment and innovation, and last but not least, governance.
In order to describe the methodology of our paper, it is important to highlight papers that describe the high impact of bioenergy in the world. Bioenergy is a way to reduce the amount of carbon dioxide emitted as a result of economic activities carried out in each country and is closely linked to innovation in technology. Based on the process of technological development, bioenergy has come to play an important role in increasing energy security, developing rural communities, and increasing household incomes [
6], which ultimately culminates in reducing emissions from electricity production [
7]. At the base of bioenergy are various types of energy that come from the conversion of natural, biological sources available on a renewable basis [
8]. From this point of view, bioenergy brings into question traditions specific to the agricultural sector and offers solutions on waste management, elements with an impact on the efficiency of bioenergy production and use [
9].
Besides natural, biological sources, bioenergy is also obtained from the conversion of waste to valuable energetic products, such as refuse-derived fuel or RDF obtained through the pyrolysis and gasification of municipal solid waste [
10]. Bioenergy production has evolved from wood burning to hydrogen production through modern conversion processes, such as thermo-catalytic conversion of glycerol (a by-product resulted from biodiesel production) [
11] or CO catalytic conversion of tar rich synthesis gas (resulted in a biomass gasification plant) [
12].
At the EU level, attention has been focused on bioenergy for a decade now. The Directive 2009/28/EC put forth the objectives regarding the direction of the European Union towards environmental protection, establishing the achievement of renewable energy for each member of a share of 20% of the total energy consumption until 2020 and a share of 10% that biofuels should have in the consumption of gasoline and diesel in transports until 2020 [
13]. Given the environmental problems that have felt their effects from one year to another, in 2016, the European Commission updated directives from 2009, establishing the achievement of a share of renewable energy of over 27% of total energy consumption by 2030, along with new criteria on sustainability [
14].
Moreover, the environmental challenges we face are not the only elements that put pressure on our way of life. The growth of the planet’s population, the growing demand for raw materials, natural resources, and food are also factors with a strong impact on all mankind. Karmenu et al. [
15] emphasize that renewable resources are consumed twice as fast as the capacity of ecosystems to recover. In order to meet all the challenges, the existing linear production model at the level of EU member states must be replaced with a new, circular model, to deal with the three dimensions of sustainable development: environmental protection, sustainable economy, and efficiency. The convergence element of these dimensions is renewable energy and the recycling of all materials, elements closely related to bioenergy [
16]. In this transition from the linear economy to the circular economy, the bioenergy sector will develop accordingly; this will be produced from the combination of the residual biomass with the waste resulting from human activities [
7,
17]. In other words, the circular economy will allow, at the level of the European Union, the provision of resources for the production of bioenergy, an element with added value whose impact makes all these measures respond to the environmental challenges that the world is currently facing [
18,
19].
Taking into account all these elements, as many authors explain [
14,
20,
21], European countries have begun to transcribe directives through their own programs, supplementing bioenergy production and moving towards renewable energy to meet both environmental and energy demand challenges. In this case, as the importance of bioenergy is growing, at the level of the European Union, in 2016, bioenergy represented over 59% of renewable energy sources used for final gross energy consumption [
22]. In order to supply electricity to the entire population, a significant amount of greenhouse gases are produced, the effect of which is significant in increasing the concentration of pollutants in the atmosphere [
23]. In this sense, more and more countries and international bodies are trying to use technologies and alternative energy sources that lead to reducing emissions, and thus to reducing pollution, factors that along with revitalizing rural areas and improving energy security make energy systems bioenergy to be in the public eye for decades to come. Bioenergy has three characteristics that favor the decision regarding its use [
24]:
In the last 10 years, in order to measure and evaluate the environmental performance of different types of renewable energies, the Life Cycle Assessment (LCA) method has been used [
29,
30,
31,
32,
33]. Some research has confirmed that the benefits associated with bioenergy such as reducing greenhouse gas emissions or ensuring energy needs have materialized, and these things have been captured by researchers over several periods [
34,
35,
36]. In recent years, the LCA method has been used to determine and evaluate on the one hand how climate change is mitigated, and on the other hand what is the volume of fossil fuel savings when wood-based electricity replaces electricity produced with the help of fossil fuels [
32,
37].
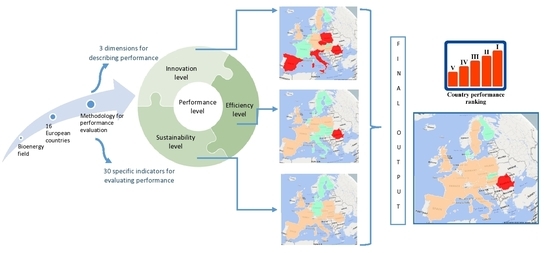
This paper extends the analysis of bioenergy efficiency, achieving a multidimensional analysis of bioenergy performance seen through three dimensions: innovation, efficiency, and sustainability.
3. Methodology
The performance assessment in a specific field is a process described by a particular feature: multidimensionality related to the components included in the analysis framework. In general, these components reflect various economic, social, and environmental aspects, have diverse measurement units and are interpreted using different criteria and scales. As such, assessing the performance by using a set of data as described above may be difficult if not following some generally valid rules. Many studies follow the steps developed by The Organisation for Economic Co-operation and Development (OECD) in 2008.
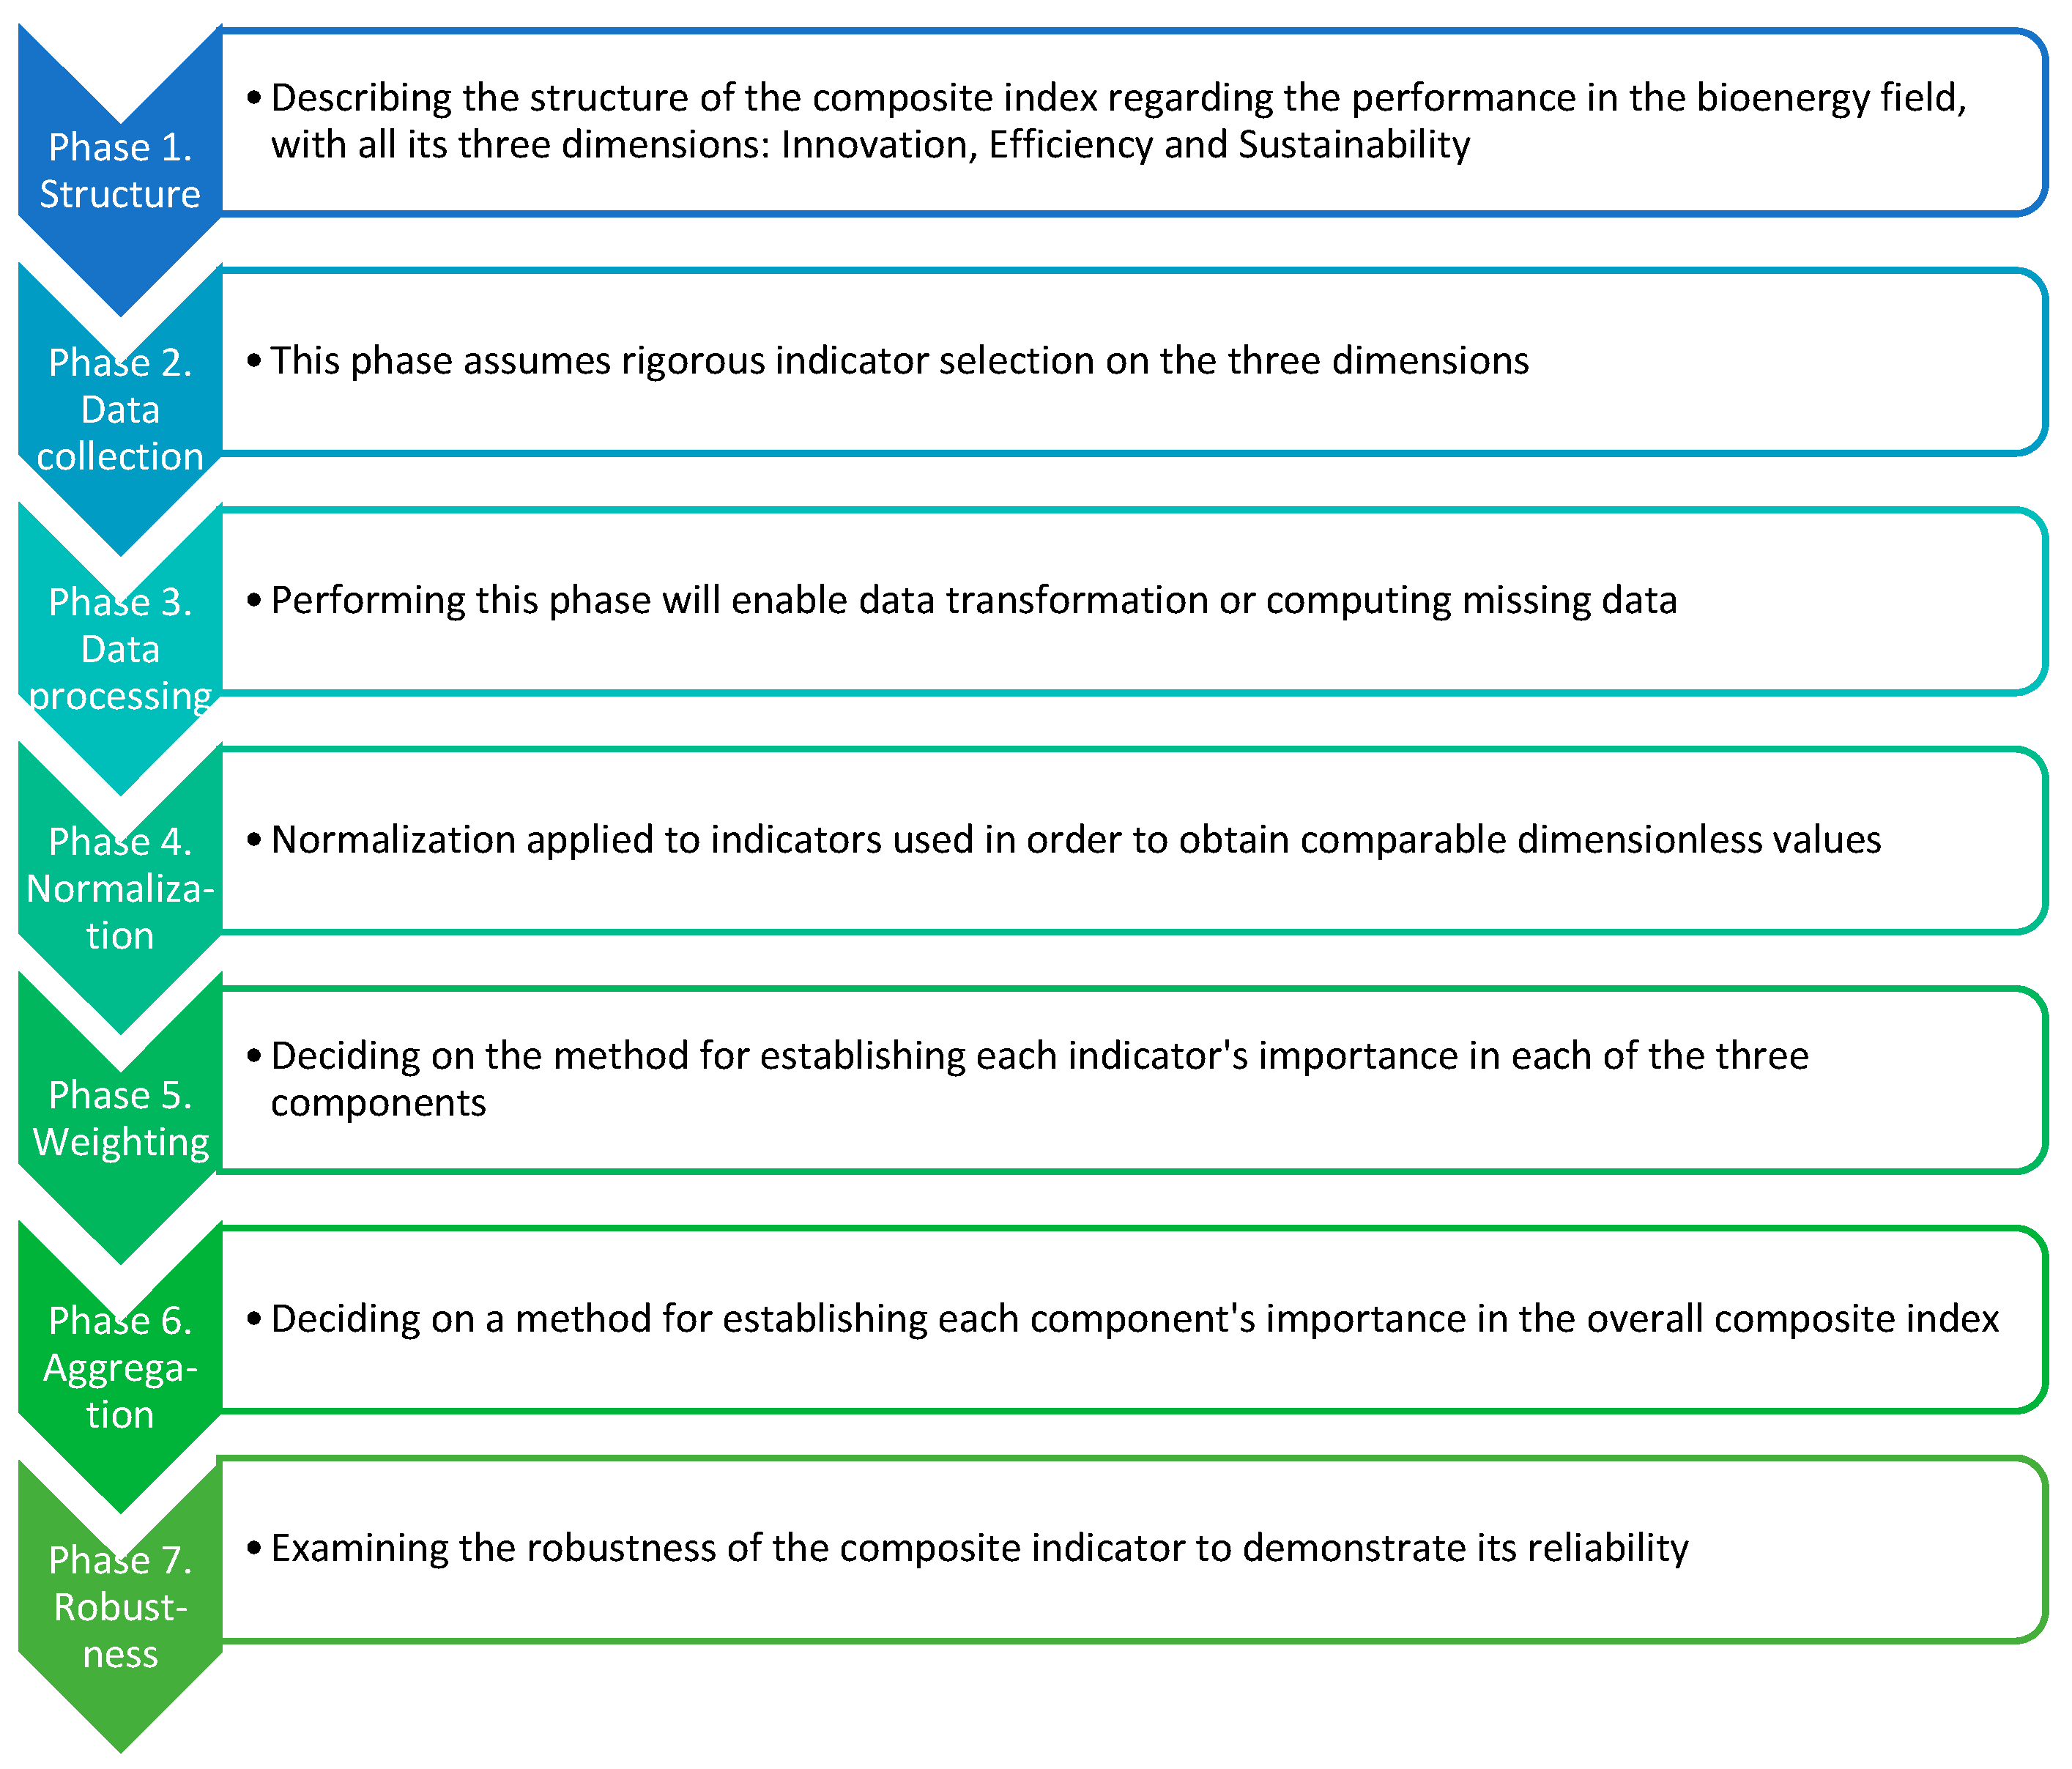
The present research methodology includes the following steps, in accordance with the newest approaches in the renewable energy field and index construction methodology [
38,
39,
40,
41], as shown in
Figure 1.
To our knowledge, there are few indexes designed for performance in the renewable energy field, such as the Environmental Performance Index (EPI) [
3], the Aggregated Energy Security Performance Indicator (AESPI) [
4], Renewable Energy Responsible Investment Index (RERII) [
40], and Renewable Energy Country Attractiveness Index (RECAI) [
42], but none directly related to bioenergy performance. We were able to find the Nexus index [
43], which deals with the efficiency of biofuels production from a specific crop and Renewable Energy Sustainability Index [
44] which reveals the sustainability level achieved by countries in the renewable energy field. However, the performance concept, as we defined it in the previous section of the paper, is more complex, including efficiency, and sustainability as components. Thus, the novelty of this research lies in the construction of the performance assessment framework through seven phases, as presented in
Figure 1, and in obtaining, in the end, a new analytical tool: The Performance Index in the bioenergy field.
3.1. Structure of the Performance Assessment Framework
Given the description of the performance concept detailed in the previous section, the first step was to decide on the dimensions that will design the performance index.
The first chosen dimension is innovation, which has a major role in bioenergy field development, as shown in recent research of the literature [
45,
46]. Innovation is essential for at least two main reasons: (1) it is vital for the process of obtaining bioenergy, as the conversion of biomass into biofuels requires high-performance and cost-effective technologies; (2) it has great implications in the distribution and supply of electricity and heat from biomass processing.
The second dimension to be considered is efficiency, given its undoubted role in the economic and social environment in guiding projects contributing to the fulfillment of sustainable development objectives and to reaching targets in specific priority areas of national economies.
The third dimension is sustainability, and it was chosen considering it facilitates capturing a country’s capacity (through production and share in consumption) of succeeding in the transition to a new energetic era, governed by avoided or diminished negative effects of pollution (namely emissions) on the environment.
Thus, given the above, performance in the field of bioenergy will be studied through three components: innovation, efficiency, and sustainability.
3.2. Data Collection
The second step refers to selecting indicators that best reflect its components and that are, at the same time, economically, socially, and environmentally relevant. For each component (innovation, efficiency, and sustainability) a set of 10 indicators was formed, based on relevance supported by recent research. The indicators regarding innovation were retrieved mainly from EurObserv’ER online database [
47], as it provides an Innovation and Competitiveness section of indicators. The efficiency, and sustainability dimensions were created having as examples similar research works in the energy field [
3,
4,
5,
44].
Table 1 shows the three sets of indicators, together with measurement units, the sources of the data and the year for which they are reported. Most of the data show values of indicators for 2015, apart from indicators 1.1–1.7, for which the last reported data were at the level of 2014. Also, indicator 3.4, on the evolution of greenhouse gas emissions, presents a comparison between the level of 2017 and that of 1990.
3.3. Data Processing
This step involves the imputation of missing data and our own calculations for obtaining needed indicators. Non available data were reported for Romania and Slovenia for indicator 1.6 and for Slovenia and Slovakia for indicator 1.7, as well as for Italy in the case of indicator 2.1 and for Romania and for Finland in the case of indicator 2.3. Non available data were assigned zero values. Moreover, some indicators are the result of our own calculations based on selected time series (the case of 2.5 and 2.6 indicators for “efficiency” component and 3.3, 3.8–3.10 indicators for “sustainability” component).
3.4. Normalization
As shown in Talukder et al. [
41], a variety of normalization techniques are available in the literature, and among them one of the most widely known is min-max normalization. The popularity of the technique made possible the construction of Human Development Index. It has the advantage of rescaling all values of indicators in the [0, 1] range, using zero as a minimum (for the worst reported level of an indicator) and 1 as a maximum (for the best reported level of an indicator). It also takes into account the criteria followed for an indicator. For instance, for almost all indicators, the highest level is reflected by the highest value. However, for 2.6 Bioenergy intensity, the situation is the opposite. As an indicator, it expresses the bioenergy consumption for a unit of GDP per capita, or the cost of converting bioenergy to GDP. So, lower values will be rescaled closer to one, while higher values will be closer to zero. The same happens for indicators 2.7 Share of bioenergy imports in gross inland consumption, 3.4 GHG emissions evolution, and 3.6. Emissions generated through bioenergy consumption.
Given the above explanations, to clarify how normalized values are attributed, the following example appears, for indicator 1.1 Number of patent families. The highest value is registered for Germany, so this country receives 1 as a normalized value, while the lowest value is recorded for Austria, which means it gets 0 as a normalized value. All other normalized values are calculated by using the formula:
where
na = normalized value;
ax = the value for a country;
ai = all values; min(
ai) = the minimum value among all 16 values; max(
ai) = the maximum value among all 16 values.
The above formula is valid for indicators for which lower values are scaled closer to zero. A second formula was used for indicators for which higher values were rescaled closer to zero (the case discussed above for bioenergy intensity and the other three indicators):
3.5. Weighting
In this phase, all normalized values receive a coefficient of importance, which reveals each indicator’s contribution to the overall score of innovation, of efficiency, and of sustainability. Among different type of weighting techniques [
56], equal weighting was chosen in this study for simplicity and transparency. So, each indicator accounts for 10% in the level of a component. All resulted values range between 0 and 1 as a consequence of using max-min normalized data.
After establishing a final score (of innovation, efficiency, and sustainability) for a country, a color was assigned to the score, according to the described level fitting one of the five ranges.
3.6. Aggregation
To carry out aggregation, a closer look to the values of the components is needed. All three levels obtained in the previous step have positive values, so they are suitable for geometric mean aggregation.
So, the performance level is obtained by applying the following formula:
The product of the three dimensions (innovation, efficiency, and sustainability) gathering normalized weighted indicators can take into account the achievement across dimensions. In this way, a low level in one of the three dimensions will be reflected in the overall score of performance and will not be compensated with a suitable surplus in any other dimension [
41,
56].
3.7. Robustness
The necessity of examining the robustness or the reliability of the new obtained index for performance in the bioenergy field lies in the number and diversity of modelling assumptions used. According to Saisana and Norlen [
57], the modelling assumptions are subject to this last phase, so creating the scenarios to test and validate the new index should focus on them: (1) setting up the structure of the analysis framework; (2) choosing the indicators to create the three dimensions; (3) deciding how to impute missing data (4) choosing the normalization technique; (5) deciding on the weights of each indicator; and (6) deciding on how to carry out the aggregation. Within this paper we consider three scenarios to assess rank robustness. This assessment is similar to a sensitivity analysis, as it creates scenarios where a modelling assumption changes while the other remain the same and then it reveals changes or shifts in the overall performance index. The first scenario assumes that the framework does not contain the indicators for which missing data were imputed by us. The second scenario presumes the arithmetic mean for aggregation instead of geometric mean. The third scenario refers also to the indicators, removing from the framework only those indicators which have the overall group normalized values higher than the mean. Also, a fourth scenario was proposed as an alternative (changing the max-min normalization technique with proportionate normalization or with Z-score normalization). Both new methods provided negative values, so the [0, 1] range for the index would be impossible to obtain. In the end, the fourth scenario was abandoned.
The robustness assessment implies recalculating the performance index under the new created scenarios and revealing changes in the performance ranking according to the new obtained values. The changes or shifts are either positive (when the performance index has a new higher value within a scenario as compared to the initial situation determining a country to occupy an upper position in the ranking), or negative (when a country registers a lower performance index within a scenario as compared to the initial case and in accordance, it occupies a lower position in the ranking).
4. Results and Discussion
The following tables include real and normalized values for each indicator and country, and the overall group normalized value for each indicator and the scores obtained after weighting the normalized values for each of the three dimensions. The associated colors are also suggestive, visually facilitating the framing on a recorded level of a certain range (in accordance with
Table 2 color coding). In none of the three conducted analyses, was found a score indicating a very high level for a specific dimension. As can be seen, most countries recorded values that allowed them to fall into the category of low or medium results.
Based on the information from the
Table 3 and
Figure 2, one can see that from the innovation point of view all analyzed countries score in the bottom part (very low, low, average) of the range. Looking closer to
Figure 2, one can observe that countries separate themselves in three categories: northern and western European countries are situated at a low level regarding innovation in the bioenergy field, central European countries are situated at an average level and eastern and southern European countries are situated at a very low level regarding innovation in the bioenergy field.
The main reasons that can describe this situation are the following:
lack of sustained investments in the research field regarding bioenergy, private and public investments.
low number of patents, indicator which can be closely related to lack of resources to understand and to study the bioenergy activity sector.
These particular reasons are also supported by the low values recorded in the overall normalized values for the group of countries. The cumulative amount has a maximum of 16 points, given by the maximum of 1 (as normalized value) that can be reached by each of the 16 studied countries. From all ten indicators composing the innovation dimension, only two managed to get closer to the mean, slightly reaching 7.193 (indicator 1.9) and 7.706 (indicator 1.10) as overall normalized values for the group of countries.
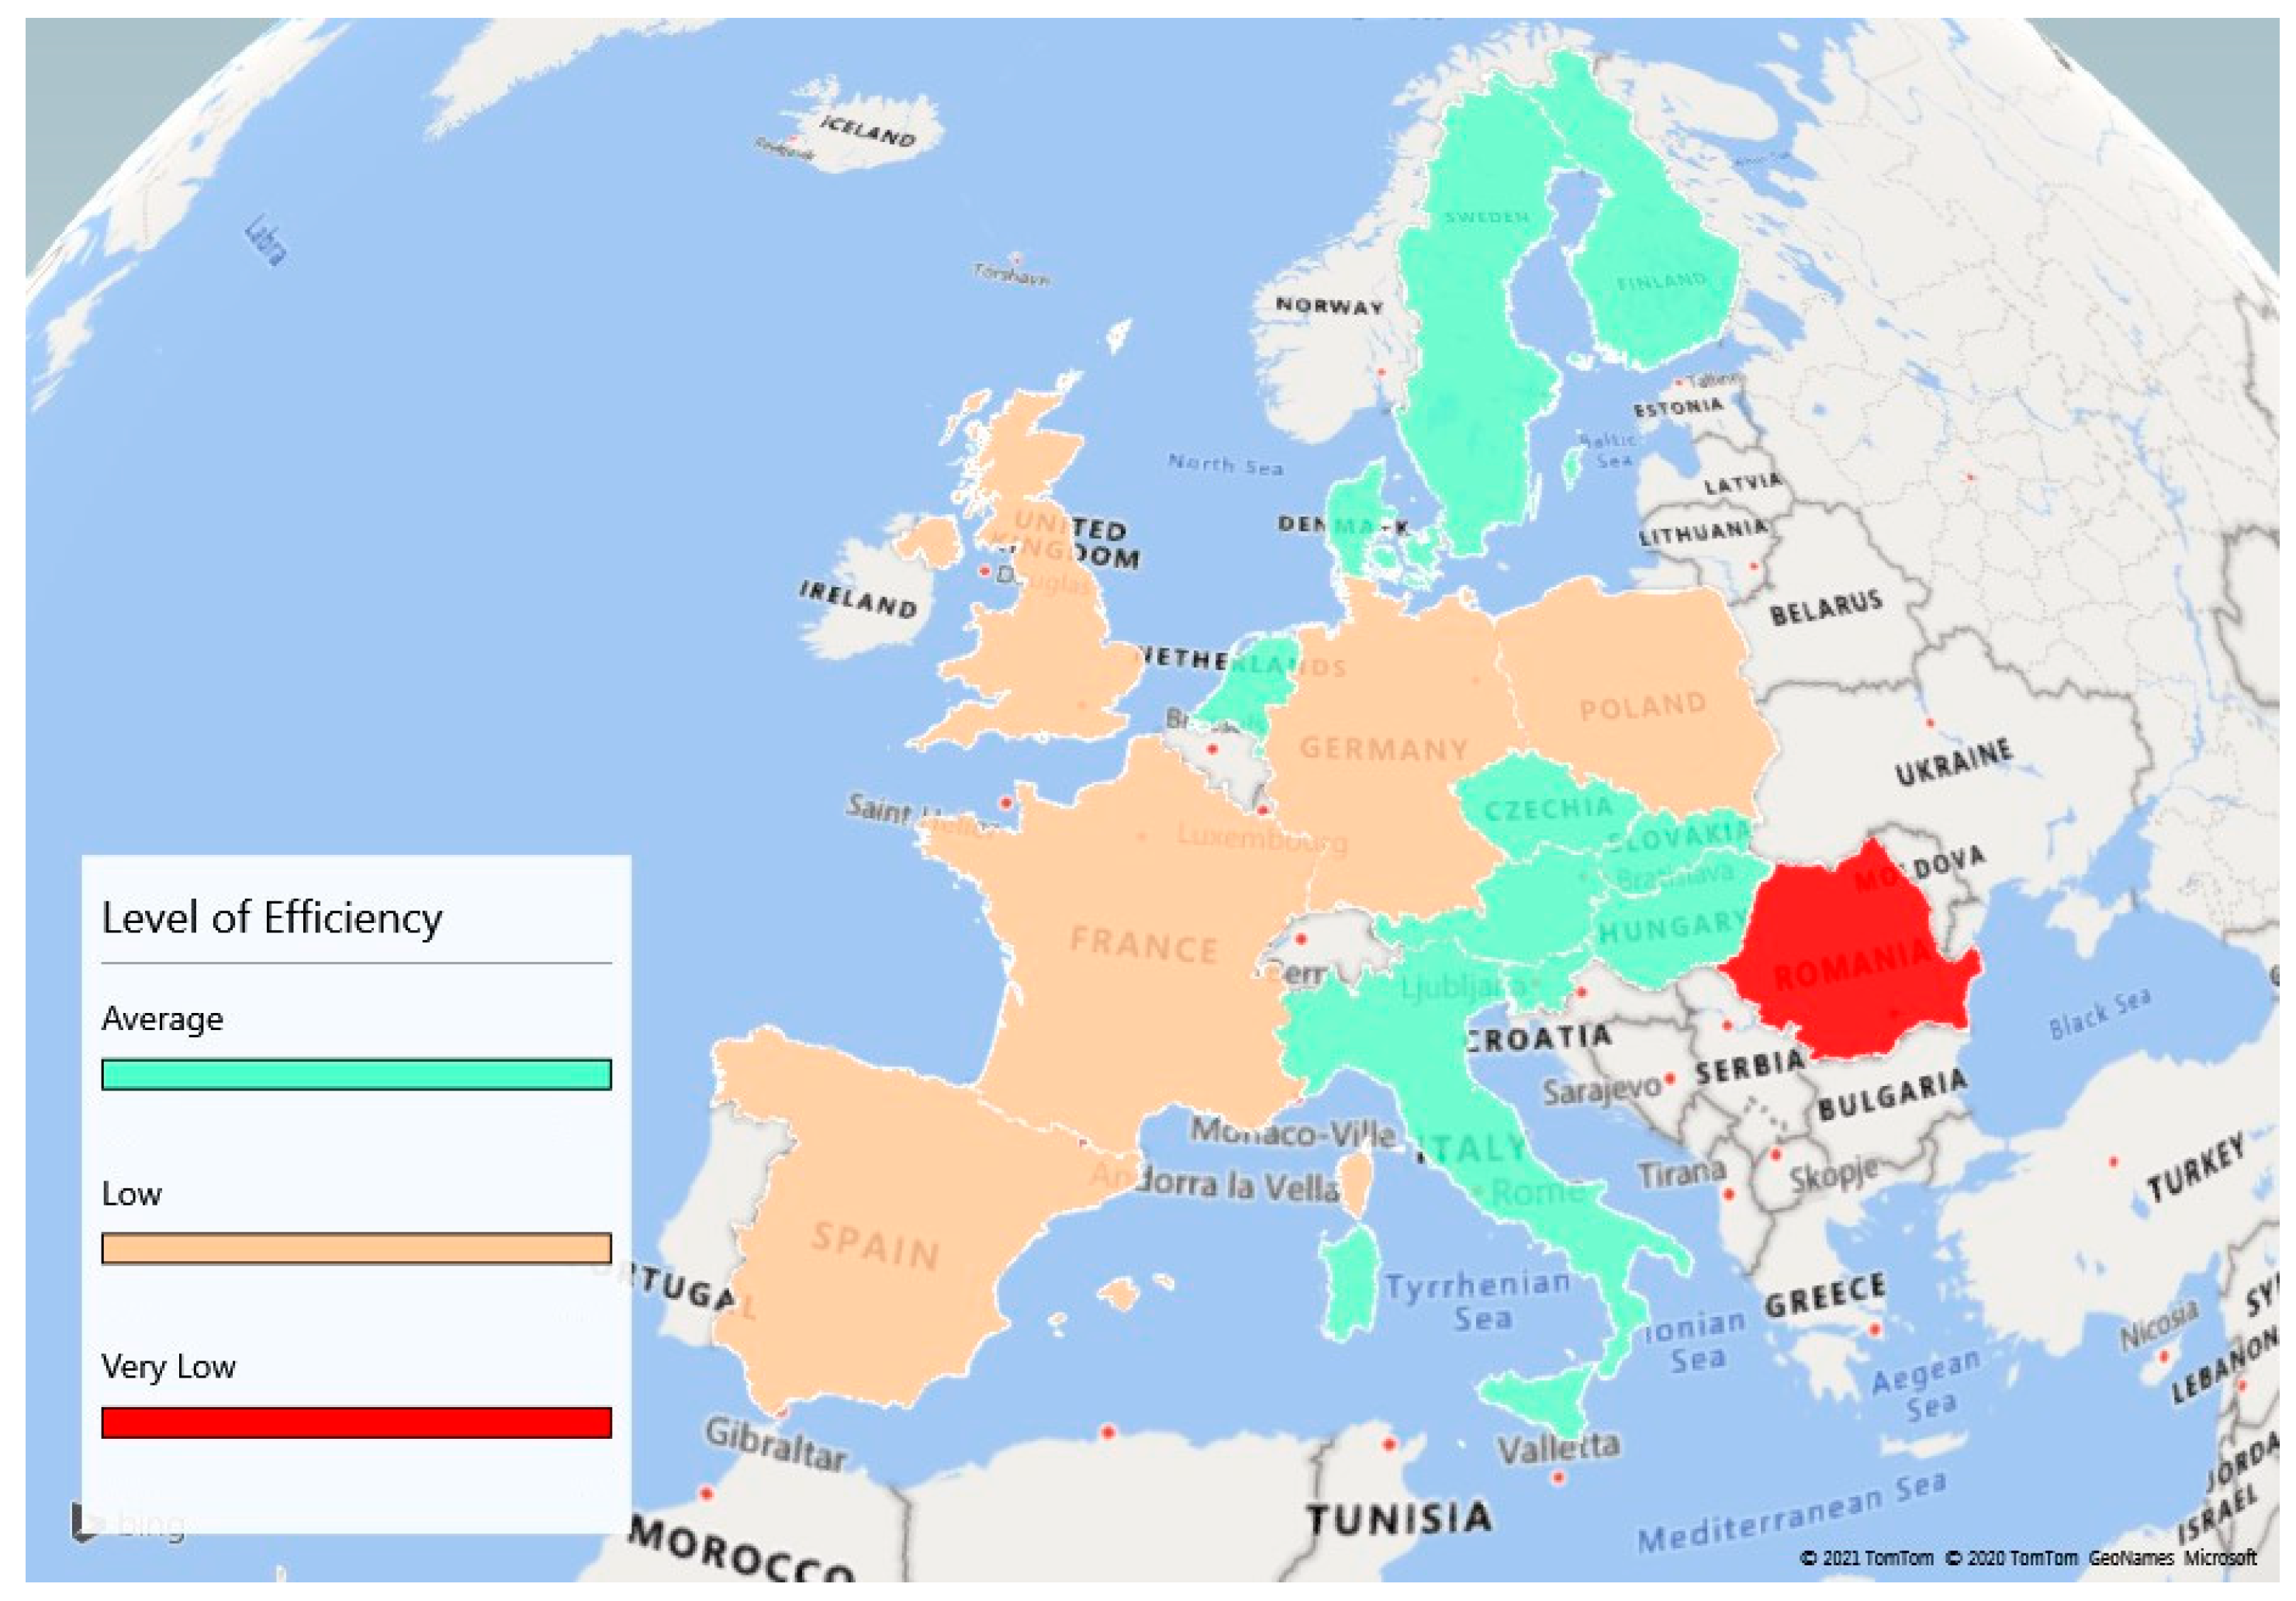
Moving on to the second dimension, Efficiency, it is widely known that it represents the ability to achieve a desired level of performance by using the least number of inputs in order to obtain the highest amount of output [
58]. Based on information given in
Table 4, we managed to create a map revealing the distribution of countries according to their efficiency level in
Figure 3.
The results show that the weakest score value of 0.166 belongs to Romania. Northern and southern countries register an average level of efficiency in the bioenergy field, while countries situated partially in Central and Western Europe register a low level of efficiency in the bioenergy field. The situation can be attributed to the following reasons:
For several countries, the data show a lack of flexibility regarding the system utilization.
The turnover in the biofuel field is situated at a low competitive level, with implications for other areas.
However, the overall normalized values calculated in
Table 4 show that for indicator 2.6 Bioenergy intensity, the group of countries reaches a 10.333 out of 16. This indicates that the majority of countries deals with the cost of converting bioenergy in GDP.
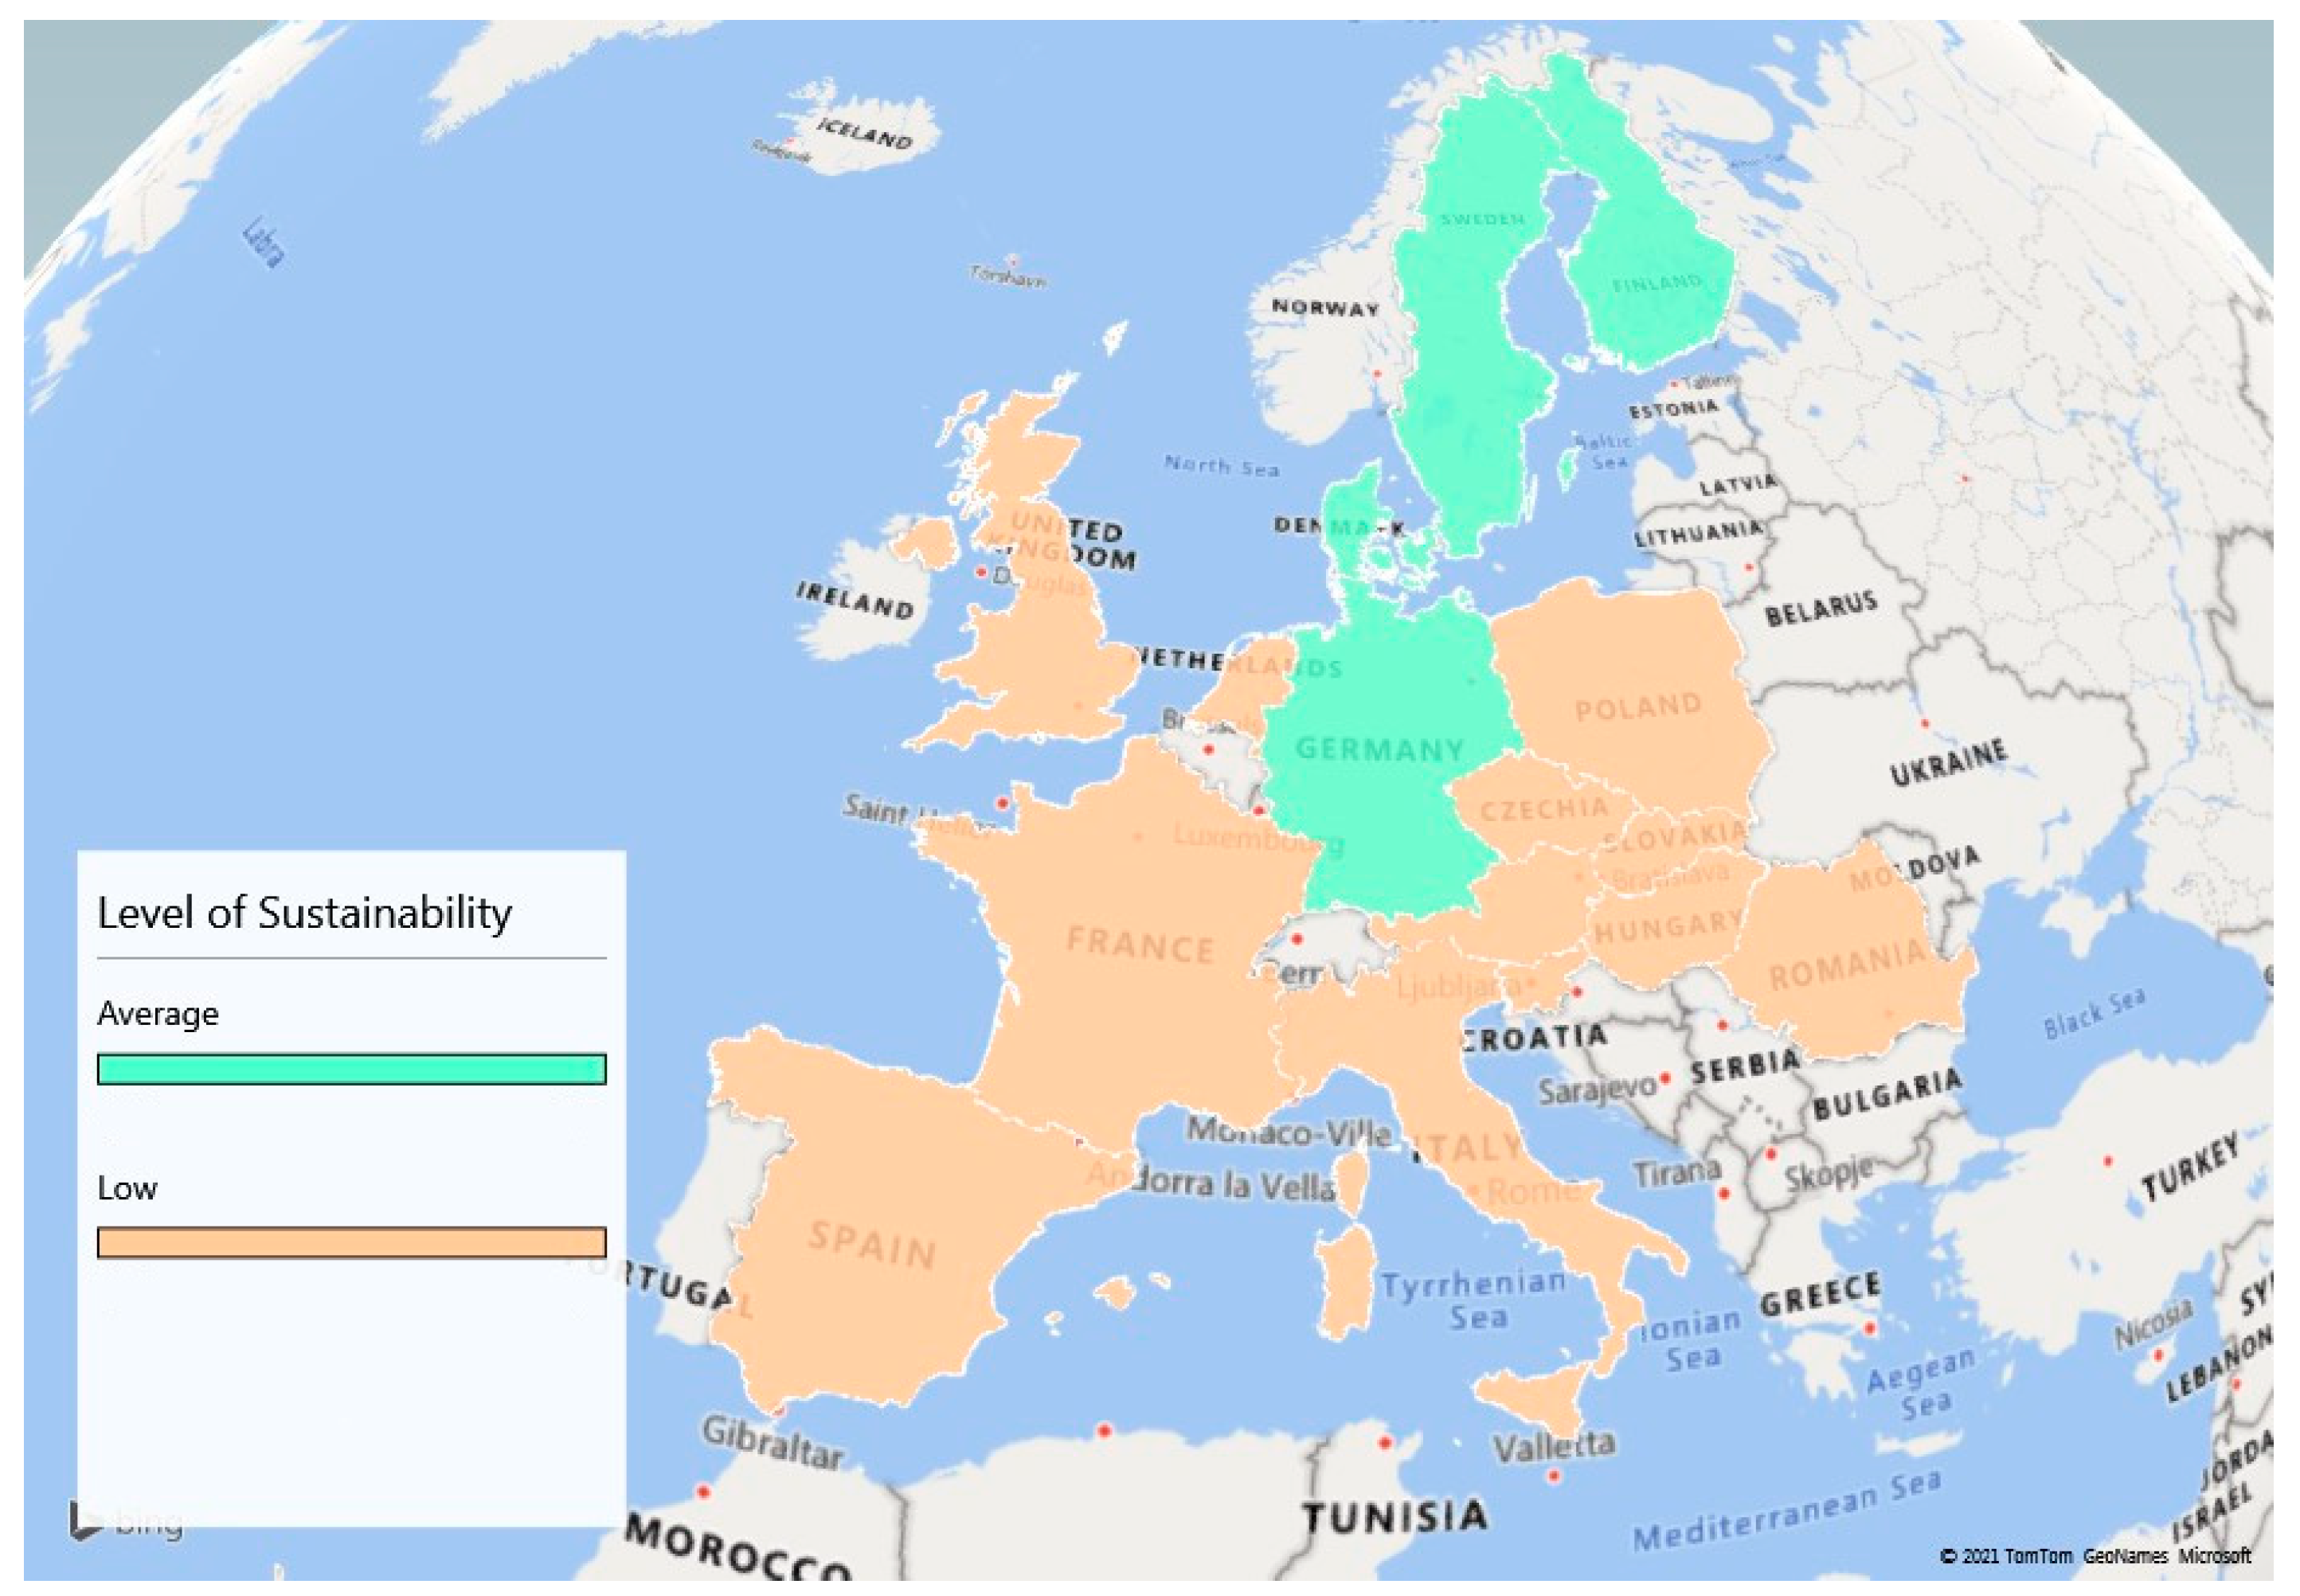
As
Figure 4 shows, countries from northern Europe have a high level of sustainability in the bioenergy field, above average, while red represented countries have a low level of sustainability in the bioenergy field, with the mention that values are not very different from one country to another, as reported in
Table 5.
An important point that involves sustainability is regarding avoided emissions through bioenergy consumption, with many countries having difficulties in obtaining a higher score for this indicator. Technologies for obtaining greener biofuels are yet to be developed, and where possible, the use of new generations of biofuels will replace the process of burning biomass, which is in fact the highest contributor in terms of generated emissions.
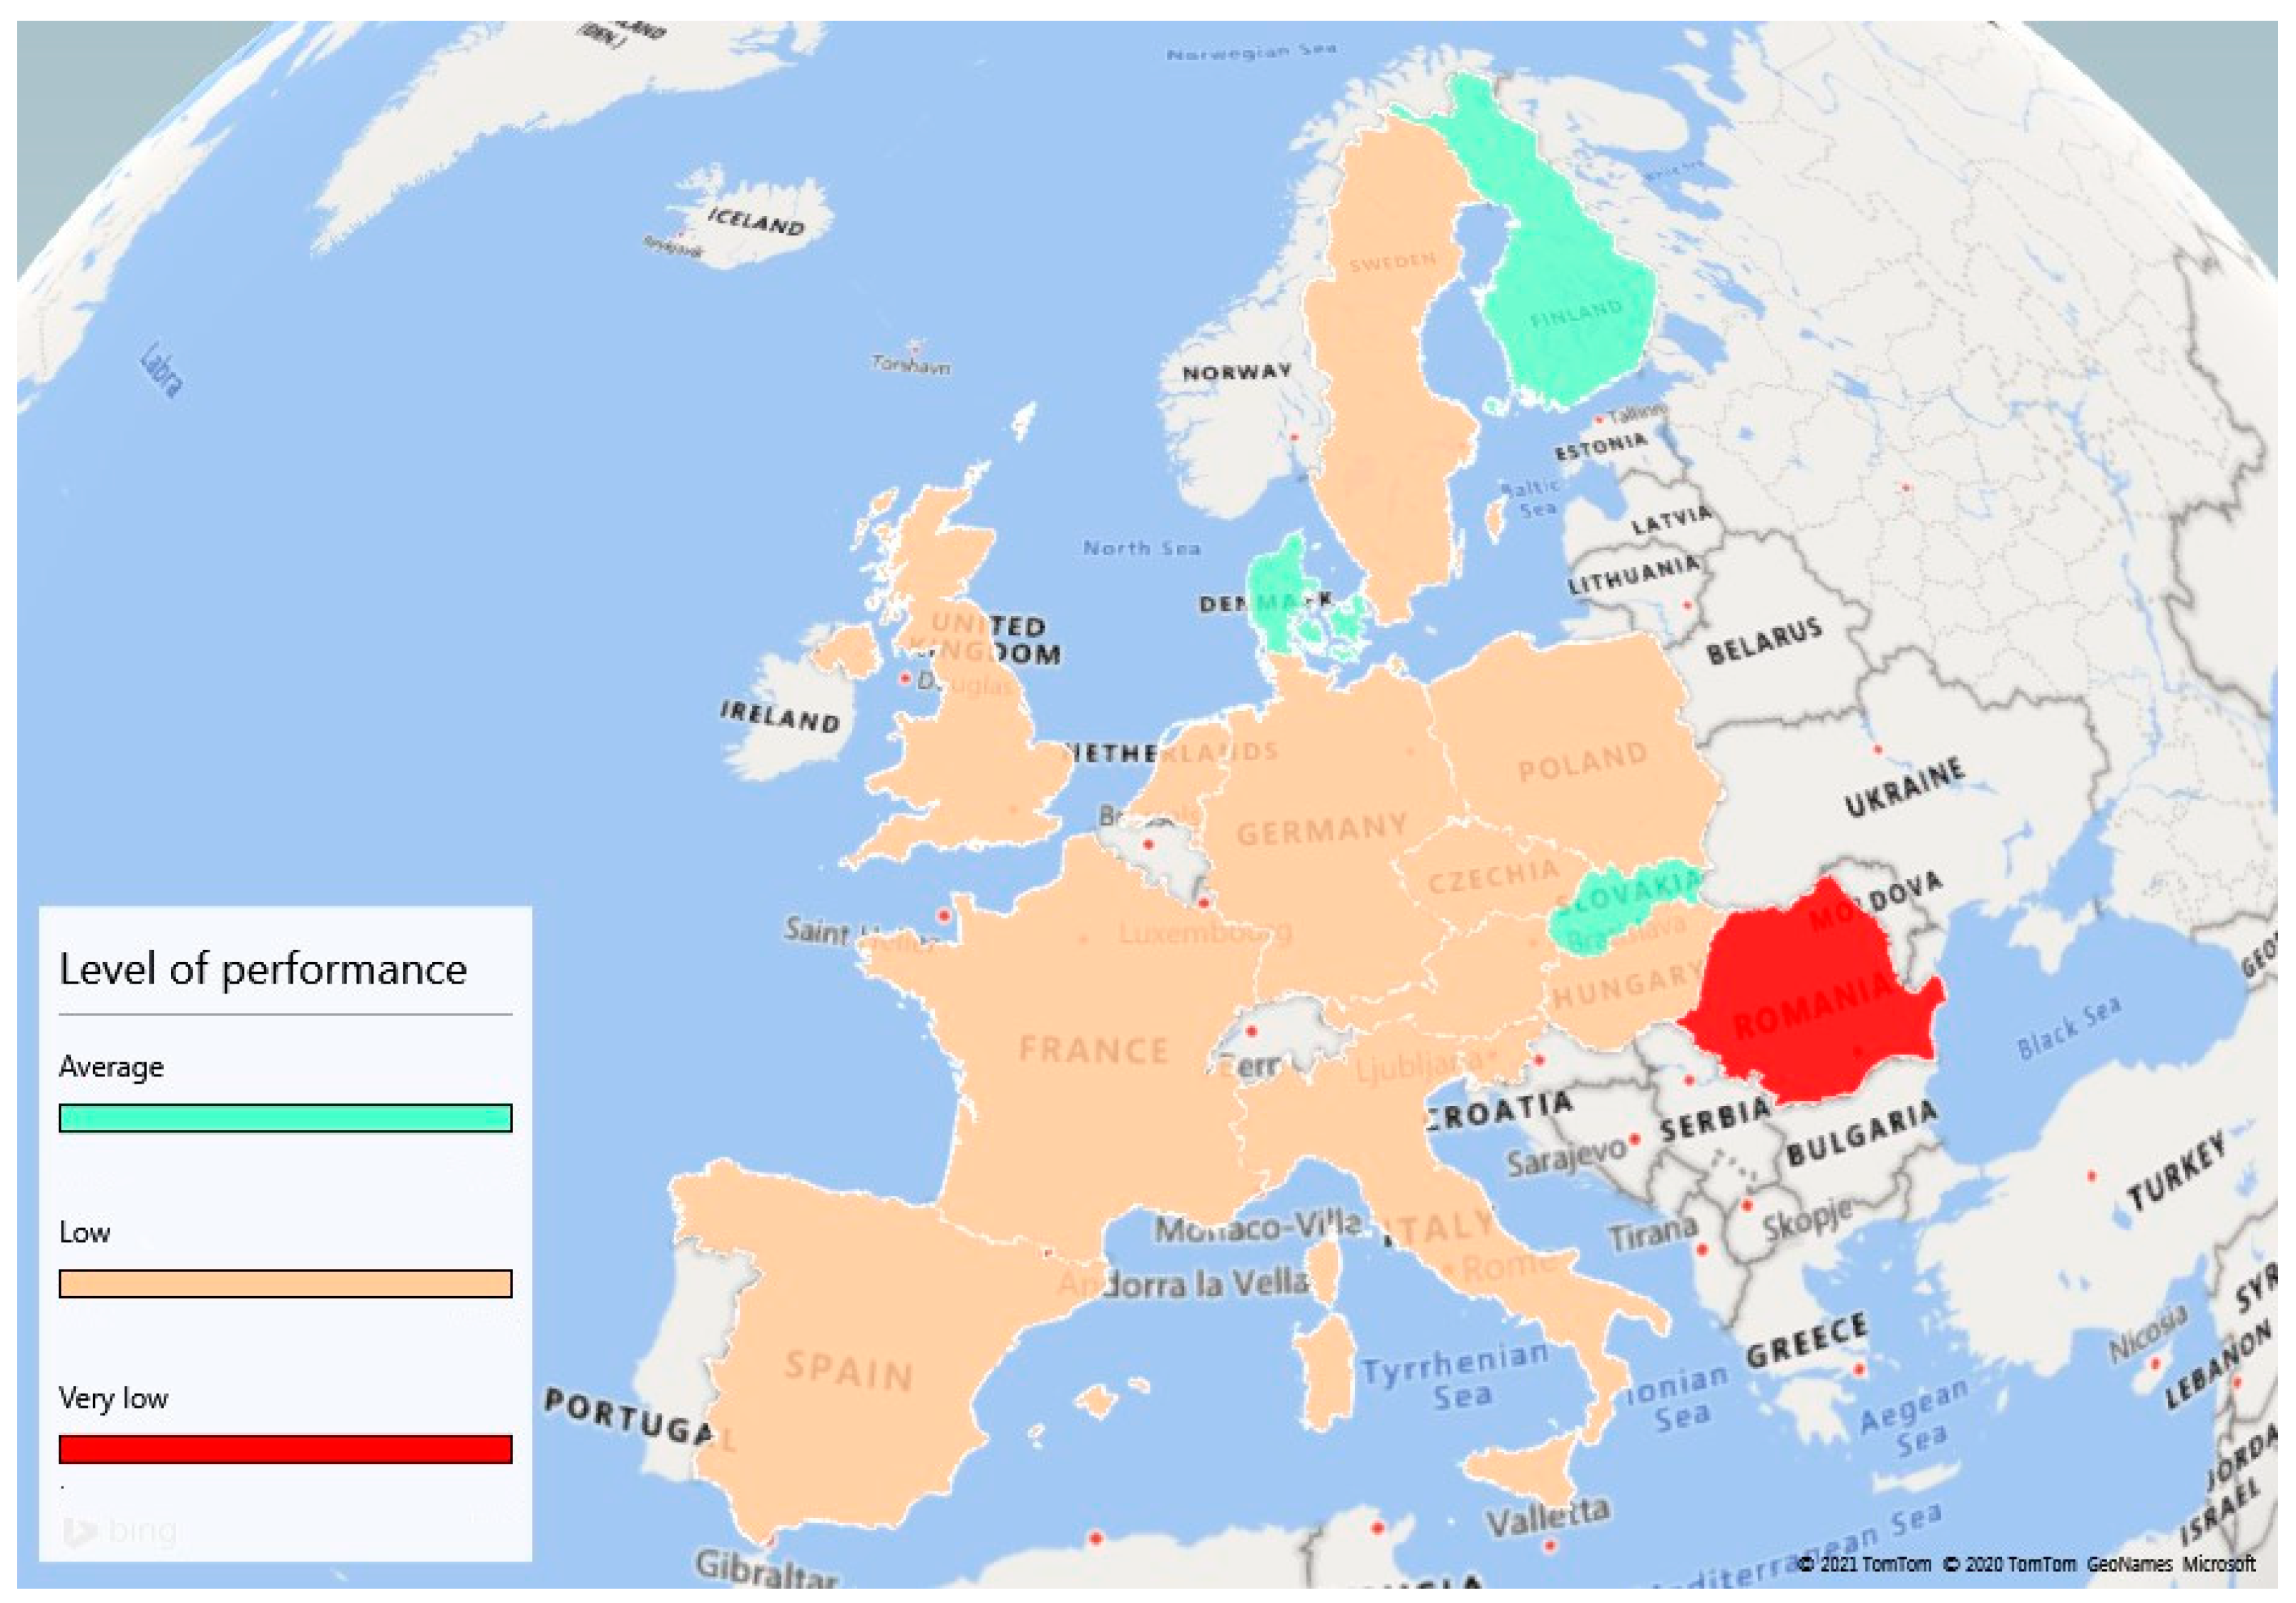
All things considered, after obtaining levels for all three dimensions, the performance within the bioenergy field can be calculated by using the geometric mean aggregation, explained in the methodology section.
The summary table (
Table 6) shows that the lowest scores were obtained for the level of innovation in the bioenergy field, while the highest scores were found in establishing the level of efficiency. Depending on their scoring, the performers in the field of bioenergy are Finland and Denmark, while the non-performers in the ranking are Italy, Slovenia, and Romania (
Table 7). In addition,
Figure 5 highlights the results obtained in
Table 7, showing the countries outperforming in the bioenergy field (blue color), but also the countries which have to continue to develop and apply strategies in the bioenergy field (red color) to perform better.
As we already presented in the methodological part of the paper, similar rankings were developed for the field of renewable energy and one of them refers to the Nexus Index. This index assesses the sustainability of bioenergy production by studying the efficiency of natural resources consumption, namely main crops such as maize. The index is calculated for 2014, and it reveals in top 10 most efficient countries [
43], Netherlands (3rd rank), Austria (6th position), Germany (8th position) and Slovenia (9th place). As such, Netherlands is found to be among performers in the bioenergy field by analyzing the Nexus index as well. At the same time, in the present ranking of performance in the bioenergy field, Slovenia joins the non-performers team, scoring low, while in the Nexus index, it (based only on the efficiency of using energy crops) joins the top 10 most efficient countries in terms of bioenergy production. However, our index is developed for 16 countries only, while the Nexus index is calculated for 191 countries.
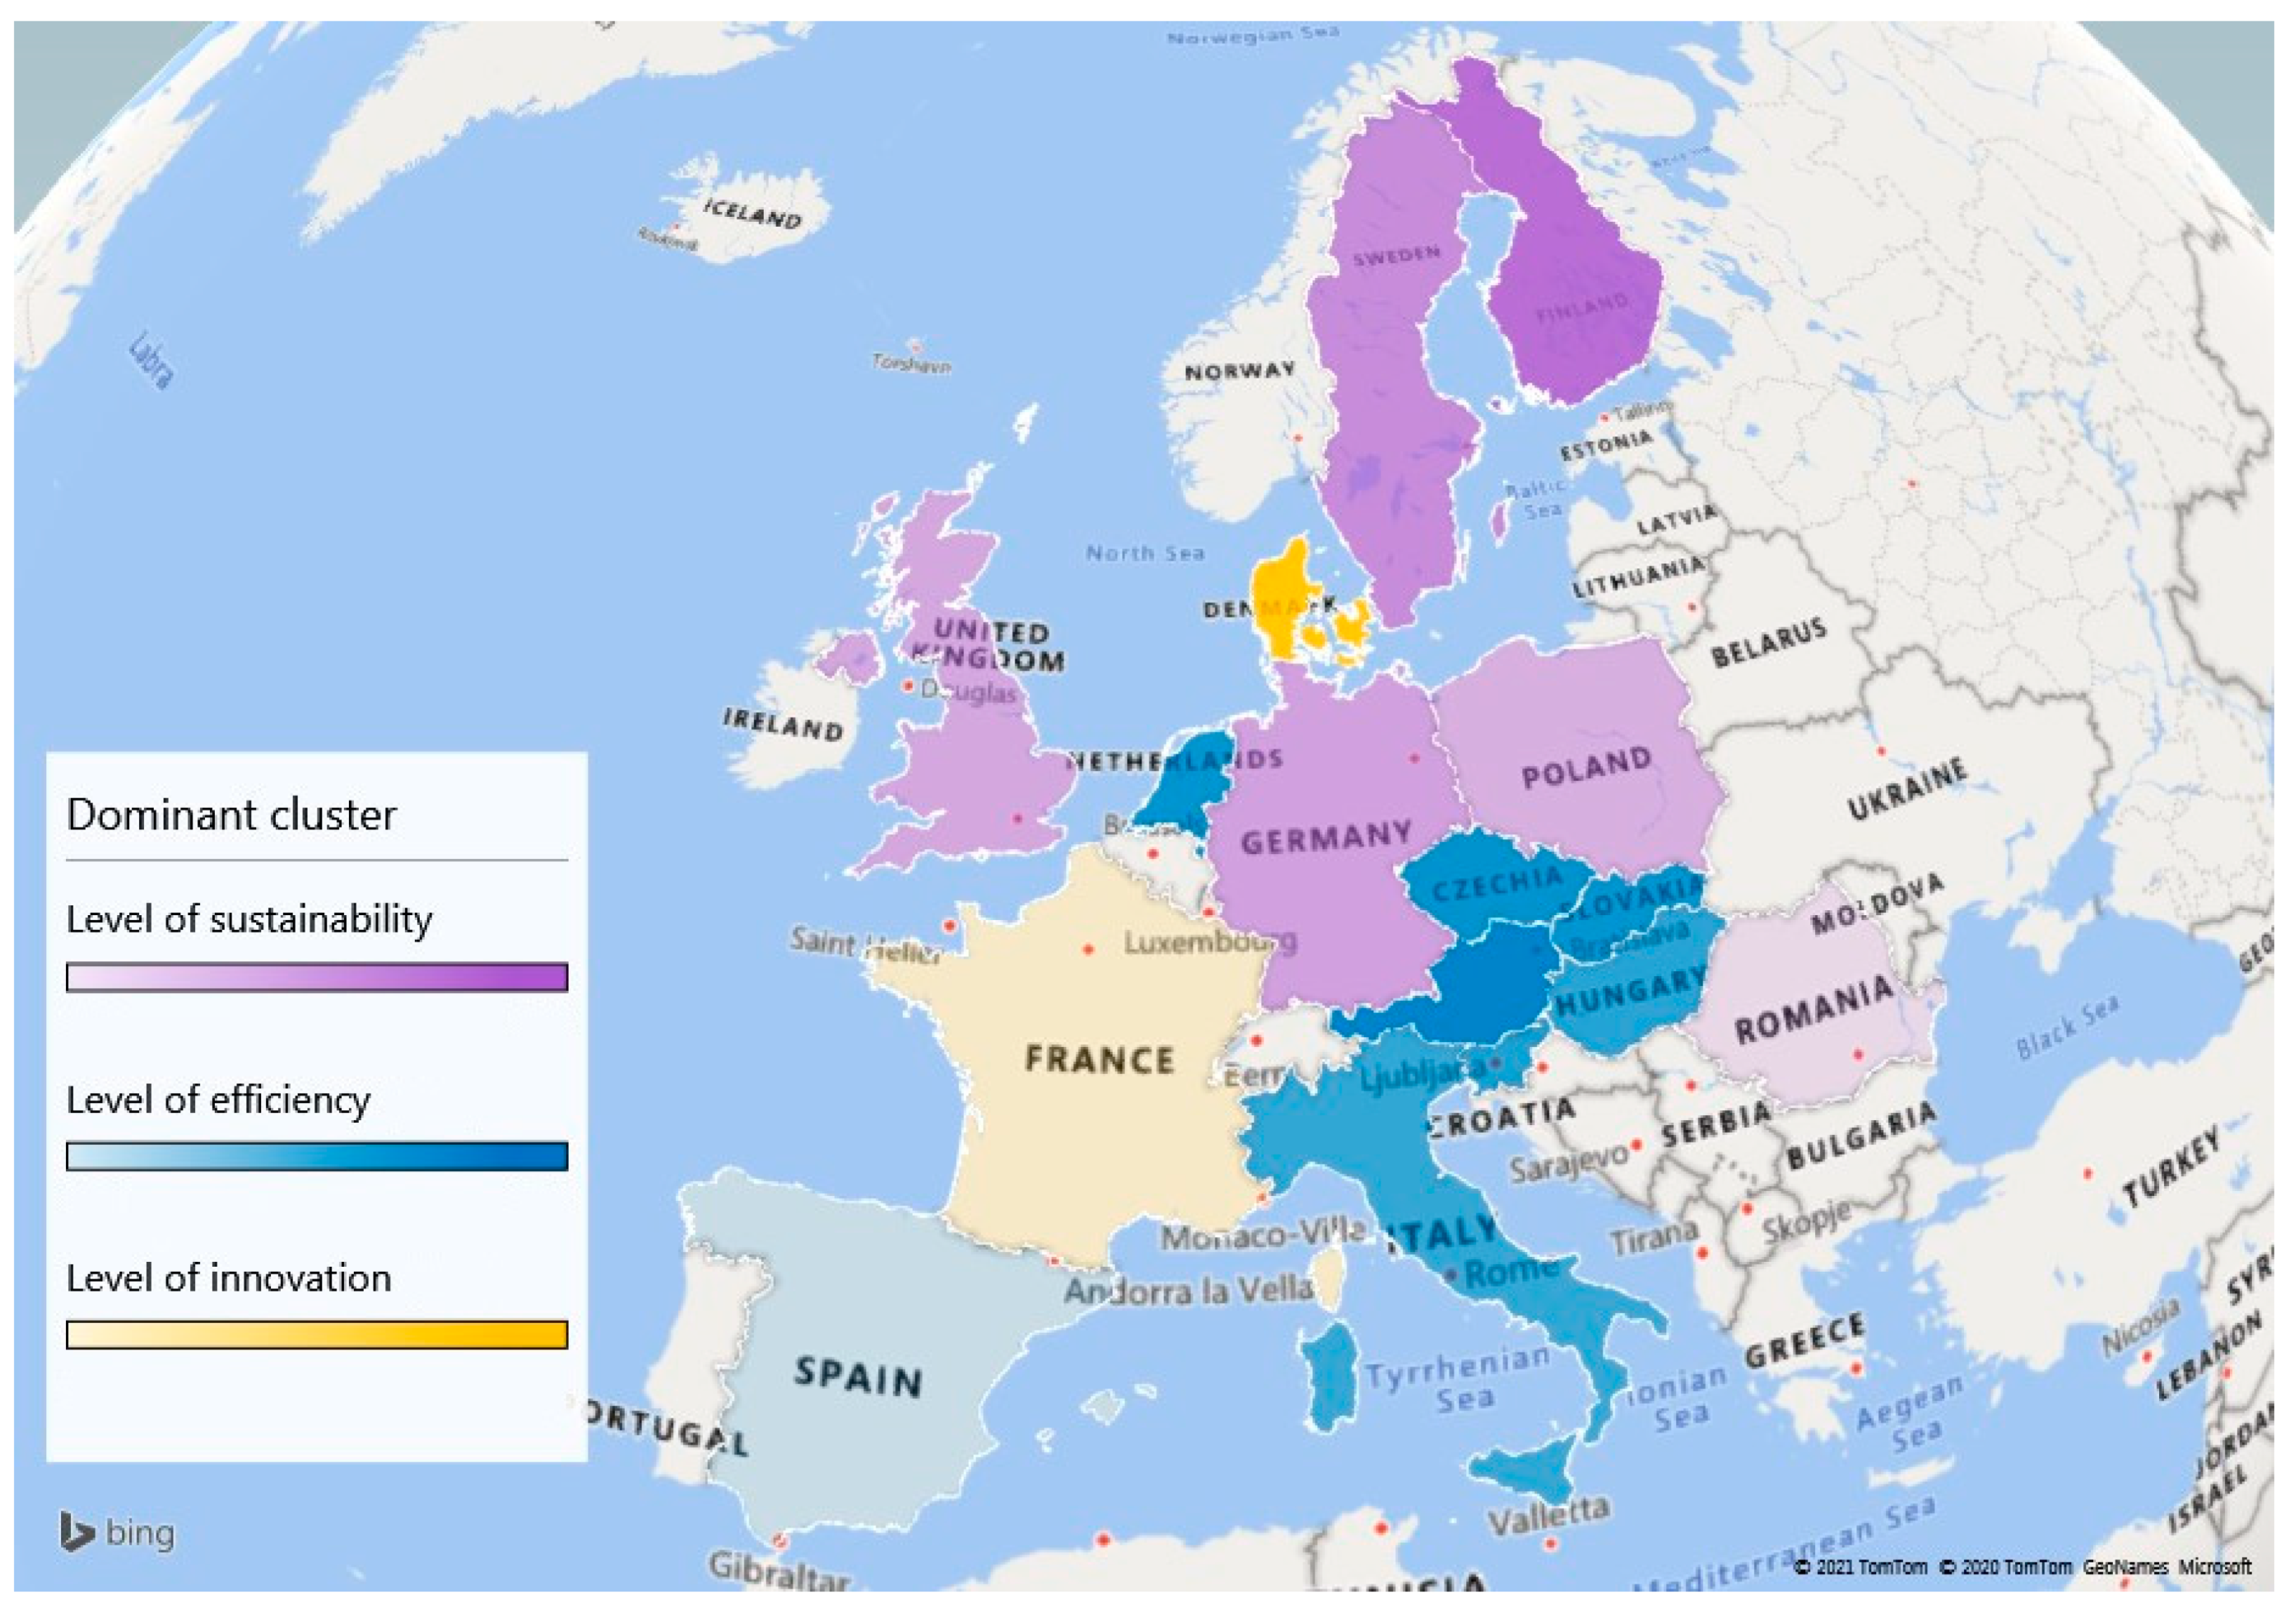
Figure 6 is a graphical representation of the analyzed countries based on the dominant component of bioenergy performance treated in this paper. By dominant component, we understand the dimension in which a country holds the best score. As we can see, northern Europe and several countries from central Europe hold supremacy in the sustainability dimension, having good performance for indicators included in this category. Represented by yellow, Denmark is the only country from the group of 16 that has a higher value for indicators regarding innovation, being followed by France, while several countries from Central Europe and Sothern Europe hold supremacy for Efficiency.
To check the reliability of the new performance index in the bioenergy field, the rank robustness is tested through a sensitivity analysis based on three scenarios. In this way, the shifts in ranks for the studied countries are capable of revealing how changes in the initial modelling assumptions influence the country ranking.
Table 8 shows the results of three sensitivity analyses which include:
- (1)
The removal from the framework of indicators for which missing data were imputed by us.
- (2)
The use of the arithmetic mean for aggregation instead of geometric mean.
- (3)
The exclusion from the framework of those indicators which have the overall group normalized values higher than the mean for the group.
The highest number of shifts can be found in the first scenario, so the choice of indicators is crucial for the performance assessment framework. Positive shifts reveal an improvement for a country and its position in the performance ranking. As expected, negative shifts tell that an inferior rank was assigned to a country. The overall robustness of the new created index is satisfactory, as the average shift in rank across all countries is 0 for all scenarios.
5. Conclusions
This research intended to create a performance assessment framework for the bioenergy field in order to provide new information on the current status of development in this field. Studying the weakest results in terms of performance and finding appropriate ways to counteract represents a great challenge for policy makers in establishing future targets to achieve by renewables in the battle of reducing climate change effects. The role of renewables has been worldwide recognized a long time ago, so tackling the concept of performance in this field supports the idea of revealing progress towards a cleaner environment created by a cleaner and greener consumption.
The assessment framework can be applied for other renewable energy sources as well, being easy to construct and use. Its main contribution is providing comprehensive information on the bioenergy field development, enclosing innovation, efficiency, and sustainability as performance components. It can be used as a screening tool for researchers and policy makers even for investors. The ranking based on performance levels facilitates comparative analyses among countries, reveals outperformers and non-performers. The effective measurement and benchmark of the levels in the three dimensions across countries are also important contributions of the present research. The weakest results may constitute warning signs for decision makers, while revealing what leads to them, may be helpful in selecting appropriate measures to increase overall performance of countries.
As for the limitations of this research, the timeliness of data is the major drawback. The availability of data for so many countries, determined us to choose 2015 (in majority of cases) in order to include as many indicators as possible in the framework. However, at a point, the risk of revealing outdated information appears if efforts of supplying up to date data are not made by concerned institutions. Another limitation is given by the choice of indicators to be included within the framework. The sensitivity analysis conducted in the robustness assessment phase showed how the overall performance level could change if removing indicators from the framework. No scenario of adding relevant indicators was used. For instance, the third dimension included in the performance level, sustainability, does not cover all the relevant aspects of the effects on the environment, but only emissions as a consequence of pollution. Other indicators revealing the effects on the environment can be used, such as those related to raw material source and the procurement chain of the biofuels. Furthermore, another limitation regarding indicators refers to not including the component of waste into the bioenergy production, but only solid biomass, biogas and liquid biofuels. For some countries, waste can definitely contribute to the bioenergy production value (through municipal waste and industrial waste categories) and influence the calculation of some indicators, such as: bioenergy intensity, bioenergy productivity, and bioenergy per capita. In the end, we consider that the lather two limitations can constitute, if properly approached, new directions of research and of developing the proposed performance framework.


