Article

Efficiency Improvement of Photovoltaic Modules via Back Surface Cooling

Department of Mechanical, Energy and Management Engineering, University of Calabria, Ponte P. Bucci 46/C, ZIP 87036 Arcavacata di Rende (CS), Italy
*
Author to whom correspondence should be addressed.
Energies 2021, 14(4), 895; https://doi.org/10.3390/en14040895
Submission received: 22 December 2020 / Revised: 25 January 2021 / Accepted: 1 February 2021 / Published: 9 February 2021
(This article belongs to the Special Issue Efficient Low Carbon Buildings and Districts)

Abstract

:
Crystalline silicon photovoltaics are a cardinal and well-consolidated technology for the achievement of energy efficiency goals, being installed worldwide for the production of clean electrical energy. However, their performance is strongly penalized by the thermal drift, mostly in periods of high solar radiation where solar cells reach considerably high temperatures. To limit this aspect, the employment of cooling systems appears a promising and viable solution. For this purpose, four different cooling systems, working on the photovoltaic (PV) panel back surface, were proposed and investigated in an experimental set-up located at the University of Calabria (Italy). Hourly electrical output power and efficiency were provided accounting for different meteorological conditions in several months of the experimental campaign. The results demonstrated that a simple spray cooling technique can provide an absolute increment of electrical efficiency of up to 1.6% and an average percentage increment of daily energy of up to 8% in hot months. More complex systems, based on ventilation or combining spray cooling and ventilation, were demonstrated not to be a viable option for PV performance improvement.

1. Introduction

The importance of developing a sustainable society and future has become a well-consolidate commitment [1,2,3]. Several efforts have been placed in the last few decades to limit the impact of human development on nature [4,5,6,7,8,9]. The production of cleaner energy from non-fossil sources has nowadays become a cardinal leading mission in several industrialized countries [10]. To improve solar conversion and usage [11], different technologies, ranging from simple to more complex systems, have been proposed [12,13,14,15,16,17,18,19,20,21,22,23,24,25]. Still one of the major player in actual installations and in the share of produced renewable energy remains the photovoltaic technology, that presents a high degree of flexibility for installation [26]. Photovoltaic systems (PV) are a quite a well-consolidated technology, where PV cells and modules have undergone a significant technological development in the last few decades with several new materials proposed in the literature, providing some advantages compared to the first generation of photovoltaic systems [27,28,29,30,31,32,33,34]. However, for their proven stability and reliability in time, monocrystalline and polycrystalline silicon modules are still the most widely used: it is indeed estimated that 66% of the global PV production comes from Poly-Si cells, whereas 24% comes from Mono-Si cells [35]. A strong limitation of PV technologies lies in the relatively low conversion efficiencies, that is further penalized in high solar radiation conditions by the thermal drift that reduces the modules’ performances when the photovoltaic cells reach high operating temperatures.
In the attempt to increase the electrical performance of photovoltaic modules, different strategies [36] involving several active and passive cooling systems have been proposed and investigated [37,38,39,40]. Several configurations proposed a combination of PV panels and an extraction system [41,42]. Manasrah et al. [43] investigated different cooling paths on the backside of a PV panel, implementing forced ventilation by means of DC fans. They were able to improve the temperature uniformity and reduce by 27.5% the surface temperature in outdoor conditions. Four different absorber types have been simulated and compared in Ref. [44]: aluminum with fin, aluminum without fin, Tedlar, and black painted glazing absorbers obtaining the highest efficiencies for the aluminum with fin absorber. A novel photovoltaic/thermal solar-assisted heat pump (PV/T-SAHP) system designed to use a direct-expansion evaporator (PV evaporator), that laminates PV cells on the front surface, has been proposed in Ref. [45], to simultaneously produce thermal energy and electricity. A thin metal sheet, suspended in an air channel was used to improve heat extraction from the panels and tested in natural and forced convection [46]. Fins attached to the back wall of an air-channel have been proposed [47] to improve heat extraction from the module. A solar system composed of a parallel array of ducts with inlet and outlet manifold designed for uniform airflow distribution, attached to the back of the PV panel was proposed by Teo et al. [48]. The electrical and thermal performance of an air-based PV/T collector with a mono-crystalline PV module was analyzed in [49]. The module had an air layer of 60 mm with 10 cm diameter exhaust air pipes to cool the rear the of PV laminate. A PV/T system with a bifacial module was investigated in [50], that was capable of exploiting both faces thanks to a water-heating planar collector and a set of reflecting planes were employed, obtaining an electrical efficiency of 16.4%. Evola and Marletta [51] performed an exergy analysis of a photovoltaic/thermal collector demonstrating that for any operating conditions a proper inlet temperature maximizes the exergy generated. A double-pass PV/T solar air heater with fins was investigated in [52]. The extended fin area was able to reduce considerably the cell temperature. Furthermore, the use of phase change material to absorb and store the heat produce by a PV system was also investigated [53,54,55,56]. An unconventional unglazed PV module with a layer made of alveolar polycarbonate ducts was proposed for water cooling in [57]. They found experimentally that the Standard Test Conditions can be reasonably reproduced in the field in clear sky conditions thanks to suitable cooling. Nevertheless, such discussed systems appear complex and are difficult to apply in operating conditions of a real PV plant with more than just a single module.
In this regard, cooling methods exploiting fluids appear more attractive [58,59]. Small crystalline solar cells were immersed in different liquids, including the polarethanol and glycerin, the non-polar benzene and silicon oil, and the inorganic distilled water and tap water, with a liquid thickness of 3, 6 and 9 mm [60]. The results indicated that solar cells immersed in the non-polar silicon oil showed the best performance, even though the implications of this study are more useful for the concentrated photovoltaic (CPV) system rather than simple PV plant. The direct liquid-immersion for improving CPV cells’ electrical performance was also addressed in [61], where improvements of the electrical performance have been found. The performance of solar cells immersed in water was studied obtaining an efficiency increase of about 17.8% at water depth 1 cm [62]. Rosa-Clot et al. [63] studied the behavior of a photovoltaic (PV) panel submerged under 4 cm and 40 cm of water finding an average efficiency increase of about 11% at 4 cm of depth but a 23% reduction at 40 cm of depth. Similarly, in [64] a photovoltaic (PV) panel submerged in distilled water was studied obtaining an increase of electric power output for shallow water with an efficiency of about 22% at a water depth of 6 cm. Although promising results have been shown by these studies, feasibility in real conditions appears still a critical issue.
More interesting, because of the simplicity of the application and the importance of the results that they can produce, are the systems using water as a cooling fluid. Several studies have adopted techniques operating over the module front [65,66]. The increase of cells’ power with spraying water over the front surface for a photovoltaic water pumping system was investigated in [67]. In the study, an increase of the mean PV cell efficiency by 3.26% was found. The cooling effect of water trickling on the upper surface of a PV panel was investigated in [68], where an increase of about 15% in system output was achieved at peak radiation conditions. A spraying system for the front cooling of a PV module was used for a single day in [69]. A temperature decrease of 11% was found by the authors. In a laboratory test, a water flow over the front surface of PV panel was investigated [70]. The results indicated an increase in the power output by 9–22%. A water spray cooling system working on both sides of a 50 W PV module was investigated in the city of Split (Croatia) [71], with high solar irradiation in June, obtaining a maximum power increase of 16.3% and 5.9% of the relative increase in panel electrical efficiency. An economic analysis was conducted considering installation and operation expenses related to the system with the aim to evaluate the economic convenience of PV cooling. The results showed that is possible to achieve a positive energy balance but water consumption and installation cost must be properly optimized [72], because high pump consumption can lead to a negative energy balance. In Ref. [58] it was shown that a more complex cooling system may determine poor economic payback when installation costs are high compared to the additional energy produced. Furthermore, few cases of cooling solutions operating on the back surfaces can be found in the literature [73,74], where the importance of the backside convective cooling mechanism on photovoltaic panels were stressed in [75].
Nevertheless, cooling systems that work on the glass surface, even though being more efficient in increasing the performance of the system, present evident limitations and drawbacks related to the deterioration of the glass optical properties, especially if unclean cooling fluids are used, and to the possibility of generating thermal shock in the glass, due to very high-temperature gradients induced by the cooling fluid, with possible crack and disruption of the module cover.
In order to avoid this drawback, this study addresses and investigates different cooling systems that operate the back surface of the photovoltaic module. Differently from most of the studies reported in the literature, the research reports an analysis conducted on an hourly-basis, for several months in real operating conditions with different weather scenarios to provide a more comprehensive and robust assessment of the efficiency of the proposed cooling systems. A data acquisition campaign on the experimental set-up located on the roof of the Department of Mechanical Engineering of University of Calabria (Italy) was performed for eight consecutive months. The four different systems work on the basis of different physics mechanisms, including spray cooling and forced convection, and were specifically designed trying to limit as much as possible the auxiliary energy consumption. The monitoring of external climatic conditions, along with all the electric variables of the PV modules allowed us to determine the improvement of electric efficiency and the increment of electric energy produced by each module for the entire monitoring period.

2. Materials and Methods

2.1. Experimental Site

The experimental set-up is located on the roof of a building of the department of Mechanical Engineering of the University of Calabria and it is composed of six PV modules installed with a 30° inclination with south orientation (Figure 1). The PV modules are disposed in a way to avoid mutual shading and be subjected to the same irradiance condition.
The 1663 mm × 998 mm polycrystalline silicon modules are made of 60 cells, with a total area of 1.46 m2 and a nominal efficiency of 14.5%. Each module is equipped with a micro-inverter with maximum-power point tracking for the conversion to alternate current. The electrical characteristics of the modules and micro-inverters are reported in Table 1.
The modules were chosen in order to minimize the power output deviances. For this purpose, a preliminary analysis was carried out on a monthly basis in an initial period of consistent production (May 2015). After the installation of the cooling devices, the mentioned preliminary tests allowed to attribute electric efficiency and production deviances mainly to the cells cooling effect.
On the building roof, a weather station continuously monitored meteorological external climatic conditions, and in particular: air temperature, relative humidity and wind speed and direction. The specifications of sensors are reported in Table 2. The solar irradiance was measured on the plane of the modules with a Secondary Standard Eppley Laboratory pyranometer with spectral range 295–2800 nm, sensitivity of 8 µV/Wm-2, a 95% response time of 5 s, a non-stability and non-linearity of 0.5%, and uncertainty at an hourly average of 2%.
The experimental site is located in Rende (Italy), defined as subtype Csa according to the Köppen climatic classification, with hot and dry summer and humid winter. The daily and yearly temperature excursion is very high and precipitation is intense during colder periods.

2.2. The Cooling Systems

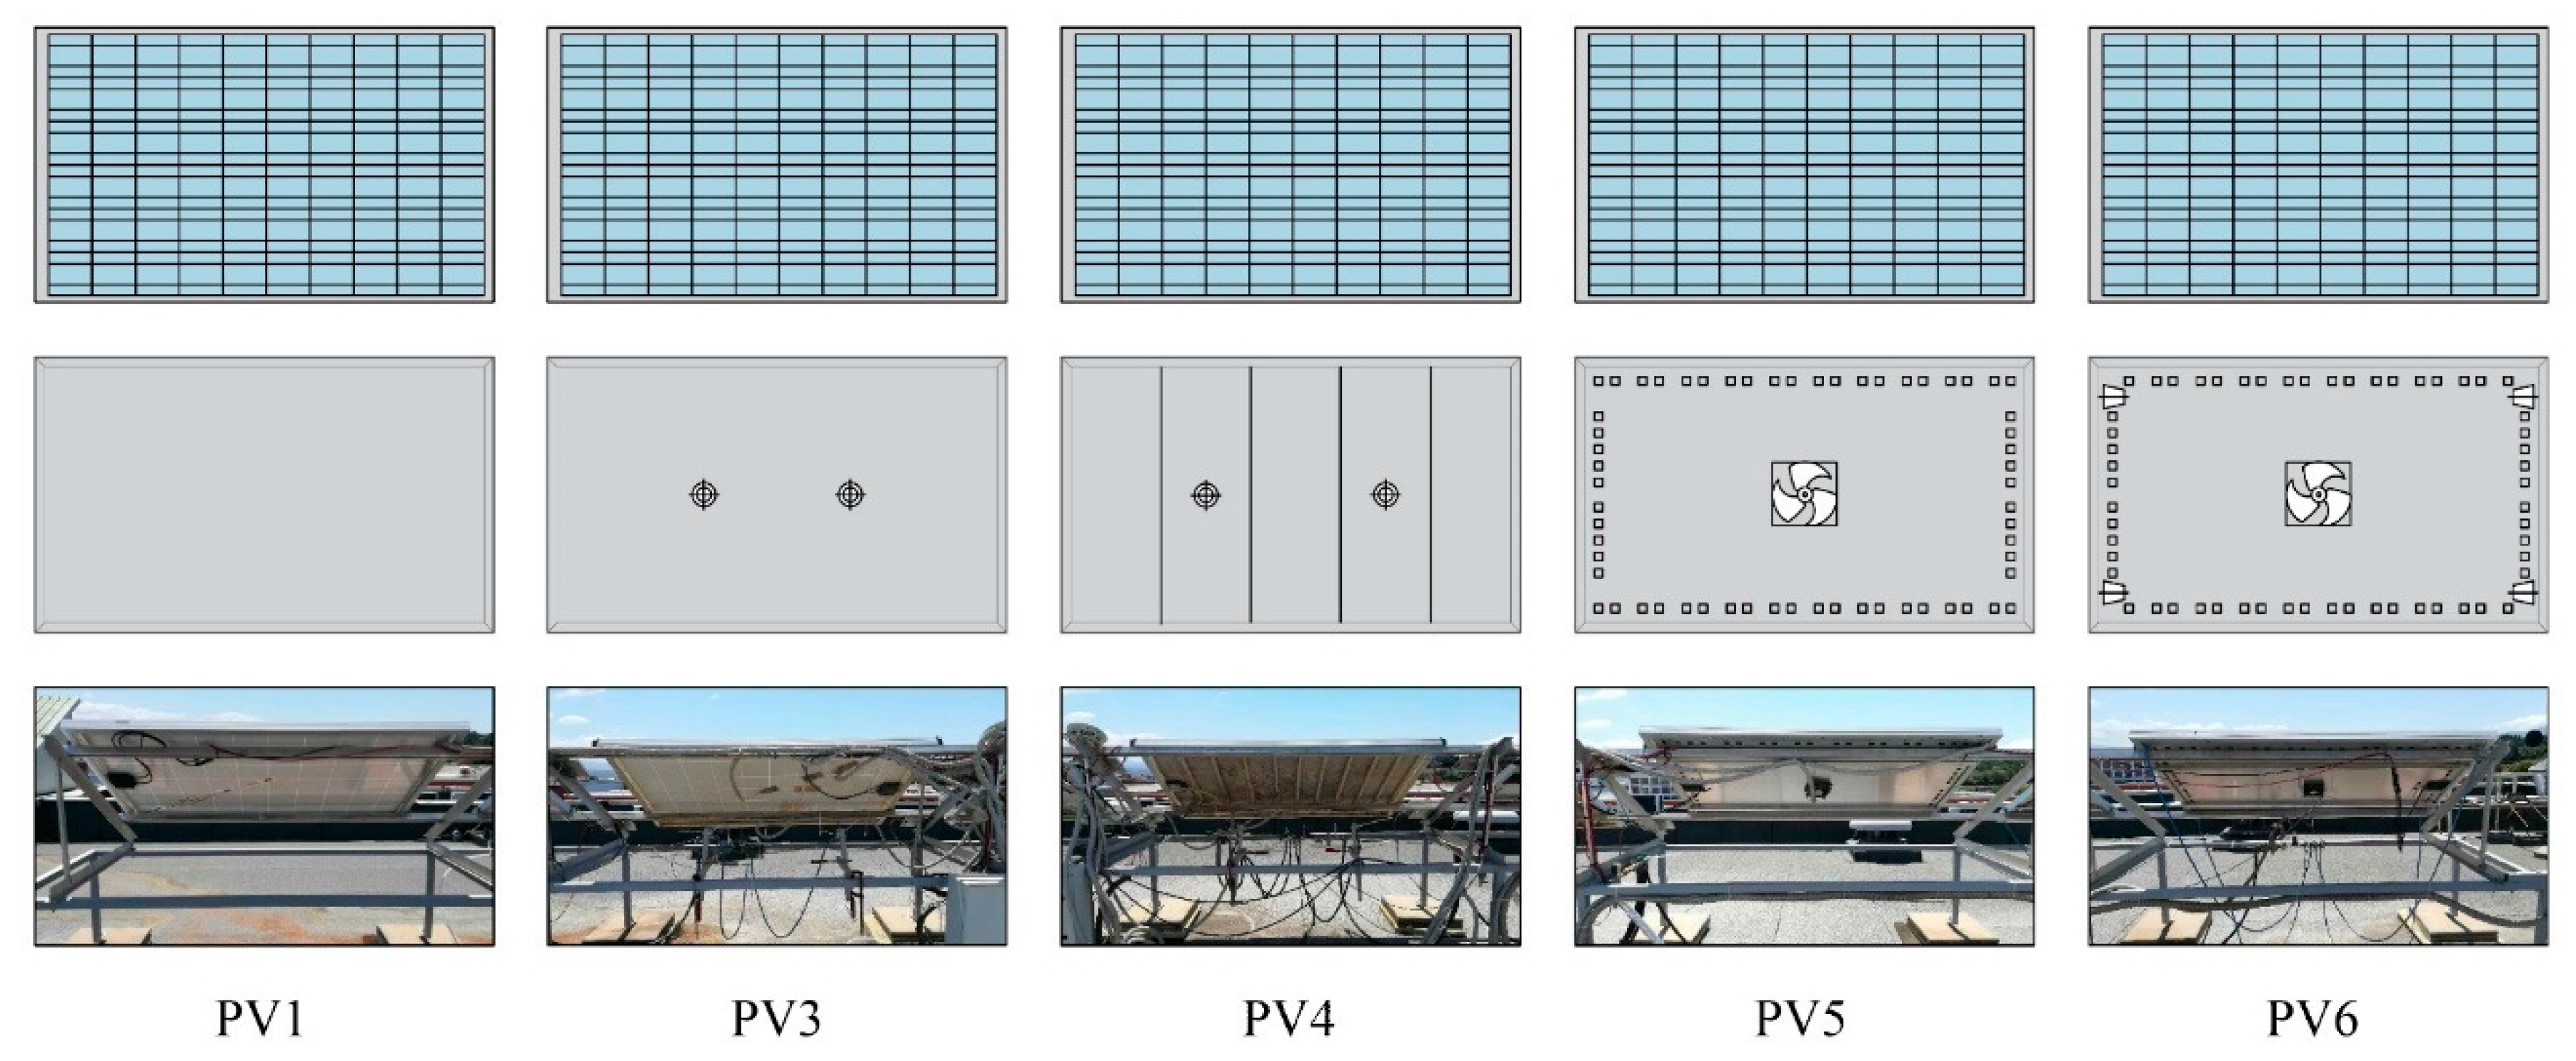
The experimental set-up was built to perform experiments with different types of cooling systems to assess the validity of each proposed solution in terms of energy efficiency. One module was kept as a reference, without any cooling system. On the other modules different cooling systems were installed. Two systems realized a water spray cooling and the other two exploited the forced air convection to increase the thermal exchange with the external environment. More in detail:
  • Module PV1 had no cooling system and was left as a reference system for comparison in terms of temperature, power and efficiency;
  • Module PV3 was equipped with two wide cone water spray nozzles positioned at roughly 50 cm from the back surface in order to have a perpendicular spray that covers the greatest rear area. A nominal water flow rate of 8.55 L/min is associated with a pressure of 3 bar.
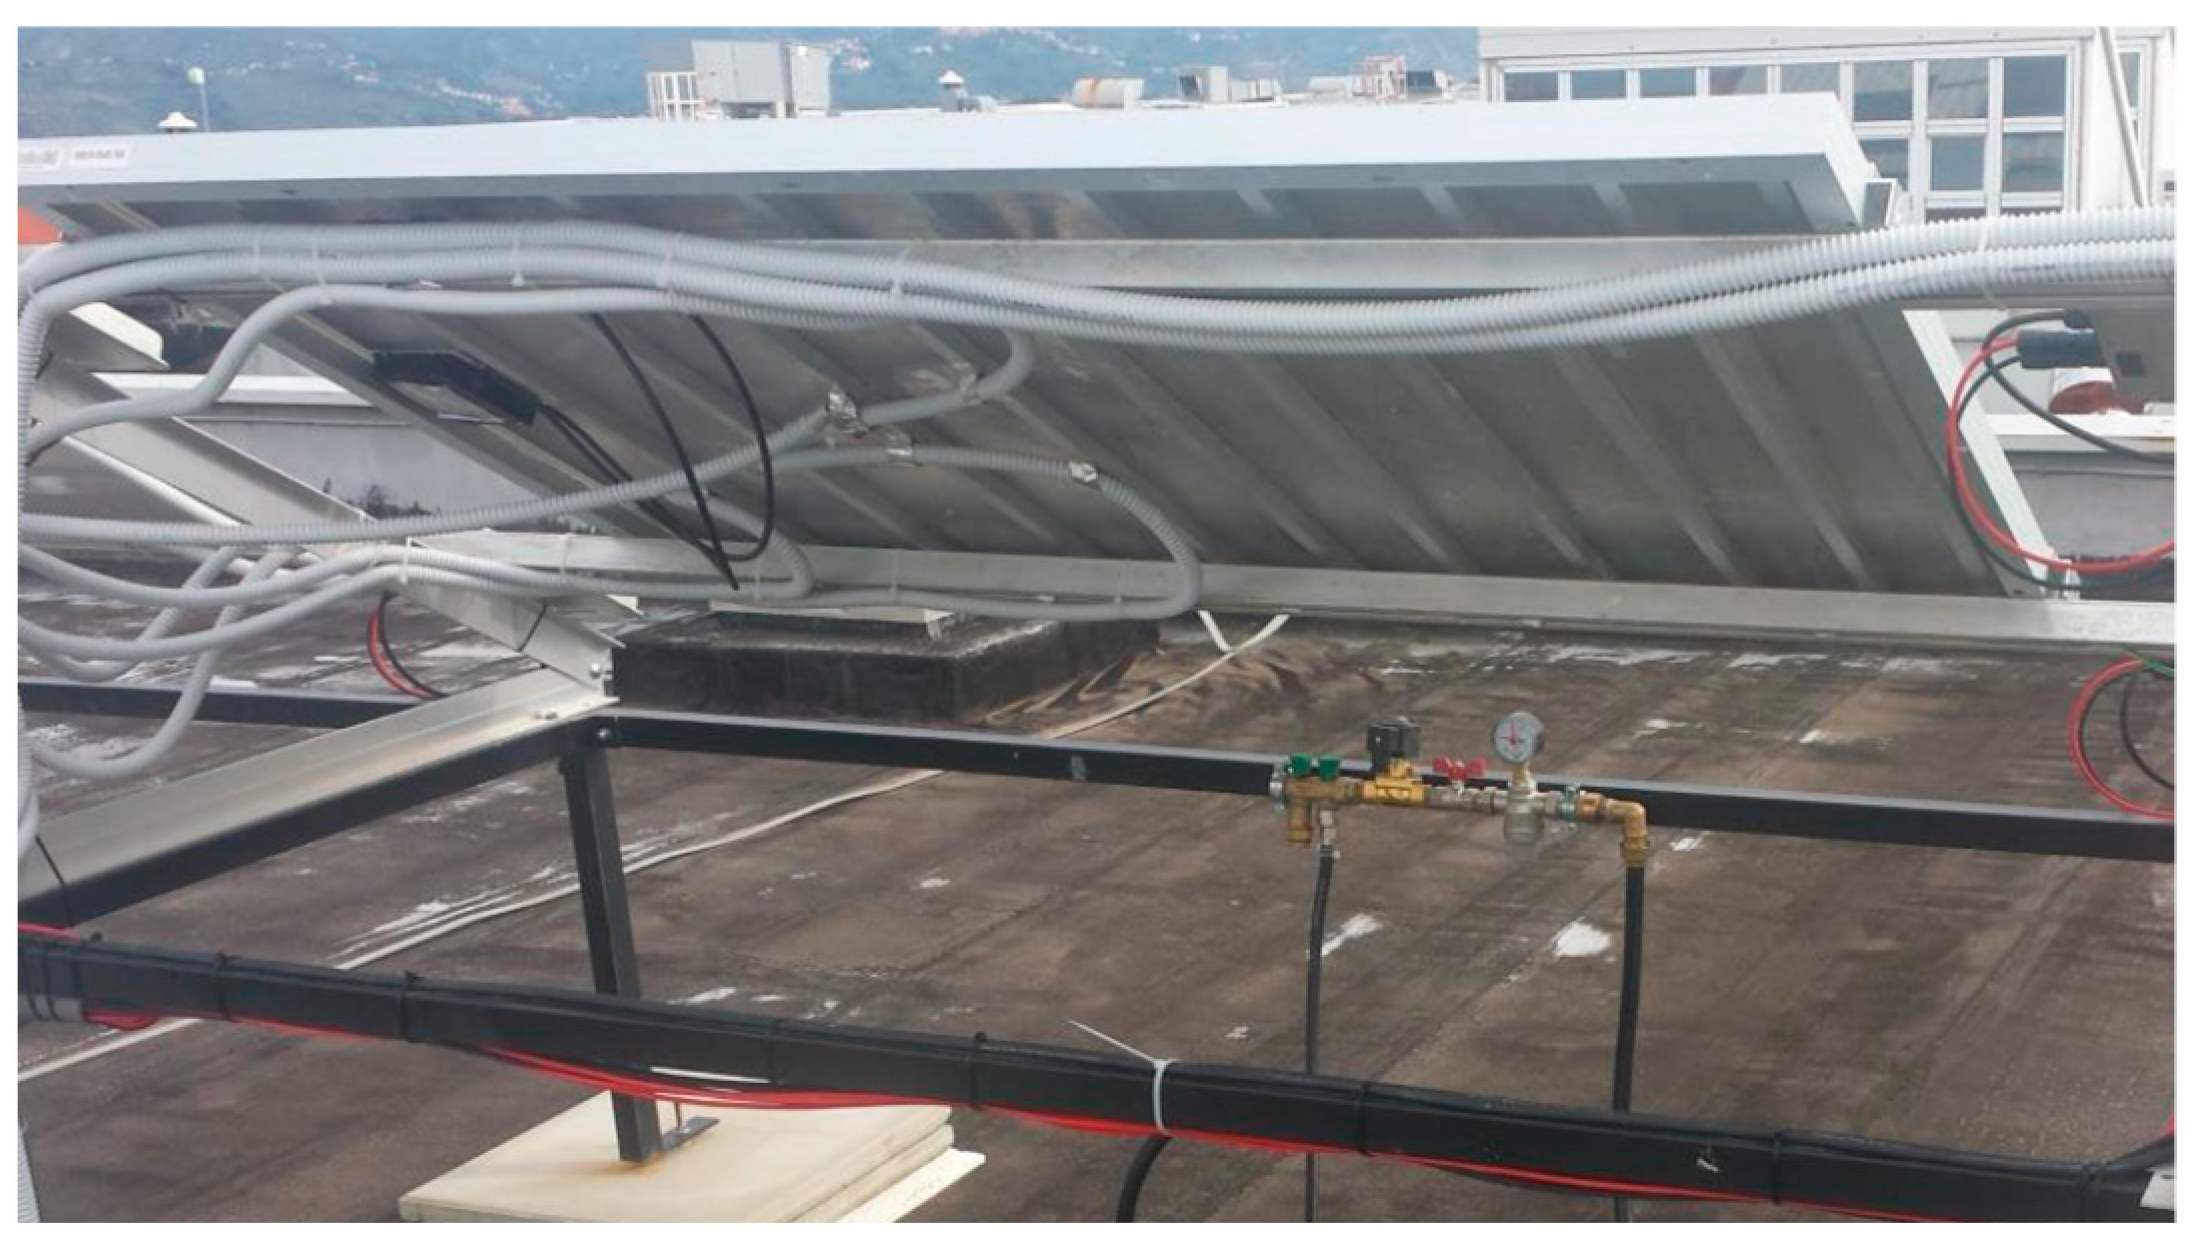
  • Module PV4 was equipped with the same nozzles as PV3, distant approximately 50 cm from the module but with the addition of a thin metallic panel fixed on the back surface (Figure 2) in the attempt to improve temperature uniformity of the rear surface.
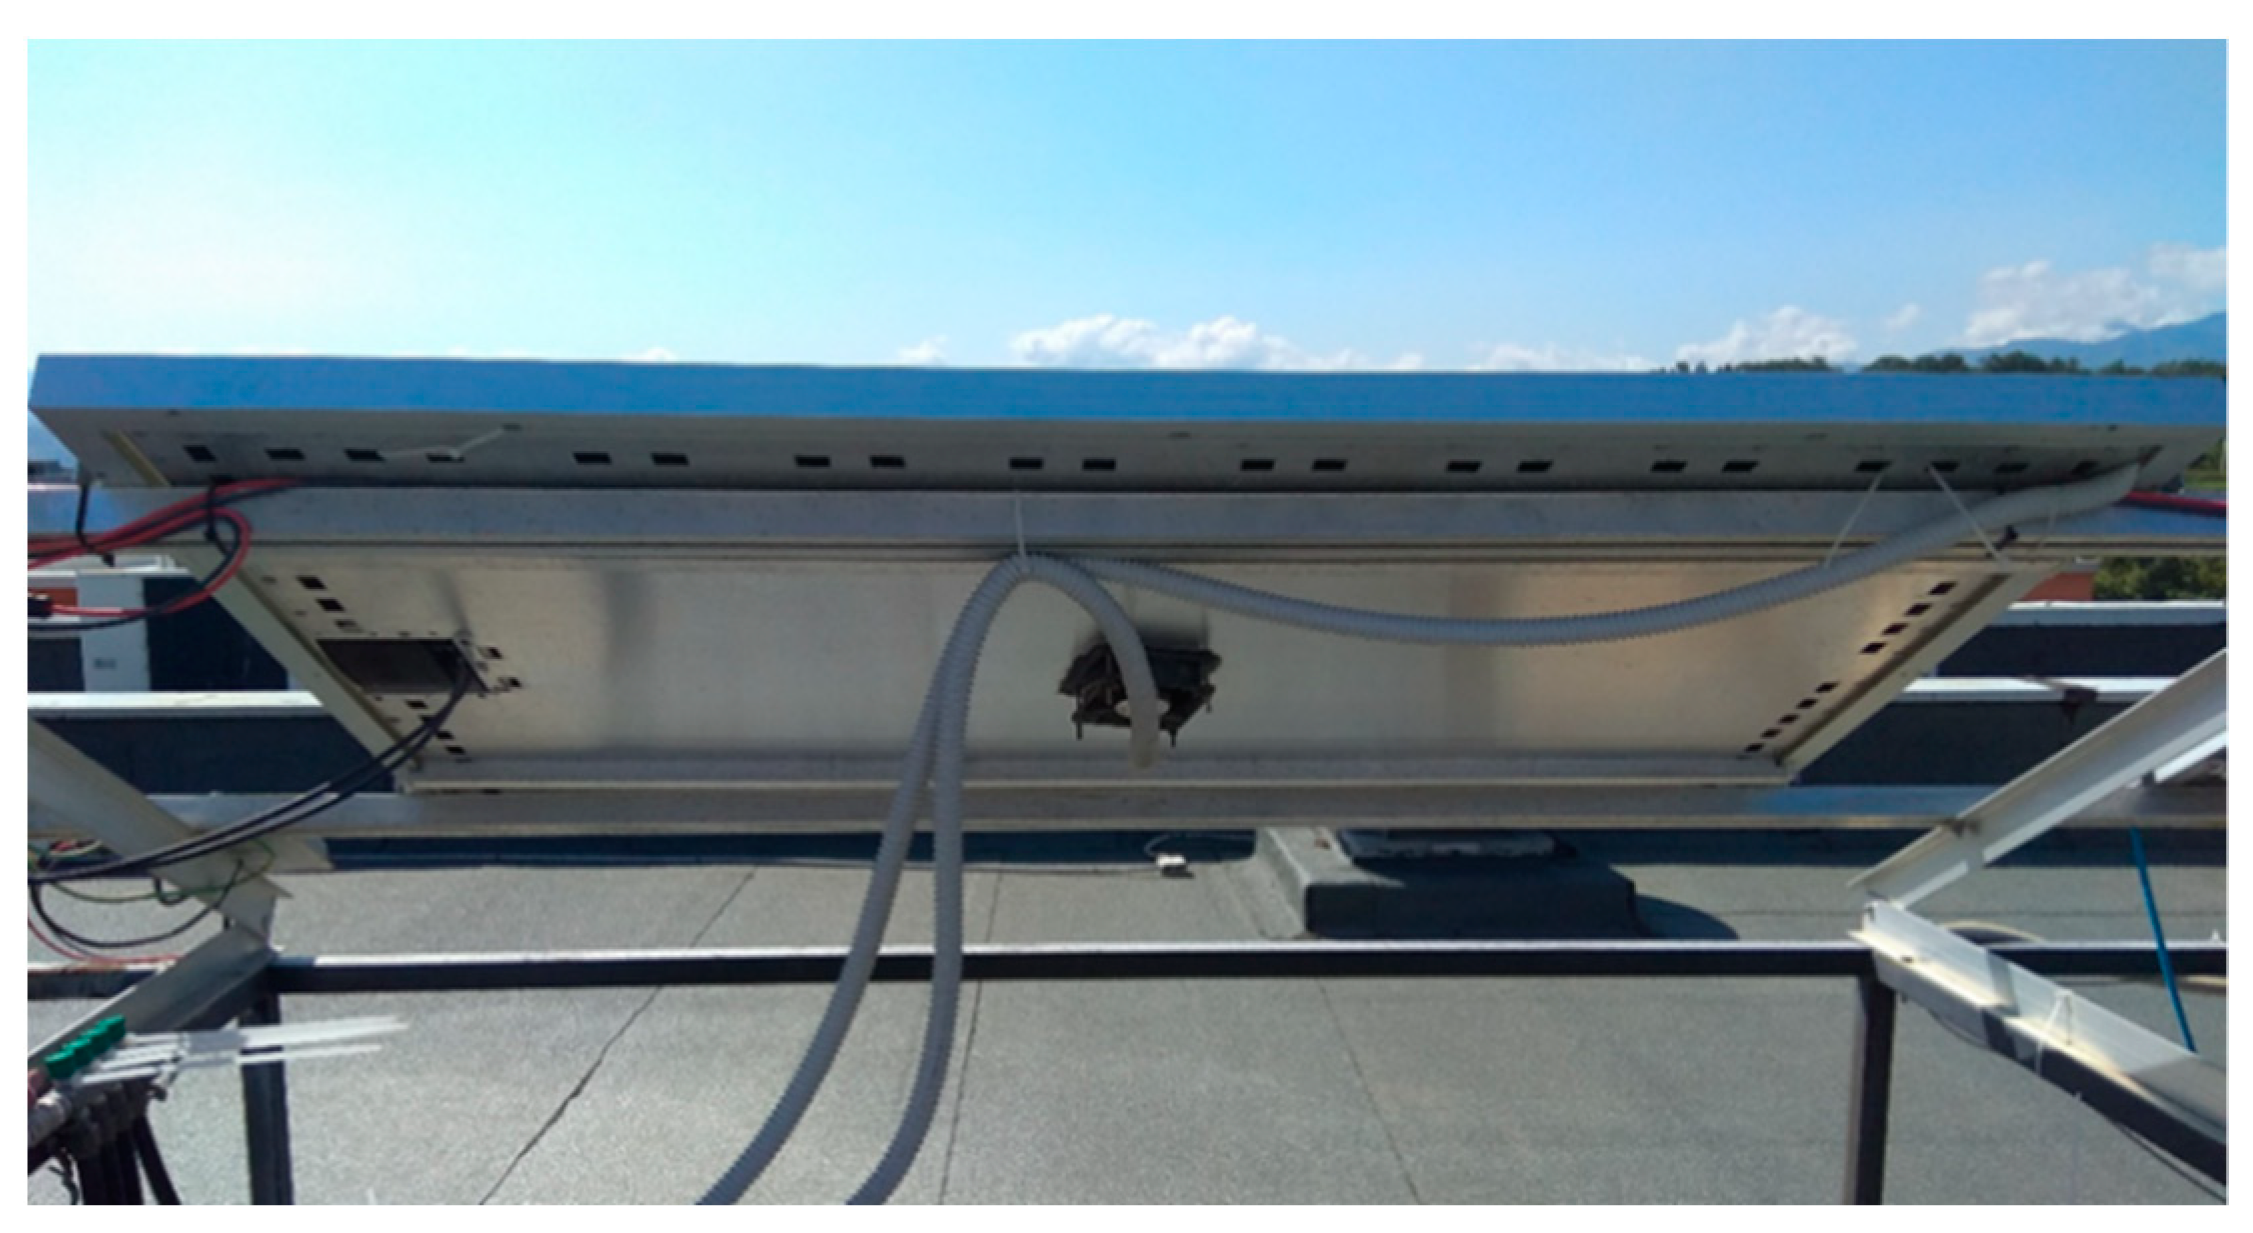
  • Module PV5 was equipped with a ventilation system that produced forced convection on the module back surface. A proper thin metallic cover installed on the rear part of the module creates a closed cavity in which a small mechanical fan operates expelling an air flow rate that has before extracted thermal energy from the rear surface. The air renewal is guaranteed by a series of small peripheral openings on the metallic structure that induce inside the cavity the same air flow extracted by the fan (Figure 3). The fan was selected to minimize energy consumption with a nominal power of 2 W.
  • Module PV6 is equipped with the same ventilation system as PV5 with additional four spray nozzles installed at the four external corners of the metallic closed cavity.
The spray nozzles work with a water pressure compatible with the building supply network, so they were directly connected to the water piping without any pumping systems.
The monitoring of the global solar radiation (G [W/m2]), measured on the PV modules tilted plane, and of the DC electric power (Pel [W]) produced by the modules allows the calculation of the instantaneous electric conversion efficiency, as:
η = P e l A m o d   G
An experimental campaign of data monitoring was performed from August 2016 to March 2017. All the variables were acquired with a one-minute time step, and then data were analyzed on hourly-average basis. Figure 4 reports a final schematic representation of the whole experimental set-up. The cooling systems activated from dawn to sunset; the spray was activate for 1 s and a pause time of 5 min was set before the activation of the next spray. The daily trend of the output electric power produced by the five cooled modules and the reference module, along with the electric efficiency evaluated on an hourly basis, are reported. The results are shown for three selected days of each month, from August 2016 to November 2016 and from December 2016 to March 2017. The days represent three interesting meteorological conditions: sunny, cloudy and windy day.

3. Results

3.1. Preliminary Test for Base Case Comparison

When dealing with real PV modules it is inevitable that one will face issues related to small differences between panels caused by the manufacturing process, which translate into the so-called tolerance of the output power that can deviates from the nominal referenced peak values of small percentages. The modules employed in the research have a positive tolerance (0÷5%). A base case comparison between the modules was preliminarily conducted, before the installation of the cooling systems, with the aim to evaluate the energy production deviances because of the intrinsic manufacturing differences. A preliminary experimental campaign was conducted in May 2015 before the installation of the proposed cooling systems. Table 3 reports the percentage difference of the produced daily electric energy and the absolute difference in daily average efficiency. The comparison was performed with module PV1.
Discrepancies in the range −0.42% ÷ 1.01% for PV3, 0.54% ÷ 1.95% for PV4 were detected, whereas PV5 and PV6 showed smaller variation. Considering the entire month, the resulting average deviances were: 0.47% for PV3, 1.38% for PV4, 0.69% for PV5 and −0.29% for PV6. It is worth noting that the measurements refer to daily cumulative errors, since they consider energy produced and not the output power that instead is characterized by a tolerance defined at an instantaneous level. Finally, the comparison showed also deviances lower than 2% in terms of power output.

3.2. Electric Efficiency Analysis

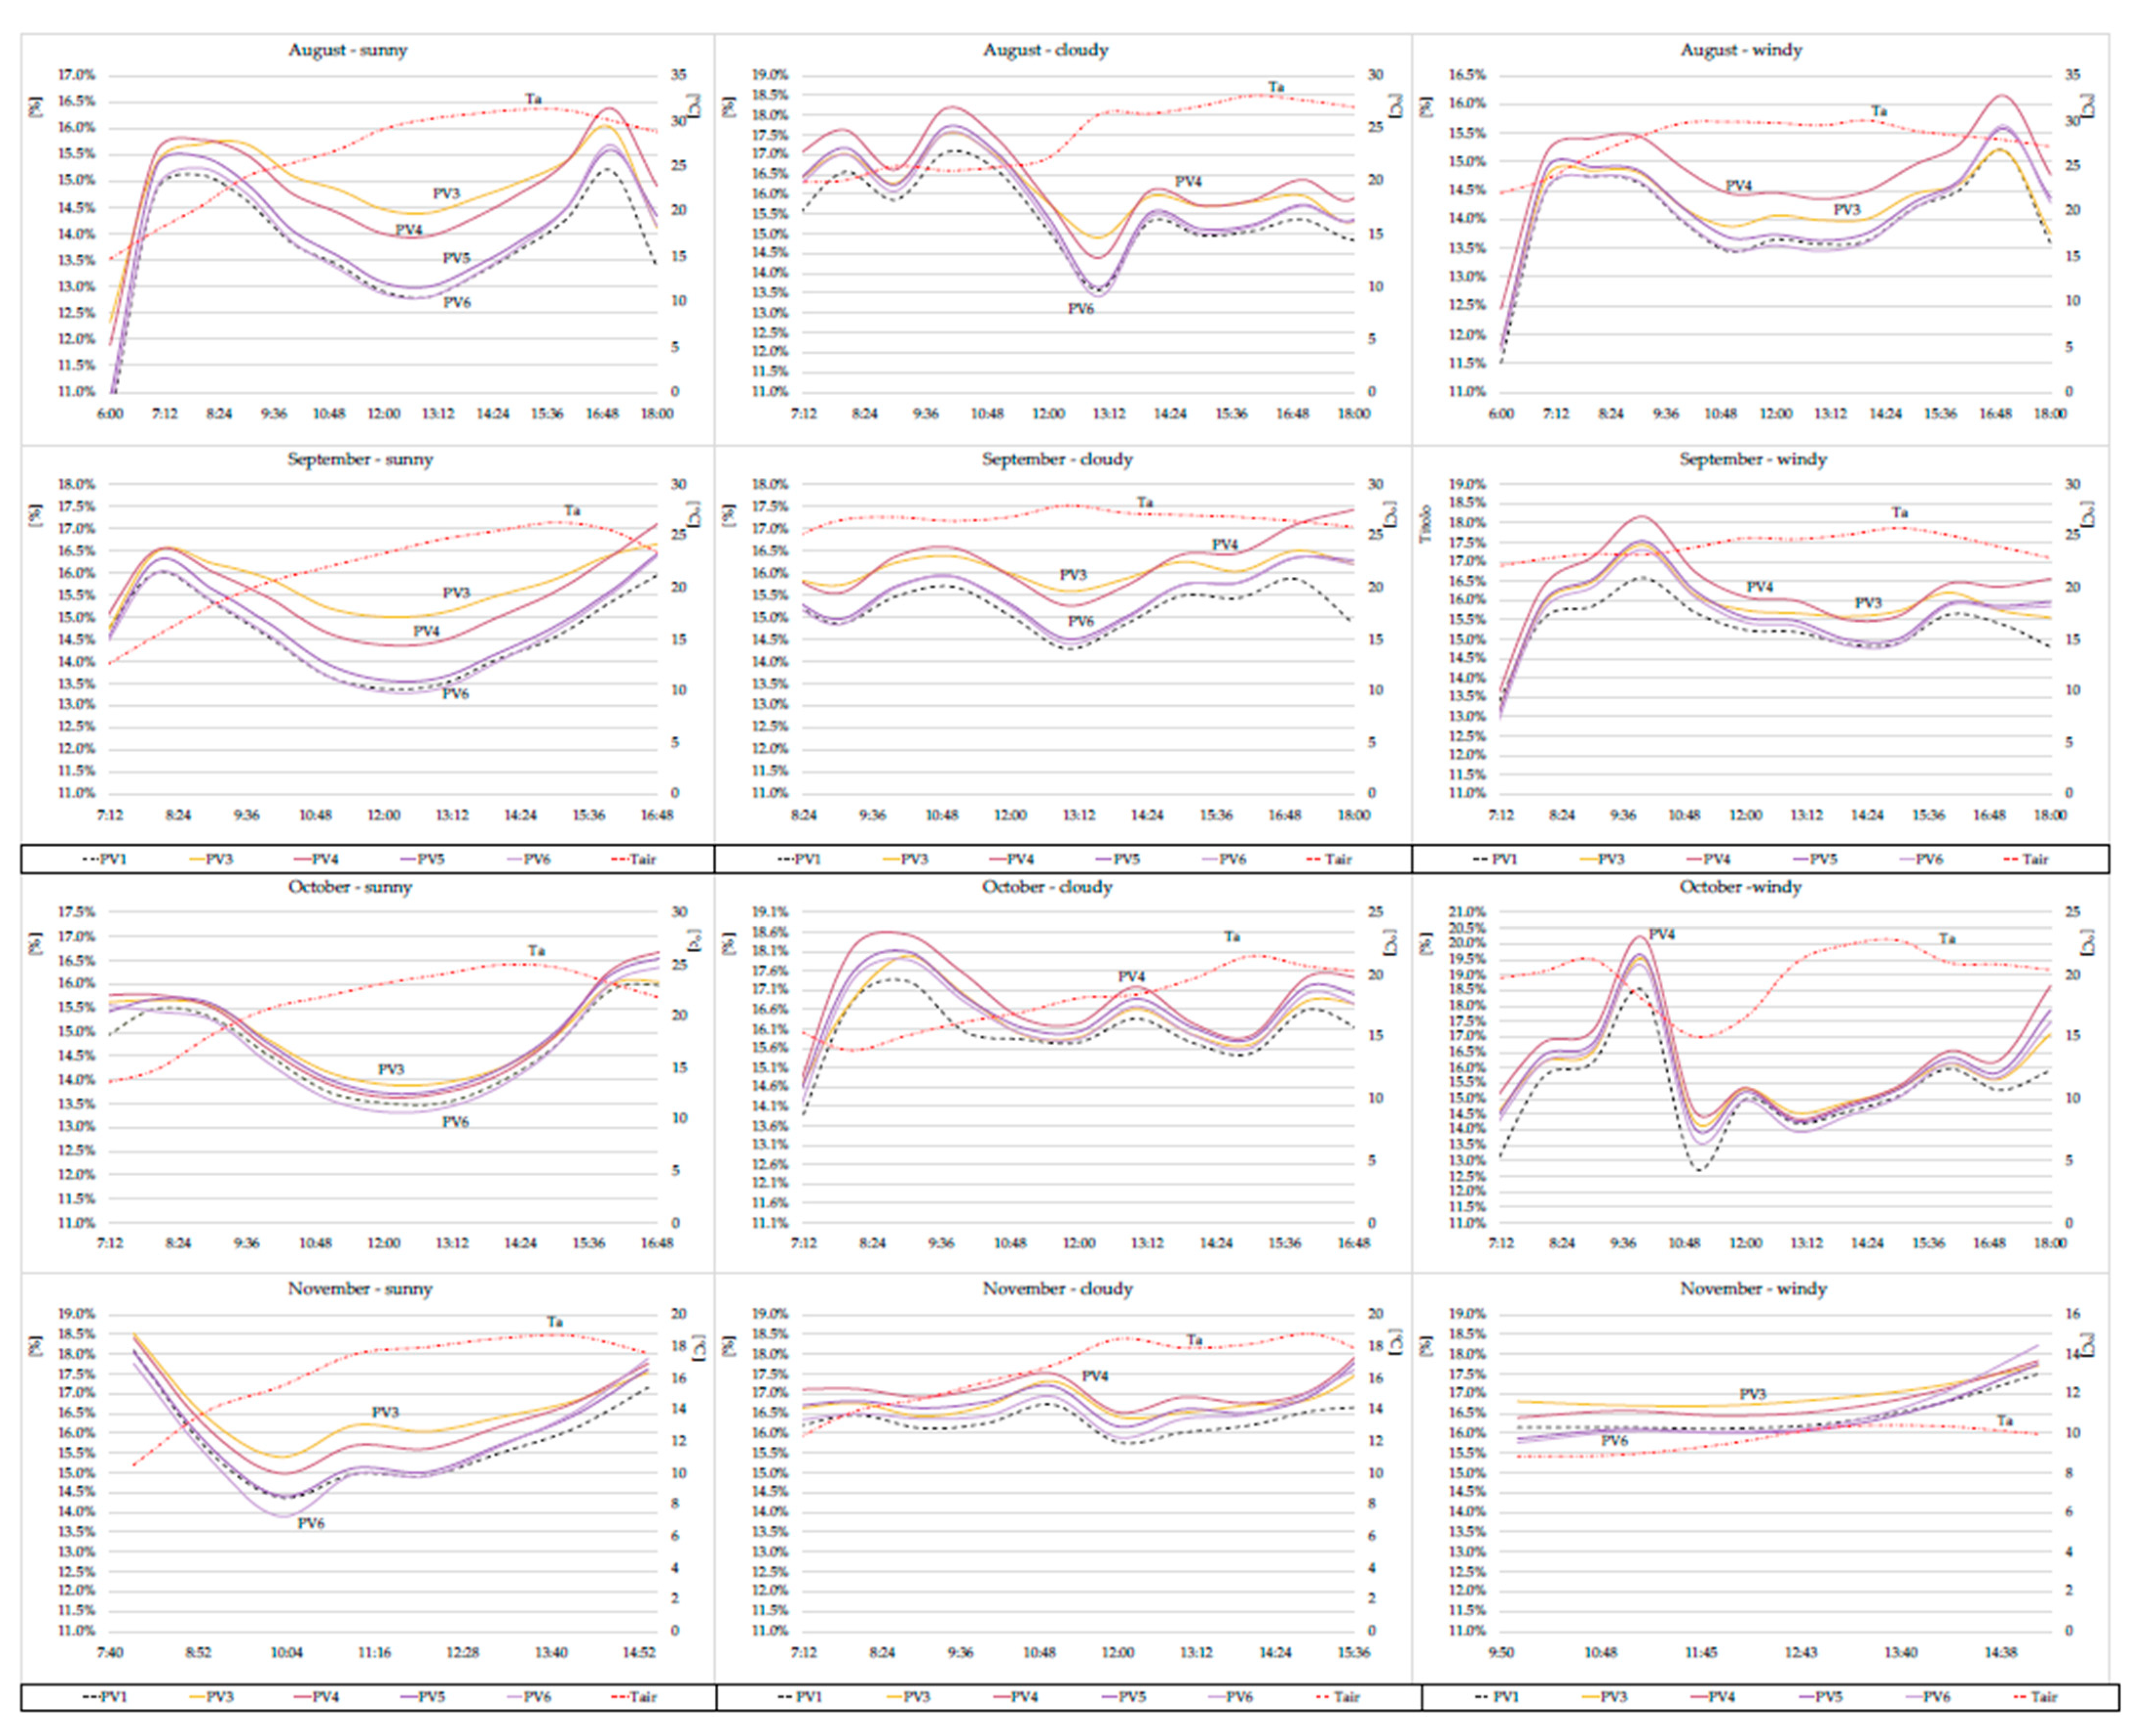
In summer sunny days (Figure 5), the efficiency curves showed a typical pattern with a consistent drop during the hottest hours and a minimum reached around 13:00. The shape of the curves is mainly determined by the trends of solar radiation and external air temperature. In fact, the efficiency decreases with solar radiation increase, to reach its minimum around noon. The higher the solar radiation the higher the thermal power generated from the PV panel determining an increment in cells temperature with a consequent degradation of the conversion efficiency. In August, the greatest efficiency increment was found for PV3 system that was capable to maintain higher efficiency than the other systems, with a value, in the most critical hour of the day, of 14.4% when the reference module showed an efficiency of 12.8%. At the same hour, the other systems provided an efficiency respectively of: 14.0% for PV4, 13.3% for PV3, 13.0% for PV5, and 12.8% for PV6. The presence of the ventilation fan in PV5 systems generated a slight cooling effect, but the advantage is of the same magnitude of the deviances found in the preliminary analysis, so indicating no appreciable differences. In the PV6 module, evidently the forced ventilation was not able to induce a sufficient cooling flow rate, probably because of the interference of the spray cooling that hindered the formation of a proper flow, resulting in major stagnation of the air layer inside the metallic box and therefore determining a behavior almost equal to that of the reference system. On an August cloudy day there was a strongly discontinuous solar radiation that did not allow it to reach high output powers. The efficiency, on the other hand, showed high values for few hours after sunrise with low level of solar radiation and air temperature below 25 °C, because of the lower temperatures reached by the photovoltaic cells. The PV4 system determined, for the most part of the day, the higher efficiency curve with a value of 18.2% registered at 10:00 while at the same time PV1 showed the lowest value of all the systems, being 17.1%. When solar radiation and air temperature increased, the efficiency fell consistently to lower values, and the system PV3 was able to provide better performance than PV4. On the windy day, also characterized by adequate solar radiation, the best performance was obtained by the PV4 system. In the central part of the day (from 11:00 to 14:00) the electric efficiency increment, with respect to the reference module, was about 0.9%. The particular shape of the metallic plate allowed, in this meteorological condition, to provide a more adequate cooling of the back surface, whereas the simple spray cooling on PV3 could be compromised by the strong action of the wind that produced a dispersion of the water droplets that, instead, remain trapped in the metallic plate. The worst performances were achieved again by the PV6 system with a curve equal to that of PV1 for almost the whole day.
Results for the sunny day of September (Figure 5) substantially reflect those obtained in August both in terms of electric power and efficiency. The efficiency curves retrace the trends of August, except for the lower air temperature that determined a global shift toward slightly higher efficiencies. The PV3 system confirmed the best performance, followed by the PV4 and PV5 system. Again, the worst performance was achieved by the PV6 module that substantially overlapped the reference module curve and, in the last part of the day, declined even to lower values. On the cloudy day, the difference between PV3 and PV4 with other cooling systems stood out substantially during the course of the day. As already observed for results in August the PV4 efficiency was for most part of the day superior to PV3 one, except for few hours at noon where the PV3 efficiency prevailed. Again, this behavior is partly attributed to the slightly higher production of PV4 as observed in the base case test of the modules without cooling systems. In windy conditions the solar radiation was discontinuous, and the efficiency curves, because of the high wind speed, did not suffer an excessive drop when the air temperature and solar radiation were high, with a stable pattern from 12:00 onward.
On an October sunny day, the difference between the cooling systems was more limited. It is to be noticed that the performance of the PV6 module became worse than the reference system for almost the entire day, for the same reason exposed before. The PV3 cooling system was able to guarantee a small increase of efficiency during the hottest hour of the day, even though the differences between all the curves were not accentuated as in the previous months. At noon, the values registered were: 13.9% for module PV3, 13.5% for module PV1, and 13.4% for module PV6. In cloudy conditions the PV4 system prevailed again with an efficiency that overhung all the others curves. Generally, for all the systems, the efficiency registered in this day was higher, with values, aside from the early morning hours, always greater than 16%. In the windy day a consistent solar radiation is found from 12:00 forward, with an increase of air temperature and, as a consequence, the efficiency dropped from the high values assumed in the morning. However, because of the important convective heat transfer caused by the wind, the curves tended to align and showed a fairly stable trend during almost the whole day. Again, the PV4 system was confirmed to be the most performant in windy conditions, being markedly detached form the other curves that, instead, tended to overlap.
In the sunny day of November, the PV3 cooling system reached a value of 16.0% at the point of maximum insolation, compared to the value of 14.9% of the reference module. The efficiency curve of PV6 curve lied below that of PV1 until 12:00 highlighting the scarce results provided by this solution. On cloudy and windy days, the curve appears fairly stable, with a flat trend and the PV3 system showing the best solution with an efficiency almost always close to 17% in windy conditions.
On a sunny day of December (Figure 6) the efficiency curve of the PV3 system was markedly detached from the others maintaining a higher trend and a value of 16.4% at 12:00 compared to 15.5% of PV1, whereas the PV6 was able to produce an efficiency of 15.3%. On sunny days, the spray cooling system (PV3) was more effective in reducing the module back surface temperature and this is particularly evident from the shape of the efficiency curve that rises in the central part of the day, compared to the other systems, demonstrating its efficacy in presence of solar radiation. The presence of a metallic plate (PV4) increased the thermal resistance of the module limiting the heat dissipation of the back section, determining an increase of cell temperature and consequently a penalization of the efficiency. Still, the effect is positive with respect to the reference module, but with the already discussed consideration on deviances of the base case comparison in the previous paragraph. In cloudy conditions, the curves did not present the typical drop around midday, and again the best performance was obtained by the PV4 system with an efficiency of 18.0% at 11:00 against the value of 16.9% of the module PV1. In windy conditions, the module PV3 overturned the situation providing the best performance while PV5 and PV6 generally showed efficiencies lower than or comparable to the reference module. At the time of maximum power production, the efficiency registered values of 16.5% for PV3 and 15.5% for PV1. On January and February sunny days, no consistent differences between the cooling systems were appreciated. On cloudy days of the same months, the low solar radiation on the tilted plane of the panels determined a low module power production; however, an appreciable difference can be found between the efficiency curves. Both in January and February, the PV4 reported higher conversion efficiency with curves that appeared fairly stable during the central part of the day mainly because of the low external air temperature that did not exhibit significant oscillations. The PV4 system guaranteed efficiency always higher than 17.0% for the entire day in both months. In overcast conditions, with lower solar radiation levels, the heating rate of the PV cells is lower and, in this condition, the metallic plate can dissipate better the heat from the cells improving the convective heat transfer to the air, especially when the external air temperature is low. It has, however, to be kept into consideration the deviance due to manufacturing differences quantified in the previous section. Nevertheless, the positive effect of the cooling systems can be appreciated.
The consistent solar radiation registered in the march sunny day (Figure 6) determined higher output power profiles where the effect of the cooling systems, can be clearly appreciated. The efficiency curves showed significant differences, especially in the central part of the day. From 10:00 to 14:00 the efficiency of the PV3 module stayied over 15.2% whereas the reference system registered the value of 13.9% at 12:00. Again, the PV6 system reported the worst performance of all the analyzed systems with efficiencies even lower than the reference module. In cloudy conditions, as already observed in other months, the PV4 system performed better than the PV3 that was also surpassed by the forced ventilation system PV5 which determined an efficiency curve slightly higher. The differences in efficiency were less accentuated than the sunny day but still, aside from PV6 module, the cooling systems guaranteed an improvement of electric performances.
Finally, Table 4 reports the daily minimum and average efficiency registered for the different modules for the selected sunny days of each month.
It can be appreciated how the reference panel always showed the lowest daily minimum efficiency expect for the PV6 system, which, as also highlighted by the previous results, led to a worsening of the performances. On average the cooling systems on sunny days were able to improve the conversion efficiency with evident greater advantages in summer and spring days, where the increment was even 1% higher, rather than fall and winter days where the highest detected increment was lower than 0.5%, to a minimum of 0.3% in February. It is also interesting to note the overall effect of air temperature on PV efficiency. In colder winter months the registered daily average efficiency was noticeably higher, reaching values even higher than 16.0% in November and December.

3.3. Energy Production and Average Efficiency

The average daily electric production and the average daily efficiency of the five PV modules are reported in Table 5 for each month. Generally, the average daily efficiency of PV3 and PV4 systems was very similar and sometimes equal. As already observed, according to the meteorological condition, the best performances were obtained alternatively by PV3 and PV4 systems, with PV3 being more performant on sunny days, while PV4 was on cloudy and windy days. The cooling system applied on the PV6 module often provided the same efficiency as the reference one, if not even worse. PV5 showed intermediate performances.
The reference module showed a variable efficiency with a minimum daily average value of 12.1% reached in September and a maximum of 16.4% in January. It is possible to appreciate that all the proposed systems were able to increase the conversion efficiency; the highest absolute increment of 0.93% was found in September for the PV3 system (conversion efficiency of 13.0%). The PV4 system provided comparable performance with the PV5 system that settled just below, showing smaller increments from August to November and March, but with slightly better performance from December to February. Lastly, the PV6 system did not provide significant variation of electric efficiency, with a maximum efficiency increment of 0.2% in January and a decrement of 0.04% in March. In terms of average daily energy production, the best performances were achieved by PV3 cooling systems, immediately followed by PV4, PV5, and PV6 systems. In hotter months, such as August the PV3 and PV4 provided a monthly increment of 6.4% and 6.3%, respectively. The increment provided by the PV5 module was quite moderate (1.4%). The PV6 system did not provide a significant increment of the electric energy production (0.2%). In September the PV3 system guaranteed the highest electric energy percentage increment in the whole analyzed period (8.0%), followed by PV4 (6.1%) and the other systems with restrained improvements. In colder months the performances globally dropped. The best results were again achieved by the PV3 system in November (4.6%) and December (4.4%) and PV4 system (3.7% and 3.3%, respectively, in the same months) with much more contained improvements for the other systems (1.0 % for PV5 in November). The months of January and February saw a further drop of the performances, even for PV3 and PV4. In these months the PV4 system was able to overcome PV3, mainly because of the predominant cloudy conditions, providing an increment of 2.2% in January and of 1.7% in February compared to 1.4% and 1.6%, respectively, reached by PV3. In March the performances tended to rise again with a prevalence of PV3 (4.0%) on PV4 (3.0%). The PV6 system performances were very substandard with energy production, in some months, even lower than the reference system, such as −0.31% in November and −0.5% in March. It is worth noting that the daily electricity consumption of the fan ranged between a minimum value of 1.1 Wh (January and February) and a maximum value of 10.5 Wh in August. Consequently, the PV5 system produced in every month an energy output growth always greater than the fan consumption. Conversely, the PV6 system was able to produce a positive energy balance only in December and January.
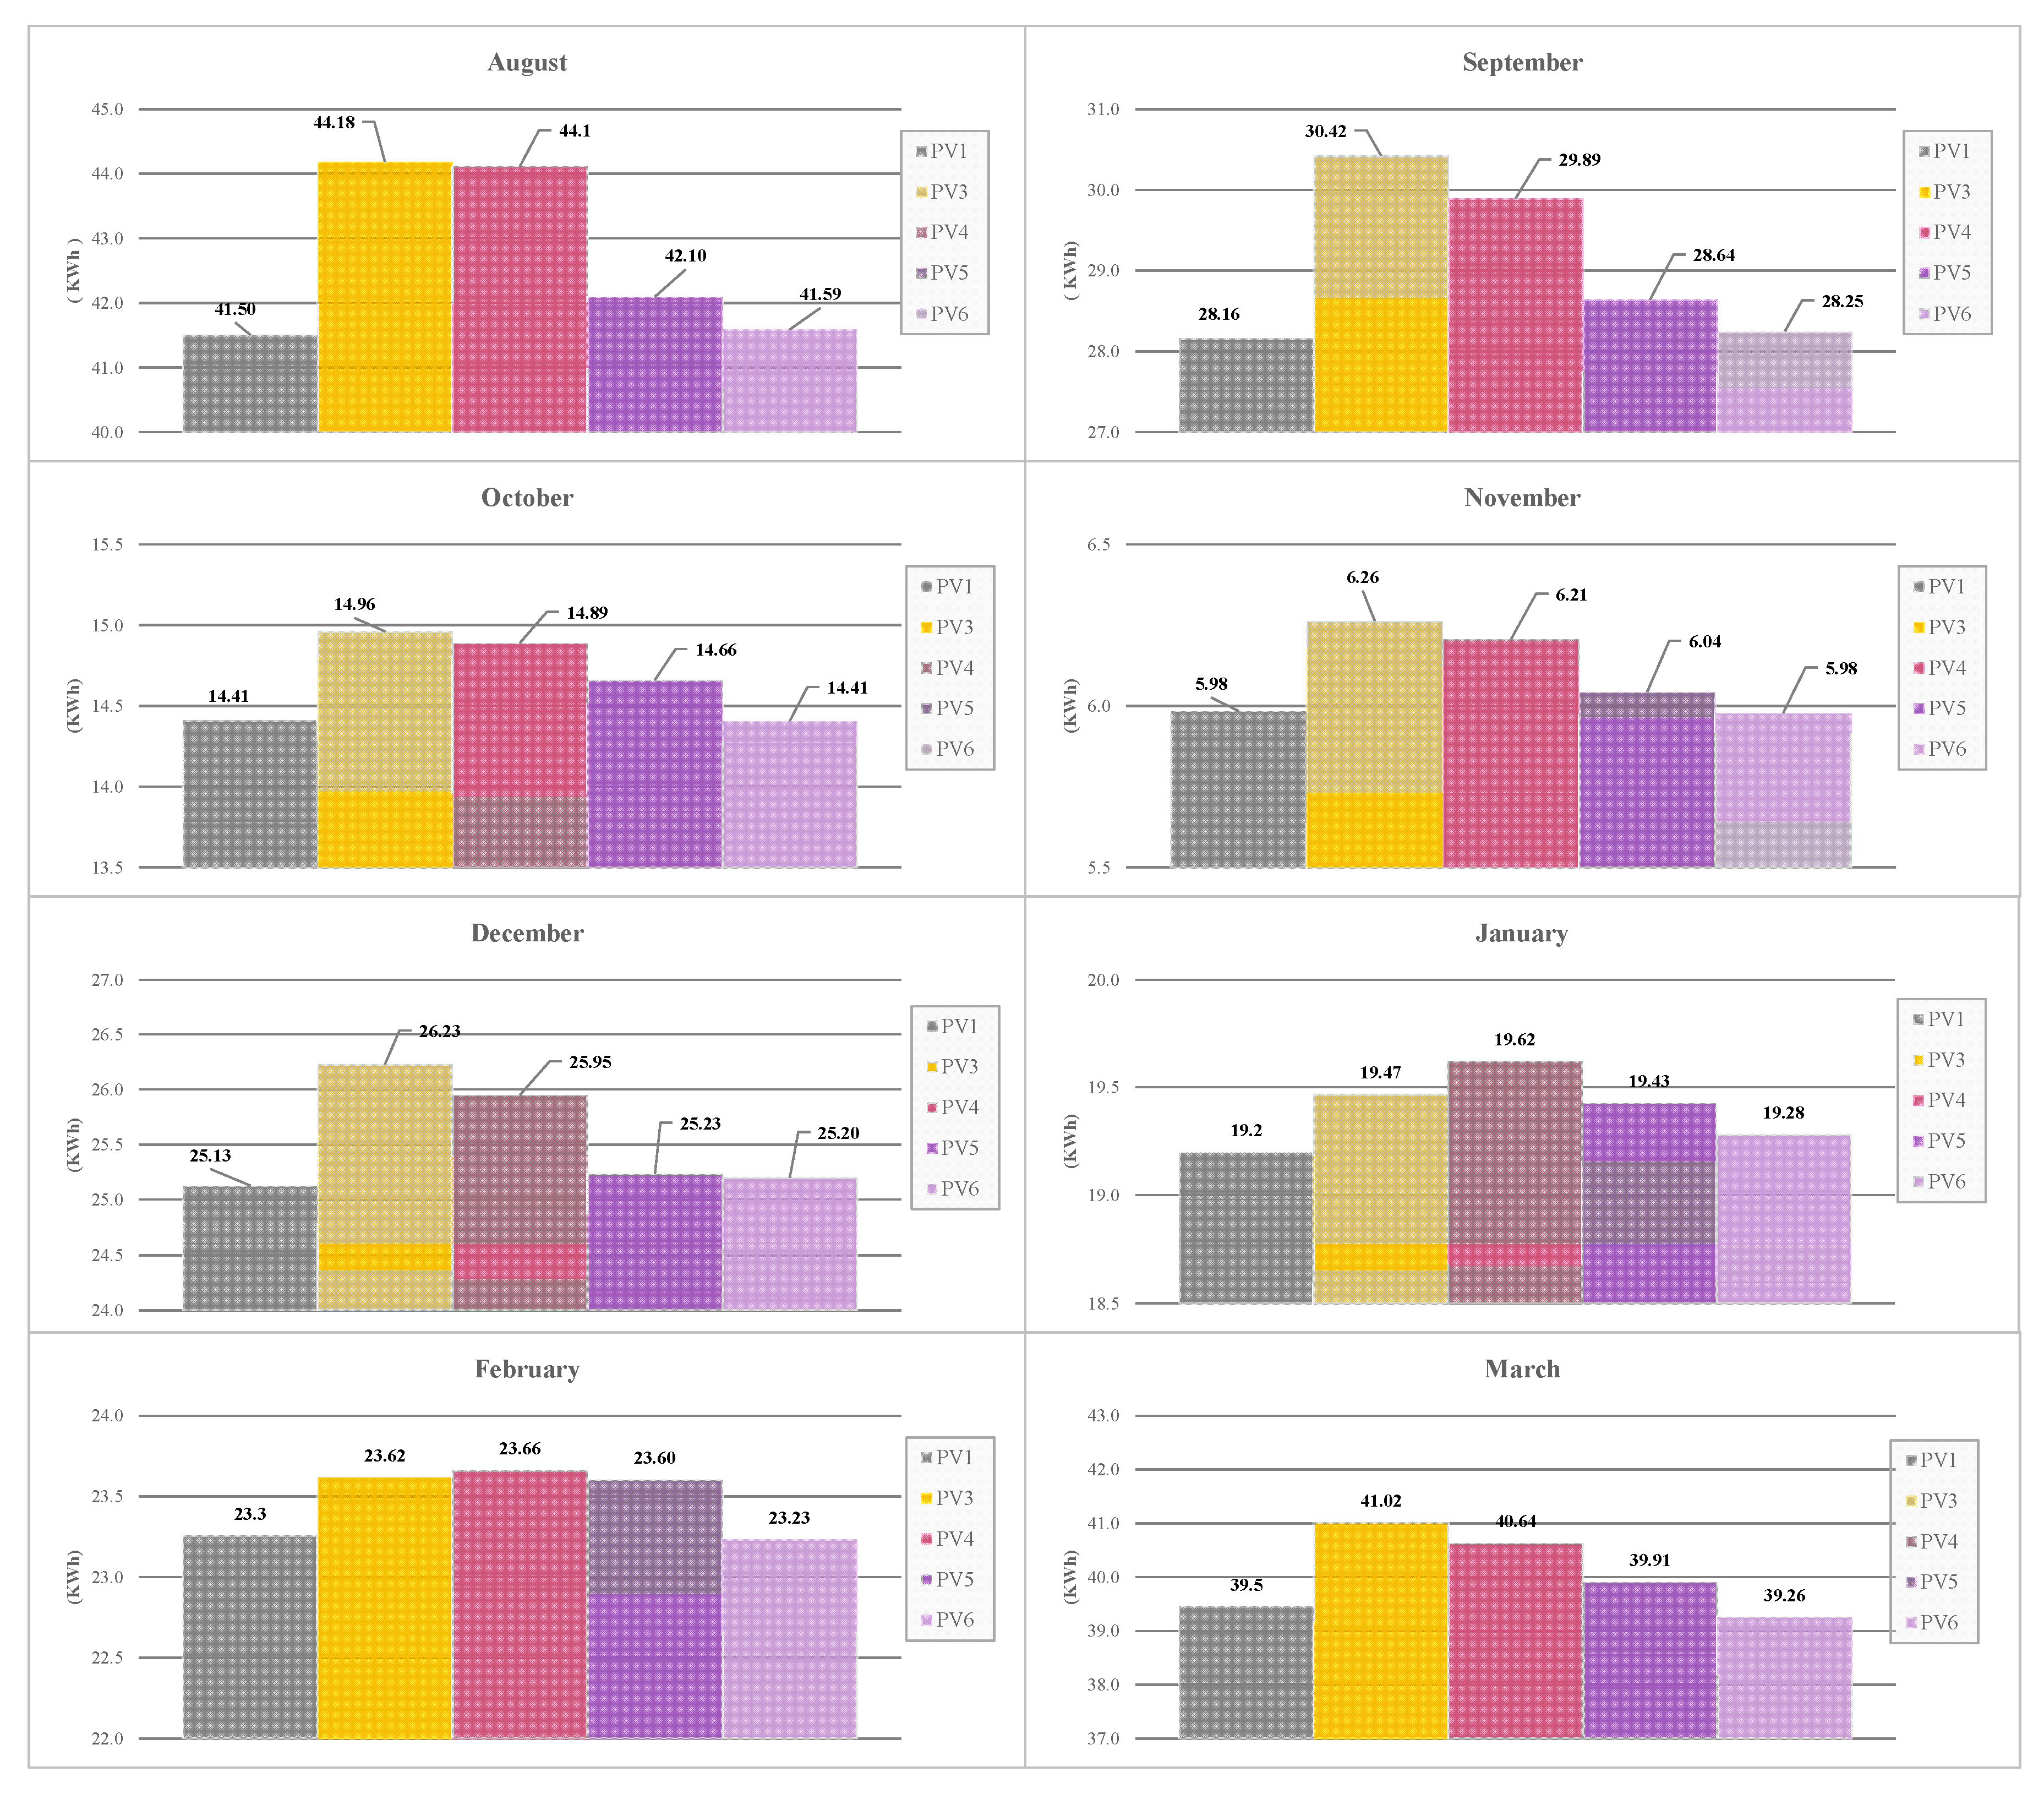
The monthly electric energy produced by the five modules is reported in Figure 7. It is possible to appreciate that greater increments are found for the hottest months of August and September and how the spray cooling system of module PV3 showed the best results in most of the analyzed period.
Finally, the total energy produced by the six modules is reported in Figure 8.
The global performances of the different cooling techniques implemented in the four photovoltaic modules, considering the whole period of analysis, resulted in a total increment of energy produced of 4.6% for PV3, 4.0% for PV4, and 1.3% for PV5. The increment detected for PV6 was lower than 0.1%.

3.4. Economic Implications of the Cooling Systems

The proposed cooling systems offer advantages in terms of greater energy electric production but require as well some inputs to operate. A final assessment of the cost-benefit of each solution is proposed to allow to identify the most convenient system from an economic point of view. As already demonstrated by the previous results, the PV6 system was not able to provide any substantial improvement in the electricity productions, so it will not be considered in the following analysis.
The cooling systems were designed to require low auxiliary energy and a low installation cost. In the following analysis the following costs, obtained as average on the national territory, were considered:
  • The cost of the electric energy is assumed 0.36 €/kWh;
  • The cost of water for PV cooling is assumed 0.5 €/m3.
Considering the operation of the spray cooling in PV3 and PV4 systems, and the nozzle flow rate reported in Section 2.2, the average daily water consumptions for the two cooling systems are reported in Table 6.
Accordingly, considering the power employed by the DC fan of the PV5 system, the average daily energy consumption for fan operation is reported in Table 7.
Finally, according to previous results, the monthly electric energy increments provided by each cooling system can be quantified as the difference between the amount produced by the different system and the reference module PV1, and assuming the above-mentioned electric energy cost the results in Table 8 can be obtained.
Results of the economic analyses showed that economic advantage is achievable for spray cooling-based systems, whereas the use of forced ventilation does not appear profitable, providing in all the considered months an expense rather than a profit. It is also interesting to note that in colder months of January and February, the employment of spray cooling was inconvenient since it produced negative advantages. Evidently, the cost of water for spray cooling does not compensate for the economic gain due because of the overall low energy production in the winter months.
However, it has to be highlighted that the results refer to a basic cooling strategy and to a preliminary investigation, where the spray cooling and the fan operation was provided for the entire daylight every month without any sophisticated algorithms. It is foreseeable that when a proper control strategy is applied, based on the temperature reached by the module rear surface and contemplating the cooling operation in central hours of the day, more evident economic advantages can be obtained.

4. Conclusions

Four different cooling systems operating on the back surface of PV modules, to overcome the increase in cell temperatures, have been proposed and compared with a reference module. The cooling devices were designed with the aim to improve the efficiency of the module and limit the auxiliary energy requested and were based on the spray cooling and forced convection phenomena. Although it is very difficult to achieve an increase in PV performance avoiding any energy waste, some of the proposed cooling systems demonstrated satisfactory results. The data presented, on an hourly level, results obtained in different meteorological conditions of a long experimental campaign of data acquisition conducted in several months.
The average daily efficiency in sunny days in the whole monitored period reached the maximum increment in September with values of 16.0% and 15.9% for PV3 and PV4, respectively, while the reference module exhibited a value of 14.9%. The fan-based system showed in the same days more contained results that did not overcome an increase of 0.5%. On a monthly average basis, lower increments were detected with the PV3 system performing better in hotter months with an efficiency of 14.3% in August and 13.0% in September, compared to 13.5% and 12.1% of the reference module, while the PV4 system provided the best performance in the colder months of January and February with an efficiency of 16.9% and 16.1% compared to 16.4% and 15.7% of the reference PV1.
In terms of daily energy, the highest performances were found for the same system in the summer months, with a production augment of 8.0% in September and 6.4% in August. The system with the additional metallic plate (PV4) was able to provide in the same months, increments of 6.1% and 6.3%. The scarcest performances were obtained by the two modules equipped with forced ventilation systems that in the whole analysis period with increments of daily electric energy less than 1.7% (PV5) and 0.4% (PV6).
We concluded that:
  • The use of the metallic surface placed under the module is not recommended, since it improves the module efficiency on cloudy days where the electric production is already limited by the low available solar radiation;
  • More complex systems based on forced ventilation or combined spray cooling and forced ventilation did not result as a promising and viable option, with very scarce energy performance and negative economic revenue;
  • The most cost-effective solution appears to be the use of spray cooling, with simple installation and a rather low cost, that guaranteed a consistent increment of the electric performance of the PV module.
The economic analysis confirmed the positive results achieved by the spray cooling systems that were able to generate economic profits in hotter months, whereas the forced ventilation system was not able, in its present configuration, to determine economic advantages. It is worth noting that the proposed cooling systems can be programmed with more sophisticated and optimized control strategies that can generate greater positive economic scenarios and that in a future perspective of a more volatile electricity price, the power growth can be planned when the electricity sell price is favorable, in order to augment the economic convenience.

Author Contributions

Conceptualization N.A., P.B., R.B. Methodology S.P., D.C., P.B., R.B. Formal analysis S.P., D.C., P.B., R.B. Investigation, P.B. Data curation S.P., D.C., P.B. Writing—original draft preparation P.B. Writing—review and editing P.B., R.B. Visualization P.B., R.B.; supervision N.A. Project administration N.A. Funding acquisition N.A. All authors have read and agreed to the published version of the manuscript.

Funding

This research was partially funded by the Italian Ministry of Education, University and Research (MIUR) by means of the National Operational Programme (PON) through the project PON04a2_E “SINERGREEN e RES NOVAE—Smart Energy Master for the energy governance of the territory”.

Conflicts of Interest

The authors declare no conflict of interest.

References

  1. Telichenko, V.; Benuzh, A.; Eames, G.; Orenburova, E.; Shushunova, N. Development of Green Standards for Construction in Russia. Procedia Eng. 2016, 153, 726–730. [Google Scholar] [CrossRef] [Green Version]
  2. Korol, S.; Shushunova, N.; Shushunova, T. Indicators of the resource efficiency development in Russia. In MATEC Web of Conferences; EDP Sciences: Les Ulis, France, 2018; Volume 193, p. 05075. Available online: https://www.researchgate.net/publication/327116686_Indicators_of_the_resource_efficiency_development_in_Russia (accessed on 8 February 2021).
  3. Shushunova, T.; Shushunova, N.; Pervova, E.; Dernov, R.; Nazarova, K. Tendencies of the Green Construction in Russia. In Proceedings of the IOP Conference Series: Materials Science and Engineering, Prague, Czech Republic, 1–5 September 2020; Volume 960. [Google Scholar]
  4. Pirouz, B.; Palermo, S.A.; Maiolo, M.; Arcuri, N.; Piro, P. Decreasing Water Footprint of Electricity and Heat by Extensive Green Roofs: Case of Southern Italy. Sustainability 2020, 12, 10178. [Google Scholar] [CrossRef]
  5. Pirouz, B.; Turco, M.; Palermo, S.A. A Novel Idea for Improving the Efficiency of Green Walls in Urban Environment (an Innovative Design and Technique). Water 2020, 12, 3524. [Google Scholar] [CrossRef]
  6. Maiolo, M.; Pirouz, B.; Bruno, R.; Palermo, S.A.; Arcuri, N.; Piro, P. The Role of the Extensive Green Roofs on Decreasing Building Energy Consumption in the Mediterranean Climate. Sustainability 2020, 12, 359. [Google Scholar] [CrossRef] [Green Version]
  7. Pirouz, B.; Arcuri, N.; Pirouz, B.; Palermo, S.A.; Turco, M.; Maiolo, M. Development of an Assessment Method for Evaluation of Sustainable Factories. Sustainability 2020, 12, 1841. [Google Scholar] [CrossRef] [Green Version]
  8. Pirouz, B.; Arcuri, N.; Maiolo, M.; Talarico, V.C.; Piro, P. A new multi-objective dynamic model to close the gaps in sustainable development of industrial sector. In Proceedings of the IOP Conference Series: Earth and Environmental Science, Changsha, China, 18–20 September 2020; Volume 410, p. 012074. [Google Scholar]
  9. Gamayunova, O.; Radaev, A.; Petrichenko, M.; Shushunova, N. Energy audit and energy efficiency of modular military towns. In E3S Web of Conferences; EDP Sciences: Les Ulis, France, 2019; Volume 110, Available online: https://www.researchgate.net/publication/335065597_Energy_audit_and_energy_efficiency_of_modular_military_towns (accessed on 8 February 2021).
  10. Bać, A.; Nemś, M.; Nemś, A.; Kasperski, J. Sustainable Integration of a Solar Heating System into a Single-Family House in the Climate of Central Europe—A Case Study. Sustainability 2019, 11, 4167. [Google Scholar] [CrossRef] [Green Version]
  11. Nemś, A.; Nemś, M. Analysis and selection criteria of photovoltaic panels for DHW. In E3S Web of Conferences; EDP Sciences: Les Ulis, France, 2017. [Google Scholar]
  12. Ferraro, V.; Settino, J.; Cucumo, M.; Kaliakatsos, D. Parabolic Trough System Operating with Nanofluids: Comparison with the Conventional Working Fluids and Influence on the System Performance. Energy Procedia 2016, 101, 782–789. [Google Scholar] [CrossRef]
  13. Bruno, R.; Bevilacqua, P.; Longo, L.; Arcuri, N. Small Size Single-axis PV Trackers: Control Strategies and System Layout for Energy Optimization. Energy Procedia 2015, 82, 737–743. [Google Scholar] [CrossRef] [Green Version]
  14. Al-Amayreh, M.I.; Alahmer, A.; Manasrah, A. A novel parabolic solar dish design for a hybrid solar lighting-thermal ap-plications. Energy Rep. 2020, 6, 1136–1143. [Google Scholar] [CrossRef]
  15. Nemś, M.; Manikowska, A.; Nemś, A. Linear concentrating collector as an air heater in the heating system of building in Polish climatic conditions. In E3S Web of Conferences; EDP Sciences: Les Ulis, France, 2016; Volume 10, p. 64. Available online: https://www.researchgate.net/publication/309221526_Linear_concentrating_collector_as_an_air_heater_in_the_heating_system_of_building_in_Polish_climatic_conditions (accessed on 8 February 2021).
  16. Nemś, M.; Kasperski, J. Experimental investigation of concentrated solar air-heater with internal multiple-fin array. Renew. Energy 2016, 97, 722–730. [Google Scholar] [CrossRef]
  17. Nemś, M.; Kolasinski, P.; Kasperski, J. Solar High-Temperature Heat Accumulation System with ORC Generator. In Proceedings of the ISES Solar World Congress, Kassel, Germany, 28 August–2 September 2011; pp. 1–10. [Google Scholar] [CrossRef]
  18. Dabwan, Y.N.; Pei, G.; Gao, G.; Li, J.; Feng, J. Performance analysis of integrated linear fresnel reflector with a conventional cooling, heat, and power tri-generation plant. Renew. Energy 2019, 138, 639–650. [Google Scholar] [CrossRef]
  19. Cucumo, M.; Ferraro, V.; Kaliakatsos, D.; Nicoletti, F. Study of Kinematic System for Solar Tracking of a Linear Fresnel Plant to Reduce End Losses. Eur. J. Electr. Eng. 2019, 21, 393–400. [Google Scholar] [CrossRef] [Green Version]
  20. Devabhaktuni, V.; Alam, M.; Depuru, S.S.S.R.; Green, R.C.; Nims, D.K.; Near, C. Solar energy: Trends and enabling technologies. Renew. Sustain. Energy Rev. 2013, 19, 555–564. [Google Scholar] [CrossRef]
  21. Cucumo, M.; Ferraro, V.; Kaliakatsos, D.; Mele, M.; Nicoletti, F. Calculation model using finite-difference method for energy analysis in a concentrating solar plant with linear fresnel reflectors. Int. J. Heat Technol. 2016, 34, 337–345. [Google Scholar] [CrossRef]
  22. Islam, T.; Huda, N.; Abdullah, A.; Saidur, R. A comprehensive review of state-of-the-art concentrating solar power (CSP) technologies: Current status and research trends. Renew. Sustain. Energy Rev. 2018, 91, 987–1018. [Google Scholar] [CrossRef]
  23. Cucumo, M.; Ferraro, V.; Kaliakatsos, D.; Mele, M.; Nicoletti, F. Law of motion of reflectors for a linear Fresnel plant. Int. J. Heat Technol. 2017, 35, S78–S86. [Google Scholar] [CrossRef]
  24. Cucumo, M.A.; Ferraro, V.; Kaliakatsos, D.; Mele, M.; Nicoletti, F. Linear Fresnel plant with primary reflectors movable around two axes. Adv. Model. Anal. A 2018, 99–107. [CrossRef]
  25. Nicoletti, F.; Cucumo, M.A.; Ferraro, V.; Kaliakatsos, D.; Settino, J. Performance Analysis of a Double-Sided PV Plant Oriented with Backtracking System. Math. Model. Eng. Probl. 2020, 7, 325–334. [Google Scholar] [CrossRef]
  26. Evola, G.; Margani, G. Renovation of apartment blocks with BIPV: Energy and economic evaluation in temperate climate. Energy Build. 2016, 130, 794–810. [Google Scholar] [CrossRef]
  27. Antonacci, A.; Scognamiglio, V. Photosynthesis-based hybrid nanostructures: Electrochemical sensors and photovoltaic cells as case studies. TrAC Trends Anal. Chem. 2019, 115, 100–109. [Google Scholar] [CrossRef]
  28. Kikuchi, M.; Makmuang, S.; Izawa, S.; Wongravee, K.; Hiramoto, M. Doped organic single-crystal photovoltaic cells. Org. Electron. 2019, 64, 92–96. [Google Scholar] [CrossRef]
  29. Cui, X.; Li, Y.; Sun, N.; Du, J.; Li, X.; Yang, H.; Hao, X. Double perovskite Bi2FeMoxNi1-xO6 thin films: Novel ferroelectric photovoltaic materials with narrow bandgap and enhanced photovoltaic performance. Sol. Energy Mater. Sol. Cells 2018, 187, 9–14. [Google Scholar] [CrossRef]
  30. Munshi, A.H.; Sasidharan, N.; Pinkayan, S.; Barth, K.L.; Sampath, W.; Ongsakul, W. Thin-film CdTe photovoltaics—The technology for utility scale sustainable energy generation. Sol. Energy 2018, 173, 511–516. [Google Scholar] [CrossRef]
  31. Reddy, V.R.M.; Pallavolu, M.R.; Guddeti, P.R.; Gedi, S.; Reddy, K.K.Y.B.; Pejjai, B.; Kim, W.K.; Kotte, T.R.R.; Park, C. Review on Cu2SnS3, Cu3SnS4, and Cu4SnS4 thin films and their photovoltaic performance. J. Ind. Eng. Chem. 2019, 76, 39–74. [Google Scholar] [CrossRef]
  32. Albero, J.; Clifford, J.N.; Palomares, E. Quantum dot based molecular solar cells. Co-ord. Chem. Rev. 2014, 263, 53–64. [Google Scholar] [CrossRef]
  33. Kaltenbrunner, M.; White, M.S.; Glowacki, E.D.; Sekitani, T.; Someya, T.; Sariciftci, N.S.; Bauer, S. Ultrathin and lightweight organic solar cells with high flexibility. Nat. Commun. 2012, 3, 770. [Google Scholar] [CrossRef] [PubMed] [Green Version]
  34. Wang, S.; Duan, S.; Wang, Y.; Sun, C.; Wang, X.F.; Sasaki, S. ichi Chlorophyll-based organic solar cells with improved power conversion efficiency. J. Energy Chem. 2019, 38, 88–93. [Google Scholar] [CrossRef] [Green Version]
  35. Settino, J.; Sant, T.; Micallef, C.; Farrugia, M.; Staines, C.S.; Licari, J.; Micallef, A. Overview of solar technologies for electricity, heating and cooling production. Renew. Sustain. Energy Rev. 2018, 90, 892–909. [Google Scholar] [CrossRef]
  36. Manasrah, A.; Al Zyoud, A.; Abdelhafez, E. Effect of color and nano film filters on the performance of solar photovoltaic module. Energy Sources Part A Recover. Util. Environ. Eff. 2021, 43, 705–715. [Google Scholar] [CrossRef]
  37. Sargunanathan, S.; Elango, A.; Mohideen, S.T. Performance enhancement of solar photovoltaic cells using effective cooling methods: A review. Renew. Sustain. Energy Rev. 2016, 64, 382–393. [Google Scholar] [CrossRef]
  38. Hasanuzzaman, M.; Malek, A.; Islam, M.; Pandey, A.; Rahim, N. Global advancement of cooling technologies for PV systems: A review. Sol. Energy 2016, 137, 25–45. [Google Scholar] [CrossRef]
  39. Nižetić, S.; Papadopoulos, A.; Giama, E. Comprehensive analysis and general economic-environmental evaluation of cooling techniques for photovoltaic panels, Part I: Passive cooling techniques. Energy Convers. Manag. 2017, 149, 334–354. [Google Scholar] [CrossRef]
  40. Nižetić, S.; Giama, E.; Papadopoulos, A. Comprehensive analysis and general economic-environmental evaluation of cooling techniques for photovoltaic panels, Part II: Active cooling techniques. Energy Convers. Manag. 2018, 155, 301–323. [Google Scholar] [CrossRef]
  41. He, W.; Zhang, Y.; Ji, J. Comparative experiment study on photovoltaic and thermal solar system under natural circulation of water. Appl. Therm. Eng. 2011, 31, 3369–3376. [Google Scholar] [CrossRef]
  42. Amori, K.E.; Al-Najjar, H.M.T. Analysis of thermal and electrical performance of a hybrid (PV/T) air based solar collector for Iraq. Appl. Energy 2012, 98, 384–395. [Google Scholar] [CrossRef]
  43. Manasrah, A.; Alkhalil, S.; Masoud, M. Investigation of Multi-Way Forced Convective Cooling on the Backside of Solar Panels. Int. J. Energy Convers. (IRECON) 2020, 8, 181. [Google Scholar] [CrossRef]
  44. Ziapour, B.M.; Palideh, V.; Baygan, M. Performance comparison of four passive types of photovoltaic–thermal systems. Energy Convers. Manag. 2014, 88, 732–738. [Google Scholar] [CrossRef]
  45. Ji, J.; He, H.; Chow, T.; Pei, G.; He, W.; Liu, K. Distributed dynamic modeling and experimental study of PV evaporator in a PV/T solar-assisted heat pump. Int. J. Heat Mass Transf. 2009, 52, 1365–1373. [Google Scholar] [CrossRef]
  46. Ameri, M.; Mahmoudabadi, M.M.; Shahsavar, A. An Experimental Study on a Photovoltaic/Thermal (PV/T) Air Collector with Direct Coupling of Fans and Panels. Energy Sources Part A Recover. Util. Environ. Eff. 2012, 34, 929–947. [Google Scholar] [CrossRef]
  47. Tonui, J.; Tripanagnostopoulos, Y. Performance improvement of PV/T solar collectors with natural air flow operation. Sol. Energy 2008, 82, 1–12. [Google Scholar] [CrossRef]
  48. Teo, H.; Lee, P.; Hawlader, M. An active cooling system for photovoltaic modules. Appl. Energy 2012, 90, 309–315. [Google Scholar] [CrossRef]
  49. Kim, J.H.; Park, S.H.; Kim, J.T. Experimental performance of a photovoltaic-thermal air collector. Energy Procedia 2014, 48, 888–894. [Google Scholar] [CrossRef] [Green Version]
  50. Robles-Ocampo, B.; Ruíz-Vasquez, E.; Canseco-Sánchez, H.; Cornejo-Meza, R.; Trápaga-Martínez, G.; García-Rodriguez, F.; González-Hernández, J.; Vorobiev, Y. Photovoltaic/thermal solar hybrid system with bifacial PV module and transparent plane collector. Sol. Energy Mater. Sol. Cells 2007, 91, 1966–1971. [Google Scholar] [CrossRef]
  51. Evola, G.; Marletta, L. Exergy and thermoeconomic optimization of a water-cooled glazed hybrid photovoltaic/thermal (PVT) collector. Sol. Energy 2014, 107, 12–25. [Google Scholar] [CrossRef]
  52. Kumar, R.; Rosen, M.A. Performance evaluation of a double pass PV/T solar air heater with and without fins. Appl. Therm. Eng. 2011, 31, 1402–1410. [Google Scholar] [CrossRef]
  53. Browne, M.C.; Lawlor, K.; Kelly, A.; Norton, B.; Mc Cormack, S.J. Indoor Characterisation of a Photovoltaic/ Thermal Phase Change Material System. Energy Procedia 2015, 70, 163–171. [Google Scholar] [CrossRef] [Green Version]
  54. Huang, M.J.; Eames, P.C.; Norton, B. Phase change materials for limiting temperature rise in building integrated photovol-taics. Sol. Energy 2006, 80, 1121–1130. [Google Scholar]
  55. Atkin, P.; Farid, M.M. Improving the efficiency of photovoltaic cells using PCM infused graphite and aluminium fins. Sol. Energy 2015, 114, 217–228. [Google Scholar] [CrossRef]
  56. Indartono, Y.S.; Suwono, A.; Pratama, F.Y. Improving photovoltaics performance by using yellow petroleum jelly as phase change material. Int. J. Low-Carbon Technol. 2016, 11, 333–337. [Google Scholar] [CrossRef] [Green Version]
  57. Spertino, F.; D’Angola, A.; Enescu, D.; Di Leo, P.; Fracastoro, G.V.; Zaffina, R. Thermal–electrical model for energy estimation of a water cooled photovoltaic module. Sol. Energy 2016, 133, 119–140. [Google Scholar] [CrossRef]
  58. Bevilacqua, P.; Bruno, R.; Arcuri, N. Comparing the performances of different cooling strategies to increase photovoltaic modules electric in different meteorological conditions. Energy 2020, 195, 116950. [Google Scholar] [CrossRef]
  59. Bevilacqua, P.; Morabito, A.; Bruno, R.; Ferraro, V.; Arcuri, N. Seasonal performances of photovoltaic cooling systems in different weather conditions. J. Clean. Prod. 2020, 272, 122459. [Google Scholar] [CrossRef]
  60. Wang, Y.; Fang, Z.; Zhu, L.; Huang, Q.; Zhang, Y.; Zhang, Z. The performance of silicon solar cells operated in liquids. Appl. Energy 2009, 86, 1037–1042. [Google Scholar] [CrossRef]
  61. Han, X.; Wang, Y.; Zhu, L. Electrical and thermal performance of silicon concentrator solar cells immersed in dielectric liquids. Appl. Energy 2011, 88, 4481–4489. [Google Scholar] [CrossRef]
  62. Mehrotra, S.; Rawat, P.; Debbarma, M.; Sudhakar, K.; Centre, E.; Pradesh, M. Performance of a Solar Panel with Water Im-mersion. Int. J. Sci. Technol. 2014, 3, 1161–1172. [Google Scholar]
  63. Rosa-Clot, M.; Rosa-Clot, P.; Tina, G.M.; Scandura, P.F. Submerged photovoltaic solar panel: SP2. Renew. Energy 2010, 35, 1862–1865. [Google Scholar] [CrossRef]
  64. Abdulgafar, S.A.; Omar, O.S.; Yousif, K.M. Improving the Efficiency of Polycrystalline Solar Panel Via Water Immersion Method. Int. J. Innov. Res. Sci. Eng. Technol. 2014, 3, 8127–8132. [Google Scholar]
  65. Krauter, S. Increased electrical yield via water flow over the front of photovoltaic panels. Sol. Energy Mater. Sol. Cells 2004, 82, 131–137. [Google Scholar] [CrossRef]
  66. Moharram, K.; Abd-Elhady, M.; Kandil, H.; El-Sherif, H. Enhancing the performance of photovoltaic panels by water cooling. Ain Shams Eng. J. 2013, 4, 869–877. [Google Scholar] [CrossRef] [Green Version]
  67. Abdolzadeh, M.; Ameri, M. Improving the effectiveness of a photovoltaic water pumping system by spraying water over the front of photovoltaic cells. Renew. Energy 2009, 34, 91–96. [Google Scholar] [CrossRef]
  68. Odeh, S.; Behnia, M. Improving Photovoltaic Module Efficiency Using Water Cooling. Heat Transf. Eng. 2009, 30, 499–505. [Google Scholar] [CrossRef]
  69. Hachicha, A.A.; Ghenai, C.; Hamid, A.K. Enhancing the Performance of a Photovoltaic Module Using Different Cooling Methods. Int. J. Energy Power Eng. 2015, 9, 1106–1109. [Google Scholar]
  70. Irwan, Y.; Leow, W.; Irwanto, M.; Fareq, M.; Amelia, A.; Gomesh, N.; Safwati, I. Indoor Test Performance of PV Panel through Water Cooling Method. Energy Procedia 2015, 79, 604–611. [Google Scholar] [CrossRef] [Green Version]
  71. Nižetić, S.; Čoko, D.; Yadav, A.; Grubišić-Čabo, F. Water spray cooling technique applied on a photovoltaic panel: The per-formance response. Energy Convers. Manag. 2016, 108, 287–296. [Google Scholar] [CrossRef]
  72. Schiro, F.; Benato, A.; Stoppato, A.; Destro, N. Improving photovoltaics efficiency by water cooling: Modelling and experi-mental approach. Energy 2017, 137, 798–810. [Google Scholar] [CrossRef]
  73. Bahaidarah, H.M.S.; Subhan, A.; Gandhidasan, P.; Rehman, S. Performance evaluation of a PV (photovoltaic) module by back surface water cooling for hot climatic conditions. Energy 2013, 59, 445–453. [Google Scholar] [CrossRef]
  74. Zilli, B.M.; Lenz, A.M.; De Souza, S.N.M.; Secco, D.; Nogueira, C.E.C.; Junior, O.H.A.; Nadaleti, W.C.; Siqueira, J.A.C.; Gurgacz, F. Performance and effect of water-cooling on a microgeneration system of photovoltaic solar energy in Paraná, Brazil. J. Clean. Prod. 2018, 192, 477–485. [Google Scholar] [CrossRef]
  75. Nizetic, S.; Čabo, F.G.-; Marinić-Kragić, I.; Papadopoulos, A. Experimental and numerical investigation of a backside convective cooling mechanism on photovoltaic panels. Energy 2016, 111, 211–225. [Google Scholar] [CrossRef]
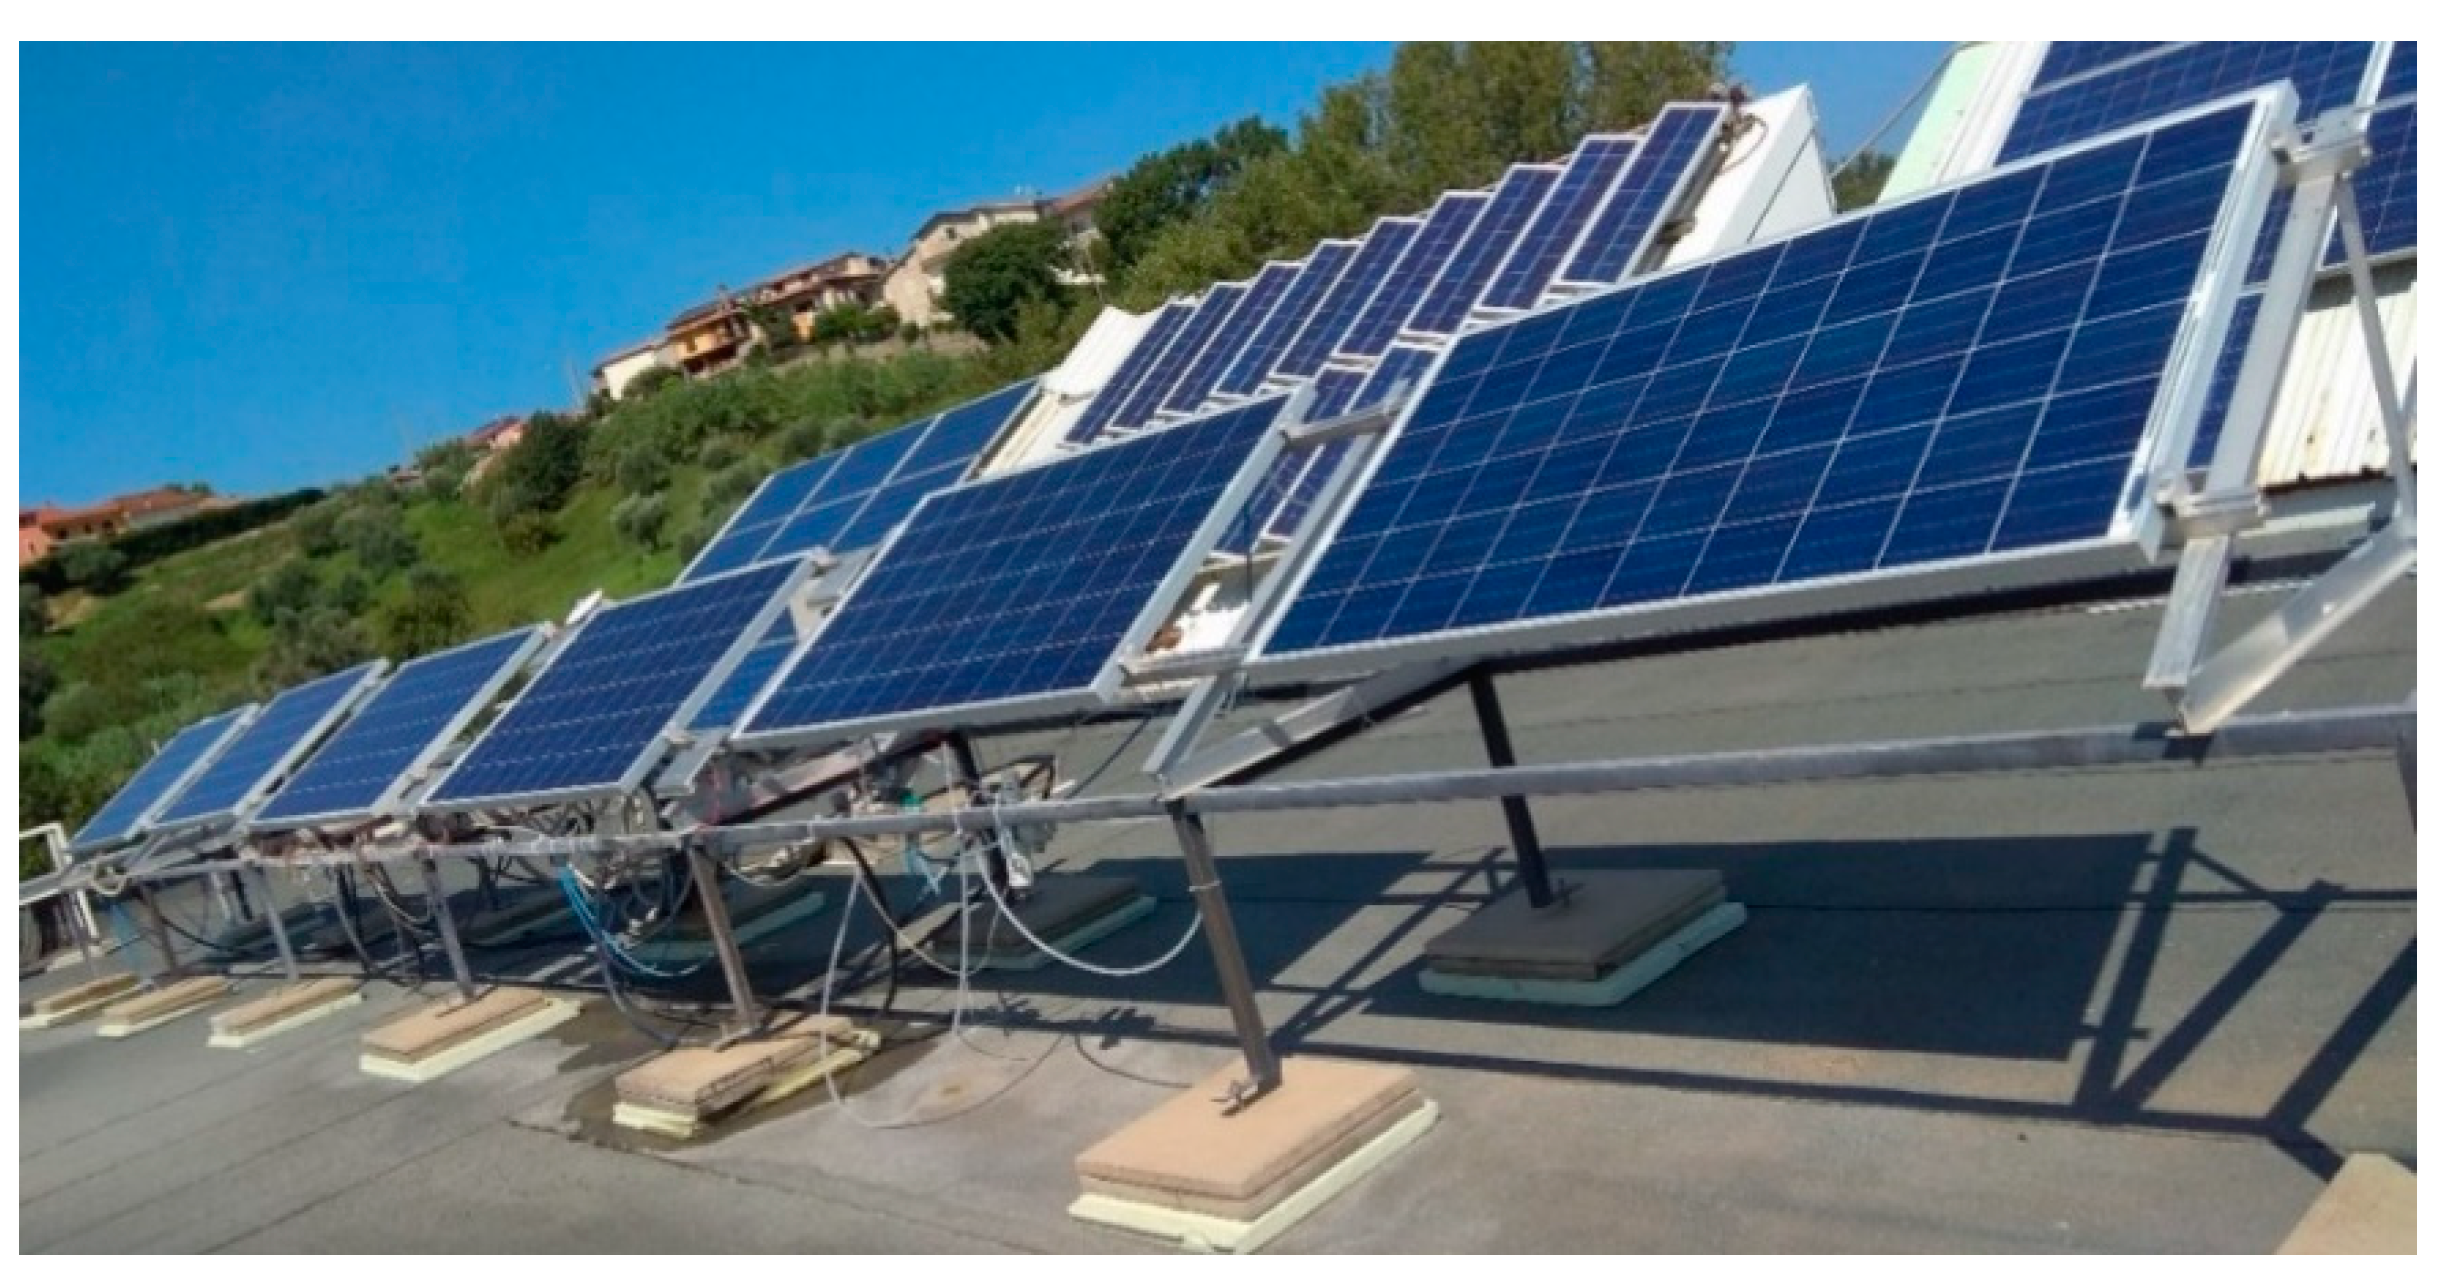
Figure 1. Experimental site overview.
Energies 14 00895 g001
Figure 2. Thin metallic plate installed on the module PV4 for temperature uniformity.
Energies 14 00895 g002
Figure 3. Ventilation system installed on the PV5 module.
Energies 14 00895 g003
Figure 4. Schematic representation of the different cooling systems implemented on the photovoltaic modules of the experimental set-up.
Energies 14 00895 g004
Figure 5. Electric efficiency of the reference module and the four modules equipped with cooling systems in three different climatic conditions for the months of August, September, October and November 2016.
Energies 14 00895 g005
Figure 6. Output power and electric efficiency of the reference module and the four modules equipped with cooling systems in three different climatic conditions for the months of December 2016, January, February and March 2017.
Energies 14 00895 g006
Figure 7. Monthly energy production of the reference module and the four PV modules equipped with the cooling systems.
Energies 14 00895 g007
Figure 8. Total energy produced by the reference module and the four PV modules in the entire period of analysis.
Energies 14 00895 g008
Table 1. Electric characteristics of the photovoltaic systems (PV) modules and Micro-inverter.
PV ModulesMicro-Inverter
Nominal power (W)245Maximum DC power (W)265
Output tolerance (%)+5/−0Operative DC input voltage (V)18…58
Rated voltage (V)29.9MPPT DC voltage range (V)20…50
Rated current (A)8.20Maximum DC input voltage (A)65
Open circuit voltage (V)37.41Maximum DC input current (A)10
Short circuit current (A)8.80Start voltage DC input (V)25
Temperature coefficient—Pmpp (%/°C)−0.43Nominal outlet AC power (W)250
Temperature coefficient—Isc (%/°C)+0.06Nominal outlet AC voltage (V)230
Temperature coefficient—Uoc (%/°C)−0.31AC output voltage range (V)180…264
Normal Operating Cell Temperature (°C)43 ± 2Maximum AC output current (A)1.2
Table 2. Sensors specifications.
TemperatureRelative Humidity Wind SpeedWind Direction
SensorPt 100 1/3SensorCapacitiveRange (m/s)0…75SensorNo contact hall
Range (°C)−50…70 Range (%)0…100 Accuracy 2.5 %Range (°)0…360
Accuracy (°C)0.1 (0 °C)Accuracy ±1.5 (RH5–95%)Threshold (m/s)0.5Accuracy (°)5
Table 3. Percentage difference in daily electric energy produced by the analyzed module with reference to PV1 and absolute daily average efficiency difference with module PV1.
DataΔPV3–1ΔPV4–1ΔPV5–1ΔPV6–1η3-η1η4-η1η5-η1η6-η1
01/05/20150.57%1.29%0.88%0.00%0.08%0.19%0.13%0.00%
02/05/20150.27%1.45%0.92%0.11%0.04%0.21%0.14%0.02%
03/05/20150.73%1.26%0.63%−0.28%0.10%0.18%0.09%−0.04%
04/05/20150.94%1.16%0.31%−0.61%0.13%0.16%0.04%−0.08%
05/05/20150.82%1.25%0.38%−0.61%0.11%0.17%0.05%−0.08%
06/05/20150.86%1.28%0.63%−0.38%0.12%0.17%0.09%−0.05%
07/05/20150.52%1.43%0.89%−0.03%0.08%0.20%0.13%0.00%
08/05/20150.79%1.31%0.74%−0.19%0.11%0.18%0.10%−0.03%
09/05/20150.65%1.35%0.88%−0.08%0.09%0.20%0.13%−0.01%
10/05/2015--------
11/05/20150.68%1.26%0.37%−0.70%0.10%0.18%0.05%−0.10%
12/05/20150.75%1.08%0.20%−0.95%0.11%0.16%0.03%−0.14%
13/05/20150.56%1.39%0.86%−0.03%0.08%0.20%0.12%0.00%
14/05/20150.41%1.44%0.95%0.06%0.06%0.21%0.14%0.01%
15/05/20150.64%1.34%0.78%−0.18%0.09%0.19%0.11%−0.02%
16/05/20150.12%1.52%0.57%−0.68%0.02%0.23%0.08%−0.10%
17/05/2015-0.42%1.95%0.76%−0.44%-0.07%0.31%0.12%−0.07%
18/05/20150.16%1.38%0.43%−0.86%0.02%0.21%0.06%−0.13%
19/05/20150.26%1.48%0.50%−0.45%0.04%0.22%0.07%−0.06%
20/05/20150.78%1.33%0.65%−0.25%0.11%0.18%0.09%−0.04%
21/05/2015-0.18%1.85%0.65%−0.41%-0.03%0.28%0.10%−0.06%
22/05/20150.40%1.47%0.96%0.23%0.06%0.22%0.14%0.03%
23/05/20150.07%1.61%0.86%−0.07%0.01%0.24%0.13%−0.01%
24/05/20150.34%1.63%0.92%0.05%0.05%0.24%0.14%0.01%
25/05/20150.46%1.49%0.97%0.18%0.07%0.22%0.14%0.03%
26/05/20150.58%1.46%0.75%−0.39%0.09%0.22%0.11%−0.06%
27/05/20150.18%1.58%0.70%−0.37%0.03%0.24%0.11%−0.06%
28/05/20150.20%1.54%0.73%−0.34%0.03%0.23%0.11%−0.05%
29/05/2015--------
30/05/20151.01%0.54%0.64%−0.31%0.14%0.08%0.09%−0.04%
31/05/20150.50%1.01%0.57%−0.50%0.07%0.15%0.08%−0.07%
Average0.47%1.38%0.69%−0.29%0.07%0.20%0.10%−0.04%
Table 4. Values of daily minimum and daily average efficiency of the different cooled modules for the sunny days selected for the analysis.
Minimum Hourly EfficiencyAverage Hourly Efficiency
PV1PV3PV4PV5PV6PV1PV3PV4PV5PV6
August12.8%14.4%14.0%13.0%12.8%13.7%14.8%14.7%14.0%13.8%
September13.4%15.0%14.4%13.6%13.3%14.9%16.0%15.9%15.2%15.0%
October13.5%13.9%13.6%13.7%13.3%14.7%15.0%15.0%15.0%14.7%
November14.9%16.0%15.6%15.0%14.9%16.3%16.5%16.9%16.4%16.3%
December15.5%16.4%15.9%15.3%15.3%16.2%16.3%16.7%16.2%16.2%
January14.9%15.2%15.0%15.0%14.7%15.4%15.7%15.8%15.8%15.6%
February13.9%14.2%14.0%14.1%13.8%15.2%15.8%15.7%15.7%15.5%
March13.9%15.2%14.6%13.8%13.7%14.4%15.3%15.1%14.6%14.4%
Table 5. Daily average electric energy, monthly electric energy, and daily average efficiencies of the six modules equipped with cooling systems.
Daily Average Energy (Wh)Daily Average Efficiency (-)
PV1 PV3PV4PV5PV6PV1 PV3PV4PV5PV6
August1338.81425.11423.01358.01341.50.1350.1430.1430.1370.135
September938.81014.1996.3954.6941.60.1210.1300.1280.1230.122
October *464.9482.6480.3472.9464.80.1270.1310.1320.1300.128
November *664.9695.8689.6671.6664.30.1510.1570.1570.1530.152
December866.4904.5894.8870.1868.90.1600.1670.1660.1620.161
January619.3628.0633.0626.7622.00.1640.1670.1690.1670.166
February830.6843.5845.0843.0829.70.1570.1600.1610.1610.158
March1272.71323.11310.91287.31266.30.1510.1570.1560.1530.151
* Some days are missing.
Table 6. Average daily water consumption for the spray operation of PV3 and PV4 systems in the considered monitoring period.
MonthNumber of Sprays per Dayl/day€/day
August15321.80.34
September14620.70.31
* October14620.80.18
* November10515.00.07
* December10915.40.22
January11516.30.25
February13318.900.27
March15121.520.33
* some days are missing.
Table 7. Average daily and monthly energy consumption of the fan in the PV5 system.
MonthNumber of Hours per DayWh/dayWh/month
August12.825.5790.5
* September12.124.3728.0
* October12.224.4414.2
* November8.817.5157.5
December9.018.0523.0
January9.619.1592.1
February11.122.1618.8
March12.625.2780.2
* some days are missing.
Table 8. Monthly energy increments produced by the cooling systems and economic benefits generated.
MonthΔPV3–1
kWh/month
ΔPV4–1
kWh/month
ΔPV5–1
kWh/month
PV3
€/month
PV4
€/month
PV5
€/month
August2674.42608.9593.60.620.60−0.07
September2259.11726.6475.80.500.31−0.09
* October549.2479.5250.10.020.00−0.06
* November277.8222.360.00.030.01−0.04
* December1102.4822.9106.50.170.07−0.15
January268.7423.6228.0−0.16−0.10−0.13
February362.8405.0347.8−0.13−0.12−0.10
March1563.91183.7452.70.230.09−0.12
* Some days are missing.
Publisher’s Note: MDPI stays neutral with regard to jurisdictional claims in published maps and institutional affiliations.