1. Introduction
Nowadays, the main purpose for vehicle manufacturers is the reduction of CO
2 and pollutant emissions. Since hybrid electric vehicles (HEVs) have shown a high potential to pursue this aim, if compared to conventional vehicles, their development is continuously improving [
1]. The way forward to achieve this outcome is the realization of a more sophisticated control strategy of the powertrain. A hybrid powertrain consists of a thermal unit (internal combustion engine—ICE), coupled to one or more electric units in series and/or parallel, connected to an energy storage device, generally a battery [
2]. Regardless of the hybrid architecture, a key role is played by the control strategy. Its task, once fixed, the power demand at the vehicle wheels is to determine the optimal power to be delivered/absorbed by the available units. As known, the focus for a control strategy is the minimization of the fuel consumption along a path, instead of decreasing, at each instant of time, the fuel flow rate.
Hybrid powertrains most frequently exhibit a disposition in parallel to the ICE and of an electric motor (EM). In such configurations, at each time, the control problem provides for the identification of the power-split (PS) between the units. Aiming to the more adaptable and efficient management of the phases to charge the battery, a second electric unit (electric generator—EG), linked to the thermal engine in series, is sometimes installed. Several optimization logics have been developed for HEV in order to maximize the fuel economy.
One of the most widespread approaches is the dynamic programming (DP) method [
3] that solves the problem numerically to identify optimal global behavior according to the complete speed profile and topology of a driving scenario [
4]. This procedure, in addition to being highly time-demanding, cannot be directly employed in a real-time application since it needs future event information. The DP, along with other methodologies, because of “a priori” knowledge of future data, is qualified as a global optimization strategy (GOS). This strategy can be effectively utilized to develop the design of a new powertrain architecture, and it is able to provide useful directions to define heuristic control strategies [
5]. To get around the problem of knowing the future events, the stochastic DP algorithm was developed by determining, over different driving cycles, the driver power demand sequence on the basis of the Markov chain [
6]. Nevertheless, the abovementioned DP variant is however affected by the computational matter for real-time implementation.
A different approach consists of the use of conventional analytical optimization methods to solve the problem of HEV energy management, e.g., the Pontryagin minimum principle (PMP) [
7]. It relies on the instantaneous minimization of the Hamiltonian function when determined the costate optimal trajectory. This method needs to know the driving mission to achieve the energy balance condition for the battery between the start and end of the driving mission, which is a regulatory requirement for HEV certification. Further, difficulties in the PMP application arise when including state constraints in the problem definition. A possible solution is to combine the PMP with a penalty function approach [
8]. The aim is to increase the Hamiltonian value whenever the optimal trajectory violates its constraints. An effective penalty approach through an implicit Hamiltonian minimization is employed in [
9] with several states and inputs under mixed input–state constraint.
The application of real-time local optimal solution leads to long optimization time and computational complexity [
10]. Because of these issues, to improve the efficiency of the optimization process, different solutions have been proposed, such as the application of an approximate PMP algorithm [
11]. Through the introduction of a simple convex approximation to the local Hamiltonian, this strategy, before deciding on the optimal control for the powertrain, only requires the calculation and comparison of five candidate Hamiltonians. Another crucial matter of these approaches is related to the operating domain discretization of the powertrain components, relying on the conflicting requirements of fine control and computational effort.
The above-described strategies can be upgraded to an online version, overcoming the problem due to the lack of information on future events. One of the most common methodologies is the equivalent consumption minimization strategy (ECMS) [
12], considered as an extension of the PMP [
13]. This approach aims to minimize online equivalent fuel consumption, also taking into account a contribution associated with the battery power consumption via an equivalence factor,
s0. To realize online applications, the adequacy is achieved by an adaptive
s0, modified by a fuzzy PI controller [
14], or by a correction term associated with the battery state of charge (SoC) [
15]. Another option for the correction is the use of a 2-dimensional look-up table, derived from an equivalence factor optimization and then applied for real-time adjustments [
16]. Once tuned, these approaches showed suboptimal performance, although quite similar to off-line approaches [
17,
18,
19]. Once more, if it is required a dense discretization to explore the performance maps of powertrain subcomponents, the computational time represents a remarkable issue.
In the light of the above evidence, the main purpose of this work is to develop a simplified control strategy, simultaneously featured by performance similar to PMP/ECMS one, but extremely efficient from a computational point of view compared to the above approaches. As highlighted by the analysis of the current literature [
9,
10,
11], the computational effort still remains an open point in the development of optimal control strategies, especially if those strategies are intended for real-time implementation. The computational efficiency is the most relevant aspect addressed in the development of the proposed strategy.
The power-split principle is not utilized, substituted by an alternate utilization of thermal and electric units named efficient thermal electric skipping strategy (ETESS). The choice between the traction modality, at each time, relies on the evaluation of an equivalent fuel rate considering pure electric driving, compared to actual fuel rate considering a pure ICE driving. The ETESS is employed in an “in-house developed” simulation platform and tested on a reference C-class vehicle, considering different powertrain variants and along different driving cycles. In the following, the tested HEV architecture and features are described, then the ETESS is detailed. Lastly, the outcomes of the proposed control strategy are processed and compared to PMP and ECMS methodologies, in off-line and online variants, respectively.
2. HEV Architecture
The powertrain architecture of the tested C-class vehicle is a combined series/parallel hybrid power-unit, as represented in
Figure 1. The powertrain is featured by an ultra-efficient ICE (labeled as engine 1), two electric motor/generator units (EM and EG), a battery (Ba), three clutches (Cl
1–3) and two gearboxes (GB
1–2). The main data concerning the vehicle and the powertrain components are collected in
Table 1 [
20,
21]. Due to the presence of three clutches, the powertrain can flexibly switch between series and parallel modes, excluding the mechanical connection with the components which are not used, to minimize the losses. In the series modality, the EM moves the vehicle, while in parallel mode, both thermal engine and EM are used to fulfill the power demand at the wheels. In this last case, the most common optimal control strategies involve a power-split between EM and ICE. In both series and parallel modes, the battery can be charged through the EG. The regenerative braking is made by EM.
This work deals with a prototype vehicle, equipped by a very efficient ICE (engine 1), under development [
22], and whose features are listed in
Table 2. The main feature of engine 1 is to operate in ultra-lean conditions, resulting in very high efficiencies over the entire operating domain. The ultra-lean mixture is realized thanks to a two-stage boosting system composed of a variable geometry turbocharger and an E-compressor. The battery supplies the energy to move the E-compressor, as schematically represented in
Figure 1 by a red dashed link which connects Ba and ICE icons.
The model-estimated brake specific fuel consumption (BSFC) map of engine 1 is reported in
Figure 2a. This last also shows an intermediate black dashed line that corresponds to a smaller engine characterized by a halved rated torque. The map of the power consumption of the E-Compressor is shown in
Figure 2b. The efficiency maps of EM and EG were generated with an electric motor map creation tool in Simcenter Amesim [
23]. These maps, depicted in
Figure 3a,b, are representative of typical synchronous electric motors under 400 V. The efficiency maps and the maximum torque are modeled assuming a perfect symmetry of the performance for motor/brake operations. This means that the maps in
Figure 3a,b are also representative of efficiency with a negative torque, and the maximum absorbed torque is equal to the maximum delivered torque.
Aiming at testing the robustness of the proposed control strategy, as said, some analyses are performed with a more conventional turbocharged downsized stoichiometric engine, labeled as engine 2 [
24], whose BSFC map is shown in
Figure 4.
5. Description of the Efficient Thermal Electric Skipping Strategy
As opposed to the power-split concept, the basic idea of ETESS is to alternatively employ the electric units and thermal engine to fulfill the power demand at the vehicle wheels,
Pdem. The choice between the power units is realized, at each time, comparing the actual fuel consumption of the thermal engine that operates to fully satisfy the power demand,
, and equivalent fuel consumption,
, related to a vehicle pure electric driving. While the first fuel rate,
is straightforwardly calculable, the definition of the second one is the most critical issue for the strategy implementation. The value of
, for each available gear ratio,
nGB1, is based on the power demand,
Pdem, and on the losses in the GB
1 and in the differential (see power flux in
Figure 5a), resulting in the following expression:
where
ηGB1 is the efficiency of GB
1 and BSFC is the actual fuel consumption of the engine that operates with the load and speed enforced by the vehicle speed and by
Pdem.
The idea to identify the fuel rate
is that in a pure series-electric driving, the power delivered by the EM is produced by the thermal engine in an undefined time, and working in its optimal operating point, featured by a BSFC
min. In a pure series driving, the power flux from the thermal engine to the wheel entails some losses in the EG, in the EM, in the battery, in the GB
2, and in the differential, and it can be quantified by the efficiencies of each component (see power flux in
Figure 5b). In a pure electric mode, the equivalent fuel consumption is thus defined by multiplying
Pdem and an “adapted” BSFC
min, corrected by the abovementioned efficiencies to consider the losses from the ICE to the wheels.
where
ηGB2,
ηEG,charge,
ηEM and
ηdiff are the efficiencies of GB
2, EG, EM, and differential, respectively, and
c0 is a tuning constant. Note that
ηEG,charge represents the EG efficiency computed in the torque-speed couple where the battery charge occurs, which in turn depends on the engine operating point of minimum BSFC. The tuning constant
c0 is introduced to achieve the energy balance for the battery, as expressed by Equation (6). The choice between either pure thermal or electric driving is carried out based on the inequality below:
In this comparison, the gear ratio which involves the lowest fuel consumption is chosen for the definition of
. If the maximum power delivered by the thermal engine for a certain gear ratio,
PICE,max (
nGB1), is lower than the power demand, the fuel rate is corrected as:
where the first term of Equation (13) is the fuel rate when the engine operates at its maximum power and the second term,
, represents an equivalent fuel consumption needed to fulfill the power demand with the support of the electric motor. This is expressed by Equation (14).
A simplified explanation of the ETESS principle can be associated with a specialization of the ECMS, where the only acceptable values for the power-split are either 0 or 1. Even if introducing this simplification means to realize a certain fuel economy penalization, a drastic decrease in the computational effort is expected. This tradeoff between computational effort and fuel economy will be illustrated in
Section 7.
Returning to the ETESS logic description, once the wheel power demand becomes negative, regenerative braking is realized by the EM.
A flowchart summarizes the ETESS logics in
Figure 6. This underlines the choice between a pure electric or thermal driving, based on the fuel rates
and
, and the activation of a parallel mode only when the ICE or the EM cannot fulfill by itself the power demand. Depending on this methodology, the battery charge is actuated, especially when the vehicle brakes rather than in a phase featured by positive power demand. Thus, it is possible to reduce as much as possible the energy flux from the ICE to the battery (throughout the electric units) with the aim to minimize the correlated unavoidable mechanical and electrical losses.
Along a driving cycle, if the torque limits for each unit (thermal and electric) are not overcome, the only energy available to perform a pure electric driving is the one recuperated by the regenerative braking, while the thermal engine, once switched on, will provide the power strictly required to drive the vehicle.
According to the simple inequality of Equation (12), choosing between pure electric or thermal driving is straightforward, without requiring a discrete map exploration. To evaluate , the engine operating point is univocally identified by the vehicle speed, by the tractive power demand, and by the losses along the driveline from the wheels to the engine. Likewise, also the fuel rate for a pure electric driving is univocally defined by the vehicle speed, by the traction power demand, and by the losses along the driveline, and furthermore by the dissipations in the electric units.
Finally, it is worth highlighting the versatility of the proposed control strategy, also considering its suitability to any hybrid powertrain fitted with a gearbox. The application here reported will represent just an example for a quite complex test case.
6. Issue for the Strategy Implementation in the Vehicle Simulator
For the PMP and ECMS implementations, a grid is defined for the exploration of the EM and EG efficiency maps, composed of 29 and 19 torque levels for each rotational speed, respectively. This choice represents a reasonable compromise between computational effort and the degree of accuracy of the solution, as proved by the parametric analysis discussed in the next section. No gridding is needed for access to the engine BSFC map since the engine load level is univocally identified by the power demand at the vehicle wheels and by the torque levels of the electric units, which in turn are iteratively explored by the above grids.
For the ETESS implementation, the power request for both EM, EG and ICE is univocally determined (once assigned the gear number), and for this reason, no gridding is required. This characteristic is expected to drastically improve its simulation time in comparison with PMP, ECMS or GOS in general. However, the ETESS undergoes a drawback analogous to the PMP one, i.e., the requirement of a priori knowledge of the speed-profile aimed at selecting the value of c0. Anyway, it can be easily extended to a real-time implementation introducing an adaptive correction for c0, similarly to the ECMS method.
Whatever is the employed strategy, either PMP, ECMS or ETESS, a minimum dwell time of 1 s for the vehicle state (gear number or driving mode—either series or parallel) is imposed, and a fuel consumption penalization of 0.5% is introduced in case of state variation. In this track, a battery power consumption is assumed when the engine is turned on (4.8 kW along 1 s). As known, the intensity of the above penalizations, on one side, allows to reduce control instabilities, but, on the other side, affects the overall fuel consumption over a driving mission. The selected intensities of the above penalizations aim to result in an as low as possible fuel consumption but would require some adjustments if the strategies are applied in more advanced simulation platforms (dynamics forward-facing models) or on real on-vehicle testing.
7. Discussion of ETESS Potential
Preliminarily, the assessment in off-line simulations between the ETESS and the PMP is described for the tested HEV by considering different powertrain designs and driving cycles. For each tested case, the constants
λ* and
c0 are case-by-case tuned, aiming at obtaining the battery energy balance between the cycle start and end (Equation (6)). In
Table 3, all the examined configurations are reported, pointing out the driving cycles and the powertrain features. The driving cycles considered are six. Specifically, cases from #1 to #7, cases #10 and #11 are referred to common speed missions (standardized WLTC and Artemis variants), where cases #8 and #9 correspond to real driving emissions (RDE) compliant cycles provided by the European Commission’s Joint Research Center. For those two cases, the speed and altitude profiles are depicted in
Figure 7, whereas in
Table 4, their main data are listed (additional information on these two RDE-compliant cycles is available in the annex of [
27]). The choice to include the analyses along RDE-compliant cycles is not estimating the CO
2 emissions, for which those cycles were defined, but to verify the ETESS potential also in real driving conditions.
The variants of the powertrain are synthetically described in
Table 3, where “Base” is referred to the baseline performance, while “Red” refers to motor or engine with reduced maximum performance, keeping the same rotational speed range. Considering the ICE column, the subscript 1 or 2 indicates the thermal engine used between the two ones introduced in
Section 2. The “Red” configuration of the thermal engine entails maximum performance halved compared to the baseline. The “Red” variant of electric units presents a power limit reduction of 80% with respect to the reference. For both thermal and electric units, BSFC and efficiency iso-contours are not adapted as against the baseline engine ones, shown in
Figure 2 and
Figure 3. In other words, the power units are assumed to work with reduced limits but without modifying their efficiency. The last column, describing the battery size, indicates for cases #8 and #9 a doubled capacity (“Big”). Without a resizing of the battery, the RDE-compliant cycles could not be performed without fully discharging the battery, hence without respecting the constraints of the optimization problem expressed by Equation (1).
For the sake of brevity, in the following detailed results will be presented for cases #1, #4, #10 and #11. Starting from case #1, as can be observed in
Figure 8, ETESS and PMP provide almost superimposed results of EM (
Figure 8c) and ICE (
Figure 8b) powers, which reflects on the trends of fuel rate (
Figure 8f), SoC (
Figure 8e) and selected gear number (
Figure 8g). The power-split trend in
Figure 8h (upper side) points out that the PMP switches between 0 and 1, even if a modulation between those extreme levels is potentially available. The ETESS profile is superimposed in most parts of the cycle. The bottom part of
Figure 8h shows the ratio between the power of EG and ICE. It can be observed that the PMP chooses to realize a very limited battery charging through the EG, which determines an SoC profile similar to the ETESS one, for which the battery charging by the ICE is disabled. Although not explicitly shown in the presented results, it is worth noting that, when the power-split is equal to 1, the series mode is activated and the clutch number 1 (see
Figure 1) is open, while the opposite occurs if the power-split is lower than 1 (parallel mode).
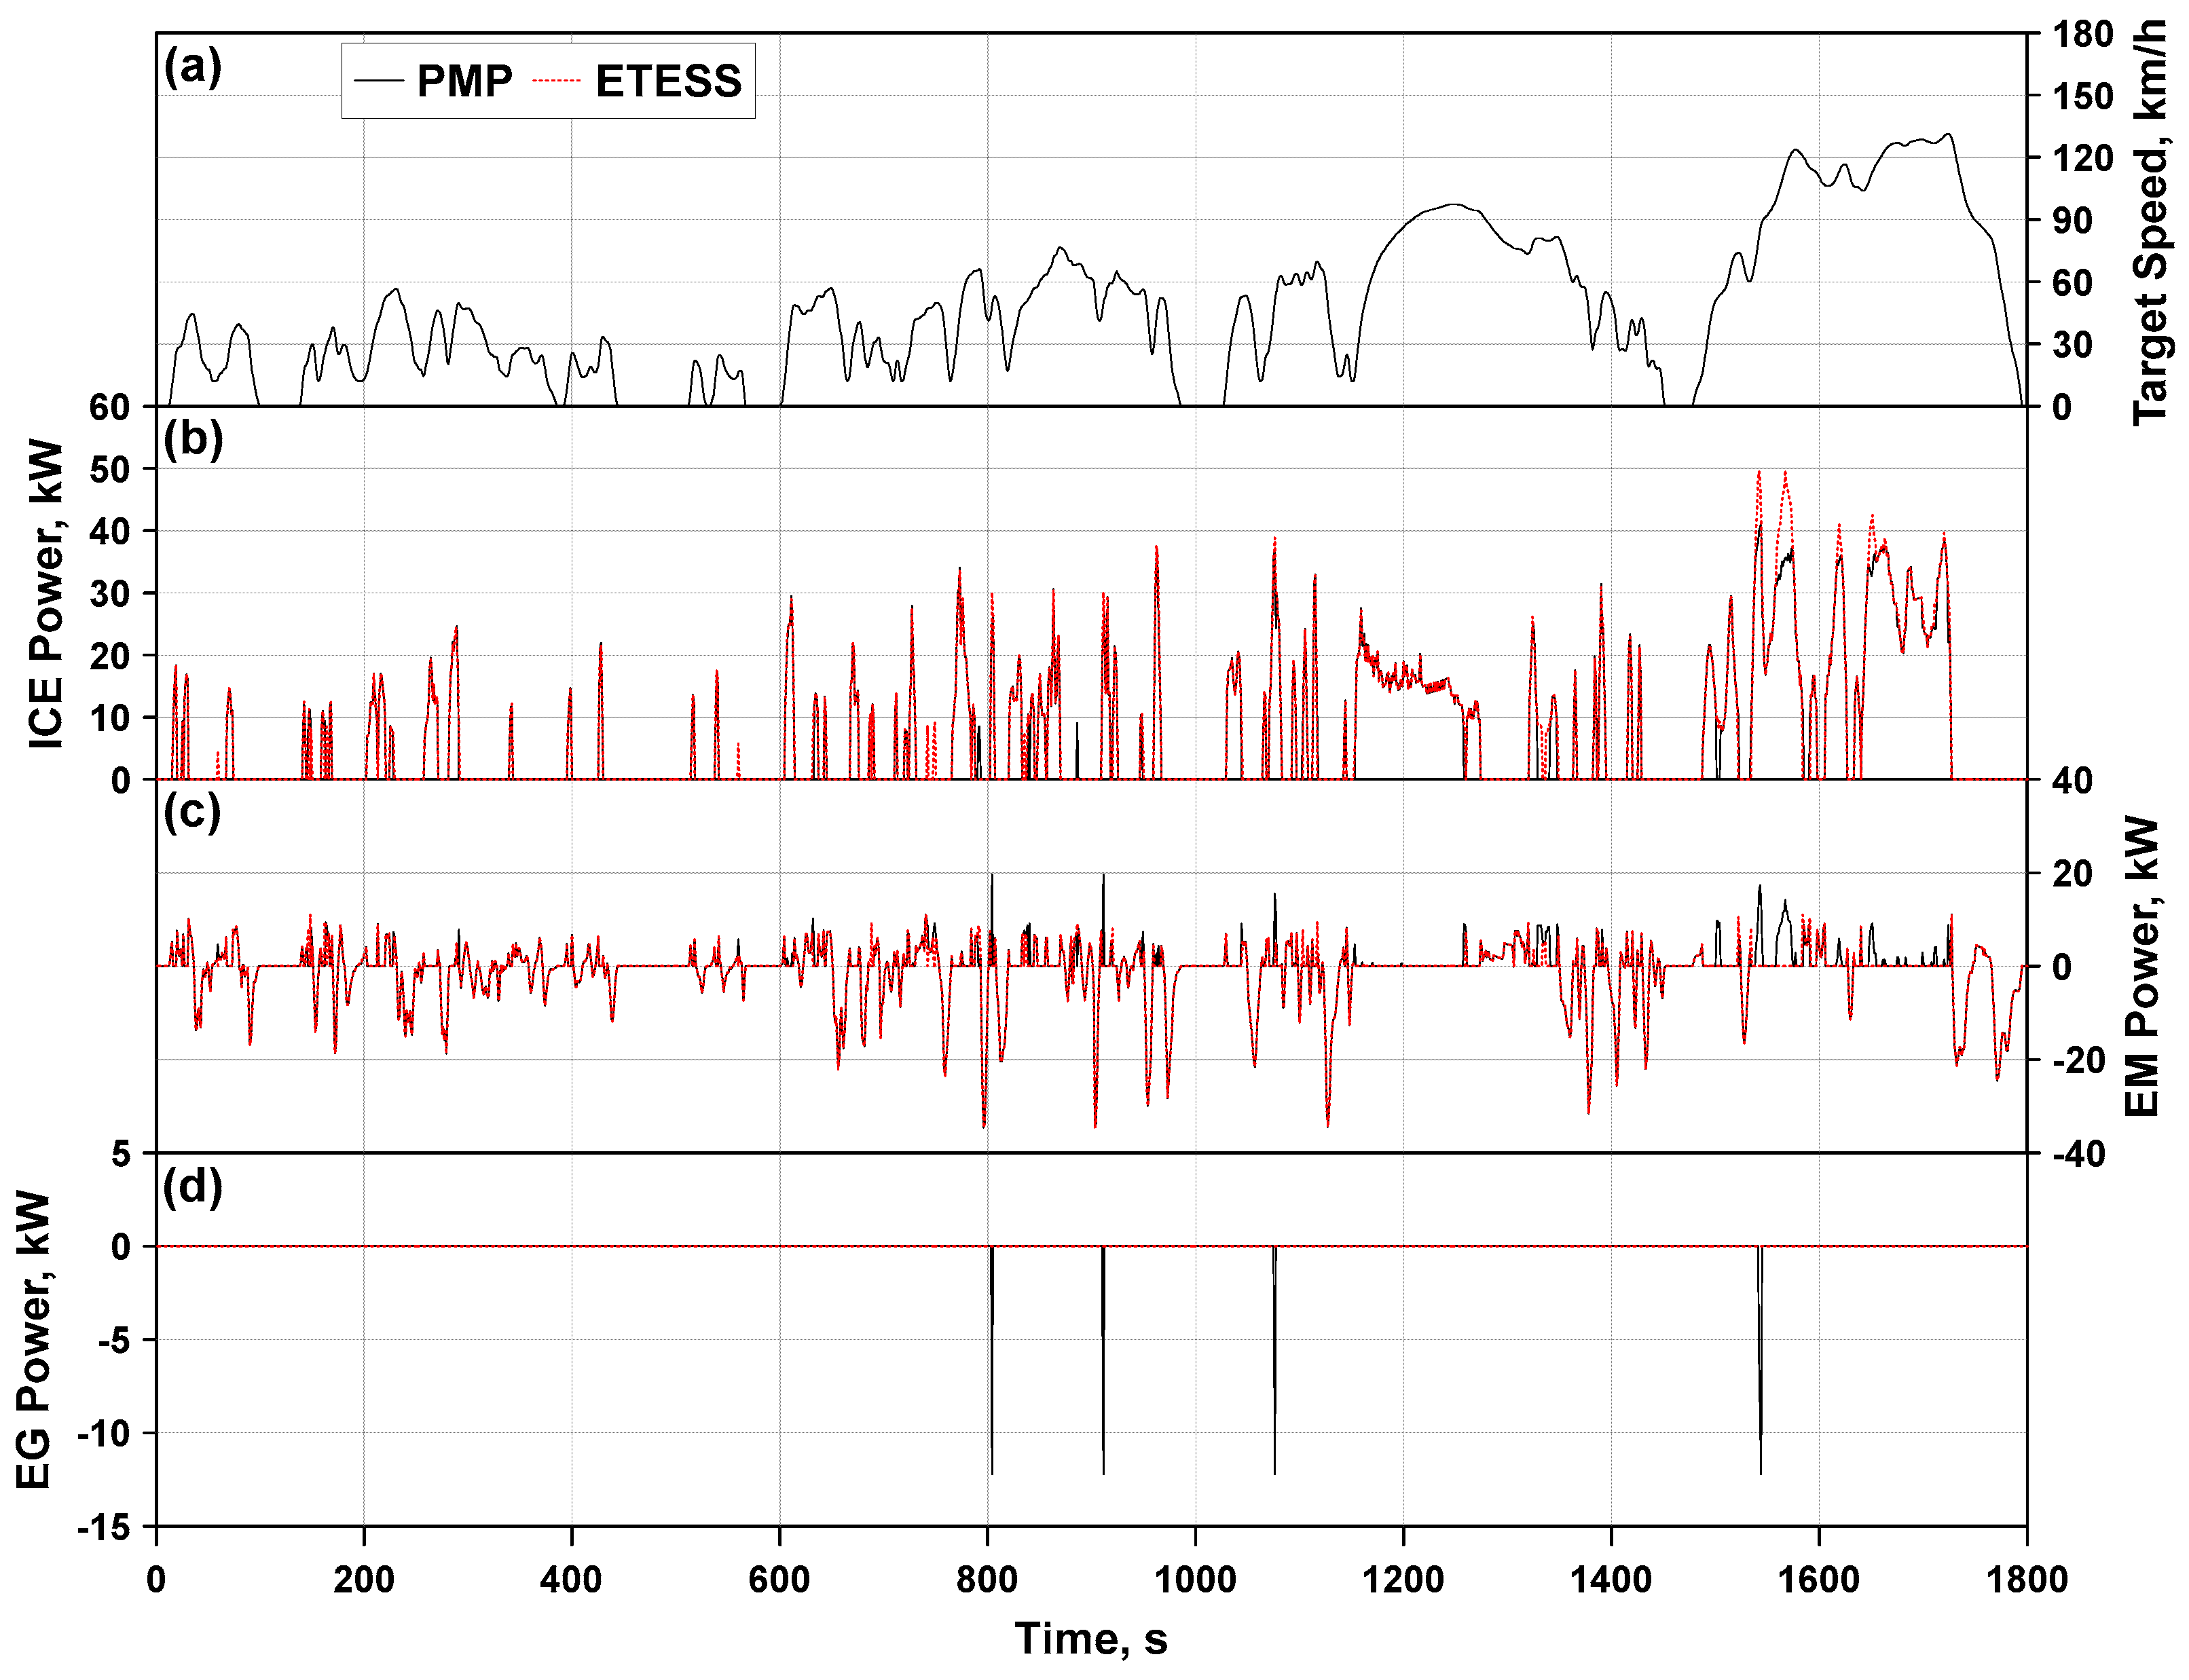
As stated above, in case #4, the powertrain characteristics are changed due to a reduction of the maximum ICE torque that corresponds to the BMEP dashed line in
Figure 2, and by decreasing of 80% the maximum and minimum torque for the electric motors. The assessments in
Figure 9 depict greater differences between the PMP and ETESS, compared to case #1.
For the ETESS, because of the impossibility of an EG battery charging, pure ICE driving is very often chosen (
Figure 9b). On the contrary, for the PMP, in most parts of the driving cycle with positive power demand, the EG battery charging is activated (
Figure 9d). This allows employing the EM more frequently compared to ETESS (
Figure 9c). As well as case #1, an alternate utilization of ICE and EM is prevalently chosen by both PMP and ETESS (power-split either 0 or 1 in
Figure 9h). However, in case #4, a power-split is applied by both control strategies, especially when a higher gear ratio is chosen. In those circumstances, the ICE attains the maximum power limits and support from the EM are needed to fulfill the power demand. To this aim, it can be observed, as an example, the trends around 1700 s. At this time, the longest available gear number is selected (
Figure 9g); consequently, the thermal engine operates at a reduced speed, its output limit is attained, and a certain contribution of EM is mandatory.
Cases #10 and #11 differ from cases #1 and #2 because of the thermal unit. The thermal engine 2 is characterized by a displacement and a maximum power about halved if compared to thermal engine 1. Its BSFC map, in
Figure 3, shows higher values of consumption all over the operating domain. For the PMP, the worst performance of the thermal unit reflects in less use of battery charging through the EG, as shown in
Figure 10d and
Figure 11d. Once again, an alternate utilization of pure ICE or EM driving is mainly preferred, as shown in
Figure 10h and
Figure 11h. Those choices make the ETESS control very similar to the PMP, as highlighted by the power profiles of ICE and EM, in
Figure 10b,c and
Figure 11b,c. Some differences emerge in the high-speed portion of the driving cycle (between 1550 s and 1700 s), where sometimes a hybrid ICE/EM driving is selected by the PMP, while this does not occur for the ETESS.
From an overall analysis of the instantaneous profiles for the two confronted control strategies, it turns out their significant coherence. A global comparison between ETESS and PMP is made by the bar charts shown in
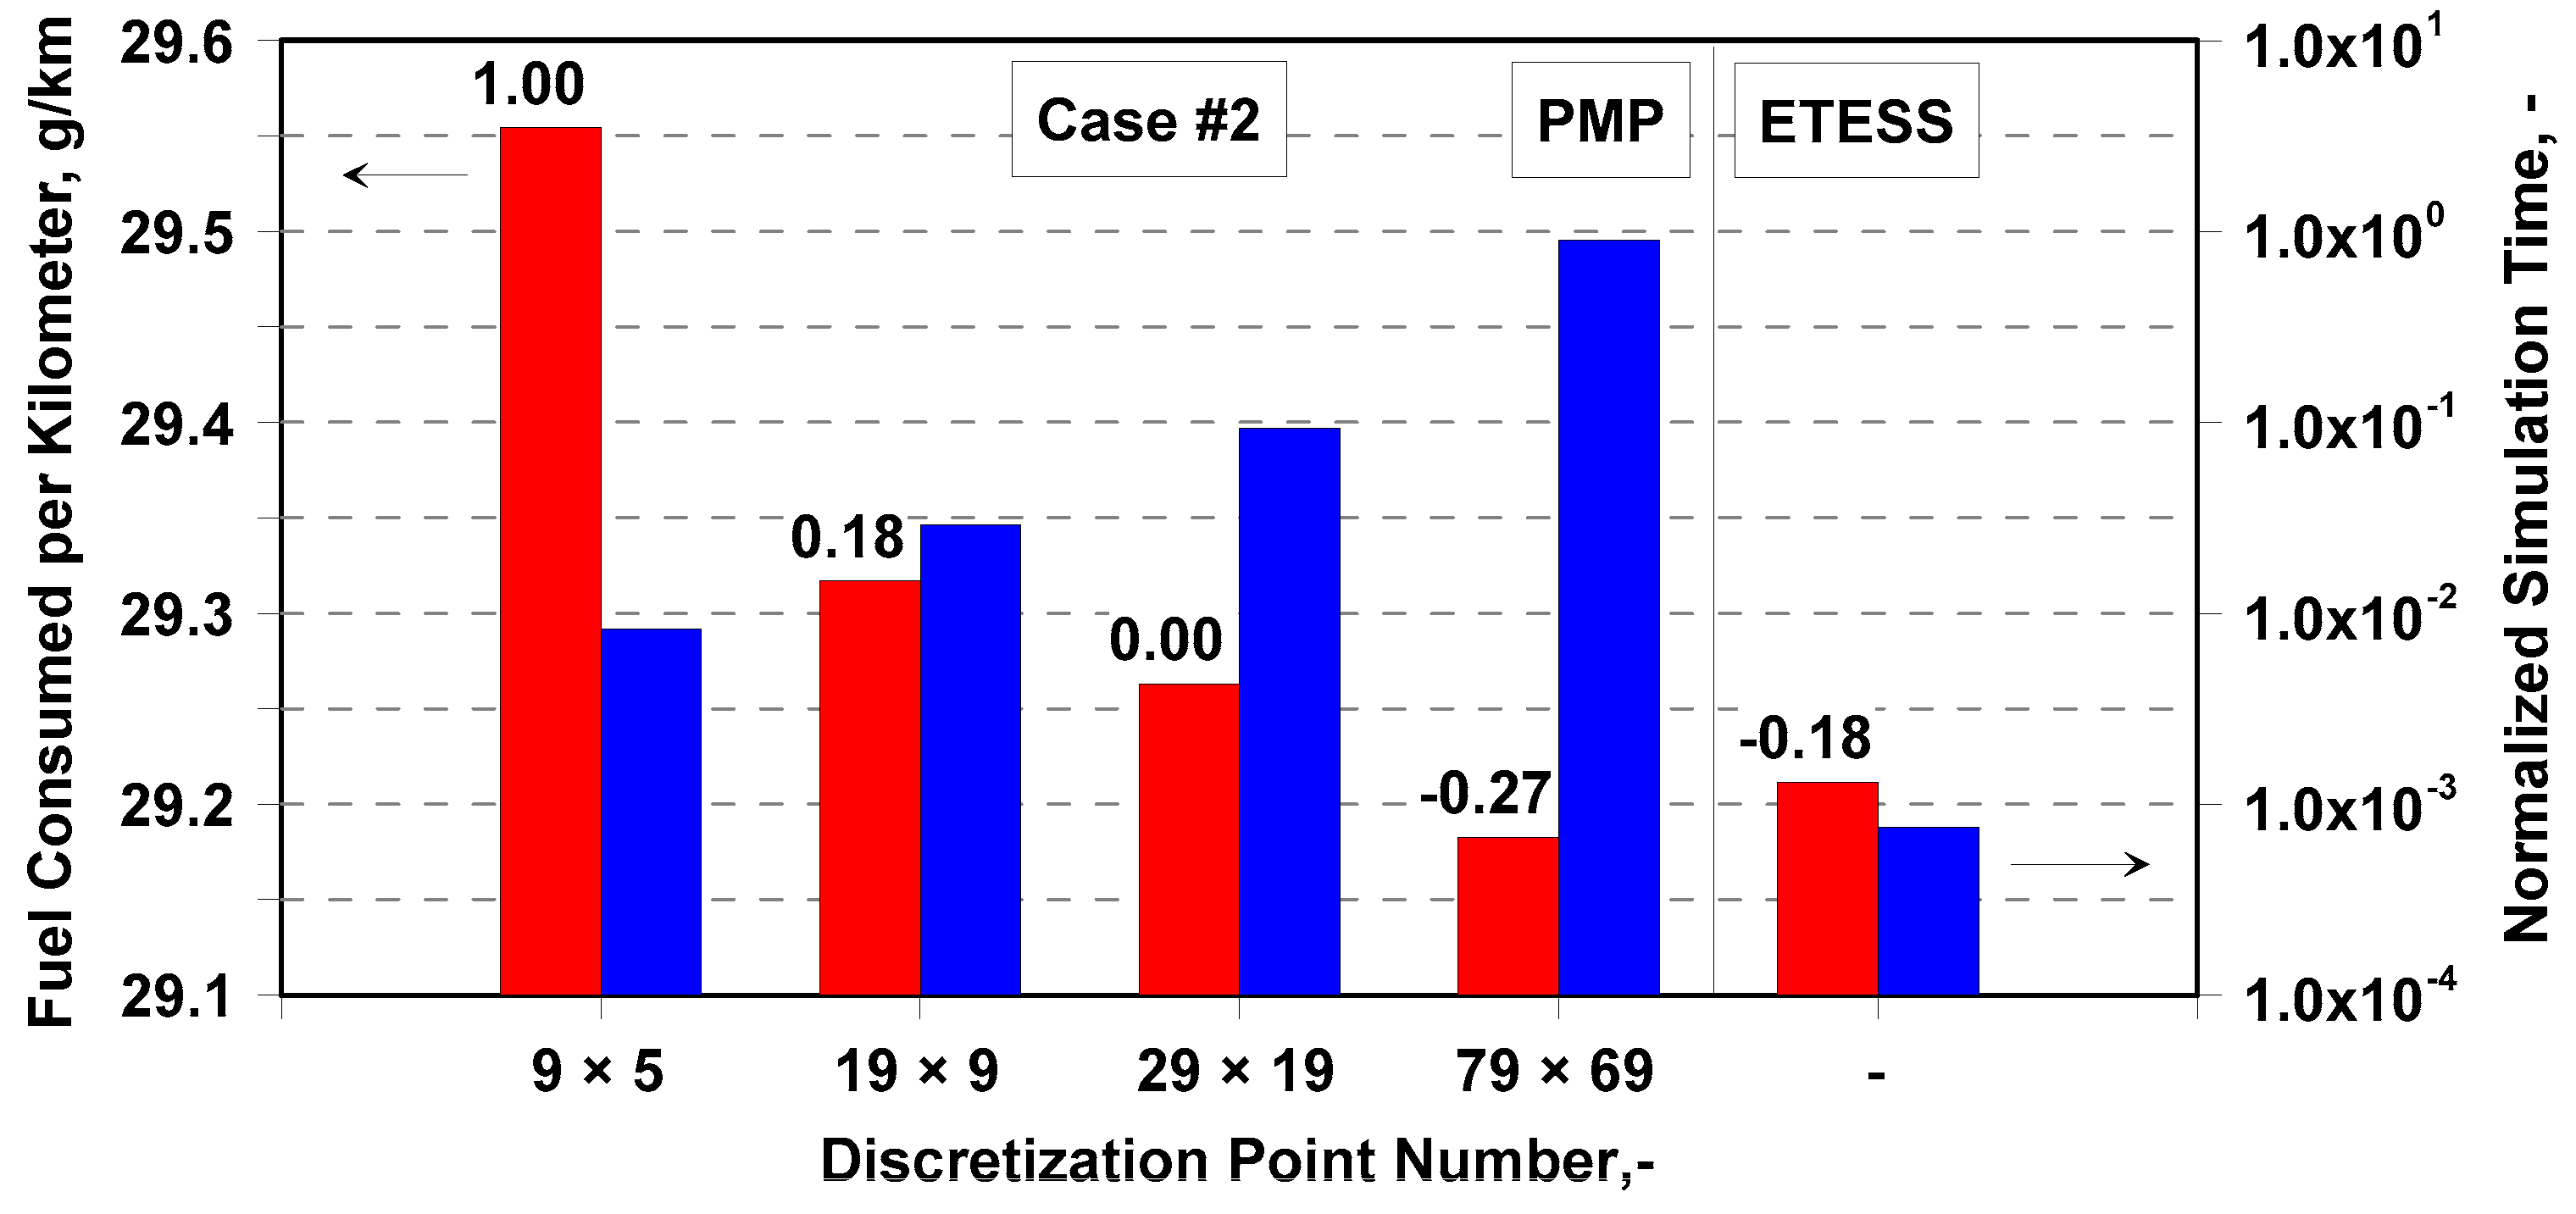
Figure 12. The bars correspond to the consumed mass of fuel per kilometer for all the considered cases, and, over each couple of bars, is reported the fuel consumption percent difference (assuming as a reference the PMP level). The ETESS behaves similarly to PMP, with an average fuel consumption increase of about 0.4% and, in most cases, below 0.5%. Limiting the analysis to the cases with engine 1, greater differences emerge when the electric unit sizing is reduced (cases #3 and #4) or when the electric driving is limited (cases #7). Following in the ETESS/PMP comparison assessment, very similar fuel consumptions occur for the base powertrain over substantially different driving cycles (Cases #1, #5, #6, #7, #8). This result appears relevant considering that those cycles differ in terms of both power demand, vehicle medium and maximum speed, vehicle medium and maximum acceleration/deceleration, duration, and length. The performance of ETESS slightly worsens for the less efficient engine and a sufficient sizing of the electric units, looking at the comparison between cases #1 and #10. In this case, the PMP strategy allows achieving a lower fuel consumption, however, with a difference with the ETESS smaller than 1%. In case #2, the ETESS even performs better than PMP. This apparent incongruence is explained by a parametric analysis on the gridding of the maps of EM and EG, whose results are reported in
Figure 13. This last shows the kilometric fuel consumption for different gridding of the torque levels for EM and EG (whose number of breakpoints are represented in the figure by the notation
nEM ×
nEG) and the simulation time normalized by the physical time. The setting with a grid of 29 × 19 is assumed as a reference for the definition of the fuel consumption percent difference reported on each bar. For the sake of completeness, the values related to the ETESS are shown, as well.
Figure 13 underlines that refining the grid, the fuel consumption slightly reduces, but the computational time increases exponentially, as expected. The lowest fuel consumption level is reached by the PMP with the finest grid (79 × 69 points) among the ones considered but with a simulation time about 10 times longer than the reference setting (29 × 19). Compared to the ETESS, the computational time is about three orders of magnitude higher, with only a slight increased fuel consumption. Among the tested gridding, the overall difference between the best and worst PMP cases is about 1.3%, proving the relevance of this aspect for the identification of the optimal strategy and fuel consumption. Analogous sensitivity analyses are repeated for all the other cases of
Table 3, from which emerge that the differences between the gridding settings are less evident. As an example, the results of the analyses are shown for case #1 in
Figure 14. In this case, the percent difference between the extreme PMP reduced to about 0.1%. It can be concluded that the most critical case from the gridding sensitivity viewpoint is the one where the operating limits of the thermal engine are more frequently reached (case #2 presents the depowered engine 1 variant). This is basically due to the choice of gridding the electric unit maps and not the map of the ICE. A different choice would determine a similar issue for the cases in which the operating limits of the electric units were reached.
Coming back to the comparison between the considered cases of
Table 3, the bar chart in
Figure 15 depicts the duration when a hybrid thermal/electric driving is chosen (PS greater than 0 and lower than 1) normalized by the total cycle duration. It can be noted that from cases #1 to #9, characterized by a more efficient ICE, a power-split is applied both from PMP and ETESS with a comparable extent. The time in PS becomes relevant only when the ICE power limit is reduced (cases #2 and 4#) and support of the EM is needed to fulfill the power demand.
A different behavior appears for cases #10 and #11, which differs from cases #1 and #3 because of the less efficient thermal unit. In those cases, the ETESS still involves an almost null time in PS mode, while the PMP determines a hybrid driving for the high-speed cycle portion, as already discussed for the instantaneous results.
The time percentage in charging mode is shown in
Figure 16 for the PMP strategy. It is worth recalling that the same plot for the ETESS would have been meaningless, not being allowed battery charging through the EG.
Figure 16 underlines that by reducing the size either of the thermal unit (case #2), of the electric ones (case #3) or of both (case #4), the time percentage in charging mode becomes bigger. The longer the time in charging mode, the longer is the activation of the electric driving in comparison with the ETESS, as shown, for instance, in the EM power profile in
Figure 9c.
Figure 16 also highlights that, for the same powertrain, more burdensome cycles require more time in charging mode (comparison between cases #1, #5, #6, #7, #8). Another outcome arises by observing differences between the analyses performed along the same driving cycle but with different ICEs (couple #1–3 and #10–11). The battery charging is more frequent if a more efficient engine is employed. Otherwise, the battery charging results to not be convenient from a global viewpoint, and EG is almost not used, as shown in
Figure 10d and
Figure 11d.
It is worth underlining that concerning the off-line simulations discussed above, the ETESS gives fuel consumption performance very close to PMP ones in all tested cases, but with a shorter computational time (about two orders of magnitude lower). The ETESS executes three orders of magnitude faster than the physical system, demonstrating the potential for real-time implementation on the vehicle.
The second part of the numerical activity concerns the verification of the robustness of the ETESS online version for different vehicle variants and driving cycles (all the cases listed in
Table 3), in comparison to a well-assessed online methodology such as the ECMS. The ETESS online variant is verified, establishing an adaptative correction for
c0 in Equation (11), achieved by using a PID controller. The latter minimizes the error between the current SoC and a predefined target of 0.55. The correction is applied to start from an initial value that is equal, for each case, to the one identified for the corresponding off-line simulation. A similar approach is adopted for the ECMS analyses, where the control adaptivity is realized by a PID controller acting on
s0 in Equation (7).
The online simulations consist of six simulations for each case, having different initial SoC but the same final target. The outcomes of these analyses are arranged, in accordance with the WLTP procedure [
28,
29], to obtain a corrected kilometric fuel consumption. The findings are reported in the bar chart of
Figure 17. The ETESS returns values comparable to the ECMS ones, proving the methodology robustness. A fuel consumption penalization of about 0.1% arises on average. ETESS provides higher fuel consumption than ECMS only in case #4, while it provides even lower levels in cases #2 and #5. Considering the online ETESS variant, if compared to the ECMS, the benefits in the simulation time are confirmed, to a similar extent.
As a final consideration, the slightly different performance of ETESS in comparison to well-assessed methods (PMP and ECMS) appears acceptable because of its computational efficiency. The near-optimal outcomes essentially arise from the theoretical background of the ECMS approach. The further evidence that emerged by the proposed analyses is that a fine exploration of whatever power-split is not compulsory since its evaluation in two significant values (either 0 or 1) is enough to achieve results near to optimality. Further, the ETESS computational efficiency proves the potential for real-time implementation and for the handling of situational information, which is required for the control of connected vehicles. The strategy provides certain robustness, not only for different vehicle configurations but also for different driving missions.
The further progress of this activity will concern the verification of the consistency of the ETESS considering more complex modeling of some powertrain subcomponents (for example, variable efficiencies of battery and gearbox) and in a dynamic “forward-facing” simulation. Moreover, the extension of the ETESS approach to the control of powertrains fitted with epicyclic gearing as power-split devices will be investigated.
8. Conclusions
This work presents an efficient control strategy for hybrid powertrains, named ETESS. The basic concept of the ETESS is to alternatively utilize thermal and electric units to fulfill the vehicle power demand. ETESS is numerically tested by an “in-house” coded model, with reference to a C-class vehicle.
The methodology is verified for different powertrain variants in terms of power units sizing and efficiency, and along various driving cycles, both regulatory and RDE-compliant cycles. For each investigated case, the ETESS is assessed with the well-known PMP approach in off-line analyses. As known, the PMP, conversely to ETESS, relies on the power-split concept, involving the possibility of a combined driving by both thermal and electric units. Off-line vehicle simulations highlight that the proposed approach performs similarly to PMP, resulting in higher fuel consumption of about 0.4% on average. Major fuel consumption differences appear in the tests with a less efficient thermal unit, for which a power-split sometimes appears preferable along the driving cycle, and the ETESS logic fails.
A parametric analysis in a representative test case shows that the map gridding affects PMP capability to identify optimal control, with an impact on the computational effort. Indeed, the fuel consumption difference between the most refined and most coarse map gridding is about 1.3% at the expense of a variation of two orders of magnitude in the computational time. Those issues do not emerge for the ETESS approach.
With reference to the most efficient engine here considered, the need for a power-split between thermal and electric units during the cycle emerges primarily if the thermal engine presents limited power/torque performances, both following PMP and ETESS strategies. If the less efficient thermal unit is adopted, greater differences appear in the comparison between PMP and ETESS, where the first one more frequently resorts to a hybrid driving.
Simulation results adopting PMP underlines that the time spent in charging mode (due to the ICE power supply) becomes greater, reducing the size of either the thermal unit, the electric ones or both. Moreover, more burdensome cycles require longer time in charging mode. On the other hand, whatever are the engine characteristics and the driving mission, the ETESS strategy does not involve the possibility of battery charging, except for the regenerative braking.
The robustness of the ETESS is tested in online simulations, with the aim to confirm the possibility of being employed in a real-time vehicle application. In this framework, an assessment with the ECMS approach is carried out. The online calculations underline that the ETESS behaves similarly to ECMS in terms of fuel consumption, with a very reduced difference (fuel consumption increase of 0.1% on average), and in all considered cases below 1%. Once again, the main benefit is a hugely reduced calculation effort.
As a future development of this study, the ETESS reliability will be tested in more complex simulation frameworks (in a forward-facing simulator, also accounting for the dynamics of the powertrain components) and for different powertrain architectures (for instance, powertrain fitted with epicyclic gearing as power-split device). Moreover, the robustness of the ETESS online variant for different driving missions will be further investigated to avoid the need for an off-line identification of the initial c0 value.


