Article

Road Freight Transport Electrification Potential by Using Battery Electric Trucks in Finland and Switzerland

by
Mehdi Jahangir Samet
1,
Heikki Liimatainen
1,*,
Oscar Patrick René van Vliet
2 and
Markus Pöllänen
1
1
Transport Research Centre Verne, Faculty of Built Environment, Tampere University, FI-33014 Tampere, Finland
2
Climate Policy Research Group, Department of Environmental Systems Science, ETH Zürich, 8092 Zürich, Switzerland
*
Author to whom correspondence should be addressed.
Energies 2021, 14(4), 823; https://doi.org/10.3390/en14040823
Submission received: 18 December 2020 / Revised: 18 January 2021 / Accepted: 1 February 2021 / Published: 4 February 2021
(This article belongs to the Section E: Electric Vehicles)

Abstract

:
Medium and heavy-duty battery electric trucks (BETs) may play a key role in mitigating greenhouse gas (GHG) emissions from road freight transport. However, technological challenges such as limited range and cargo carrying capacity as well as the required charging time need to be efficiently addressed before the large-scale adoption of BETs. In this study, we apply a geospatial data analysis approach by using a battery electric vehicle potential (BEVPO) model with the datasets of road freight transport surveys for analyzing the potential of large-scale BET adoption in Finland and Switzerland for trucks with gross vehicle weight (GVW) of over 3.5 t. Our results show that trucks with payload capacities up to 30 t have the most potential for electrification by relying on the currently available battery and plug-in charging technology, with 93% (55% tkm) and 89% (84% tkm) trip coverage in Finland and Switzerland, respectively. Electric road systems (ERSs) would be essential for covering 51% trips (41% tkm) of heavy-duty trucks heavier than 30 t in Finland. Furthermore, range-extender technology could improve the trip electrification potential by 3–10 percentage points (4–12 percentage points of tkm).

1. Introduction

Although road freight trucks account for just 9% of the global stock of vehicles and 17% of the total driven distance, the related global life-cycle greenhouse gas (GHG) emissions accounted for 39% of the road transport sector in 2015 [1,2]. Moreover, freight truck activity (tkm) as well as the life cycle GHG emission are predicted to double from 2015 to 2050 in a business-as-usual (BAU) scenario that is based on internal combustion engine vehicles (ICEVs) and conventional diesel fuel. Accordingly, the majority of freight truck activities in tkm (around 75%) and subsequently of the life cycle GHG emissions (around 90%), is from the heavier truck types with gross vehicle weight (GVW) of over 3.5 t. These trucks can be classified as medium-duty trucks (MDTs) and heavy-duty trucks (HDTs) with lower and higher than 12 t GVW, respectively [2].
The road freight activities and GHG mitigation measures in the BAU scenario in Europe are likely to follow the global trends. The European Commission has set an overall 55% target for GHG emission reduction by 2030 to promote climate change mitigation in the European Union (EU). Rigid and tractor-trailer trucks play a major role in freight transport and their GHG emissions with 59% and 20% share of heavy freight fleet in 2014 in the EU, respectively [3]. Low carbon options for road freight can be summarized as (1) energy efficiency improvement in trucks, (2) improvement of the logistical systems, and (3) a shift to alternative fuels [4].
Some of the energy efficiency improvement options in trucks for decarbonizing the road freight transport, such as aerodynamic cargo space design and lightweight materials, may also affect the ability to carry payload. However, some other energy efficiency improvement methods could be easily achieved by shifting into specific alternative fuels and relevant technologies. For example, engine efficiency, idling reducing technologies, and hybridization can be achieved efficiently by electric-drive vehicles (EDVs) [4,5,6,7,8,9,10].
Alternative fuels and motive powers in road freight transport that have been discussed include natural gas, biofuels, and EDVs [4]. The most promising GHG emission mitigation scenario in long-term planning would be achieved by the EDVs. Biofuels also could be a partial and cost-efficient solution, but using them on a large scale and in the long-term may cause indirect land-use change impacts and problems for broader sustainability [2,11].
EDV technologies are categorized as hybrid electric vehicles (HEVs), extended-range electric vehicles (EREVs), plug-in hybrid electric vehicles (PHEVs), battery electric vehicles (BEVs), as well as fuel cell electric vehicles (FCEVs). Each EDV technology has its own benefits and barriers: HEVs, EREVs, and PHEVs are suggested for short-term life-cycle GHG reduction plans, while BEVs and FCEVs are suggested as the best alternative fuel solutions for zero-emission heavy-duty truck technologies in the long-term [2,11].
Moultak et al. discussed the application of battery electric trucks (BETs) in two sub-categories of mainly relying on either (1) plug-in charging or (2) electric road system (ERSs). Plug-in charging systems are mainly suggested for light commercial urban deliveries and MDTs for regional deliveries, and as refuse trucks. ERSs would serve for MDTs and HDTs on medium-distance routes with high demand and on drayage trucks routes around ports. They also suggested to use the FCEV for HDTs on long-haul trips and drayage trucks around ports [2].
Many previous studies have concluded that the application of BETs in different freight duty truck classes can be challenging in terms of technical aspects, life cycle assessment (LCA) of GHG emission, and cost evaluations [10,12,13,14,15,16]. The most important technical challenges for large-scale BET adoption that have been discussed are the limited electric range, charging time, and cargo weight and size [14,15]. However, other factors such as vehicle cost (mainly due to the battery), infrastructure costs for charging systems, and the electricity load demand and supply have played major roles in the LCA of GHG emission and cost evaluations [10,12,13,16,17]. Some previous research highlights the role of the low-carbon electricity generation mix to increase the GHG reduction potential of the large-scale adoption of EVs [12,13]. Deploying intermittent or variable renewable energy resources (vRESs) to produce a low-carbon power generation mix has been emphasized in many power plant dispatch investment models and studies [18,19,20]. Moreover, some of this research has discussed the vehicle-to-grid (V2G) strategy for managing the peak power demand resulting from large-scale adoption of BEVs [19,21].
Regarding the technical challenges above, we noticed the following gaps in the literature for large-scale BETs adoption.
  • Many studies have conducted a comparative emission and/or cost analysis between a BET model and other alternative fuels and technology options based on average route characteristics [5,7,9,10,12,13,15]. However, only a few studies have conducted a parametric analysis for BET adoption to assess a large number of individual routes based on the origin–destination (O–D) road freight transport demand by different truck duty classes [14,22].
  • Few studies have used a geospatial approach for analyzing the plug-in charging systems as well as ERSs in the large-scale BET adoption [14]. However, geospatial approaches have been widely used for modelling the plug-in charging infrastructures that is essential to analyzing the light passenger electric vehicles’ adoption rate [23,24,25,26,27].
  • We have found no studies that analyse the potential of complementary solutions like the extended range technology by using EREVs in the large-scale BET adoption. However, there are some studies discussing this technology adoption potential for light passenger electric vehicles [28,29].
  • The power grid load requirements for charging facilities are rarely analyzed based on the geospatial distribution of road freight transport demand [30].
Table 1 presents a summary of global research on EDV technology adoption for MDT and HDT truck categories. The table shows how this study expands current knowledge in different aspects, including (1) charging activity analysis of BEVs for both MDTs and HDTs truck categories based on plug-in charging and ERS, (2) geospatial data analysis of a large amount of O–D road freight transport demand based on charging activities, (3) geospatial data analysis of regional power grid load demands, and (4) analysis of EREV technology adoption as a complementary solution for road freight transport electrification.
To fill the gaps in the literature, this study analyzes the large-scale BET adoption potential by geospatial approaches for MDTs and HDTs (with GVW bigger than 3.5 t). We use detailed O–D freight transport survey datasets from Finland and Switzerland in 2016, which have been previously processed and used by Liimatainen et al. [22], but not using geospatial analysis. We apply the battery electric vehicle potential (BEVPO) model for the geospatial data analysis and modelling procedures to evaluate large-scale BET adoption potential.
Melliger et al. developed the BEVPO model to evaluate the range anxiety of using light passenger BEVs [23]. The BEVPO model has some drawbacks, such as: (1) the model uses a linear energy consumption rate (kWh/km) for the trip simulation process, (2) the model would not optimise the number and locations of the required on-road charging stations, (3) the location for the on-road charging stations must be proposed by the user for running the model, and (4) the model would consider the daily trip simulation procedures based on the annually extended O–D travel demand of the sample survey data, and subsequently cannot analyze the hourly, weekly, and seasonally varying demand for the charging activities. However, the advantages of using BEVPO model as a quantitative model to estimate the large-scale BETs adoption outweigh its drawbacks. The advantages are the possibilities of
  • using a random selection of BET models from a given pool in a simulation procedure. The random selection can be weighed for each BET model;
  • using different search radii and charging trigger conditions for deviation from the pre-planned route assignments;
  • covering large amount of route analysis for different countries based on a Google Maps application program interface (API). The route assignment is suitable for accurate addressing systems of O–D data based on the postal code zones (i.e., 5- and 4-digit postal codes in Finland and Switzerland);
  • analyzing the multiple daily sub-trips, including multiple O–D pairs, as an individual trip in 24-h time frame. Accordingly, the charging and discharging (due to driving) activities will be simulated. As a result, the successful and failed trips (in the case that the BET has not arrived at the final destination and is out of charge) will be reported based on each daily trip data; and
  • doing further geospatial analysis of the results based on the O–D data. Therefore, the results can be used for the geospatial resource allocation and infrastructure planning for depot and on-road charging facilities.
In addition to analyzing the impact of battery technology and plug-in charging systems, this study assesses the impact of complementary solutions such as ERSs and range-extender technologies on large-scale BETs adoption potential. We evaluate four different electrification scenarios based on expected battery and plug-in charging system improvement in the MDT and HDT classes with GVW above 3.5 t. Moreover, one scenario will analyze the electrification potential of some HDTs (payload capacity more than 30 t) by using ERSs in some routes. Accordingly, the main research question and sub-questions were defined as:
Main research question: To which extent can road freight transport be electrified using battery electric trucks in Finland and Switzerland currently and considering potential improvements of battery and charging technologies?
Sub-question 1: What share of road freight trips (based on, e.g., load types and emission standards) can be covered using the currently available BET models and the current Finnish and Swiss charging infrastructures?
Sub-question 2: How will the development in the increased range of BETs and charging facilities increase the proportion of successful BET trips in Finland and Switzerland?
Sub-question 3: How much could the complementary solutions such as electric road systems and range-extender technologies improve the potential of electrifying Finnish and Swiss road freight?
Sub-question 4: What are the geographical power grid load requirements for different electrification scenarios?
To answer the research questions, Section 2 represents different parameters and assumptions in the modelling and data analysis procedures. Section 3 represents and discusses the results of different scenario packages based on battery technology, and charging facility improvements, extended-range solution, and power grid load requirements. Section 4 represents the answers and discussion for the sub-research questions. Finally, the general conclusions of this study and suggestions for further studies are given in Section 5.

2. Data and Methods

In this study, the large-scale BET adoption potential concerned with the battery capacity and charging facilities is evaluated by using geospatial and BEVPO model analysis for the MDTs and HDTs (with GVW over 3.5 t) in Finland and Switzerland. To focus on analyzing the impacts of these technology improvement on the large-scale BET adoption, our methodology does not consider the market diffusion model and the future transport demand growth. For running the BEVPO model analysis in this study, the datasets for the plug-in charging facilities and BET model specifications are based on the assumptions described in Section 2.1 and Section 2.2.
We define five different scenario packages for analyzing the impact of battery capacity and charging facilities improvements on the large-scale BET adoption potential. Four of these scenario packages approximate the relevant scenarios in the earlier study by Liimatainen et al. [22], which used the same freight travel survey datasets. Scenario 1 in this study is the equivalent to the “current technology” scenario in Liimatainen et al. [22], whereas scenarios 3, 4, and 5 assume incremental increase in performance from both battery capacity and fast-charging facilities and are the equivalent to the scenarios called in the previous study “improved vehicles”, “improved vehicles and charging”, and “towards full electrification” [22], respectively. Scenario 2 also considers alternatives of electrified road systems (ERSs) on certain high demand routes for heavier BETs in Finland with a payload capacity of over 30 t. Further information about ERSs and the route assumptions is presented in Section 2.3.
In Section 2.4, the travel data survey preparation procedure for the BEVPO model and the data analysis procedure are described. In Section 2.5, the methodology assumptions are described for analyzing the range-extender technology impacts on the current technology scenario (scenario 1). Finally, in Section 2.6, the procedure for analyzing the annual power grid load requirements for charging facilities is explained.

2.1. Plug-In Charging Facilities Specifications

For geo-routing assignment purposes, the log file of on-road charging station coordinates is specified [31]. For Finland and Switzerland, the various scenario packages are defined based on the currently available charging station coordinates with the minimum power of 40 kW. For this purpose, 57 and 87 locations were selected for Finnish and Swiss on-road charging facilities, respectively. In order to improve the understanding of the geospatial distribution and accessibility of these charging facilities throughout the road network, an ArcGIS (Esri Inc., Redlands, CA, USA) network analysis tool was used in both countries to assess the coverage of the charging service area.
We made the following assumptions for defining the different scenarios: first, the charging station coordinates file is constant for all the scenario packages; second, the depot and on-road charging power changes in different scenario packages. The data needed for this section were collected from different online sources for Finland and Switzerland [32,33]. Depot and on-road charging power are assumed based on the table below.
Table 2 shows the depot charging power range based on the 8 h charging possibility at night. The depot charging power range is also defined based on the BET model specification and the relevant battery capacities which are represented in Table 3 in Section 2.2. The on-road charging power in scenario 1 is based on a probability of 50% to access a 50 kW charging station and 50% probability to access a 120 kW charging station. The on-road charging power in scenario 2 is based on the currently possible and available battery technology and charging facility improvement. The on-road charging power in scenario 3 estimates the near future improvement of battery technology and charging facilities. The on-road charging power in scenarios 4 and 5 estimate different levels of future improvements in battery technology and charging facilities.

2.2. BET Model Specifications

For use in road freight transport analysis in the BEVPO model, the freight transport survey data need to be clustered for various groups of trucks with almost identical features [31]. However, it can be difficult to specify certain classes of trucks based on various variables such as GVW and type of lorries (rigid truck, truck with full trailer or semitrailer truck). For the purposes of the BEVPO model simulation procedure, and because of the distribution of payload capacity in Finland and Switzerland, three truck groups were specified on the basis of different payload capacities. Therefore, this classification doesn’t consider types of trucks such as the rigid, semi-trailer, or trailer truck.
Group 1 includes the medium duty trucks with payload capacities between 3.5 t and 11 t. A travel data survey made in 2016 in Finland and Switzerland shows that the average payloads for this group are 5.3 t and 7.5 t, respectively. Group 2 contains heavy duty vehicles with payload capacities ranging from 11 t to 30 t. A travel data survey made in 2016 in Finland and Switzerland shows that the average payload capacities for this group are 17.6 t and 20 t, respectively.
Finally, group 3 includes the heaviest trucks with payload capacities bigger than 30 t. Up to 76 t of GVW is authorized for full trailer combination trucks in Finland, equal to 58 t of payload capacity, whereas in Switzerland, trailer trucks with more than 40 t GVW are not allowed on the roads. The GVW limit of 40 t is nearly equivalent to the payload capacity of 30 t. A travel data survey made in 2016 in Finland shows that the average payload capacity for this group is around 42 t [22].
Almost no commercial BETs are currently available for moving an average payload capacity of 42 t. To estimate the energy consumption for long-haul travel by BETs in this weight class, we fitted a linear regression model to a few of the currently offered medium and heavy-duty BET models [8,22,34]. The criterion for using these BETs were: (1) the models are available commercially, and (2) they represent the current technology of medium and heavy-duty BET models.
We calculated the energy consumption rate (kWh/km) for each BET model based on the average driving range and 85% of full battery capacity. The energy consumption rate calculation based on the average driving range can be varied: for example, ±17% in the MX30 Class 8 model [35], because of changes in different factors such as driving speed, road type, and weather conditions. We did not analyze different energy consumption rates for the same BET model with different payloads because the BEVPO model cannot consider the impact of variation in the payload and energy consumption during a daily trip simulation with a randomly selected BET model. Figure 1 demonstrates the linear regression model for estimating the energy consumption in BETs with the higher payload capacities.
The long-haul BET model equivalents for groups 1 and 2 can be found based on the current technology. The truck models for group 1 are randomly chosen from the four BET models that have the payload capacity of around 10 t [36,37,38]. For group 2, the truck models are also randomly selected from the three BET models with the payload capacity between 25 t and 36 t [35,39,40]. As there is currently no battery technology available for Group 3, the imaginary heavy-duty BETs are specified assuming, based on the linear regression model in Figure 1, an energy consumption of 2.16 kWh/km for the payload of 42 t on average. More about the electric truck models is explained in the following paragraphs based on different scenario packages.
Table 3 shows the features of the BET models. Features include the name of the model, payload capacity, range, battery capacity, and energy consumption in t, km, kWh, and kWh/km, respectively.
All scenario packages for BET models are defined based on the energy consumption ratio discussed in the previous paragraphs. However, the battery capacity and relevant range vary based on the following descriptions in different scenarios. In scenario 1, the BET models for group 1 and group 2 are defined exactly based on the currently available BET models features represented in Table 3. There is no simulation for group 3 in scenario 1 as BETs representing group 3 are not currently in the market. In scenario 2, the battery capacities in group 1 and 2 remain the same as in scenario 1. However, the simulation of group 3 in scenario 2 is considered based on the short-range trip possibility (130 km) with a battery capacity of 340 kWh. This battery capacity could be suitable for using the ERSs technology for group 3 in scenario 2 [41].
The battery capacities for groups 1 and 2 in scenarios 3, 4, and 5 are defined based on an increase of 50%, 50%, and 75% compared to the relevant features in the scenario 2, respectively. The battery capacities for group 3 in scenarios 3, 4, and 5 are defined based on an increase of 50%, 50%, and 163% compared to the relevant features in the scenario 2, respectively. The battery capacity of 893 kWh in group 3 in scenario 5 (full electrification scenario) is defined in a way that a 350 km range can be achieved with a 42 t payload.

2.3. Electric Road Scenario in Finland

Since the freight classification of group 3 in Finland could not be electrified by BETs currently in the market with adequate payload capacity, for electrifying this group of trucks (with payload capacities above 30 t), different electric road system (ERS) options such as overhead line, rail, and inductive charging may be feasible. The electric road alternative solution, without specifying its technology, is evaluated on some routes with high freight transport demand in scenario 2 in Finland.
Next, we present the analysis procedure for estimating successful trips in the ERS scenario. First, the ERS route selection criteria is based on data on routes with the highest demand for heavy trucks described in the WSP Oy study [42] and the desire-line map generated based on the freight transport survey data used in this study in Finland. Accordingly, the capital area (Helsinki, Vantaa, and Espoo) and the cities of Oulu, Tampere, Turku, Lappeenranta, Kotka, Lahti, Seinäjoki, and Kouvola are investigated as the most important regions. As a result, five major routes have been recognized and are represented as the most possible electric road routes in Finland in Table 4.
Second, in scenario 2 in Finland, all trips with over 30 t payload capacity and covered in the radius of 30 km of this electric road network are considered to be successful electrified freight trips. With no possibility of charging, the provided 30 km range assumption can be retrieved by using battery power and charging at depots in addition to ERS continuous charging. Therefore, all measures (e.g., number of successful/failed trips) of group 3 which are relevant to these routes have been added to results obtained by the BEVPO model in scenario 2.

2.4. Freight Transport Data Survey Preparation and Data Analytics Procedure

The freight transport data survey in this study is based on the road freight surveys in 2016 [43,44], which were processed before by Liimatainen et al. [22]. In Finland, the sample size of the survey data is about 10,000 and the data collection duration is 3–4 days per vehicle. The sample size is about 8500 in Switzerland and the data collection period is a week per vehicle. In order to construct the final aggregated freight transport survey results, two separate sheets that include truck data and trip data are merged. We arrive at a total of each sample data by taking into account the grossing factor of each trip in the sample (to extend the result to whole year), 84,544 in Switzerland and 18,110 trips in Finland.
The road freight surveys in 2016 in Finland and Switzerland provide O–D freight transport datasets with variables such as freight tonnage, travel distance, load type, emission standards, and truck types. The O–D freight transport datasets do not reflect the change during the days, weeks, and seasons. However, the annual level of the given variables are estimated based on the O–D freight transport datasets.
In this study, some extra processes in the BEVPO model were required for the O–D data addressing system of the freight transport datasets. In the BEVPO model, the accuracy of addresses in the freight transport survey has an important role for the outcome of the geo-routing assignment process. The addresses in the O–D data should be primarily by postal codes in the BEVPO model [31].
Freight transport survey data in Switzerland are addressed by 4-digit postal codes which is very accurate for using BEVPO model as these cover 4135 unique municipality codes [45]. As a contrast, Finnish freight transport survey data are addressed by 317 unique municipality codes. The municipality code zones normally include several 5-digit postal codes in Finland and the relevant boundary area could be around 100 times bigger than the 4-digit postal code areas in Switzerland. On the other hand, around 3117 specific 5-digit postal codes are available in Finland [46]. Therefore, for summarizing Finnish municipality code zones to specific 5-digit postal codes, within the code boundary area of each municipality, the nearest 5-digit postal codes to the geometric centres of all 5-digit postal codes have been determined.
Addressing the O–D data based on the municipality code zones in Finland may increase the number of failed trips in the BEVPO model analysis. However, failed trips inside the O–D zones can be turned into successful ones by controlling freight journey time schedules and leveraging the charging facilities for the depot. Therefore, the number of the failed trips inside the O–D zones can be assigned to the successful trip results for creating a new result called “manageable successful trips”.
Accordingly, we applied the BEVPO model to different scenario packages in various payload capacity groups in both countries. The search radius for finding a possible on-road charging facility was set as 5 km in both countries. Moreover, the BEVPO model was set to its default decision-making algorithm to evaluate all the trips. This default settings uses the following three conditions subsequently to trigger the charging activities. The conditions are (1) that only 30 km of range is left, (2) that less than a quarter of the full battery capacity is left, and (3) that the charge for the planned trip is inadequate [23,31]. The primary results of the BEVPO model in Finland and Switzerland include the charging activities reports and the missed trips’ haulage shortage reports for various scenario packages.
We applied the following process to the primary results of BEVPO model to estimate and represent the potential of road freight electrifications by different measures. First, the fuel consumption for diesel trucks and the respective electric energy consumption for BETs was calculated based on the methodology assumptions and datasets represented by Liimatainen et al. [22]. Second, for each scenario package, we summarized all the related measures to the potential of electrification, such as mileage, trip numbers, tkm, tonnage, electric energy consumption, and fuel consumption for diesel trucks. The relevant computations for different scenario packages were done using R programming tools. You can find the R programming codes online at the GitHub account [47]. Finally, for more advanced research, we grouped the outcomes of the trips based on inside and outside O–D regions.

2.5. Extended Range Solutions

Some trips that fail because of battery charge status range shortage could be turned to successful trips by using extended range electric trucks (ERETs). The range that can be covered by range-extender technology and the possible alternative fuel types (e.g., natural gas and biofuels) used are relevant for choosing the best electrification and GHG mitigation options for the short-term plans. GHG emissions of trips that cannot be electrified can be reduced by using cleaner fuels.
We analysed the potential of the range shortage reduction by using the ERETs in the current technology scenario (scenario 1) based on the relevant improvement of different measures such the trip number, trip distance, freight loads, tkm, fuel consumption, and the relevant electricity energy consumptions in both countries.

2.6. Annual Power Grid Load Requirements

Analysis of the demand variation during days, weeks, and seasons is not possible because the O–D freight datasets in this study present only the annual demand. Therefore, the annual power grid load requirements for the charging facilities, including on-road charging stations, depot charging stations, and the ERS routes, can be estimated only based on the geographical distribution of O–D travel data analysis in Finland and Switzerland. The BEVPO model can report the names of on-road charging stations for each trip simulation with on-road charging activities. Thus, it is possible to divide the total energy consumption of the BETs between the specific on-road charging stations and the depot charging zones. We applied an on-road charging ratio for those trip simulations which experienced the on-road charging activities. The ratio would divide the total electric energy needs for the trip between depot charging zone and the specific on-road charging stations. We represent the on-road charging ratio in percentages and the energy provided by the specific on-road charging station(s) in kWh divided by the total energy consumption of the trip in kWh.
Similarly, we define an ERS charging ratio for dividing the total electric energy needs for the trips which get involved with the ERS charging activities. Therefore, the ERS charging ratio is represented in percentages and defined as the energy provided by the ERS in kWh divided by the total energy consumption of the trip in kWh. Regarding the definition of the scenario packages in Section 2.2, we allocate the ERS charging grid power load requirement with this ratio in scenario 2 in Finland.

3. Results

The following sections present the results for comparative geospatial evaluations of different scenario packages in Finland and Switzerland based on the on-road charging facilities, BEVPO model simulation, and the ERS alternative solution in Section 3.1. The relevant results of the extended range solution and the electricity power grid requirements are discussed in Section 3.2 and Section 3.3, respectively. The results are analyzed based on the methodology depicted in Section 2. Section 3.1 aims to answer the first and second research sub-questions in this study. The third research sub-question in this study is answered by Section 3.1 and Section 3.2 together. Finally, Section 3.3 aims to answer the fourth research sub-question in this study.

3.1. Scenario Package Result Analysis

3.1.1. Geospatial Accessibility Analysis of the Current on-Road Charging Facilities

To better explain the geospatial spread of fast chargers over the national road networks in Finland and Switzerland, we applied the ArcGIS network analysis tool to the maps of both countries based on the road networks of the Open Street Map web service. The summary of the results is represented in Table 5 based on 50 km on-road charging coverage. The 50 km assumption for the main road network can be interpreted as maintaining the 50 km range via the rapid charging stations on the map. In other words, the greater the coverages of network by fast charging service polygons with the radius of 50 km, the greater is the likelihood of successful trips with the assistance of on-road fast chargers.
The comparative measures of both countries are shown in Table 5, such as the length of the road network (including various types of motorway, primary, secondary, tertiary, and trunk roads) in km, the length of the network coverage by public charging service in km, the percentage of coverage of the road network, the total number of locations of public charging stations, and the coverage area (overlap included) in km2. The table shows that, although the number of public on-road charging facilities in Switzerland is smaller compared to Finland, the service area coverage of charging facilities in Switzerland is greater compared to Finland.

3.1.2. BEVPO Model Simulation Results Plus the ERS Alternative Solution

After running the BEVPO model, we summarised the results based on items such as trip number, haulage distance, freight load, tkm, fuel consumption for conventional trucks (CTs), and electric energy consumption for BETs. Figure 2 illustrates the comparative charts of successful trips potential for different payload capacity groups in Finland and Switzerland.
The figure represents the potential of electrification by percentages of successful trips based on the trip number, km haulage, ton freight load, tkm, and the energy use. The figure reveals that all the scenario packages in Switzerland result in a higher share of successful trips compared to Finland. By comparing Figure 2 and the findings of the earlier study that used the same data, conducted by Liimatainen et al. [22], the current results reveal great improvements for the electrification potential, up to 20% and 80% in Finland and Switzerland, respectively. The reasons behind such broad variations are the route and truck allocation mechanism used in the BEVPO model, which includes the possibility to use larger battery capacity and charging power than those used in Liimatainen et al. [22].
In Finland, the successful trip coverage of the road freight by utilizing the available locations for fast-charging facilities (scenario 1) was 94% (72% tkm), 92% (55% tkm) and 93% (57% tkm) of trips in group 1, group 2, and combined, respectively. Moreover, it should be noticed that trips with the payload capacity of over 30 t in scenario 1 in Finland have been failed because of existing limitations of battery technology, as discussed in Section 2.2. Therefore, the total successful trip potential is 60% of the trips (10% of tkm) in scenario 1 in Finland. In scenario 2 in Finland, the results improved to 77% of trips (43% of tkm), primarily due to the use of ERS on some routes. The use of the ERS on some routes resulted in 51% of the trips (41% of tkm) being successfully electrified for payload capacities above 30 t (group 3). This accounted for around 18% of total trips share (33% tkm), under the current battery technology circumstances in scenario 2 in Finland. In the other scenarios in Finland, the electrification potential grows before its peak reached around 97% of the trips (93% tkm) being successful, in scenario 5.
In Switzerland, the successful trip coverage of the road freight by utilizing the existing locations of fast charging facilities (scenario 1) is 92% (85% tkm) and 85% (82% tkm) of trips in group 1 and 2, respectively. Scenarios 1 and 2 have about the same outcomes with successful electrification possibilities on 89% of the trips (84% tkm). In the other scenarios, the figures slightly increase before reaching its peak, around 97% (93% tkm), in scenario 5.
Clustering the unsuccessful trips into the inside and outside O–D zones provide further insight into the freight transport survey data. As it is discussed in Section 2.4, the unsuccessful trips inside O–D zones may turn into successful trips, if the scheduling of freight trips are customised efficiently based on the optimised use of depot charging facilities. Therefore, the number of the failed trips inside O–D zones could be added to the successful trip results, which is called the “manageable successful trips”. The comparative charts of the manageable successful trips for the various payload groups in Finland and Switzerland are shown in Figure 3.
Figure 3 represents the potential of electrification by percentages of the manageable successful trips based on the trip number, km haulage, t freight load, tkm, and the energy use. Some improvements can be seen particularly in scenarios 1 and 2 in Finland, when comparing it with Figure 2. This suggests that inaccurate addressing system based on municipality code zones and the larger O–D zones in Finland have an impact on the results. The figure also indicates that for all scenario sets, the minimum electrification potential in Finland is approximately 50% of the trips. The minimum electrification potential in Switzerland is about 90% of the trips.
Figure 4 presents the outcomes for manageable successful trips by share of tkm based on NST2007 commodity groups [48]. The variation of the share of commodity groups for various scenario packages is shown in Figure 4. Mining and quarrying (03) and mail (15) commodity groups with around 75% are the smallest electrification potential in Switzerland, while the smallest electrification potential in Finland belongs to unidentifiable goods (19) with around 20%.
In order to demonstrate more information on the current electrification potential for different types of commodities, Figure 5 displays the comparative graph for the share of total transportation (tkm) and electrification potential (% of tkm) of various goods based on the manageable successful outcomes of scenario 1 for both countries. The values for the electrification potential (% of tkm) in Figure 5 are based on the same assumptions for scenario 1 as the S1 values of “% of tkm” presented in Figure 3, but are presented in a more detailed way at commodity level to analyze which commodities are most suitable for quick implementation of BETs. The figure shows that the range of electrification potential based on manageable successful trip results would change from 20% to 85% and 70% to 100% for Finland and Switzerland based on the current technology scenario (scenario 1), respectively. Moreover, in Finland the highest share of the total haulage is by (18) grouped goods with around 12% which has an electrification potential of around 40%, whereas in Switzerland the highest share of total haulage is by (04) food products with around 19% and an electrification potential of 90%.

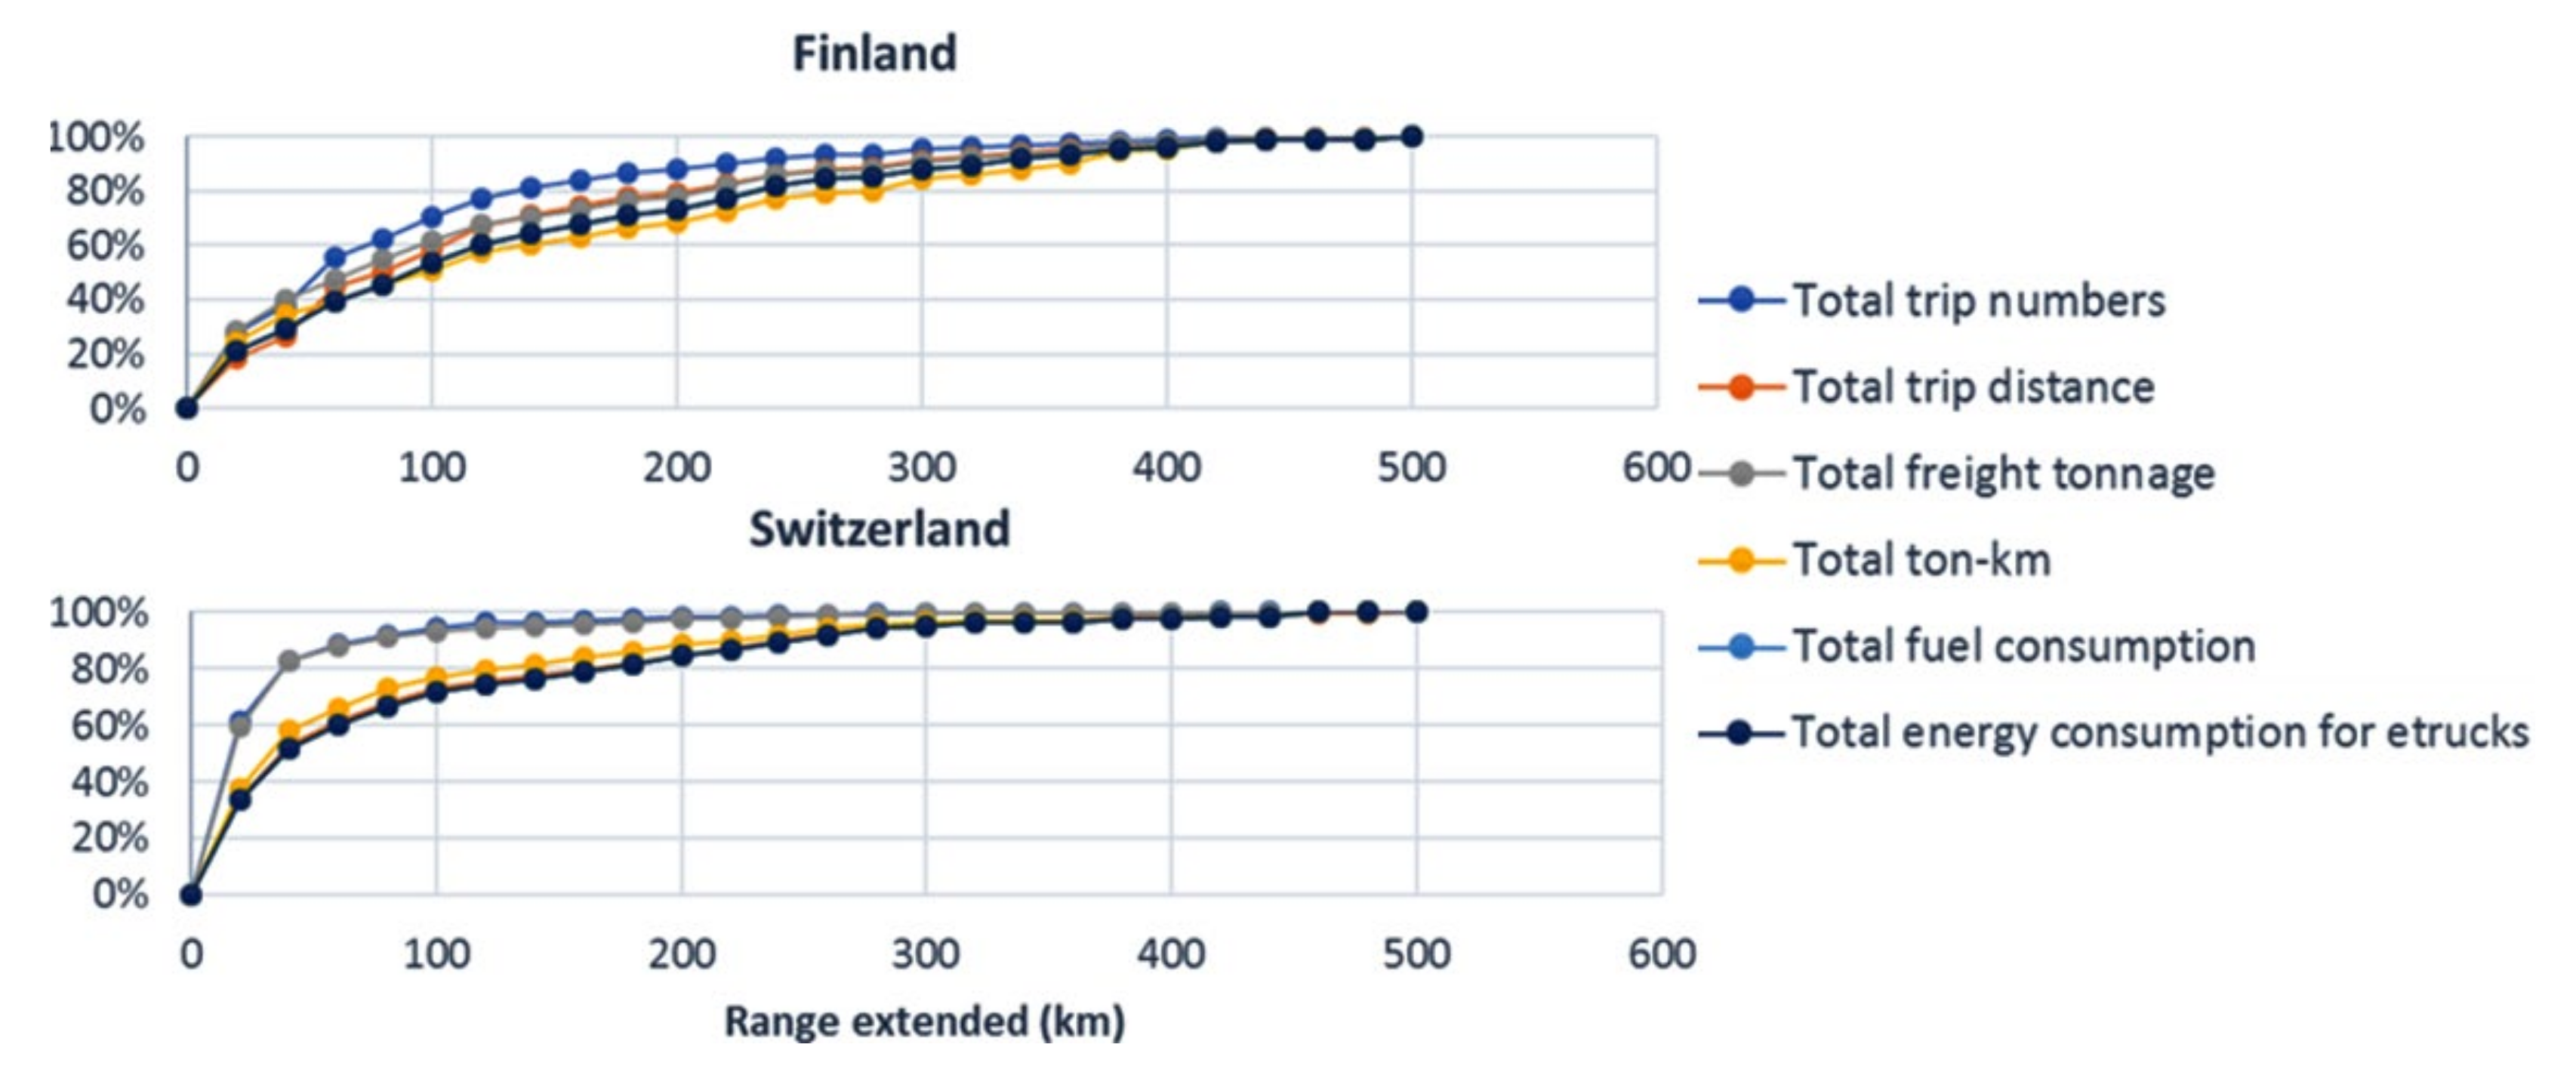
3.2. Extended Range Solution

Regarding the extended range solution discussed in Section 2.5, the shortage of BET range in the failed trips in scenario 1 is visualized for Finland and Switzerland. Figure 6 demonstrates the comparative charts for the possible improvement of various freight measures by the use of range-extender technology in both countries for payload capacities under 30 t (groups 1 and 2).
Figure 6 indicates that there is a greater level of potential improvement in Switzerland than in Finland. Around 70% of failed trips in Finland and 95% in Switzerland can be supported by the use of extended range technology with a 100 km range, for example. Accordingly, the relevant improvement in the electrifiable share of total trips would be 3% (4% tkm) and 10% (12% tkm) in Finland and Switzerland, respectively.
The analysis shows that majority of the failed trips may be covered by extending the range by just 100 km. Such extended range can be covered with additional battery capacity quite easily, especially if the battery price and gravimetric density continue to develop rapidly. However, if the scenario of range-extender technology is developed on the basis of a conventional diesel fuel consumption solutions, the fuel and energy consumption and emission benefits would be partly lost and the extra range would likely be rather costly relative to the marginal benefits, at least in Switzerland. In Finland, however, biodiesel or biogas powered range extender with the range of 100–300 km would be useful on many trips.

3.3. Power Grid Load Requirements for Different Electrification Scenarios

Regarding the definition of the on-road charging and ERS charging ratio in Section 2.6, the power grid load requirements for the charging facilities can be allocated geographically in three categories of the on-road charging stations, depot charging stations, and ERSs. In order to further analyze the impact of the charging ratio on the total power grid load requirement, the sensitivity analysis is applied for all scenario packages. Accordingly, the on-road charging ratio would change in a range from 0 to 100% in all scenario packages in both countries, whereas the ERS charging ratio would change in a range from 0 to 100% only in scenario 2 in Finland. Table 6 represents the sensitivity analysis of the maximum charging possibility demand based on the on-road and ERS charging ratio variation. The table also shows further details and information about the total power grid load requirements in various scenario packages in both countries based on the successful trips (not the “manageable successful trips”) which would help to facilitate the comparative analysis.
Table 6 shows that the on-road charging ratio variation in Finland (0–100%) has a small impact on the total on-road charging possibility range (100% to 86%) as well as the total depot charging possibility range (0% to 14%) in different scenario packages. The total on-road charging possibility as well as the total depot charging possibility in Switzerland are highly sensitive to the on-road charging ratio variation (0–100%) and would range from 100% to 49% as well as 0% to 61%, respectively, in different scenario packages. The table also represents that the total ERS charging possibility in scenario 2 in Finland is quite sensitive to the ERS charging ratio variation (0–100%) and would range from 0 to 61%.
To provide geospatial maps for the power grid load requirements, certain values for the on-road charging ratio and ERS charging ratio must be assumed. It is very challenging to decide about such values in different scenario packages and countries; therefore, a single value would be decided for covering all of them. Accordingly, the on-road charging ratio of 30% and the ERS charging of 50% would be assumed for providing geospatial maps of the electricity power grid requirements in all scenario packages in both countries. Table 7 represents the summary of the power grid load requirement maps.
Table 7 shows that the annual power grid load requirements for on-road charging facilities in Finland (2–4%) would be smaller than in Switzerland (14–18%). This seems to be because of different freight transport demand patterns and accessibility of on-road charging facilities in the two countries. Moreover, the table also reflects that the total annual power grid load demands for the on-road charging facilities would not significantly be changed in different scenarios. This would reflect the fact that the depot charging activities would cover majority of the charging demand employing the charging power and battery capacity improvements in both countries. However, the on-road charging facility and ERS would play a supportive role to reduce the range anxiety in case of long-haul trip demand. Figure 7 represents the annual power grid load requirement maps for the depot charging facilities in different O–D zones in Finland and Switzerland. Additionally, Figure 8 represents the annual power grid load requirement maps for on-road charging facilities in Finland and Switzerland.
O–D zones in Figure 7 are illustrated by 317 municipality code zones and 84 2-digit postal code zones in Finland and Switzerland, respectively. The municipality code zones in Finland and 2-digit postal code zones in Switzerland with annual power grid load demand above 60 and 25 GWh, respectively, are illustrated by the name in Figure 7. Accordingly, the figure represents the big cities and the most important freight hubs as the regions with highest demand for the depot charging facilities.
Figure 8 represents the annual power grid demand for on-road plug-in charging activities based on 57 and 87 on-road charging facilities locations in Finland and Switzerland, respectively. The locations of the on-road charging facilities are based on the assumptions in Section 2.1. The figure also represents the ERS routes in scenario 2 in Finland. Accordingly, the total annual power grid load requirements for all the ERS routes would be 560 GWh (31% of 1833 GWh), based on Table 7. The figure also shows that the annual power grid load requirements for the on-road plug-in charging facilities located alongside the ERS routes in scenario 2 in Finland are considerably smaller compared to other scenario packages.

4. Discussion

The following paragraphs represent the answers and extended discussions for the sub-research questions. The answers also directly or indirectly answer the main research question of this research study: “To what extent can road freight transport be electrified using BETs in Finland and Switzerland currently and considering potential improvements of battery and charging technologies?”
Sub-research question 1: What share of road freight trips (based on, e.g., load types and emission standards) can be covered using the currently available BET models and the current Finnish and Swiss charging infrastructure?
In Finland, 60% of all medium and heavy-duty road freight trips that only cover 10% of all tkm could be electrified by the currently available technology of BETs and available fast charging network. The related electrification potential is estimated in Switzerland to be about 89% of trips covering more than 84 percent of all tkm. The findings explain that with current technology, the electrification potential is very low in Finland, but very high in Switzerland.
In addition, the results show a rise of 20% and 70% in the electrification potential of trips compared to the results of Liimatainen et al. [22] for Finland and Switzerland in 2016 with the same datasets. The increase in the electrification potential using tkm as a metric, however, is much higher, with about 67% for Finland and 460% for Switzerland. Such findings are attributed to the precision of the task of routing (the use of Google Maps direction application program interface) and the geospatial approach in the BEVPO model, as well as the possibility to use larger battery capacity and charging power than those used in Liimatainen et al. [22].
Sub-research question 2: How will the development in the increased range of BETs and charging facilities increase the proportion of successful BET trips in Finland and Switzerland?
Scenarios 2 to 5 were established to assess the effect on the electrification potential of the various BET ranges and the improvement of the charging infrastructure. Therefore, in scenario 5, the battery capacity increases by 75% and the probability of access to ultra-fast charging with a power of 450 kW would increase the potential of the successful BETs trip share by around 60% of trips (1000% of tkm) in Finland and 9% of trips (10% of tkm) in Switzerland, albeit from a much higher base share for Switzerland in scenario 1. However, the largest electrification potential is the same for both countries, around 97% trips (93% of tkm) in scenario 5.
Sub-research question 3: How much could the complementary solutions such as electric road systems and range-extender technologies improve the potential of electrifying Finnish and Swiss road freight?
Given the already high Swiss electrification potential results of the BEVPO model, ERS is not recommended for Switzerland. However, ERSs could be essential for electrifying trucks with payload capacities above 30 t in Finland. The successful BETs trip share potential with ERS would be around 18% trips (34% of tkm) over a 2384 km two-way road network.
Range-extender technology as a short-term plan solution for road freight electrification based on the current battery and charging facility technology would improve the share of successful trips. For example, the range-extender technology covering 100 km would lead to a 3 percentage points increase of successful trips in Finland (4 percentage points of tkm) and 10 percentage points of trips in Switzerland (12 percentage points of tkm). However, range-extender technology must be used with low-carbon fuels like biogas and biodiesel to decrease GHG emissions.
Sub-research question 4: What are the geographical power grid load requirements for different electrification scenarios?
Figure 7 and Figure 8 represent the annual power grid load requirement maps for different electrification scenarios of road freight transport. The results of this research show that the total annual electric energy consumption demand would increase from 739 to 3457 GWh in Finland and from 2141 to 2350 GWh in Switzerland depending on different level of the battery capacity and fast changing technology improvement (in scenarios 1 to 5).
Sensitivity analysis of the possible maximum charging demand in Finland and Switzerland show that the energy consumption shares for the depot charging facilities in Finland (0–14%) are smaller than in Switzerland (0–61%) in different electrification scenarios. This seems to be because of different freight transport demand patterns and accessibility of on-road charging facilities in the two countries. However, the combined effects of improvements in battery capacity and fast charging will reduce the need for on-road charging in both countries.

5. Conclusions

This study expands current knowledge on the electrification potential of MDTs and HDTs in different aspects, including (1) charging activity analysis of BEVs for both MDTs and HDTs truck categories based on plug-in charging and ERS, (2) geospatial data analysis of a large amount of O–D road freight transport demand based on charging activities, (3) geospatial data analysis of regional power grid load demands, and (4) analysis of EREV technology adoption as a complementary solution for road freight transport electrification.
This study shows that electrifying medium and heavy-duty trucks with payload capacities up to 30 t is already feasible with the help of Finnish and Swiss on-road plug-in charging facilities. However, electrifying the road freight transport with trucks with payload capacities above 30 t in some high-demand routes in Finland may only be feasible with the help of ERSs. Range-extender technology with the clean fuel alternatives may facilitate and improve the potential of the road electrification by using medium- and heavy-duty electric trucks of up to 30 t payload capacity in Finland, but in Switzerland the need for extended range is mostly less than 100 km which can be covered with additional battery capacity of BETs.
Almost full electrification of road freight transport can be made possible through future improvement of battery capacity and fast charging facilities. In a full electrification scenario, 97% of the total trips could be covered that account for 93% of the total tkm moved in both countries. This still leaves room for other alternative fuel technologies like FCEVs to fill the gap for very long-haul trips with heavy-duty trucks.
The methodology used in this study for analyzing the large-scale BET adoption potential could be applied to other countries with some improvements. For example, the energy consumption formula in the BEVPO model could be calibrated based on the specific road types and/or regions. Moreover, although this study analyzed the road freight electrification potential of different technology improvement scenarios, the cost analysis and LCA of GHG emission could be used for choosing the most cost-efficient electrification scenario.
The regional annual power grid load requirement maps in this study could be used for the future road freight transport analysis by considering the future growth rate of the demand and the market diffusion model. As a result, the peak power grid load demand could be calculated based on the hourly charging profile in different regions and different time frames like during the different weekdays and seasons. Moreover, the peak power grid load demand resulting from electric road transport could be managed by using a V2G strategy. Finally, the GHG emissions and costs resulting from the electricity power grid mix could be minimized through power plant dispatch models focusing on variable renewable energy resources.

Author Contributions

Conceptualization, H.L. and O.P.R.v.V.; methodology, M.J.S., H.L. and O.P.R.v.V.; software, M.J.S.; validation, H.L., O.P.R.v.V. and M.P.; formal analysis, M.J.S.; investigation, M.J.S.; resources, H.L.; data curation, H.L. and O.P.R.v.V.; writing—original draft preparation, M.J.S.; writing—review and editing, M.J.S., H.L., O.P.R.v.V., M.P.; visualization, M.J.S.; supervision, H.L.; project administration, H.L.; funding acquisition, H.L. All authors have read and agreed to the published version of the manuscript.

Funding

This research received no external funding.

Data Availability Statement

3rd party data for freight transport statistics. Restrictions apply to the availability of these data. Data was obtained from Statistics Finland (http://stat.fi/til/kttav/index_en.html) and BFS (https://www.bfs.admin.ch/bfs/en/home/statistics/mobility-transport/goods-transport.html). Process Model, O-D and Desire Lines Analysis for Road Freight Transport Finland vs. Switzerland available online: https://github.com/MehdiJahangirSamet/O-D-and-Desire-lines-for-road-freight-transport-Finland-vs.Switzerland.

Conflicts of Interest

The authors declare no conflict of interest.

Nomenclature

APIApplication Program Interface
BAUBusiness-As-Usual
BETBattery Electric Truck
BEVBattery Electric Vehicle
BEVPO modelBattery Electric Vehicle Potential model
CTConventional Truck
EDVElectric-Drive Vehicle
ERETExtended Range Electric Truck
EREVExtended-Range Electric Vehicle
ERSElectric Road System
EUEuropean Union
FCEVFuel Cell Electric Vehicle
GHG emissionGreenhouse Gas emission
GVWGross Vehicle Weight
HDTHeavy-Duty Truck
HEVHybrid Electric Vehicle
ICEVInternal Combustion Engine Vehicle
kWhKilowatt hours
LCALife Cycle Assessment
MDTMedium-Duty Truck
O–DOrigin-Destination
PHEVPlug-in Hybrid Electric Vehicle
tkmton-kilometre
V2GVehicle-To-Grid
vRESvariable Renewable Energy Resource

References

  1. Miller, J.D.; Façanha, C. The State of Clean Transport Policy: A 2014 Synthesis of Vehicle and Fuel Policy Developments; International Council on Clean Transportation (ICCT): Washington, DC, USA, 2014; p. 73. [Google Scholar]
  2. Moultak, M.; Lutsey, N.; Hall, D. White Paper: Transitioning to Zero-Emission Heavy-Duty Freight Vehicles; International Council on Clean Transportation (ICCT): Washington, DC, USA, 2017; p. 59. [Google Scholar]
  3. Muncrief, R.; Sharpe, B. Working Paper: Overview of the Heavy-Duty Vehicle Market and CO2 Emissions in the European Union; International Council on Clean Transportation (ICCT): Washington, DC, USA, 2015; pp. 1–59. [Google Scholar]
  4. Mulholland, E.; Teter, J.; Cazzola, P.; McDonald, Z.; Gallachóir, B.P. The long haul towards decarbonising road freight—A global assessment to 2050. Appl. Energy 2018, 216, 678–693. [Google Scholar] [CrossRef]
  5. Zhao, Y.; Tatari, O. Carbon and energy footprints of refuse collection trucks: A hybrid life cycle evaluation. Sustain. Prod. Consum. 2017, 12, 180–192. [Google Scholar] [CrossRef]
  6. Lee, D.Y.; Thomas, V.M. Parametric modeling approach for economic and environmental life cycle assessment of medium-duty truck electrification. J. Clean. Prod. 2017, 142, 3300–3321. [Google Scholar] [CrossRef] [Green Version]
  7. Lee, D.Y.; Thomas, V.M.; Brown, M.A. Electric urban delivery trucks: Energy use, greenhouse gas emissions, and cost-effectiveness. Environ. Sci. Technol. 2013, 47, 8022–8030. [Google Scholar] [CrossRef]
  8. Mareev, I.; Becker, J.; Sauer, D.U. Battery dimensioning and life cycle costs analysis for a heavy-duty truck considering the requirements of long-haul transportation. Energies 2018, 11, 55. [Google Scholar] [CrossRef] [Green Version]
  9. Zhao, Y.; Ercan, T.; Tatari, O. Life cycle based multi-criteria optimization for optimal allocation of commercial delivery truck fleet in the United States. Sustain. Prod. Consum. 2016, 8, 18–31. [Google Scholar] [CrossRef]
  10. Zhao, H.; Burke, A.; Zhu, L. Analysis of Class 8 hybrid-electric truck technologies using diesel, LNG, electricity, and hydrogen, as the fuel for various applications. In Proceedings of the 2013 World Electric Vehicle Symposium and Exhibition (EVS27), Barcelona, Spain, 17–20 November 2013; pp. 1–16. [Google Scholar]
  11. Palencia, J.C.; Nguyen, V.T.; Araki, M.; Shiga, S. The Role of Powertrain Electrification in Achieving Deep Decarbonization in Road Freight Transport. Energies 2020, 13, 2459. [Google Scholar] [CrossRef]
  12. Zhao, Y.; Onat, N.C.; Kucukvar, M.; Tatari, O. Carbon and energy footprints of electric delivery trucks: A hybrid multi-regional input-output life cycle assessment. Transp. Res. Part D Transp. Environ. 2016, 47, 195–207. [Google Scholar] [CrossRef]
  13. Sen, B.; Ercan, T.; Tatari, O. Does a battery-electric truck make a difference? Life cycle emissions, costs, and externality analysis of alternative fuel-powered Class 8 heavy-duty trucks in the United States. J. Clean. Prod. 2017, 141, 110–121. [Google Scholar] [CrossRef]
  14. Teoh, T.; Kunze, O.; Teo, C.C.; Wong, Y.D. Decarbonisation of urban freight transport using electric vehicles and opportunity charging. Sustainability 2018, 10, 3258. [Google Scholar] [CrossRef] [Green Version]
  15. Davis, B.A.; Figliozzi, M.A. A methodology to evaluate the competitiveness of electric delivery trucks. Transp. Res. Part E Logist. Transp. Rev. 2013, 49, 8–23. [Google Scholar] [CrossRef]
  16. Zhou, T.; Roorda, M.J.; MacLean, H.L.; Luk, J. Life cycle GHG emissions and lifetime costs of medium-duty diesel and battery electric trucks in Toronto, Canada. Transp. Res. Part D Transp. Environ. 2017, 55, 91–98. [Google Scholar] [CrossRef]
  17. Vora, A.P.; Jin, X.; Hoshing, V.; Saha, T.; Shaver, G.; Varigonda, S.; Wasynczuk, O.; Tyner, W.E. Design-space exploration of series plug-in hybrid electric vehicles for medium-duty truck applications in a total cost-of-ownership framework. Appl. Energy 2017, 202, 662–672. [Google Scholar] [CrossRef]
  18. Keller, V.; English, J.; Fernandez, J.; Wade, C.; Fowler, M.; Scholtysik, S.; Palmer-Wilson, K.; Donald, J.; Robertson, B.; Wild, P.; et al. Electrification of road transportation with utility controlled charging: A case study for British Columbia with a 93% renewable electricity target. Appl. Energy 2019, 253, 113536. [Google Scholar] [CrossRef]
  19. Taljegard, M.; Göransson, L.; Odenberger, M.; Johnsson, F. Impacts of electric vehicles on the electricity generation portfolio—A Scandinavian-German case study. Appl. Energy 2019, 235, 1637–1650. [Google Scholar] [CrossRef]
  20. Lap, T.; Benders, R.; van der Hilst, F.; Faaij, A. How does the interplay between resource availability, intersectoral competition and reliability affect a low-carbon power generation mix in Brazil for 2050? Energy 2020, 195, 116948. [Google Scholar] [CrossRef]
  21. Park, C. A Study of Smart Grid Effects on Electric Vehicle Management Considering the Change of the Power Capacity Mix. Open Transp. J. 2018, 12, 215–229. [Google Scholar] [CrossRef]
  22. Liimatainen, H.; van Vliet, O.; Aplyn, D. The potential of electric trucks—An international commodity-level analysis. Appl. Energy 2019, 236, 804–814. [Google Scholar] [CrossRef]
  23. Melliger, M.A.; Van Vliet, O.; Liimatainen, H. Anxiety vs reality–Sufficiency of battery electric vehicle range in Switzerland and Finland. Transp. Res. Part D Transp. Environ. 2018, 65, 101–115. [Google Scholar] [CrossRef]
  24. Bräunl, T.; Harries, D.; McHenry, M.; Wager, G. Determining the optimal electric vehicle DC-charging infrastructure for Western Australia. Transp. Res. Part D Transp. Environ. 2020, 84, 102250. [Google Scholar] [CrossRef]
  25. Guo, F.; Yang, J.; Lu, J. The battery charging station location problem: Impact of users’ range anxiety and distance convenience. Transp. Res. Part E Logist. Transp. Rev. 2018, 114, 1–8. [Google Scholar] [CrossRef]
  26. Hilton, G.; Kiaee, M.; Bryden, T.; Dimitrov, B.; Cruden, A.; Mortimer, A. A stochastic method for prediction of the power demand at high rate EV chargers. IEEE Trans. Transp. Electrif. 2018, 4, 744–756. [Google Scholar] [CrossRef] [Green Version]
  27. Wang, Y.; Bi, J. Optimal charging guidance strategies for electric vehicles by considering dynamic charging requests in a time-varying road network. arXiv 2019, arXiv:1908.03670. [Google Scholar]
  28. Colzi, F.; de Nigris, M.; Corti, A.; Savaresi, S.M. Extended range electric vehicles components preliminary sizing based on real mission profiles. In Proceedings of the 2013 World Electric Vehicle Symposium and Exhibition (EVS27), Barcelona, Spain, 17–20 November 2013; pp. 1–8. [Google Scholar]
  29. Redelbach, M.; Özdemir, E.D.; Friedrich, H.E. Optimizing battery sizes of plug-in hybrid and extended range electric vehicles for different user types. Energy Policy 2014, 73, 158–168. [Google Scholar] [CrossRef] [Green Version]
  30. Paffumi, E.; De Gennaro, M.; Martini, G. Innovative technologies for smart cities: Towards customer driven infrastructure design for large scale deployment of electric vehicles and Vehicle-to-Grid applications. Transp. Res. Procedia 2016, 14, 4505–4514. [Google Scholar] [CrossRef]
  31. BEVPO Model. Available online: https://github.com/MMWeb87/BEVPO/ (accessed on 30 September 2020).
  32. Openchargemap. Open Charge Map. 2020. Available online: https://openchargemap.org/site (accessed on 1 February 2020).
  33. Home.selasky. Downloadable Map Files for Electric Vehicle, EV, Charging Stations in Norway, Sweden and Finland. 2020. Available online: http://home.selasky.org/charging/ (accessed on 4 April 2020).
  34. Huismans, H. Electric Trucks: Wishful Thinking or the Real Deal. Master’s Thesis, Delft University of Technology, Delft, The Netherlands, 2018; p. 119. [Google Scholar]
  35. Energy. Sought Coast AQMD Presentation for Zero Emission Heavy Duty Drayage Truck Demonstration (MX30 Class 8). Available online: https://www.energy.gov/sites/prod/files/2014/03/f13/vss115_choe_2013_o.pdf (accessed on 30 September 2020).
  36. Commercialmotor, EMOSS Electric Trucks: Road Test. Available online: https://www.commercialmotor.com/news/buying-advice/emoss-electric-trucks-road-test (accessed on 30 September 2020).
  37. EMOSS. BET and Range Extender Models. Available online: http://www.emoss.nl/wp-content/uploads/brochure_emoss_2016_web.pdf (accessed on 19 February 2020).
  38. Electricvehicles. Electric Truck Manufacturers-Emoss Electric Trucks. Available online: https://electricvehicles.in/electric-truck-manufacturers-emoss-electric-trucks/ (accessed on 30 September 2020).
  39. DAF. Available online: https://www.daf.com/en/about-daf/sustainability/alternative-fuels-and-drivelines/battery-electric-vehicles/news-article-folder-bev/daf-cf-electric-drives-150000-electric-kilometres (accessed on 30 September 2020).
  40. BYD. Available online: https://en.byd.com/truck/#models (accessed on 30 September 2020).
  41. Langhelle, O.; Bohne, R.; Nørbech, T.E. Electric Roads in Norway: A Summary of a Concept Analysis. Electric Infrastructure for Good Transport (ELinGO), PDF Report, 2018, 30p. Available online: https://www.vegvesen.no/_attachment/2322599/binary/1262403?fast_title=Final+report+-+Electric+roads+in+Norway+-+Summary+of+a+concept+analysis.pdf (accessed on 30 September 2020).
  42. WSP Oy. Business Transportation on the Road Network Volume and Value Analysis in 2015, Online PDF Report, 2017, 52p. Available online: https://ek.fi/wp-content/uploads/Elinkeinoelaman-kuljetukset-tieverkolla_volyymi-ja-arvoanalyysi_WSP-Finland.pdf (accessed on 30 September 2020).
  43. BFS. BFS Goods Transport. 2018. Available online: https://www.bfs.admin.ch/bfs/en/home/statistics/mobility-transport/goods-transport.html (accessed on 4 April 2019).
  44. Statistics Finland 2018. Goods Transport by Road. 2018. Available online: http://stat.fi/til/kttav/index_en.html (accessed on 1 April 2019).
  45. Opendata Swiss. Official Index of Cities and Towns Including Postal Codes and Perimeter. 2018. Available online: https://opendata.swiss/en/dataset/amtliches-ortschaftenverzeichnis-mit-postleitzahl-und-perimeter (accessed on 30 September 2020).
  46. Statistics Finland 2015. Postal Code—Municipality Key in Finland. 2015. Available online: http://www.stat.fi/org/avoindata/paikkatietoaineistot/paavo_en.html (accessed on 20 February 2020).
  47. Process Model. O-D and Desire Lines Analysis for Road Freight Transport Finland vs. Switzerland. Available online: https://github.com/MehdiJahangirSamet/O-D-and-Desire-lines-for-road-freight-transport-Finland-vs.Switzerland (accessed on 30 September 2020).
  48. NST2007. Standard Goods Classification for Transport Statistics (NST). Available online: https://ec.europa.eu/eurostat/statistics-explained/index.php/Glossary:Standard_goods_classification_for_transport_statistics_(NST) (accessed on 30 September 2020).
Figure 1. The linear regression model for estimating the energy consumption in battery electric trucks (BETs) with higher payload capacity.
Energies 14 00823 g001
Figure 2. Comparative analysis of successful trips in Finland and Switzerland in each scenario for various payload capacity groups.
Energies 14 00823 g002
Figure 3. Comparative chart of manageable successful trips for various payload groups in Finland and Switzerland.
Energies 14 00823 g003
Figure 4. Comparative chart of manageable successful trips (share of tkm) in battery electric vehicle potential (BEVPO) model based on NST2007 [48] commodity groups in Finland and Switzerland.
Energies 14 00823 g004
Figure 5. Comparative graph of the manageable successful trip outcomes for the share of total haulage (tkm) and electrification potential (% of tkm) of various commodities based on the current technology scenario (scenario 1) in Finland and Switzerland.
Energies 14 00823 g005
Figure 6. Comparative chart for possible improvement of electrification potential by the use of range-extender technology in Finland and Switzerland for payload capacities under 30 t (group 1 and 2) in scenario.
Energies 14 00823 g006
Figure 7. Annual power grid load requirement maps for depot charging facilities in different O–D zones in Finland and Switzerland.
Energies 14 00823 g007
Figure 8. Annual power grid load requirement maps for on-road charging facilities in Finland and Switzerland.
Energies 14 00823 g008
Table 1. Summary of global research on electric-drive vehicle (EDV) technology adoption for medium-duty trucks (MDTs) and heavy-duty trucks (HDTs).
Author(s)YearRegionEDV TechnologyTruck CategoryOrigin–Destination (O–D) Data AnalysisCharging Activity AssessmentGeospatial Analysis
Battery Electric Vehicle (BEV)Extended-Range Electric Vehicle (EREV)MDTHDTPlug-In Depot ChargingPlug-In On-Road ChargingElectric Road Systems (ERS)Charging ActivityPower Grid Demand
Lee et al. [7]2013US
Zhao et al. [10]2013US
Davis and Figliozzi [15]2013US
Zhao et al. [9]2016US
Zhao et al. [12]2016US
Zhao and Tatari [5]2017US
Lee and Thomas [6]2017US
Sen et al. [13]2017US
Zhou et al. [16]2017Canada
Vora et al. [17]2017US
Mareev et al. [8]2018Germany
Teoh et al. [14]2018Singapore
Liimatainen et al. [12]2019Finland, Switzerland
Palencia et al. [11]2020Japan
This study2021Finland, Switzerland
Table 2. Depot and on-road charging power assumption.
Scenario 1Scenario 2Scenario 3Scenario 4Scenario 5
Depot charging power range in kW44–6644–6666–12066–12066–120
On-road charging power range in kW50–120150250450450
Table 3. Battery electric truck (BET) features per group for battery electric vehicle potential (BEVPO) model simulation procedures.
Payload Capacity GroupsDifferent Scenarios Represented by BET Features *
Scenario 1Scenario 2Scenario 3Scenario 4Scenario 5
Group 1 with 4 BET models (payload capacity up to 11 t) EMS 1612: 10 t, 125 km, 120 kWh, 0.82 kWh/kmEMS 1612: 10 t, 125 km, 120 kWh, 0.82 kWh/kmEMS 1612 (+50%): 10 t, 188 km, 180 kWh, 0.82 kWh/kmEMS 1612 (+50%): 10 t, 188 km, 180 kWh, 0.82 kWh/kmEMS 1612 (+75%): 10 t, 219 km, 210 kWh, 0.82 kWh/km
EMS 1620: 9 t, 210 km, 200 kWh, 0.81 kWh/kmEMS 1620: 9 t, 210 km, 200 kWh, 0.81 kWh/kmEMS 1620 (+50%): 9 t, 315 km, 300 kWh, 0.81 kWh/kmEMS 1620 (+50%): 9 t, 315 km, 300 kWh, 0.81 kWh/kmEMS 1620 (+75%): 9 t, 368 km, 350 kWh, 0.81 kWh/km
EMS 1820: 11 t, 190 km, 200 kWh, 0.89 kWh/kmEMS 1820: 11 t, 190 km, 200 kWh, 0.89 kWh/kmEMS 1820 (+50%): 11 t, 285 km, 300 kWh, 0.89 kWh/kmEMS 1820 (+50%): 11 t, 285 km, 300 kWh, 0.89 kWh/kmEMS 1820 (+75%): 11 t, 333 km, 350 kWh, 0.89 kWh/km
EMS 1824: 10 t, 230 km, 240 kWh, 0.89 kWh/kmEMS 1824: 10 t, 230 km, 240 kWh, 0.89 kWh/kmEMS 1824 (+50%): 10 t, 345 km, 360 kWh, 0.89 kWh/kmEMS 1824 (+50%): 10 t, 345 km, 360 kWh, 0.89 kWh/kmEMS 1824 (+75%): 10 t, 403 km, 420 kWh, 0.89 kWh/km
Group 2 with 3 BET models (payload capacity 11–30 t)MX30 Class 8: 25 t, 201 km, 320 kWh, 1.35 kWh/kmMX30 Class 8: 25 t, 201 km, 320 kWh, 1.35 kWh/kmMX30 Class 8 (+50%): 25 t, 302 km, 480 kWh, 1.35 kWh/kmMX30 Class 8 (+50%): 25 t, 302 km, 480 kWh, 1.35 kWh/kmMX30 Class 8 (+75%): 25 t, 352 km, 560 kWh, 1.35 kWh/km
Class 8-day cab: 36 t, 200 km, 435 kWh, 1.85 kWh/kmClass 8-day cab: 36 t, 200 km, 435 kWh, 1.85 kWh/kmClass 8-day cab (+50%): 36 t, 300 km, 653 kWh, 1.85 kWh/kmClass 8-day cab (+50%): 36 t, 300 km, 653 kWh, 1.85 kWh/kmClass 8-day cab (+75%): 36 t, 350 km, 761 kWh, 1.85 kWh/km
DAF CF Electric: 30 t, 100 km, 170 kWh, 1.45 kWh/kmDAF CF Electric: 30 t, 100 km, 170 kWh, 1.45 kWh/kmDAF CF Electric (+50%): 30 t, 150 km, 255 kWh, 1.45 kWh/kmDAF CF Electric (+50%): 30 t, 150 km, 255 kWh, 1.45 kWh/kmDAF CF Electric (+75%): 30 t, 175 km, 298 kWh, 1.45 kWh/km
Group 3 with only one BET model (payload capacity more than 30 t)Not EvaluatedNew Group 3: 42 t, 130 km, 340 kWh, 2.16 kWh/kmNew Group 3 (+50%): 42 t, 200 km, 510 kWh, 2.16 kWh/kmNew Group 3 (+50%): 42 t, 200 km, 510 kWh, 2.16 kWh/kmNew Group 3 (+163%): 42 t, 350 km, 893 kWh, 2.16 kWh/km
* BET features are represented based on the following order. The name of the model: payload capacity, range, battery capacity, and energy consumption.
Table 4. Finnish electric road route scenario based on the highest demand for heavy road freight transport.
Route No.Routes *Length (km) **
1Helsinki/Porvoo/Kotka/Hammina/Kouvola/Lahti305
2Helsinki/Turku165
3Helsinki/Tampere/Seinäjoki/Vaasa618
4Helsinki/Lahti/Jyväskylä/Oulu/Kemi825
5Turku/Tampere/Jyväskylä471
Total2384
* Routes are considered in both directions. ** Length of roads are based on the road network in Google Maps and in one direction.
Table 5. Comparative coverage of charging service areas of the fast charging stations on Finnish and Swiss roads at the beginning of 2020 [41].
Road Network Properties for Charging FacilitiesFinlandSwitzerland
Length of road network (km) *33,94124,632
Length of network covered by 50 km accessibility radius of charging stations (km)13,91317,440
Percentage of network covered by 50 km accessibility radius of charging stations41%71%
Public charging stations5787
Coverage area (overlaps included) km212,51468,176
* Length of road network is calculated based on the road network’s shapefile available in Open Street Map data, licensed under the Open Database 1.0 License. The length of roads may not reflect the total road network in these countries.
Table 6. Sensitivity analysis of the maximum charging possibility demand based on the on-road and ERS charging ratio variation.
Different ScenariosOn-Road Charging Ratio Range in %ERS Charging Ratio Range in %FinlandSwitzerland
Total Annual Electricity NeedsTotal Charging Possibility Range byTotal Annual Electricity NeedsTotal Charging Possibility Range by
Total Electricity in GWh% of Full Electrification *Depot Charging in %On-Road Charging in %ERS in %Total Electricity in GWh% of Full Electrification *Depot Charging in %On-Road Charging in %ERS in %
Scenario 10–100-73920100–860–14-214185100–390–61-
Scenario 20–1000–100183348100–380–10–61215085100–390–61-
Scenario 30–100-330087100–930–7-231692100–490–51-
Scenario 40–100-328087100–930–7-232392100–490–51-
Scenario 50–100-345791100–930–7-235093100–490–51-
* % of full electrification is the same values that are represented as “% of energy use” in Figure 2.
Table 7. Summary results for the power grid load requirement maps.
Different ScenariosFinlandSwitzerland
Total Annual Electricity NeedsTotal Charging Possibility byTotal Annual Electricity NeedsTotal Charging Possibility by
Total Electricity in GWh% of Full ElectrificationDepot Charging in %On-Road Charging in %ERS in %Total Electricity in GWh% of Full ElectrificationDepot Charging in %On-Road Charging in %ERS in %
Scenario 173920964-2141858218-
Scenario 2183348690312150858218-
Scenario 3330087982-2316928515-
Scenario 4328087982-2323928515-
Scenario 5345791982-2350938614-
Publisher’s Note: MDPI stays neutral with regard to jurisdictional claims in published maps and institutional affiliations.

