1. Introduction
Reductions in greenhouse gas (GHG) emissions are urgently needed to mitigate the effects of climate change. In the UK, the government has committed to continuously reduce emissions to net zero by 2050. This target will require significant change in all sectors and there is a particular focus on reducing emissions from transport as it makes the largest contribution of any sector (28% of UK GHG emissions in 2018) [
1]. To ensure genuine carbon reductions are achieved, GHG emissions across the whole vehicle lifecycle should be considered: vehicle production, fuel production and distribution (well to tank), in use emissions (tank to wheels), and vehicle disposal.
Electrification is expected to present a good route to decarbonisation for light-duty applications, assuming reductions in electricity grid carbon intensity. However, this route is challenging for heavy-duty vehicle applications due to high journey power and energy requirements, leading to large batteries which may limit payload thereby increasing operating costs, and the need for high power, rapid charging to meet vehicle utilisation requirements, potentially requiring a second offboard battery. Hydrogen fuel cells present an opportunity in this sector due to the higher energy density of hydrogen storage compared to lithium ion batteries and rapid refuelling. However, a considerable challenge remains to meet power, durability and commercial requirements of the heavy duty market, which suggest that this solution may reach the market only in the medium to long term [
2].
Sustainable liquid fuels can provide a short- to medium-term mechanism to decarbonise heavy-duty transport, alongside optimised combustion engine technology and aftertreatment to support air quality requirements. In the UK in 2019, 5.1% of fuel sold for road and non-road machinery was certified as renewable fuel giving an average of 82% GHG saving [
3]. However, sustainable liquid fuel volumes are limited by commercial production capacity and feedstock availability, where concerns around competition with the use of feedstocks for food and changes in land use to produce these feedstocks can limit supply.
Biomethane presents an opportunity to decarbonise heavy duty vehicles with recent UK on road trials showing that biomethane powered trucks can give 76% GHG emissions reduction compared to an equivalent diesel truck [
4]. Within the UK use of biomethane trucks is developing, for example Waitrose (a UK supermarket) has a fleet of 76 biomethane powered vehicles.
Methane is a potent GHG with a global warming potential (GWP) 23–36 times carbon dioxide over 100 years with an average lifetime in the atmosphere of 12.1 years [
5,
6]. In the UK in 2018, methane was the second largest contributor to GHG emissions, at more than half of net non-CO
2 GHG [
1] as shown in
Figure 1, based on a bottom up assessment of sources.
Natural sources of methane make up 33–54% of total methane emissions [
7], key sources include: ruminant animals, wetlands, damp soil, melting permafrost, ocean sediments. Anthropogenic methane (emissions due to human activity) then makes up the remaining 46–67% of methane emissions [
7], with sources including land-use change, livestock, rice agriculture, landfill, waste water treatment, biomass burning (e.g., forest clearance), oil and natural gas supply chains, coal mining and the effects of climate change (for example melting permafrost).
Figure 2 shows anthropogenic methane sources within the UK, where the largest sources are agriculture and waste management, again based on a bottom up assessment of sources [
1].
Levels of greenhouse gases in the atmosphere are observed globally and monthly, and averages from US National Oceanic and Atmospheric Administration Earth Systems Research Laboratories [
8] show a long-term global trend of rising methane levels. To understand the possible reasons for this increase in methane emissions, recent work has used analysis of the isotopes of atmospheric methane [
9]. It attributes the rise to anthropogenic causes, primarily agriculture and fossil fuel production and distribution with potential contributions from wetlands. Other authors have considered expected future increases in methane levels due to potential feedback between climate change and methane levels (e.g., melting permafrost and increased wetland emissions) [
7]. Estimates of the effect of climate feedback showed that the increases in methane emissions could exceed current methane emissions due to fossil fuel, and be of a similar magnitude to agricultural emissions [
10]. Abatement of these emissions would require cuts in GHG emissions exceeding all industrial sources to compensate for these additional natural methane sources [
9].
There is thus an urgent need to reduce atmospheric methane emissions. This paper proposes that if a proportion of these anthropogenic sources of methane (which are effectively waste) are upcycled (collected and processed) they could then power heavy duty freight applications with an internal combustion engine. This could provide a twofold benefit both in reducing overall GHG emissions and providing a low-cost sustainable fuel for transport applications that are may otherwise be slow to decarbonise.
Methane has a high global warming potential, therefore conversion of anthropogenic methane emissions to CO2 via oxidation (in an internal combustion engine) can give a significant reduction in GHG emissions. Stoichiometric combustion of methane produces 2.75 kg of CO2 for every kg of methane, thereby reducing the global warming potential approximately tenfold. Additionally, combustion of methane as opposed to diesel would also reduce CO2 emissions due to the lower carbon to hydrogen ratio of methane.
This paper focuses on the local energy system of a community within the South East of England, considering the environmental and economic implications of decarbonising fossil diesel powered heavy-duty freight applications in the near future using upcycled methane in a dedicated gas truck. The case study examines the level of methane that might be available to upcycle within the community and estimates the lifecycle GHG emissions and costs for the use of this fuel within a realistic truck operation. Performance is then compared against other currently available alternatives (a battery electric and fossil natural gas powered vehicle) both considered within the context of the local electricity and gas supply, developing a sustainability index to consider differences holistically. While the analysis is specific to the South East of England, the approach can readily be extended to other regions and ecosystems (e.g., farms or airports). For example, the upcycled methane could be used in agricultural machinery, such as the methane powered tractor recently launched by New Holland [
11].
2. Materials and Methods
The paper considers potential for methane upcycling within a community energy system. The fate of environmental methane sources is considered in a business as usual situation. Then a net negative emissions GHG scenario is proposed where these sources are deliberately captured and used in a transport application (upcycled). A heavy duty transport mission within this locality is explored, considering GHG benefits and cost of the use of upcycled methane in heavy duty truck compared to emissions from a similar truck powered by diesel, electricity and fossil natural gas.
Geographical setting
Steyning, Bramber and Upper Beeding are a group of towns located in West Sussex, on the south coast of England (see
Figure 3). The towns have a combined population of 10,589 people [
12] with two supermarkets which regularly receive deliveries by articulated trucks from distribution hubs. These towns have an 11 kV electricity grid, which is supplied through transformers with 45 MVA capacity. There are currently two commercial EV charging points one of 7 kW and one 50 kW capacity. The natural gas supply to the town is via the low pressure main at less than 75 mbar pressure. There are two significant biomethane sources within the locality: a shared sewage waste treatment facility and 27 hectares (ha) of managed grasslands, in the form of public parks, schools, sporting facilities and large private estates; both these sources will be considered in this paper.
Vehicle baseline and duty cycle
Road transport is the most common method for transport of goods within the UK, with >90% of tonne-km movements on road in the UK [
13] and >75% tonne-km movements on road in Europe [
14] with the vast majority of long haul freight vehicles in the UK currently diesel powered. In Europe, heavy-duty vehicle CO
2 emissions are assessed based on modelling from the VECTO [
15] simulation tool, with a similar tool, GEM [
16], in use in the USA. In this analysis, a diesel articulated truck with a maximum Gross Vehicle Weight (GVW) of 40 tonnes is assumed with a payload of 19.2 tonnes (based on the standard VECTO payload). A 40 t long-haul vehicle is selected because while this class of vehicle makes up 18% of the number of vehicles on the road in the UK, they emit the largest portion of GHG emissions in freight operations (44–46% of freight emissions) [
17]. The average length of road haul journey in the UK in 2017 was 104 km [
18], so a figure of 100 km is assumed for the purposes of this analysis. The energy required to make this journey was then calculated to be 126 kWh/100 km at the wheels, based on a the VECTO long-haul duty cycle [
15]. For alternative powered vehicles it is assumed that the mass of the vehicle is unchanged compared to the diesel vehicle, so this power requirement is the same for all powertrains.
2.1. Methane Upcycling
Methane upcycling describes the process where anthropogenic methane sources or emissions are collected from the environment and processed for use (in this case for road transport), thereby avoiding emissions to atmosphere. This section considers sources of environmental methane which could be used in the area of the UK considered in the case study (sewers and excess grass collection) and a potential method to process this methane prior to vehicle refuelling. Unless otherwise stated, analysis throughout the paper considers a methane GWP of 36 over 100 years following analysis by the Intergovernmental Panel on Climate Change (IPCC) [
5].
2.1.1. Potential Methane Sources
Sewers
Around two thirds of the UK sewage sludge is currently treated by anaerobic digestion (AD) [
19] which was used to generate ~408 MW of power in 2018 [
20]. There is potential to capture additional methane from other sources in the waste water treatment system, for example methane contained in gas and liquid within the sewer network. This work, therefore, assumes that the sewage sludge is already fed into an AD process in the case study area, so only methane remaining within the sewer system is available for upcycling.
Investigations have been conducted to measure the emissions from rising main sewers and pumping stations with varying findings. In sewers, levels of dissolved methane measured were found to be within the range 1.1–52.8 kg CH
4/day [
21], whilst levels of gaseous methane resulted in an overall emission of 0.10–0.32 kgCO
2e/m
3 raw sewage day [
22,
23,
24] (assuming a GWP for methane of 25). In pumping stations, where the turbulent regime means that dissolved methane is released as it is exposed to atmosphere [
21], measured methane emissions have been shown to range from 1.13–11.68 kg CH
4/day, with a mid range value per hour (h) of 0.7 mg/L/h cited in [
23].
Based on the data reported above, a mid range value for overall gaseous emission of 0.18 kg CO
2-e/m
3 raw sewage per day is assumed, taking into account the UK sewage processing rate of over 10 billion litres per day.
This results in a methane output of 26.28 kt per year (yr) emitted as gaseous methane from the sewers.
The dissolved methane in the sewage can be estimated based on the production rate stated above of 0.7 mg/L/h [
23] and sewage processing rate in the UK of 10 billion litres per day. On a daily basis, dissolved methane is calculated as:
This simple analysis shows that dissolved methane emissions of 61.32 kt per year might be expected nationally.
Total methane emissions from UK sewers are estimated from the total gaseous (26.28 kt/yr) and dissolved emissions (61.32 kt/yr) to be 87.60 kt per year from UK sewers, which equates to 4.8 PJ, or around 1.5% of heavy duty transport energy use. Then, scaling to the population of the case study area, we calculate that 14.10 t per annum may be emitted from the sewers. Capturing this methane is in general challenging due to the relatively low concentrations; however, in some areas of the sewer network (such as rising mains) concentrations might be expected to be higher so our assumption is that methane is collected in these areas. We assume pessimistically that 10% of the methane present could be upcycled, yielding 1.41 t/yr of methane, assuming that sewage sludge is already digested and used elsewhere.
Waste Grass
Managed land in our example consists of public parks, sporting grounds and large estates, and accounts for 27.25 ha in the area considered, excluding farmland and small private gardens (although waste from these sources could also contribute material). This section compares methane emissions from waste grass from this land area for two cases:
The baseline case where it is assumed that 80% of the cut grass on managed land is collected and stored in a pile to compost with no active management to improve aeration, as is typical for managing such grassland.
An alternative case where 80% of the waste grass is diverted to a controlled AD process to produce methane for use in the transport mission.
AD of biogenic material produces biogas consisting of methane, CO
2 and other trace elements, with the precise composition depending on the feedstock and process. In contrast, composting (where oxygen penetrates the biogenic material as it decomposes) produces much lower levels of methane alongside N
2O. When aeration is properly managed, emitted levels of methane can be close to zero. However, in the case of the disposal of waste grass with no active management as has been observed in this location, no deliberate aeration is carried out, increasing methane emissions. Studies [
25,
26] have shown that composting grass converts 80% of the carbon mass to CO
2, up to 3.5% of the carbon mass to CH
4 and up to 0.5% of the nitrogen mass to N
2O.
A range of studies have considered grass yield from various types of land, and potential biogas yields from anaerobic digestion of this grass. In [
27] the authors compare methane yields from grass from uncultivated grassland, riverbank and highway verges, using experimental tests to understand methane yield potential and lifecycle analysis to compare the energy balance to maize waste (a common feedstock for commercial AD plants). The study concludes that river banks provide the highest yield of grass, but the lowest biogas yield of the three locations (0.34 m
3/kgTS (Total Solids)), with the overall conclusion that residual grass has the potential to provide a feedstock for AD plants to replace maize, albeit with higher volumes of feedstock required due to lower methane production rates from grass. In [
28] Meyer examines availability of grass from roadside verges in Denmark and calculates potential biomass and biogas yields and then estimates energy return on invested energy, citing a methane yield during AD of 0.27 m
3 CH
4/kg VS. The study concludes that 1.5% to 3% of Danish AD energy production could be supplied by this feedstock and also highlights a potentially positive impact on biodiversity due to the removal of grass clippings. In [
29] the same author develops forecasts for biogas energy yields from agricultural waste products in 2030, again to understand the potential to replace maize waste as a feedstock for AD, forecasting that 1.2 e3 to 2.3 e3 PJ/year may be available in the European Union (EU28). This study cites a practical grass yield for the UK of 3.34 tTS/ha/yr.
Case 1: Composting
In our baseline case, 72.8 t TS of grass is composted without active management per annum (based on a yield of 3.34 tTS/ha/yr). To calculate the mass of carbon available, it is assumed that grass is comprised of 50% carbon, 6.5% hydrogen, 41.5% oxygen and 2% nitrogen by mass [
30]. As the carbon content is absorbed from CO
2 in the air, each kg of grass has absorbed 1.8 kg of CO
2 in its growing phase. Based on the estimated yield of 72.8 tTS per year, the grassland in our example absorbs 166.5 tCO
2 per year, resulting in composting emissions of 29.4 tCO
2, 0.6 tCH
4, and 8 kgN
20 which equates to 53.9 tCO
2e/year.
Case 2: Anaerobic Digestion
For this case, potential methane yield from anaerobic digestion of grass harvested in the example towns is estimated based on data from the literature review above: grass yields of 3.34 t TS/ha/yr of grass and a methane yield during AD of 0.27 m
3 CH
4/kg Volatile solids (VS), assuming that 80% of the grass is collected, with the grass having a volatile solids content of 88% [
28]. The proportion of methane in biogas varies depending on many factors. Ranges from 50% to 75% CH
4 have been reported, dependent on the feedstock and specific parameters used to control the digestion process [
31,
32]. Total GHG emissions from the AD process are therefore composed of methane emissions (calculated as above) and a proportionate amount of CO
2. Assuming a low value of 50% methane content in the resultant biogas due to the low protein and fat content of the feedstock, we calculate that 11.3 t of methane and 31.1 t CO
2 would be produced per year by the anaerobic digester.
Table 1 summarises assumptions and total GHG emissions for both cases.
To fuel the transport mission, the methane collected from the sewers (1.4 t) is combined with methane generated through collection of waste grass and processing via AD (11.3 t) to give a total methane production of 12.7 t per year with an equivalent calorific value to 17,700 L of diesel. This volume of fuel will give the modelled heavy-duty truck a range of around 44,000 km per year so, therefore, we compare the use of alternative powertrains based on this distance travelled per year.
2.1.2. Small-Scale Refinement of Upcycled Methane
For many applications, such as usage in a heavy-duty gas engine, a consistent quality biomethane is required. Therefore, a refinement process is required to remove the trace components and a portion of the CO
2. A range of treatment technologies exist, with water scrubbing, chemical solvents, and pressure swing adsorption being the most widely used. However, these are most effective at a large scale and require significant plant to achieve pressure and temperature swings [
33]. To reduce energy use in the process and local feedstock transport overhead, co-location of biomethane production and treatment facilities is advantageous, requiring smaller scale treatment processing plant than is the current practice.
One approach that could be suitable for small-scale applications is to utilise cryogenic techniques similar to air distillation systems to purify the gas. In this approach, the biogas mixture is cooled, resulting in the constituent components condensing out of the mixture into different fractions, resulting in a high-purity liquid biomethane (LBM) product. Cryogenic liquid-air energy storage systems have been reported, with energy inputs of 0.478 kWh/kg of liquid air [
34]. The temperatures involved in liquefying methane are 34 K higher than air, therefore methane refining would be expected to require less energy than air. However we make the assumption that a similar process energy is required and make the further assumption that the energy used to run the process comes from the electricity grid, so the refining process GHG emissions are estimated to be 9 gCO
2e/kWh of fuel energy.
2.2. Vehicle Lifecycle Greenhouse Gas (GHG) Emissions
Vehicle lifecycle GHG emissions include fuel production and distribution, well-to-tank (WTT), in-use emissions, tank-to-wheels (TTW), and vehicle production and disposal. In general, vehicle disposal emissions are much lower than production and in use contributions, generally estimated to be less than 5% of overall lifecycle emissions [
35], so are neglected for this high-level analysis.
2.2.1. Well-to-Tank Emissions
Baseline Diesel Vehicle
The UK government publishes data on the CO
2 equivalent emissions of a wide range of fuels [
36]. According to this data set, diesel containing an average UK biofuel blend has WTT GHG emissions of 725.8 gCO
2e/kg.
Battery Electric Vehicle
Electricity supply
Carbon intensity of the electricity supply varies due to generation mix and, therefore, location, Carbon Intensity API [
37] provides a regional breakdown of grid carbon intensity by region in the UK. The average grid carbon intensity for the South East of England in 2019 was 235 gCO
2e/kWh of which 52% was imported from outside the region, and the remaining power derived from local generation.
It should be noted that the quoted figures are at generation. There are losses associated with transmission and transformation when distributing the electricity and, when used for transportation, in charging the vehicle’s batteries. Therefore, for every kWh of electricity used at destination a greater amount of electrical energy is required at generation. Typical transformer efficiency has a peak efficiency of around 98% at 40% load and substantial efficiency drops at very high or very low loads [
38].
Further transmission loss also occurs in power lines: for AC transmission, 2.5% power loss over long distances can be expected [
39]. Typical loading of transformers varies widely by region. A study comparing the London Power Network (LPN) to Eastern Power Network (EPN) reported the average loading of the LPN of 51% and EPN of 31% [
40]. The study also reported that 20% of the LPN and 4% of the EPN transformers operated at >70% loading, and that 30% of LPN and 16% of EPN transformers operate at <20% loading, where significant reductions in efficiency are observed. We have assumed a 40% loading in this model yielding a transformer efficiency of 98%/step.
There are multiple transformation steps between the national transmission grid and local 11 kV distribution. In this region, three transformation steps are present for energy coming from the 400 kV national grid (imports) via 132 kV to 33 kV local distribution stages. Local generation (gas, solar and wind) avoids the 400 kV to 132 kV transformation and thereby reduces the number of transformations. In this work we assumed three steps to imports from the transmission grid and two steps for locally derived electricity, assuming 52.4% imported electricity. This yields a total system distribution efficiency of 95%. Therefore, the effective carbon intensity of the electricity at the point of use rises slightly from 235 gCO2e/kWh to 248 gCO2e/kWh.
Battery charging
Battery charging incurs additional losses that should be accounted for in the calculation of a WTT CO
2e value. It is assumed that these trucks will be fast charged at rates of up to 50 kW in line with currently available charging infrastructure. At this charging power, efficiencies of 88–92% are reported [
41,
42] at 25 °C, giving an overall electricity carbon intensity of 269 gCO
2e/kWh. It is likely that with increased uptake of electric vehicles in this sector, demand for vehicle utility will lead to increased charging power to reduce charging time which may increase these losses.
Grid Natural Gas
WTT emissions for grid natural gas are published by UK Department for Business, Energy and Industrial Strategy (BEIS) [
36]. These figures include the small proportion of biomethane that is present within the UK grid (1–2%), fugitive emissions from the grid of around 0.4% [
43] and for compressed natural gas (CNG) compression to refuelling pressures from the local grid from which our towns source natural gas. Liquefied natural gas (LNG) vehicle WTT emissions include additional energy, which include energy to liquefy the natural gas, are reported to be 877 g CO
2e/kg fuel.
Upcycled Methane
WTT emissions for upcycled methane are derived for the two sources for biomethane (anaerobic digestion of waste grass and recovery from the sewers) and the energy required to refine the biomethane. The majority of the biomethane in this case is derived from waste grass for which WTT emissions values from [
44] are used. A relatively small proportion of sewage gas is collected from the sewers with minimal processing, so negligible WTT emissions are assumed for collection of this component of the biomethane. Overall biomethane WTT emissions shown in
Table 2 are then calculated then based on the proportion of biogas from each source that is collected, plus energy needed to refine the total amount.
2.2.2. Tank-to-Wheels Emissions
This section summarises TTW CO2 emissions produced as each vehicle generates motion from energy stored in the fuel tank or battery. The methane powered vehicle can be fuelled with either grid natural gas or upcycled biomethane.
Baseline Diesel Vehicle
Based on VECTO analysis described in
Section 2, the baseline Diesel truck uses 126 kWh of energy for each 100 km travelled. The average brake thermal efficiency (BTE) of the diesel vehicle over the VECTO typical drive cycle is 42%, resulting in 30.2 L/100 km fuel consumption. Based on the calorific value of diesel of 11.87 kWh/kg fuel, this results in TTW emissions of 76.8 kgCO
2e/100 km. Added to the WTT emissions of 18.4 kgCO
2e/100 km, Well-to-Wheels (WTW) CO
2e of 95.3 kgCO
2e/100 km results.
Battery Electric Vehicle
Battery-electric powertrains for larger trucks are in development with concepts demonstrated by manufacturers in closed trials over specific duty cycles, see examples listed in
Table 3. The technology presents several limitations which need to be addressed prior to mass-adoption. Batteries have a significantly lower energy density than diesel or CNG/LNG. Therefore, they require significantly more space and weigh more per kWh than liquid fuels. A gravimetric energy density of 620–750 kg/100 kWh is typical based on current vehicle homologation reports.
The additional battery mass introduces a strong trade-off between range and payload for battery-electric trucks. In this study, we assume the total weight of the truck and payloads are unchanged from the diesel baseline, leading to a limited range, assuming a battery energy capacity of 200 kWh in line with current vehicle demonstrators shown in
Table 3. Battery charge times remain higher than tank-filling times, which can result in a reduction of vehicle utilisation. Consequently, current battery electric truck concepts are not well suited to high uptime or long-haul duty-cycles. Furthermore, due to dissimilarity of base vehicle design and high-voltage safety concerns it is unlikely that aftermarket conversion from a diesel to electric will become an economically viable option.
When considering energy usage for electric trucks, losses from the electric motors should be considered, these include resistive losses in the motor windings which are proportional to current (I
2R) and ‘iron’ losses due to eddy currents and magnetic hysteresis. Typical peak efficiency values for motors used in these systems range from 85 to 95% at optimal speed and torque. Combining with WTT efficiency of the electricity distribution system discussed in
Section 2.2.1, this results in an estimated efficiency of the vehicle and charging system in the range 75% to 88%. We optimistically assume the lower bound value for the losses described (highest efficiency) and calculate that in order to complete the modelled transport mission (requiring 126 kWh/100 km at the wheels), the battery-electric truck would require 151.8 kWh/100 km of electricity generation. Using the average grid intensity for the south east, and applying the efficiency chain described above we calculate a WTT figure of 35.7 kgCO
2e/100 km.
Methane-Powered Vehicle
CNG and LNG trucks are currently on sale in the UK, and both have potential to offer reduced in-use CO
2 emissions operating on either fossil natural gas or biomethane of an appropriate specification.
Table 4 shows examples of vehicles currently on sale in the UK, it should also be noted that aftermarket conversion is a viable option for this technology.
The efficiency of natural gas engines varies depending on fuelling configuration (manifold fumigated or direct injection) and the level of development of the engine, with peak BTE of up to 39% reported [
49]. Both spark ignited, manifold fuel injection and compression ignition, direct injection diesel pilot engines are on the market. The analysis in this paper is focused on spark ignited gas engines where the fuel is manifold injected as this is the most common variant on the market currently. We assume an average BTE of 35% in this model for both CNG and LNG engines based on fuel consumption penalty vs. diesel of 19% [
50]. Based on the 126 kWh/100 km at-the-wheels requirement for our transport mission, fuel energy of 360 kWh/100 km is required. This gives TTW CO
2e emissions of 73.3 kgCO
2e/100 km for both CNG and LNG, a WTW CO
2e of 87.4 kgCO
2e/100 km for CNG, and a WTW CO
2e of 98.9 kgCO
2e/100 km for LNG. For biomethane-powered vehicles, due to the renewable nature of the fuel, tank-to-wheels CO
2 emissions are assumed to be zero, in line with European Commission’s Joint Research Council (JRC) WTW calculation methodology [
44].
2.2.3. Vehicle Production Emissions
Baseline Diesel Vehicle
In addition to CO
2e generated in-use, CO
2e is released during the production of the vehicle. Data published by Volvo Trucks [
51] indicates a figure of 19.2 tCO
2e for the production of their FM and FH series trucks. It is assumed that this figure is typical for the industry. This embedded, production GHG emissions can be amortised over the life of the vehicle. We assumed this to be 1,000,000 km for large trucks (e.g., regional, long haul) modelled in this study. This adds a further 1.9 kgCO
2e/100 km of production CO
2e over the lifetime of our modelled truck.
Battery Electric Vehicle
Production of batteries is an energy-intensive process and estimation of the embedded CO
2e varies widely in the literature. The ICCT 2018 meta-analysis reported a range from 56–494 kgCO
2e per kWh cell capacity [
52]. This range is heavily dependent on the electricity mix used in production of the battery cells and packs, and also cell chemistry. A meta-analysis by the Karlsruhe Institute for Technology found that the mean value of embedded CO
2e for lithium iron phosphate batteries (LFP) and nickel manganese cobalt (NMC) chemistries typically used in automotive applications were 161 kgCO
2e/kWh for NMC and 160 kgCO
2e/kWh for LFP [
53]. Therefore, in the modelling presented here we assume 160 kgCO
2e/kWh. It is also assumed that the battery-electric truck has a 200 kWh battery, embedding an additional 32 tCO
2e compared to the diesel baseline. Other component changes, such as engine replacement with electric motor, are assumed to have a net zero impact on the embedded CO
2e.
Battery performance degrades as a function of charge cycles. The number varies with the specific cell chemistry and cell and pack construction. Tesla state that their current battery packs are rated for 1500 full charge cycles before the battery reaches the end of its useful life [
54]. For our modelled use case, this equates to 226,000 km of useful life for the 200 kWh battery pack, so we assume the battery is replaced 4 times within the vehicle life adding 14.1 kgCO
2e/100 km to give a total of 16.0 kg CO
2e/100 km.
Methane Powered Vehicle
There is a small increase in cradle-to-gate CO
2e associated with the additional components required to support CNG and LNG operation, raising the amortised lifetime CO
2e to 2.1 kgCO
2e/100 km compared to 1.9 kg CO
2e/100 km for a diesel truck [
51].
Table 5 shows a summary of lifecycle emissions for all vehicle types.
2.3. Vehicle Costs
2.3.1. Purchase Costs
Vehicle purchase costs in the heavy duty sector are not generally available in the public domain, therefore costs for the different categories of vehicle are estimated based on evidence from industrial collaborators.
Baseline Diesel Vehicle
A baseline diesel vehicle cost of £100,000 is assumed based on Ricardo industry consultation.
Battery Electric Vehicle
Much of the additional cost of battery electric trucks resides in the battery packs. For other components, the substitution of engine and transmission for an electric motor is assumed to be approximately cost neutral. The price of lithium ion battery cells has dropped significantly over recent years as manufacturing process and technology have improved, which has lowered pack prices. Estimates of current battery pack pricing in the literature range from US
$90/kWh to US
$236/kWh, with recent historic reports of US
$280/[
55], US
$227/kWh (Pack cost, 2016 [
56]). We assume a pack cost of
$200/kWh.
Methane-Powered Vehicle
Natural gas vehicles cost around 20% more than their equivalent diesel counterpart [
50]. Whilst the cost of the vehicle, engine and transmission remain largely the same, the aftertreatment system and gas storage are more expensive than the diesel vehicle.
2.3.2. Operational Costs
Operational costs are estimated based on fuel prices including fuel duty based on UK typical prices at the time of writing. Driver and maintenance costs are assumed to be equal in all scenarios and therefore excluded from the analysis. A summary of cost data used in the model is shown in
Table 6.
3. Results—Scenario Analysis for the Local Energy System
If we now return to our example towns and consider the energy system as a whole, under four scenarios: business as usual; CNG truck using grid natural gas; battery electric truck; biomethane recovered from the environment and used to power an LNG truck.
Scenario 1 is business as usual, shown in
Figure 4. A diesel-powered truck servicing the towns travels 44,000 km, releasing 41.8 tCO
2e on a WTW basis (see
Table 7). Grass is cut and composted, releasing 53.9 t CO
2e (see
Table 1) and sewer gas is released to the atmosphere resulting in 507.2 t CO
2e (see
Table 1).
In Scenario 2, shown in
Figure 5, the long haul trucks servicing the towns are converted to run on natural gas and fuelled using natural gas from the gas grid. Although amortised Capital Expenditure (CAPEX) costs increase, overall costs reduce due to lower fuel costs resulting in lower Operating Expenses (OPEX). There is no change in methane release to the environment. A small reduction in vehicle lifecycle CO
2e of 7.9% is observed (see
Table 7).
In Scenario 3, shown in
Figure 6, the trucks servicing the towns are electrified. Overall costs increase as OPEX cost reductions are insufficient to offset CAPEX costs increases. Electricity demand increases significantly. There is no change in methane released to the environment. A reduction in vehicle lifecycle CO
2e emissions of 46.8% is achieved (see
Table 7).
In Scenario 4, shown in
Figure 7, waste grass is actively diverted into controlled anaerobic digestion and the resulting biogas refined to LBM. Sewer gas is also diverted to a similar LBM refining plant produce biomethane to power natural gas trucks. Moderate CAPEX costs are incurred, which are offset by a reduction in OPEX. There is a moderate increase in electricity demand. Vehicle lifecycle CO
2e emissions are reduced by 76.1% and environmental methane emissions are reduced by 2.02 t (72.9 tCO
2e) due to avoidance of emissions from compositing and the sewers. Taking into account lifecycle CO
2e emissions of 10.2 t, this leads to net negative CO
2e emissions of −62.7 t (see
Table 7).
Results for all four scenarios are collated in
Table 7.
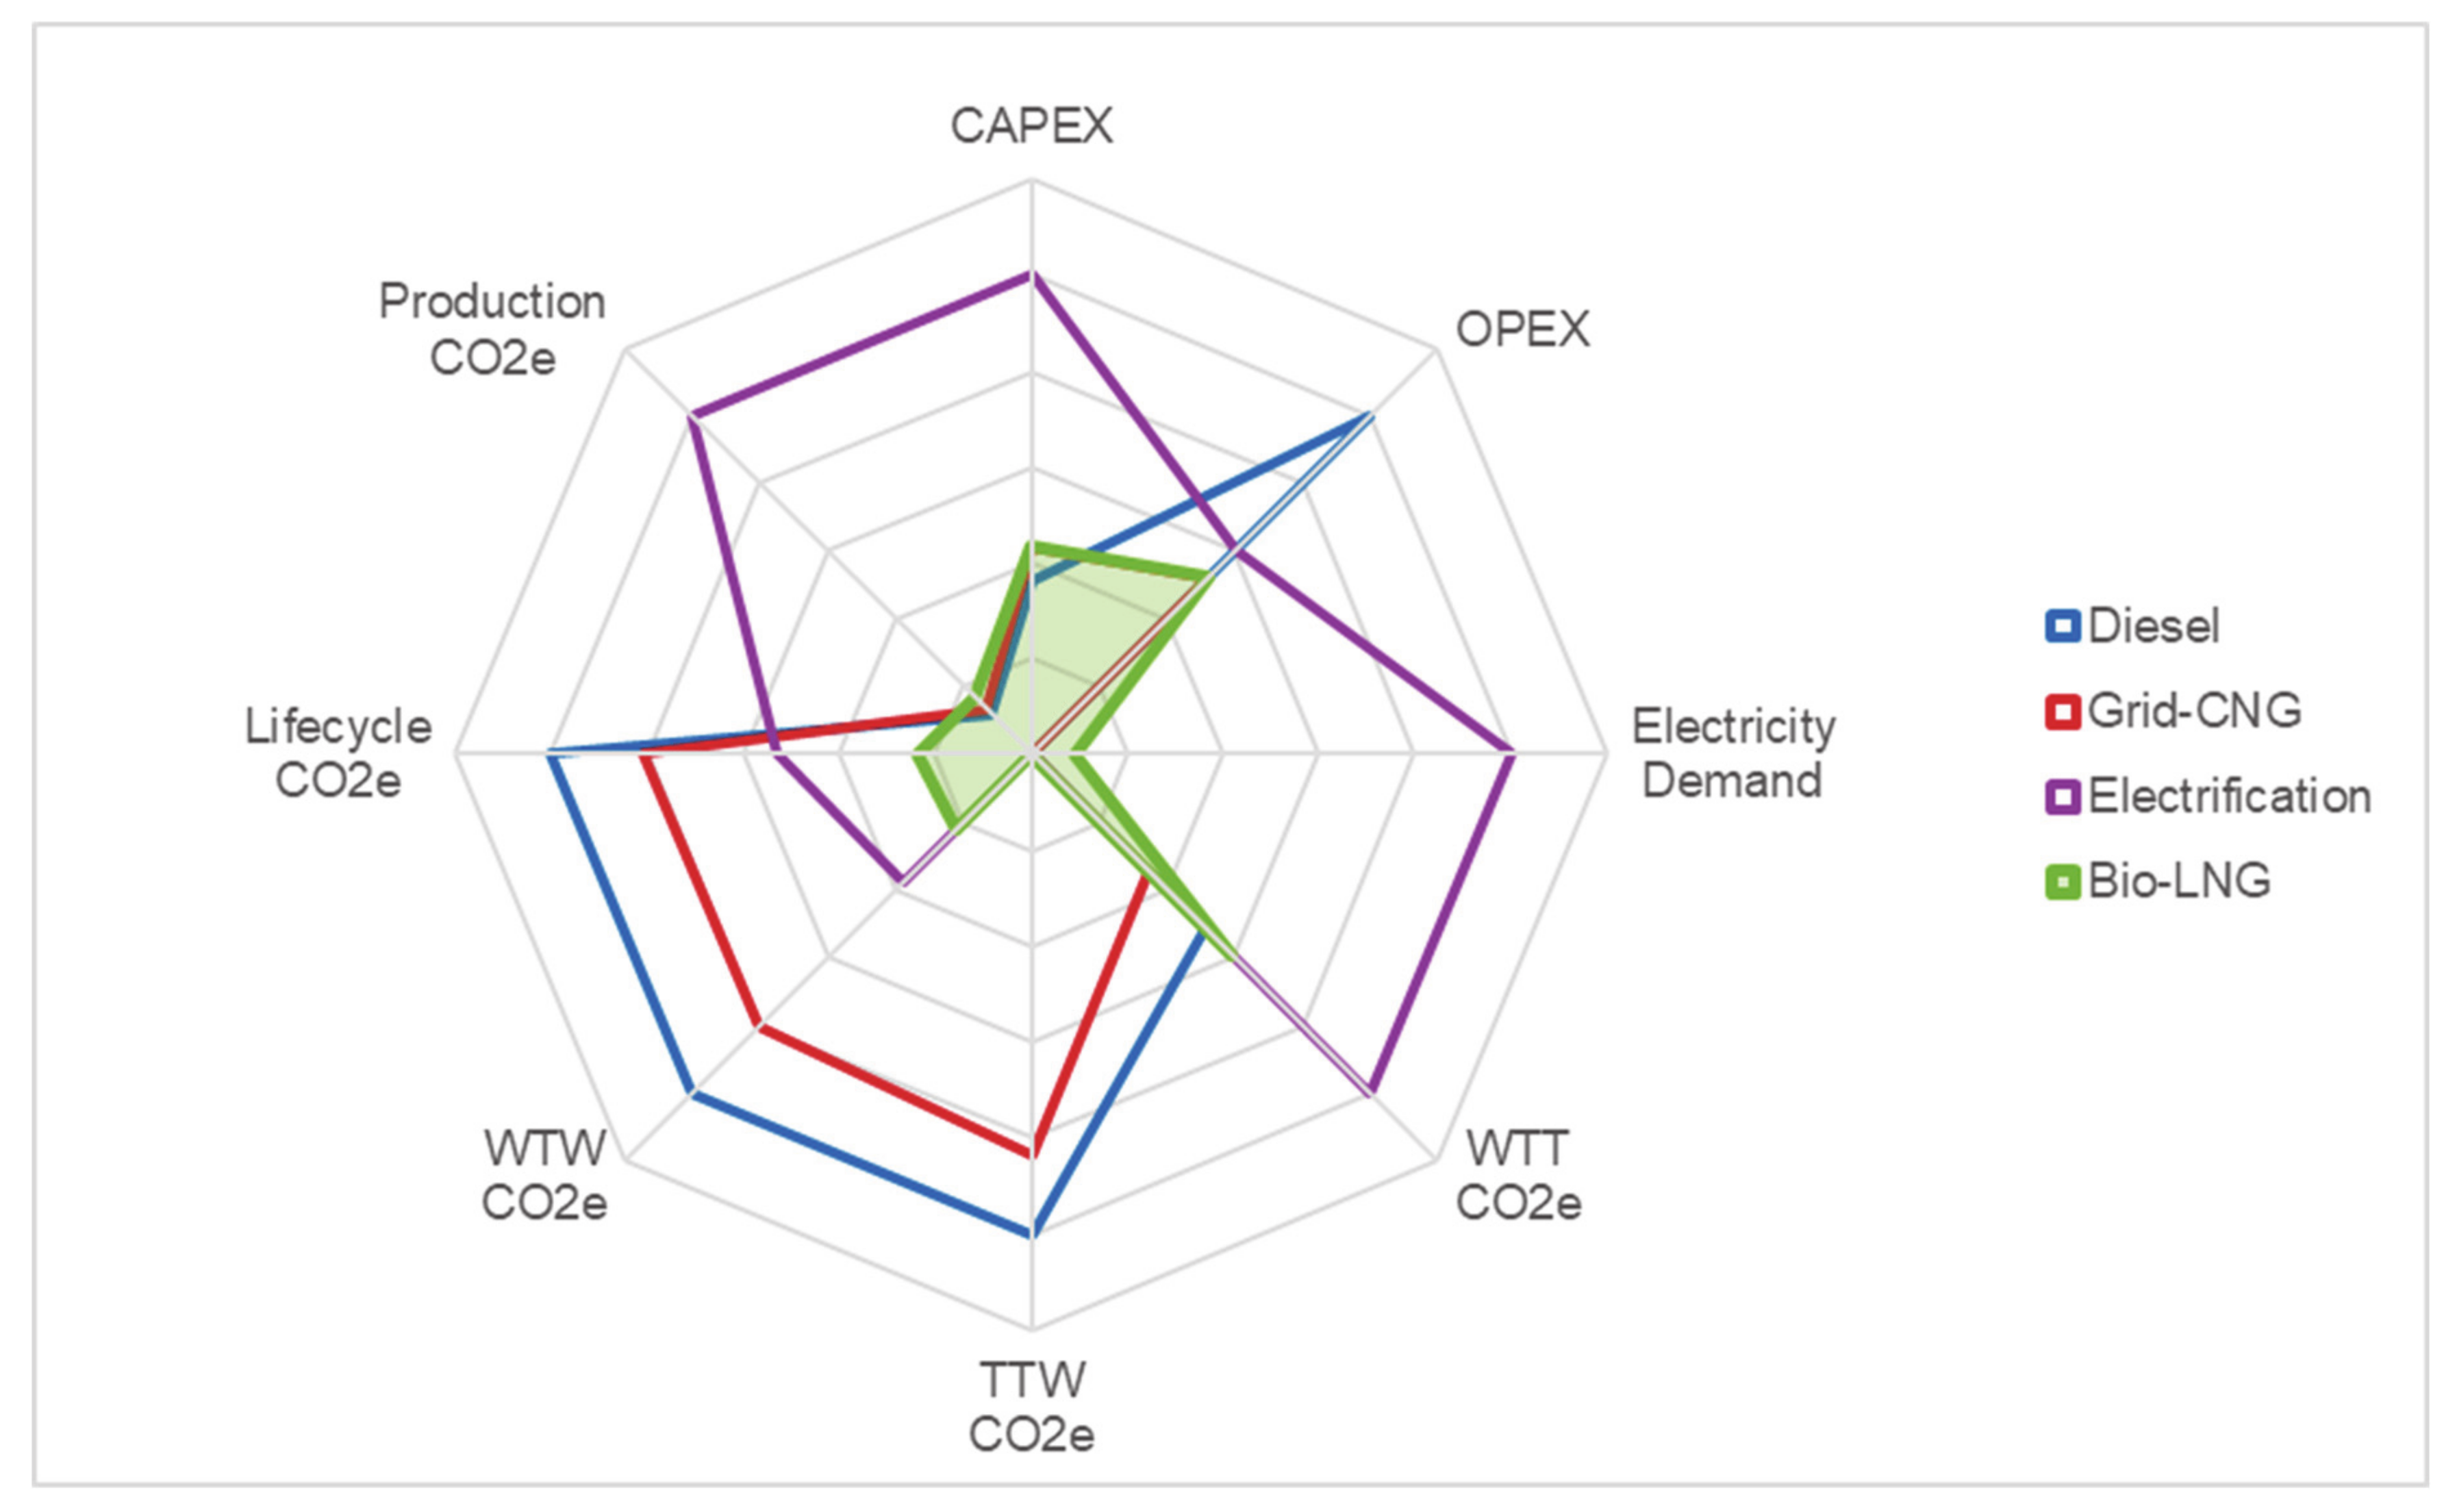
A sustainability factor is then calculated based on a weighted sum of normalised lifecycle CO
2 (LC) electrical load increase (ΔElectricity demand), CAPEX increase (Δ CAPEX) and OPEX increase (Δ OPEX) as shown in Equation (1). Weighting factors are determined based on the urgency for action on CO
2e emissions (
), the importance in cost in driving uptake (
,
) and the impact on existing infrastructure (
).
The sustainability factor for baseline diesel, fossil CNG, battery electric and biomethane vehicles is shown in
Figure 8.
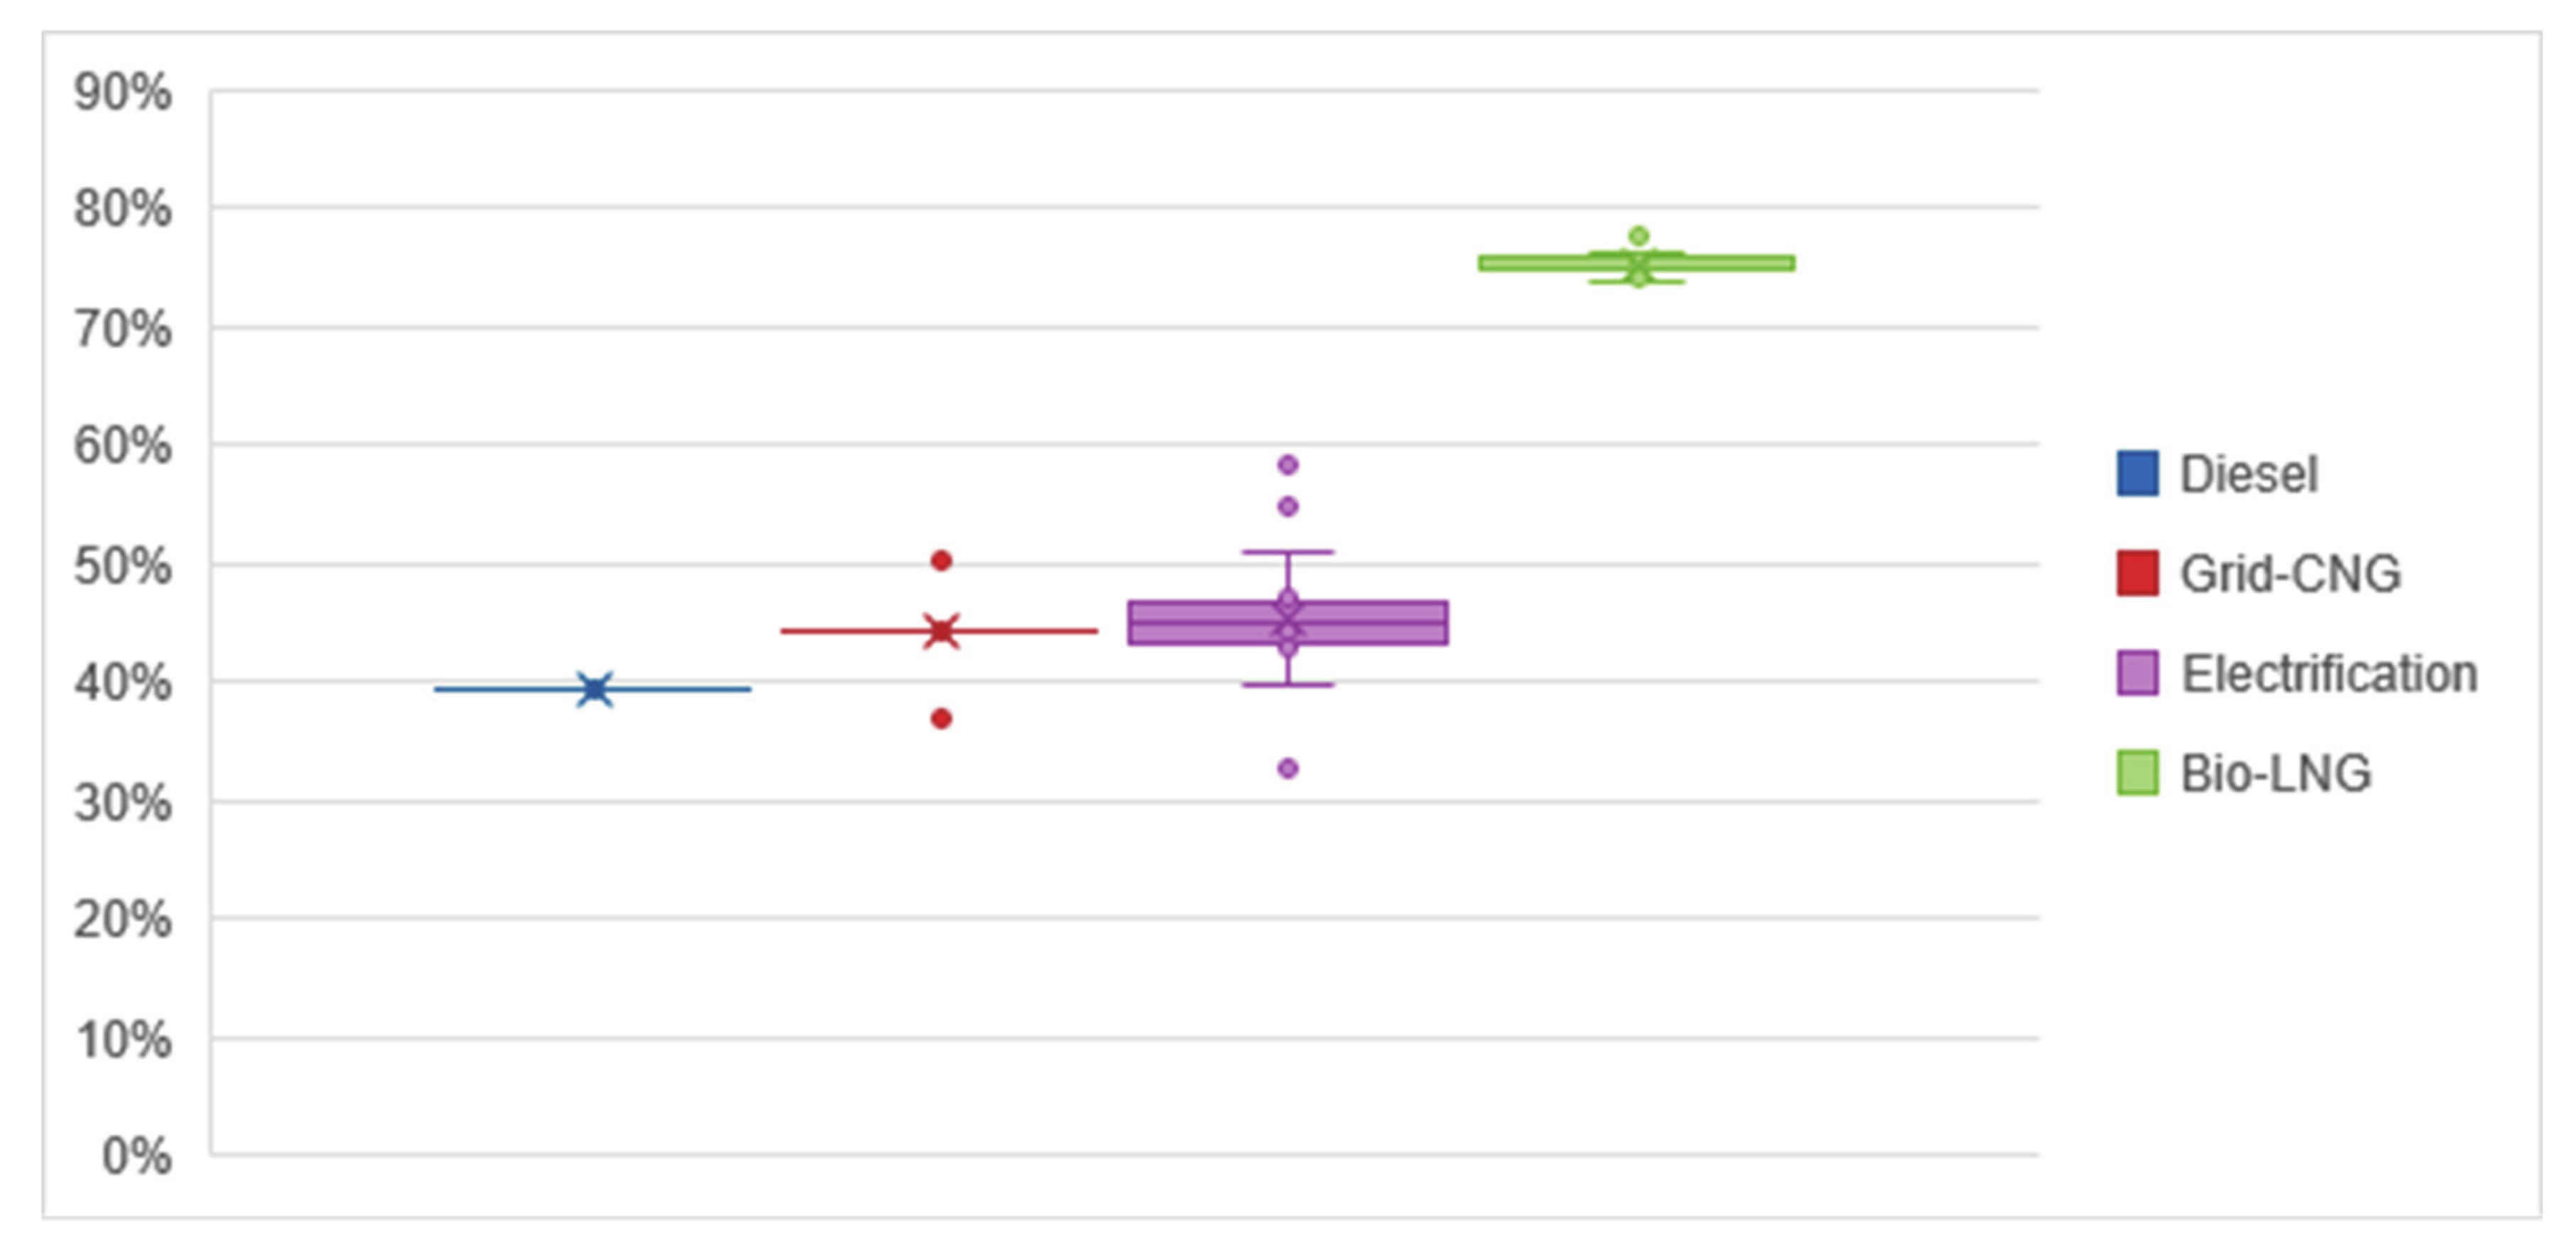
There is a substantial degree of uncertainty in the analysis due to variations in, for example, methane yield from AD processes or grass yields. Therefore, the sensitivity to single parameter swings on key model parameters (methane yield from sewers, grass yields, grid carbon intensity, grid distribution efficiency, electrified truck system efficiency, CNG and LNG truck brake thermal efficiency) is analysed and plotted as an error bar on the sustainability factor shown in
Figure 9. This analysis shows that local production and use of bio-LNG has an increased sustainability compared to the incumbent diesel vehicle, natural gas powered vehicle and battery electric vehicles when the sensitivity to process uncertainties is considered.
4. Discussion
The analysis presented in this paper shows clear GHG benefits for the use of biomethane fuelling for heavy-duty trucks compared to incumbent diesel vehicles, with the potential to achieve greater emission reductions if the production of biomethane avoids environmental emissions of methane. The work also highlighted the possibility of significant reductions in lifecycle GHG emissions where a battery electric truck is implemented. Commercial attractiveness is an important dimension of the sustainability of any heavy-duty transport solution because of its effect on a range of factors such as implementation speed and employment. The sustainability index described in
Section 3, provides a framework within which to consider the relative advantages and disadvantages of each energy vector, thereby supporting decisions on which energy vectors might be suitable for which application. For example, where there is an abundance of carbon-free electricity and no current HGV assets being currently utilized, pure electrification solutions may be preferred. However, where conversion of assets is possible, rapid deployment alongside lower capital costs could be achieved. In the case of the area of the UK described in this paper, the modest cost of the conversion of heavy duty trucks from diesel to methane power could facilitate a faster transition to lower GHG technology, and also give long-term benefit to the environment through avoided methane emissions.
In this section we will compare the results of the analysis presented in this paper with previous studies and highlight key uncertainties and further work. The paper presents costs for liquid biomethane vehicles, compared to fossil methane, battery electric and conventional diesel vehicles, based on cost data from the literature and UK fuel and electricity prices at the time of writing. The results show that alternative fuelled vehicles could have lifecycle costs (LCC) approximately 30% lower than diesel vehicles (around 0.2 £/km compared to 0.31 £/km). This cost depends on a very wide range of factors, for example assumptions made for vehicle technology, fuel price, assumed vehicle life, infrastructure and maintenance costs. Selected examples are described here to illustrate the agreement of the results developed in this paper with those cited in the literature and also the dependence on study assumptions. LCC for electric vehicles is particularly sensitive to battery size and cost. In [
57] the authors show that for a battery electric truck LCC can be lower than a diesel vehicle where the battery price is below 200 euro/kWh, agreeing with the conclusions of this study which assumes a battery price of 200
$/kWh (approximately 165 euro/kWh). In [
58], results show the dependence of LCC on battery size, with LCC for a truck with 270 kWh battery around 20% lower than a diesel vehicle, and 15% lower with a 400 kWh battery. This reference also shows that methane trucks have a similar LCC to diesel vehicles, in contrast to the work presented in this paper where methane trucks have a lower LCC than diesel, however [
58] includes costs of CNG filling stations which would be expected to increase LCC. In general, assumptions for CNG and biomethane price and, therefore, LCC vary widely depending on geographical location. For example, a study based in Australia [
59] concludes that a CNG bus would have a higher LCC than a diesel bus due to higher fuel costs, while a review performed in Canada [
60] demonstrated a fuel cost saving of
$30,000 for CNG vehicles compared to diesel. This brief review shows the range of parameters that should be considered to evaluate accurately the LCC. An extension of the high level cost analysis presented in this paper, to understand the sensitivity of LCC of alternative fuelled vehicles to variation in these parameters in the UK will therefore be the subject of further work.
Considering GHG emissions, for the electric vehicles there are a significant number of studies evaluating lifecycle emissions for light-duty vehicles. A summary of this work is presented in [
61] which shows the potential for 44–80% reduction in Life Cycle GHG emissions for electric passenger cars. This work also highlights key uncertainties in Life Cycle Analysis (LCA) for electric vehicles, particularly in assessment of battery manufacturing emissions. There are fewer papers reporting on LCA GHG emissions for battery electric heavy duty vehicles: [
58] shows fuel consumption related emissions for a US class 8 truck reduced by 63% while lifecycle emissions remained similar to a diesel truck; in [
62], WTW GHG emissions are presented for a class 8 truck in the US, showing similar or slightly worse GHG emissions. The results in this paper showed reductions in lifecycle GHG emissions of 46.6% for a battery electric vehicle (BEV), compared to as similar diesel. A number of factors would be expected to influence this result, particularly battery size and energy density, grid carbon intensity, vehicle mass and battery production emissions. The analysis in this paper assumes a grid carbon intensity for South East England of 248 gCO
2e/kWh, whereas the US has a higher grid carbon intensity, with a national average of 450 gCO
2e/kWh in 2016 [
63], so analysis based on US operations would be expected to show higher emissions. Additionally, our analysis has assumed that the overall vehicle mass remains the same between diesel and BEV, with payload reduced to compensate for additional vehicle mass. Further work is needed to understand the implications of electrification for overall fleet CO
2 emissions, given the additional vehicle trips that this approach would necessitate. In general, this analysis shows the importance of understanding market requirements and conditions for battery electric heavy-duty vehicles (for example, range expectations and grid carbon intensity) to enable accurate assessment of GHG emissions performance.
A range of papers have assessed the effect of biomethane fuelling on GHG emissions from heavy duty vehicles. A recent example is analysis contained in [
64] which presents analysis based on results from UK on-road truck trials. In this work, analysis of WTW GHG emissions for 41 trucks fueled with fossil natural gas and biomethane are compared to a diesel baseline. The results show reductions of 15% in GHG emissions with fossil NG, rising to 78% with biomethane. In [
65] WTW GHG emissions are presented for biomethane produced from different feedstocks, food waste and manure. Simulations show benefits of 50–75% for biomethane from food waste and 45–75% for fuel derived from manure. In [
66], lifecycle GHG emissions benefits of the substitution of fossil petrol and diesel fuels with biomethane are analysed using a lifecycle approach, showing reductions of 73% and 74%, respectively. These papers show good agreement with results presented in this paper (8% LCA GHG reduction for fossil natural gas and 75.5% reduction for biomethane).
The approach suggested in this paper, production of biomethane from waste, thereby reducing GHG emissions through the avoidance of emissions in the environment, and the use of biomethane in place of fossil fuels, could play a role in the development of a circular economy. Biomethane production from waste and its role in the circular economy has been the subject of a range of recent studies. There has been a particular focus on biomethane production and use in transport in Italy due to the relatively high number of methane powered vehicles on the road there. In [
67] the authors consider the digestion of municipal waste to produce biomethane for use in transport, concluding that 47 kt CO
2e emissions could be avoided through the replacement of fossil CNG by biomethane. In [
68], the authors report a socio-economic analysis of the use of biomethane in Rome, concluding that GHG emissions could be avoided through the substitution of fossil CNG with biomethane and also by avoiding emissions from the decomposition of manure and waste feedstocks in the environment. Several reviews consider the valorization of waste feedstocks through production of biomethane: in [
69] the authors consider potential for the use of agricultural waste in the circular economy in India, thereby avoiding adverse environmental effects that result from current waste disposal practices (worsening air quality resulting from biowaste burning). This study highlights the requirement for in depth analysis of the whole supply chain to understand the benefits of this approach. In [
70] the opportunities and challenges for the use of various sugar industry waste products are reviewed, highlighting the potential to avoid negative environmental impacts associated with current disposal practices. A number of references quantify reductions in GHG emissions, including the contribution from emissions that are avoided by AD of the feedstocks. In [
71] the potential for the use of farm animal waste and agricultural residues to produce biomethane to generate green electricity is reported, the authors conclude that a reduction of 0.6% of annual emissions could be achieved, avoiding emissions of ~4096 kt CO
2e/yr from decomposition of agricultural waste. Anaerobic digestion of waste from olive oil production is considered in [
72]. Analysis showed that GHG emissions to atmosphere would be reduced by a factor of 7 due to avoided emissions from the decomposition of the waste. This work also describes the beneficial effect of the conversion of methane to carbon dioxide through combustion on GHG emissions due to the lower GWP of carbon dioxide compared to methane. Although these studies show the potential for reducing GHG emissions through avoided environmental methane emissions, the only study that the authors are aware of that relates these avoided emissions to vehicle lifecycle GHG emissions is [
73]. This work documents the potential for negative GHG emissions, through avoidance of methane emissions from animal waste, and then calculates the change in WTW GHG emissions. A reduction of around 90 g CO
2e/tkm is presented for a for a heavy duty vehicle fuelled by biomethane made from manure which is of a similar order of magnitude to the negative emissions derived in this paper (74 gCO
2e/tkm) via capture of methane from sewers and through AD of biowaste in the case study area. Benefits will depend on the counterfactual situation, what would otherwise have happened to the sewer gas and biowaste, and also on the detail of the sewer gas capture and AD processes and emissions from fuel transport and dispensing. Further work is particularly required to understand potential avoided methane emissions from informal composting, where there is no deliberate aeration of the waste, and also practical processes for the recovery of sewer gas.
5. Conclusions
The analysis in this paper shows that the use of environmental methane as a transport fuel could provide a cost-effective and sustainable enabler for rapid decarbonisation for heavy duty trucks. On a lifecycle basis, liquid biomethane trucks can give a reduction in GHG emissions of 75% compared to a diesel baseline, while fossil CNG and battery electric replacements provide a GHG reduction of 8% and 49%, respectively. This paper shows that local transmission and distribution of the electricity and gas supply impacts overall system efficiency and, therefore, lifecycle GHG emissions. For natural gas vehicles, this is apparent in the additional energy needed to raise the pressure of the gas from grid pressure to 240 bar for vehicle refuelling. For electrical vehicles, inefficiencies in local transmission and distribution and charging processes increase electrical energy needed. When an energy systems perspective is taken, the upcycling of environmental methane from the local sewer systems and anaerobic digestion of waste grass leads to net negative CO2e emissions, due to avoided environmental methane emissions and substitution of fossil fuels, providing a significant benefit of 246% CO2e reduction compared to the diesel baseline. The potential for negative CO2e emissions for methane fuels is recognised in the literature for a range of pathways, e.g., biomethane made from manure due to emissions avoided when manure is processed using AD. This research suggests that other pathways may give similar benefits and that analysis of the local energy system is needed to confirm the potential emissions reductions.
The GHG emissions results presented in this paper are sensitive to the assumptions made: key uncertainties exist in quantity of methane that could be recovered from sewers and waste grass. Conservative assumptions are made in line with this uncertainty, but further research is needed to confirm the benefits. The analysis showed that taking into account the uncertainties, the use of upcycled biomethane remained more sustainable that battery electric or fossil CNG replacements for a diesel truck.
When alternative fuelled vehicles are compared on a cost basis, the analysis shows that fuel costs are similar for all alternative fuelled vehicle options at around 40% less than the diesel baseline based on current UK fuel prices. Vehicle costs are greater than the diesel baseline for all alternatives, 20.0% higher for gas powered vehicles, and 176.8% higher for battery electric vehicles, taking into account expected battery replacements during the vehicle lifetime. When total costs are compared, alternative fuelled vehicles are shown to have costs around 30% lower than conventional diesel vehicles, although these costs are strongly dependent on study assumptions.
Additionally, the use of upcycled methane has potential to increase availability of renewable energy in areas where the use of renewable electricity may be challenging due to, for example, a lack of public charging points. It could also reduce the need for further investment in grid reinforcement by reducing the electricity demand for transport decarbonisation. Furthermore, its use does not rely on international fuel supply chains and reduces the reliance on scarce materials needed for manufacture of batteries for electric vehicles.


