1. Introduction
The widespread use of wood for energy production in Europe over the last decade showed that a large proportion of fossil fuels can be replaced with renewable resources. In many EU countries, wood is an important source of energy. In Finland, the Baltic states and Poland, more than three quarters of renewable energy is obtained by burning shredded wood chips [
1]. Wood chips are produced from low-value stems, bark, and branches with traces of leaves and needles. The use of this biomass for energy production is the best solution if this waste is not suitable for the production of any other product.
Energy production from biomass is economically feasible when the biomass source is nearby. The energy density of biomass being several times lower compared to oil increases logistics costs. For countries with low forest cover areas, it may be too expensive to transport wood biomass from remote sources. Due to this, local biomass sources should be considered. Agricultural waste (agricultural byproducts) is playing an increasing role in this regard, with this waste amounting to 22 Mtoe and using approximately half the wood biomass potential [
2]. Agricultural waste is generated by processing agricultural products as waste from the food industry, e.g., waste from cleaning and processing of cereals, oat husks, sunflower hulls, grain screenings, straw, etc. The use of this waste for energy production could reduce fossil fuel consumption. In addition, it could represent a forest protection solution, especially when high-quality stems are needed for wood pellet production.
Energy production from biofuels containing higher quantities of nitrogen and sulfur, e.g., agricultural waste, could be complicated, since it potentially generates higher NO
X and SO
2 emissions [
3]. NOx and SO
2 emissions are harmful emissions for flora and fauna and are the major cause of acid rain, creating a harmful environment for human health [
4]. Directives (EU) 2010/75 and 2015/2193 of the European Parliament and the Council for new medium combustion plants for biofuel boilers pollutant concentration presented significantly stringent demands for NO
X and SO
2 atmospheric pollutant concentration control. The limit for NO
X was reduced to 300 mg/m
3, whereas SO
2 was reduced to 200 mg/m
3 for biomass fuel. In certain countries, these restrictions are even greater. Agricultural waste typically contains more problematic elements, like sodium, potassium, chlorine, sulfur, phosphorus, and silicon, compared with wood. These elements form types of ash with low melting points. During combustion, these elements result in ash slagging on the grate [
5] and form deposits that reduce boiler efficiency or even clog heat exchangers [
6], which can cause unplanned boiler shutdowns.
NOx and SO
2 emission reductions for biofuel boilers traditionally use various desulfurization and denitrification technologies. The most common NOx reduction measures for biofuel boilers are primary and secondary (post combustion) methods. However, primary methods usually have limited effectiveness, whereas secondary methods, i.e., selective noncatalytic reduction (SNCR) and selective catalytic reduction (SCR) technologies, have high effectiveness [
7] but are more complicated in terms of implementation. SCR technologies are also expensive due to the need for precious metal catalysts and additional equipment for flue gas conditioning (e.g., for preheating, removal from particulate matter and SO
2). Moreover, secondary measures for NO
X, like selective noncatalytic reduction, is inseparable from NH
3, HCN, and N
2O byproducts that can cause fouling and corrosion of downstream equipment. There is a risk that NH
3 emissions from small and medium power boilers will be controlled by new restrictions in the near future. Operation of these systems could cause technical problems and sudden technical failure [
8,
9]. Flue gas desulfurization techniques require additional investment and could also cause emission problems [
9,
10]. Moreover, application of these post combustion methods is not always implemented because of the variety of boiler constructions and emission reduction tasks that are sometimes hardly feasible.
The main focus should be primary measures such as flue gas recirculation (FGR) and limited excess air, which can be used for emission reduction without significant investment; flue gas recirculation technology is common and used in many modern solid biomass boilers for temperature regulation in combustion chambers to avoid ash and plaque agglomeration. Moreover, this measure faces smaller environmental and technical issues compared with secondary “end-of-pipe” technologies because no chemicals are used.
2. Literature Review
Though the main purpose of FGR is to reduce the temperature by protecting the combustion chamber and grating from ash agglomeration, flue gas recirculation is also known as an effective measure to reduce thermal NOx generation. The influence of FGR on thermal NOx is well studied. Glaborg et al. [
11] stated that total NOx consists of three main sources, i.e., “thermal NOx”, “prompt NOx”, and “fuel NOx”. It is estimated that “thermal NOx” occurs at combustion temperatures over 1400 °C [
12]. During this high temperature combustion, high activation energy is used to combine nitrogen and oxygen in the combustion air. Such temperatures are not common during biofuel combustion because of its relatively high moisture content. “Prompt NOx” occurs via the attack of a CH radical on the N
2 triple bond. This is a two-way reaction, and the amount of “prompt NOx” is negligible. It is estimated that more than 80% of total NOx is generated from the “fuel NOx” during oxidation of char-N and volatiles containing NH
3 and HCN [
12]. The quantity of oxidized nitrogen depends on the fuel structure, combustion temperature, and stoichiometric ratio [
11]. A lack of research exists investigating the relationship between FGR and “fuel NOx” (particularly SO
2 emissions) in moving-grate fire tube biofuel boilers by burning agricultural waste.
Studies of moving grate boilers [
13,
14,
15] mainly focused on the effect of flue gas recirculation, particularly on NOx and other component concentrations, excluding SO
2 emissions. Tu et al. [
13] used the computational fluid dynamics (CFD) calculation method in a 40 t/h biofuel steam boiler to determine internal flue gas recirculation (IFGR) influence in order to obtain “prompt”, “thermal”, and “fuel” NOx. The authors determined that flue gas recirculation managed to change combustion flame kernel size and reduced “thermal NOx” due to mitigation of combustion temperatures. Qun Chen et al. [
14] compared measurements and mathematical modeling results to determine the effect of FGR on NOx and CO emissions in a 500 kW boiler and found a relatively close match between the results, showing that NOx and CO reactions to FGR could be opposite. Liu et al. [
16] investigated the influence of flue gas composition and temperature on economizer efficiency and NOx emissions in a 500 t/d incinerator. Despite the fact that this research broadened the understanding of the predominant mechanisms of NOx in the moving-grate boilers, the effect of flue gas recirculation, combined with the partly gasification regime, on various emissions of grate-firing boilers was not investigated. These studies could be extended regarding FGR and excess air effects on SO
2 emissions.
A small number of publications [
16,
17] examined the dependence of SO
2 and NOx emissions on primary measures in oxyfuel, fluidized bed furnaces. De las Obras-Loscertales et al. [
16] examined NO, N
2O, SO
2, and CO emissions by creating artificial flue gas recirculation and temperature conditions, demonstrating that SO
2 gas recirculation correlates with CO and NOx emissions. Lupiáñez et al. [
17] determined the influence of combustion temperature on SO
2 and NOx emissions. Simultaneously, a correlation between NOx and CO and excess air (oxygen quantity) emissions was observed. A relationship between NOx and excess air was also observed by Glaborg et al. [
11] and Houshfar et al. [
12]. Unfortunately, the impacts of excess air and flue gas recirculation on SO
2 were not observed. Firing conditions obtained in both studies radically differed from those of a moving grate, making adaptation of the results difficult; this needs to be investigated further.
Most of the studies focused on the application of a single measure, i.e., FGR or excess air, to certain emissions. The effect of flue gas recirculation combined with partial gasification mode on various combustion boiler emissions was rarely studied. This paper identifies the effects of a combination of flue gas recirculation and combustion regimes with different CO concentrations on SOX, NOX, other sulfur and nitrogen compounds, and hydrocarbons, as these measures can be easily implemented in many industrial boilers.
3. Materials and Methods
3.1. Description of the Small-Scale, Biomass-Fired Grate Boiler
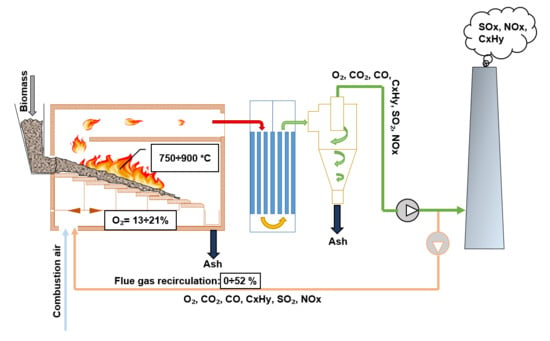
Experimental research was carried out using a 20 kW biofuel boiler model stand, as shown in
Figure 1. The research stand manufacturer company “Enerstena”(Kaunas, Lithuania) is a manufacturer of industrial boilers for biomass combustion. The experimental stand came with the same basic performance features as industrial biofuel boilers. Inside the adiabatic combustion chamber, high combustion temperatures (950–1200 °C) can be achieved. The experimental stand consisted of the following elements: a two-stage combustion chamber, boiler, an automatic fuel supply system, a variable speed moving grate, and adjustable primary and secondary air. A precise quantity of fuel and air supply was ensured by frequency converters. Heat was removed through the plate heat exchanger.
The fuel was supplied from the bunker (5) to the furnace at a set speed by a screw conveyor (6) controlled by a frequency converter. The rows of grate bars (7) were moved by a mechanical drive which was also controlled by the frequency converter. Combustion products were fed through the water heating boiler located above the furnace. Combustion air was supplied by a fan through the primary (13) and secondary (14) air inlets. Flow of the primary air was set using a valve (11) and supplied under the grate. It passed through the grate slots and supported the burning process at the primary combustion zone (1). Secondary air was regulated using another valve (12) and supplied to the secondary combustion zone above the chamotte arc (3) by ducts arranged on the sides of the furnace (14). The secondary air was intended for complete oxidation of volatile matter. A precise flue gas recirculation ratio was set by the mixing of flue gas and primary air (10). Secondary air was supplied without FGR.
When the fuel was distributed on the grate, an intense drying process began due to the high temperature. After evaporation of a certain moisture content, volatile substances began to form. Volatiles were completely oxidized in the secondary combustion zone. The solid part of the fuel on the grate, i.e., fuel char, was oxidized by the air supplied through the air slots in the grate. The remaining inorganic material, i.e., ash, formed at the end of combustion and was removed from the furnace. This burning process inside the furnace was continuous.
3.2. Description of the Experiment
Flue gas emissions were measured with the Fourier transform infrared (FTIR) spectrometer GASMET DX4000 (Gasmet Technologies Oy, Vantaa, Finland) and electrochemical cells MRU Vario Luxx (MRU Messgerate fur Rauchgase und Umweltschutz GmbH, Neckarsulm, Germany) analyzers. Flue gas samples were extracted through heated hoses (180 °C) and special condensation separation system to ensure that no soluble gas dissolved during sampling. The measured concentration was recalculated to standard O2 concentration 6%.
Flue gas recirculation was organized by mixing primary air with flue gas after boiler. FRG quantity was controlled by measurement of O
2 concentration in the primary air. By adjusting the three-way valve, the oxygen concentration in the mixture was gradually reduced and the flue gas recirculation ratio increased from 0% to 52%. The recirculation ratio R
ratio was expressed as a ratio of recirculated flue gas and combustion air, as shown in the following Equation (1):
where R
ratio is the flue gas recirculation ratio, O
2PA is the oxygen concentration in primary air, O
2AA is the oxygen concentration in the atmospheric air, and O
2FG is the oxygen concentration in the flue gas.
Our earlier studies determined that the level of flue gas compound concentrations was significantly influenced by the movement of the grate [
3] in a short time period, about 20 s. For example, the concentration of CO varies significantly by a few times and tens of percent of NOx and other components during grate movement. Therefore, in order to eliminate the influence of grate movement, the measurement results were sorted by CO level, dividing them into the following four groups:
CO concentrations up to 200 mg/m3;
CO concentrations between 300 and 500 mg/m3;
CO concentrations between 1000 and 1500 mg/m3;
CO concentrations between 2000 and 2500 mg/m3.
Grouping of results yielded averaged results from tens of hundreds of measurements for each CO level group.
3.3. Experimental Fuel
During the research, sunflower hull pellets were used as a fuel with the aim of highlighting the correlation between primary measures and flue gas emissions. Sunflower hull pellets were chosen because they have higher contents of nitrogen and sulfur, allowing higher initial concentrations of NOx and SO
2 and a clearer determination of the effect of the investigated methods on their concentrations in flue gases. The correlation of sulfur and nitrogen composition with SO
2 and NOx levels was investigated [
4,
5]. Sunflower hulls are produced when using sunflowers to make condiments, sunflower oil and snacks. Sunflower husks are among the largest forms of agricultural waste in Europe. More than three quarters of all sunflower seeds are grown on the European continent, especially in Eastern Europe. Sunflower husk pellets have a high energy use potential.
The physical and chemical properties of the experimental fuel were determined in accredited laboratories. Physical properties, like lower calorific value (LCV), were determined according to EN ISO 18125:2017 [
18], ash content was determined according to EN ISO 18122:2016 [
19] and moisture was determined according to EN ISO 18134-1:2016 [
20]. The chemical composition of nitrogen was determined with reference to EN ISO 16948:2015 [
21]. Both sulfur and chlorine components were determined according to the common standard EN ISO 16994:2016 [
22]. A summary of the physical and chemical characteristics is presented in
Table 1. For physical and chemical comparison, the sunflower hull pellets are compared with wood pellets.
Sunflower seed hull pellets have a somewhat higher net calorific value compared to wood pellets. Nevertheless, this kind of fuel is characterized by higher quantities of ash and elements such as N, S, and Cl. Sunflower hull pellets contain more than 2.5 times more N, 8 times more S, and approximately 2.4 times more Cl compared to wood pellets.
4. Results
4.1. Flue Gas Recirculation Influence on Combustion Temperatures
The temperatures of combustion products were measured by thermocouples in the primary and secondary combustion zones at stationary points of the experimental stand. By changing the amount of recirculated flue gas, the effect on combustion zone temperature was determined. The effect on the temperature at the secondary combustion chamber (see
Figure 2) was observed to be negligible. The combustion process in the combustion chamber was close to adiabatic and the effect of the flue gas recirculation on the heat transfer was insignificant. However, the effect of flue gas recirculation on temperature was significant in the primary combustion zone. Without FGR, the temperature in the primary combustion zone reached 890 °C. At the maximum FGR ratio of 50%, the temperature decreased to 750 °C.
Despite this temperature decrease in the primary combustion zone, a decrease in the boiler power output was not observed. This could be explained by Tu et al.’s [
13] numerical simulation of a biomass-fired grate boiler. Simulations demonstrated that flue gas recirculation has a higher impact on maximum flame temperature reduction. It was also observed that temperatures correlate with flame kernel size. The higher the flame kernel volume, the smaller the temperature peak. These aspects, as well as oxygen concentration in the flame, may have an impact on emissions.
4.2. Combustion Sufficiency and Flue Gas Recirculation Influence on NOX and SO2 Emissions
Combustion completeness is described by the level of carbon monoxide (CO). At the same time, this parameter is widely used for boiler adjustment. Different amounts of excess air were maintained to create various combustion qualities. Combustion quality is characterized by the level of the main incomplete oxidation compound, i.e., carbon monoxide (CO). Because emissions concentrations are strongly dependent on the CO level, research results were sorted according to certain CO concentration levels, namely, up to 200 mg/m3, between 300 and 500 mg/m3, between 1000 and 1500 mg/m3, and between 2000 and 2500 mg/m3. This sorting method allowed a clearer determination of the effect of FGR on the investigated components of flue gases.
The effect of oxygen concentration in flue gas on CO, SO
2, SO
3, and NO
X concentrations without FGR is shown in
Figure 3 for wood pellets (a) and sunflower hull pellets (b). The reduction in excess air (oxygen concentration) demonstrated that incomplete combustion has a significant effect on NO
X emission. During the combustion of wood and sunflower pellets at higher excess air (CO < 200 mg/m
3), the measured NOx levels reached 360 mg/m
3 and 500 mg/m
3, respectively. By reducing excess air and increasing CO gradually, NOx decreased to 160 mg/m
3 and 300 mg/m
3. Excess air was also shown to influence SO
2; however, this effect was opposite to that on NOx, i.e., with an increasing CO concentration, the level of SO
2 also increased.
Research into the impact of FRG on concentrations of NOx and SO
2 was conducted. The results demonstrated that increasing FGR ratio decreased nitrogen compound concentrations, as shown in
Figure 4a. At an FGR ratio of 50%, i.e., when the O
2 concentration in the primary air was 13.6%, NOx was reduced: (1) by 111 mg/m
3, wherein CO was lower than 200 mg/m
3; (2) by 116 mg/m
3, wherein CO was between 300 and 500 mg/m
3; (3) by 90 mg/m
3, wherein CO was between 1000 and 1500 mg/m
3; (4) by 71 mg/m
3, wherein CO was between 2000 and 2500 mg/m
3. The results showed that the higher insufficient combustion level generated the lower impact on NOx reduction could be maintained during the same FGR.
Opposite tendencies of SO
2 were observed in
Figure 4b. The lowest concentrations of sulfur dioxide were detected under high-quality combustion and reached around 60 mg/m
3. With the increase in CO, SO
2 emissions increased gradually and reached 150 mg/m
3. At an FGR ratio of 50%, SO
2 increased: (1) by 60 mg/m
3, wherein CO was lower than 200 mg/m
3; (2) by 67 mg/m
3, wherein CO was between 300 and 500 mg/m
3; (3) by 96 mg/m
3, wherein CO was between 1000 and 1500 mg/m
3; (4) by 102 mg/m
3, wherein CO was between 2000 and 2500 mg/m
3.
4.3. Flue Gas Recirculation Influence on Concentrations of Nitrogen Compounds
Generally, flue gas recirculation is used for thermal NO
X reduction, especially during the combustion of fossil fuels. While burning biofuels of lower calorific value and relatively high moisture content, thermal NOx is considered to be negligible due to insufficient temperature. It is estimated that considerably higher quantities of thermal NOx are generated at temperatures above 1400 °C [
12]. However, this temperature boundary is not strict and thermal NOx should not be ignored.
Concentrations of NO, NO
2, N
2O, HCN, NH
3, and NOx compounds were measured under different combustion conditions.
Figure 5 presents different nitrogen compound emissions cases under different CO levels by fuel combustion. During the biomass combustion process, a large part of the nitrogen leaves the fuel layer as volatile substances and forms NO with a partial oxygen deficiency.
The average NO concentrations decreased from 340 to 210 mg/m3 without FGR and from 260 to 160 mg/m3 with an FGR ratio of 50% under different combustion qualities in both cases. Flue gas recirculation and incomplete combustion products affected N2O in the opposite way. At relatively low CO levels (<200 mg/m3), N2O concentrations slightly increased from 0 mg/m3 without FGR to 1 mg/m3 with 50% FGR. During incomplete combustion (CO = 2000–2500 mg/m3), N2O increased from 3 to 5 mg/m3. Flue gas recirculation decreased the concentration of NO2 from 2 to 0.75 mg/m3 during both sufficient and insufficient combustion, but stayed within the limits of accuracy due to low concentration levels.
It was observed that the higher the CO concentration, the stronger the FGR effect on HCN concentration. This could explain why less “fuel NO” was produced as the ratio of FGR increased. Surprisingly, even without selective noncatalytic reduction, small quantities of ammonia NH3 were also detected. CO was observed to have a higher impact on NH3 concentrations compared with flue gas recirculation. When CO levels were under 200 mg/m3, ammonia concentration decreased from 0.7 to 0.4 mg/m3 as a result of flue gas recirculation. However, under insufficient combustion, CO reached 2000–2500 mg/m3, with initial NH3 levels being several times higher and decreasing from 2 mg/m3 to 0.5 mg/m3.
4.4. Flue Gas Recirculation Influence on Concentrations of Sulfur Compounds
SO2 is the major sulfur compound that is restricted by norms for boiler emissions. SO3 and H2S are compounds that cause the corrosion of boiler metals. SO3 in the flue gas pathway forms sulfuric acid. Acid condenses on the low-temperature surface of a boiler (heat exchanger tubes), causing corrosion. H2S and HCl also cause corrosion, which can be particularly intense for metals working at high temperatures.
Concentrations of the sulfur compounds SO2, SO3 and H2S were measured to determine the influence of flue gas recirculation. HCl concentration was also measured, but measurements were negligible and did not exceed 2 mg/m3; therefore, this measurement is not shown in the graphs due to clarity. Nevertheless, this certain tendency was quite clear. Combustion sufficiency, i.e., CO level, was observed to have a greater influence on HCl reduction compared to flue gas recirculation. Combustion with low levels of CO in the flue gas reduced HCl emissions.
The measurements shown in
Figure 6 demonstrated that SO
2 concentration increased with increasing flue gas recirculation ratio and combustion insufficiency. These trends were reverse-compared in terms of the FGR effect on NOx. The same effect was observed by Obras-Loscertale et al. [
16]. Average SO
2 concentrations increased from 60 to 150 mg/m
3 without FGR and from 120 to 260 mg/m
3 with an FGR ratio of 52% under different combustion regimes. Flue gas recirculation had almost no effect on SO
3 concentration under the regular burning process, as shown in
Figure 4. Only high concentrations of CO (CO = 2000–2500 mg/m
3) were shown to have a positive effect on SO
3 concentration reduction. SO
3 emissions decreased from 8.3 to 4.5 mg/m
3 with an FGR ratio of 47%. An analogous effect of flue gas recirculation on H
2S concentration was observed. The effect of recirculation on H
2S was negligible during conditions of sufficient combustion. On the other hand, during sufficient combustion, flue gas recirculation influenced H
2S significantly. When CO reached 2000–2500 mg/m
3, the concentration of hydrogen sulfide decreased from 55 mg/m
3 to 0 at an FGR ratio of 50%.
According to the calculated sulfur quantity in sunflower hull pellets (see
Table 1), the theoretical maximum SO
2 concentration was around 270 mg/m
3 in the case of full oxidization of fuel sulfur. However,
Figure 3,
Figure 4 and
Figure 6 show that, in practice, a lower concentration of SO
2 was formed. In the case of higher CO concentrations and higher FGR ratios, SO
2 approached the theoretically calculated concentration. The fact that the formation of SO
2 was not inhibited by flue gas recirculation and incomplete combustion could indicate that the oxidation of sulfur compounds occurs mainly in the space above the fuel layer, together with others emitted from volatile fuel substances.
4.5. Flue Gas Recirculation Influence on Concentrations of Hydrocarbon Compounds
Concentrations of hydrocarbon compounds are affected by flue gas recirculation and combustion sufficiency differently (see
Figure 7). It was observed that hydrocarbon compound concentrations tended to differ during various levels of CO. The results showed that concentrations of ethanol (C
2H
6O) increased in almost all cases of combustion quality. The average concentration of ethanol increased from 6.0 to 12.5 mg/m
3. The opposite effect was observed with ethane (C
2H
6) and benzene (C
6H
6) emissions. Concentrations were reduced from 7.0 to 2.5 mg/m
3 and from 6.0 to almost 0 mg/m
3, respectively. However, propylene (C
3H
6), acetic acid (C
2H
4O
2), and acrolein (C
3H
4O) showed no significant relationships with combustion completeness. Levels of these compounds averaged between 3.5 and 6.5 mg/m
3.
With relatively low levels of CO, i.e., up to 500 mg/m3, concentrations of ethane and benzene decreased with the rising FGR ratio in most cases. Concentrations of acetic acid remained stable throughout all FGR ratios and almost all CO levels. Under incomplete combustion, i.e., CO = 2000–2500 mg/m3 conditions, concentrations of acetic acid started to decrease with the increasing FGR ratio. Other compounds, like propylene, ethanol, and acrolein, demonstrated no clear relationships with flue gas recirculation ratio.
The graphs show that the influences of FGR ratio and combustion sufficiency on hydrocarbon emissions are different. It is difficult to determine whether the increase in FGR ratio reduces or increases combustion quality. This could be explained by competing processes: (1) the reduction in combustion temperature by dilution with lower temperature flue gas (see
Figure 2), causing reduced oxidation reaction rates of various hydrocarbons; (2) the improvement of combustion sufficiency due to turbulence, i.e., longer residence time [
6]; (3) the change in the oxygen concentration in the combustion zone.
Nevertheless, it was clearly observed that, under insufficient combustion conditions, the concentrations of hydrocarbon compounds were significantly more dispersed compared to cases of sufficient combustion. More complex hydrocarbons, e.g., C2H4O2, C3H4O, and C2H6O, occurred at higher concentrations. At the same time, concentrations of light hydrocarbons e.g., C3H6, C2H6, and C6H6, decreased.
6. Conclusions
The measured combustion temperatures were insufficient for “thermal” NOx generation, allowing us to consider that flue gas recirculation reduced mostly “fuel” NOx. The effect of FGR on NOx concentrations was less than that of fuel combustion with CO but, when combined, these abatement measures reduced NOx levels by up to 50% when NOx was mainly formed from fuel nitrogen.
NOx concentrations lower than 300 mg/m3 could be maintained with FGR ratios of at least 20% combined with CO levels of 2000–2500 mg/m3 by burning sunflower pellets. To meet the requirements of SO2 200 mg/m3, the flue gas recirculation ratio must be kept under 30% with the same CO level for sunflower pellets.
The results showed that nitrogen compound (N2O, HCN, NH3, and NO2) concentration levels were low. Nevertheless, flue gas recirculation had a positive effect on by decreasing NH3 and NO2 emissions and a negative effect on the nitrogen compounds N2O and HCN.
Flue gas recirculation, as well as CO, increased SO2 concentration close to the theoretically calculated (maximum) emission level.
Flue gas recirculation had a minor effect on reducing H2S and SO3 concentrations after complete combustion. An opposite effect was seen and, therefore, incomplete combustion was maintained.
Under relatively sufficient combustion, concentrations of C2H6 and C6H6 decreased with the rise in the FGR ratio. Concentrations of C2H4O2 decreased with increasing FGR ratio under low-quality combustion. Other compounds, e.g., C3H6, C2H6O, and C3H4O, demonstrated no clear relationship with the flue gas recirculation ratio. Moreover, under low-quality combustion, more complex hydrocarbons undergo flue gas composition.


