Article

Effect of the Reactant Transportation on Performance of a Planar Solid Oxide Fuel Cell

1
School of Mechanical and Power Engineering, Zhengzhou University, Zhengzhou 450002, China
2
School of Mechanics and Safety Engineering, Zhengzhou University, Zhengzhou 450002, China
3
Guangzhou Institute of Energy Conversion, Chinese Academy of Sciences, Guangzhou 510640, China
4
College of Chemistry and Chemical Engineering, Anhui University, Hefei 230601, China
*
Authors to whom correspondence should be addressed.
Energies 2021, 14(4), 1212; https://doi.org/10.3390/en14041212
Submission received: 4 January 2021 / Revised: 9 February 2021 / Accepted: 18 February 2021 / Published: 23 February 2021
(This article belongs to the Section A5: Hydrogen Energy)

Abstract

:
The process of reactant transportation greatly affects the performance of solid oxide fuel cells (SOFCs). Therefore, a three-dimension numerical SOFC model was built to evaluate mainly the effect of the reactant transportation coupling of heat and mass transfer and electrochemical reactions, and the reliability of numerical calculations was validated. Numerical studies revealed the correlation of both increase of reactant concentration gradients and improved mass transfer capability of multi reactants in gas diffusion electrode with the enhancement of the SOFC performance, in the condition of enough supplies of the fuel and the oxidant. Further studies identified the oxygen ions conductivity in electrolytes played a critical role in energy output and thus the performance of SOFCs. For example, the current density would increase by 65% if the ionic conductivity of electrolytes doubled. This study gives insight into the significance of operational conditions, electrolytes, and structures on the ionic oxygen conductivity and further on the optimization of the SOFCs. Overall, the numerical modeling leads a clear path toward the optimization of SOFCs.

1. Introduction

A fuel cell is a unique efficient energy conversion system, being able to convert storable chemical energy directly into instantly usable electricity [1], among which the solid oxide fuel cell (SOFC) is generally considered to be a scalable, flexible, silent, and emission-free power source [2]. SOFCs have received considerable attention in theoretic and modeling studies on the provision of in-depth mechanism insights, which has achieved speed-up development [3]. In the two configurations of SOFCs, the planar SOFC has a higher density and better efficiency than the tubular one. The most commonly used planar SOFCs for material microstructure studies are the circle button cells [4]. A common button cell structure is an assembly with a circular disc-like electrode, and the fuel and oxidant flowing through a concentric cylindrical tube assembly [5]. Button cells play a major role in the development and evaluation of new SOFC materials and membrane–electrode assembly architectures [6]. The majority of studies cover the exploration of the design aspect, recent advances such as the improvement of materials and new fabrication techniques, and new configurations and applications [7,8]. Some other studies addressed characteristics of dynamic behaviors of SOFCs [9] and the expansion of fuels via high hydrocarbons reforming [10].
New materials and fabrication techniques were developed to lower operating temperatures and enhance the performance of SOFC, which emphasized electrode materials. A correlation between the microstructure of the anode electrode and its electrochemical performance for a tubular design was reported [11]. The possibility of using Ni-based anodes was investigated as alternatives to the Pt-based anodes for thin-film SOFCs operating at low temperatures [12]. Symmetric solid oxide fuel cells (SSOFCs) based on the Co-free La0.5Sr0.5Fe0.9Nb0.1O3-delta (LSFNb) perovskite oxide has been successfully prepared by the sol-gel method [13]. Juan et al. [14] tested several SOFC electrode materials and optimized them to operate in symmetrical SOFCs. Su et al. [15] summarized the advances in the development of electrode materials and structures for symmetrical SOFCs. Different types of self-supported SOFCs have been compared from a technical point of view [16]. There seemed a missing relevance to another critical material, which is the electrolyte. Previous research also addressed novel designs, configurations, optimization, and applications of SOFCs. For example, the fuel processing unit was modified to convert effectively raw fuel into hydrogen-rich gas [17]. A planar SOFC apparatus was designed for operation in both regular cell and button cell configurations, in which fuel and oxidant chambers were included to improve the SOFC performance [18].
The development of mathematical models on SOFC has greatly enhanced the capabilities of exploration of mechanical insights and further optimization of operating conditions on the performance of SOFC, in a low cost, high efficiency, and enough accuracy [19]. Typically, a model for the planar SOFC stack was developed to show the dependence of the cell output strongly on the rib width [20], and the mass transport behaviors in the anode side of a one-cell stack of a planar SOFC [21]. A multidimensional model was developed to perform parametric studies to obtain insights on behaviors and efficiencies of the direct internal reforming SOFC system [22]. A two-dimensional model based on the lattice Boltzmann method (LBM) was established to study mass transport in the porous electrodes and fuel and air channels [23], and a two-dimensional model was developed to predict and evaluate the performance of an anode-supported SOFC button cell [24]. For more accurate predict behaviors of SOFC, many three dimensional mathematical models were developed or adopted to study, such as the influence of electrolyte thickness and operating parameters [25], optimized interconnect designs [26], different reactant flow channels [27], hydrodynamic and electrochemical behaviors [28], and the reaction and thermodynamic state [29]. To the best of our knowledge, there were few reports on elucidating restricting factors on mass transportations and electrochemical reactions of reactants, which was critical to material development, better designs, and optimization of SOFCs.
To evaluate the influence of reactants' transportations and their reactions on the SOFC performances, a three-dimensional numerical model of SOFC was established, coupling heat transfer and mass transfer and electrochemical reactions. By carrying out the numerical calculations, detailed reactant profiles in gas channels and porous electrodes were obtained, the multispecies mass transportations, ionic conductions, and current density in electrodes and electrolyte were discussed. Based on this, the most significant factors on reactant species transportation and performances of the given SOFC were critically investigated and identified. The numerical model and results realized the establishment of clear and insightful views on the significance of reactant transportations in SOFCs.

2. SOFC Modelling

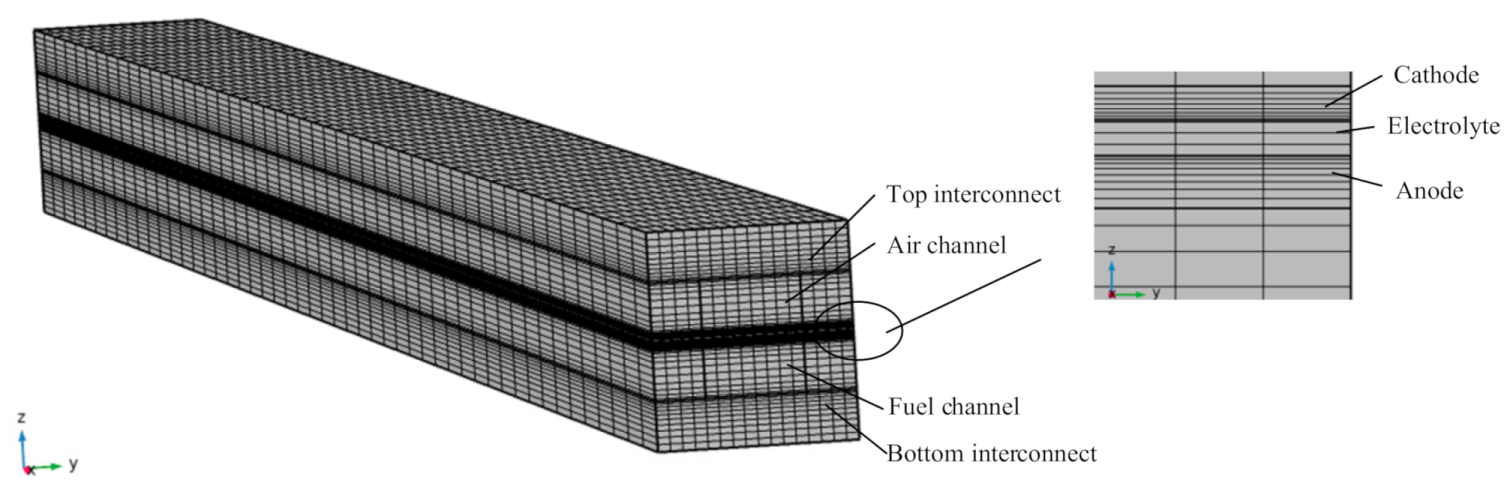
2.1. Numerical Model

For the structure of SOFC stacks, it can be seen as composed of many repeating cell units. The cell unit is connected electronically and thermally with metallic interconnects [29,30,31]. To evaluate the effect of reactant transportations on the performance of a SOFC, a three-dimensional model was established for a planar SOFC coupling heat and mass transfers and electrochemical reactions based on the literature [25,27,30], which is shown in Figure 1. The geometric and physical parameters of the numerical model are listed in Table 1. The oxidant and fuel flow in a counter pattern in the gas channels, which are treated as ideal gases. The representative materials were adopted, and the model is composed of the metal interconnects (stainless steel), reactants flow channels, the anode electrode of the nickel/yttria-stabilized zirconia (Ni–YSZ), cathode electrodes of the strontium-doped lanthanum manganite/yttria-stabilized zirconia (LSM–YSZ), and the electrolyte of the yttria-stabilized zirconia (YSZ).

2.2. Governing Equations

Equations for ion, electron, momentum, gas-phase species, and heat transport are to describe the different phenomena of momentum transport, mass continuity equation, species transport, and charge transport in the model of SOFC. In the model, radiation heat transfer was ignored [20,32,33]. The governing equations are summarized in Table 2. The parameters of thermal conductivities, densities, and heat capacities in the model are summarized in Table 3.

2.3. Boundary Conditions and Operating Parameters

The numerical model was built with the main parameters of [27], where the voltages of the top interconnect were set from 0.5 V to 0.9 V, and that of the bottom interconnect was set as an electrical ground. The thermal periodic condition and the electric insulation condition were set for the span-wise sidewalls of the model [29], which means the same temperatures and the heat fluxes across both surfaces.
At the inlets of the gas channels, the oxidant velocity was 3 m/s with the mass fraction ratio O2 and N2 of 0.15:0.85, and the fuel velocity was 0.4 m/s with the mass fraction ratio of H2 and H2O of 0.4:0.6. The ambient conditions were set for the pressure outlet of both channels. The current densities of anode and cathode were set as 4637.4 and 1166.2 A/m2, respectively. The parameters of operation, thermal conductivities, densities, and heat capacities for the gases, anode, cathode, electrolyte, and interconnect are listed in Table 3.

3. Results and Discussion

3.1. Validation of the Numerical Calculation

The numerical simulations were carried out by the commercial finite element software COMSOL Multiphysics 5.4 (COMSOL AB, Stockholm, Sweden). The grid-independent results were obtained, and the grids on the cross section are shown in Figure 1. To validate the numerical calculation, the numerical results of SOFC performance were compared with those in the published literature [25,27], and the cell voltage and power density versus current densities are shown in Figure 2a,b, respectively.
The numerical results agreed well with the experimental results and those of the numerical results in the literature [25,27]. The compared results confirmed the successful coupling of heat transfers into the overall numerical model and finally validated the accuracy and reliability of the present numerical model. Some acceptable errors were derived mainly from several factors, such as assumptions of ideal processes of the transport and reaction in the SOFC, and ideal values of physical parameters of the stack components [28,34,35].

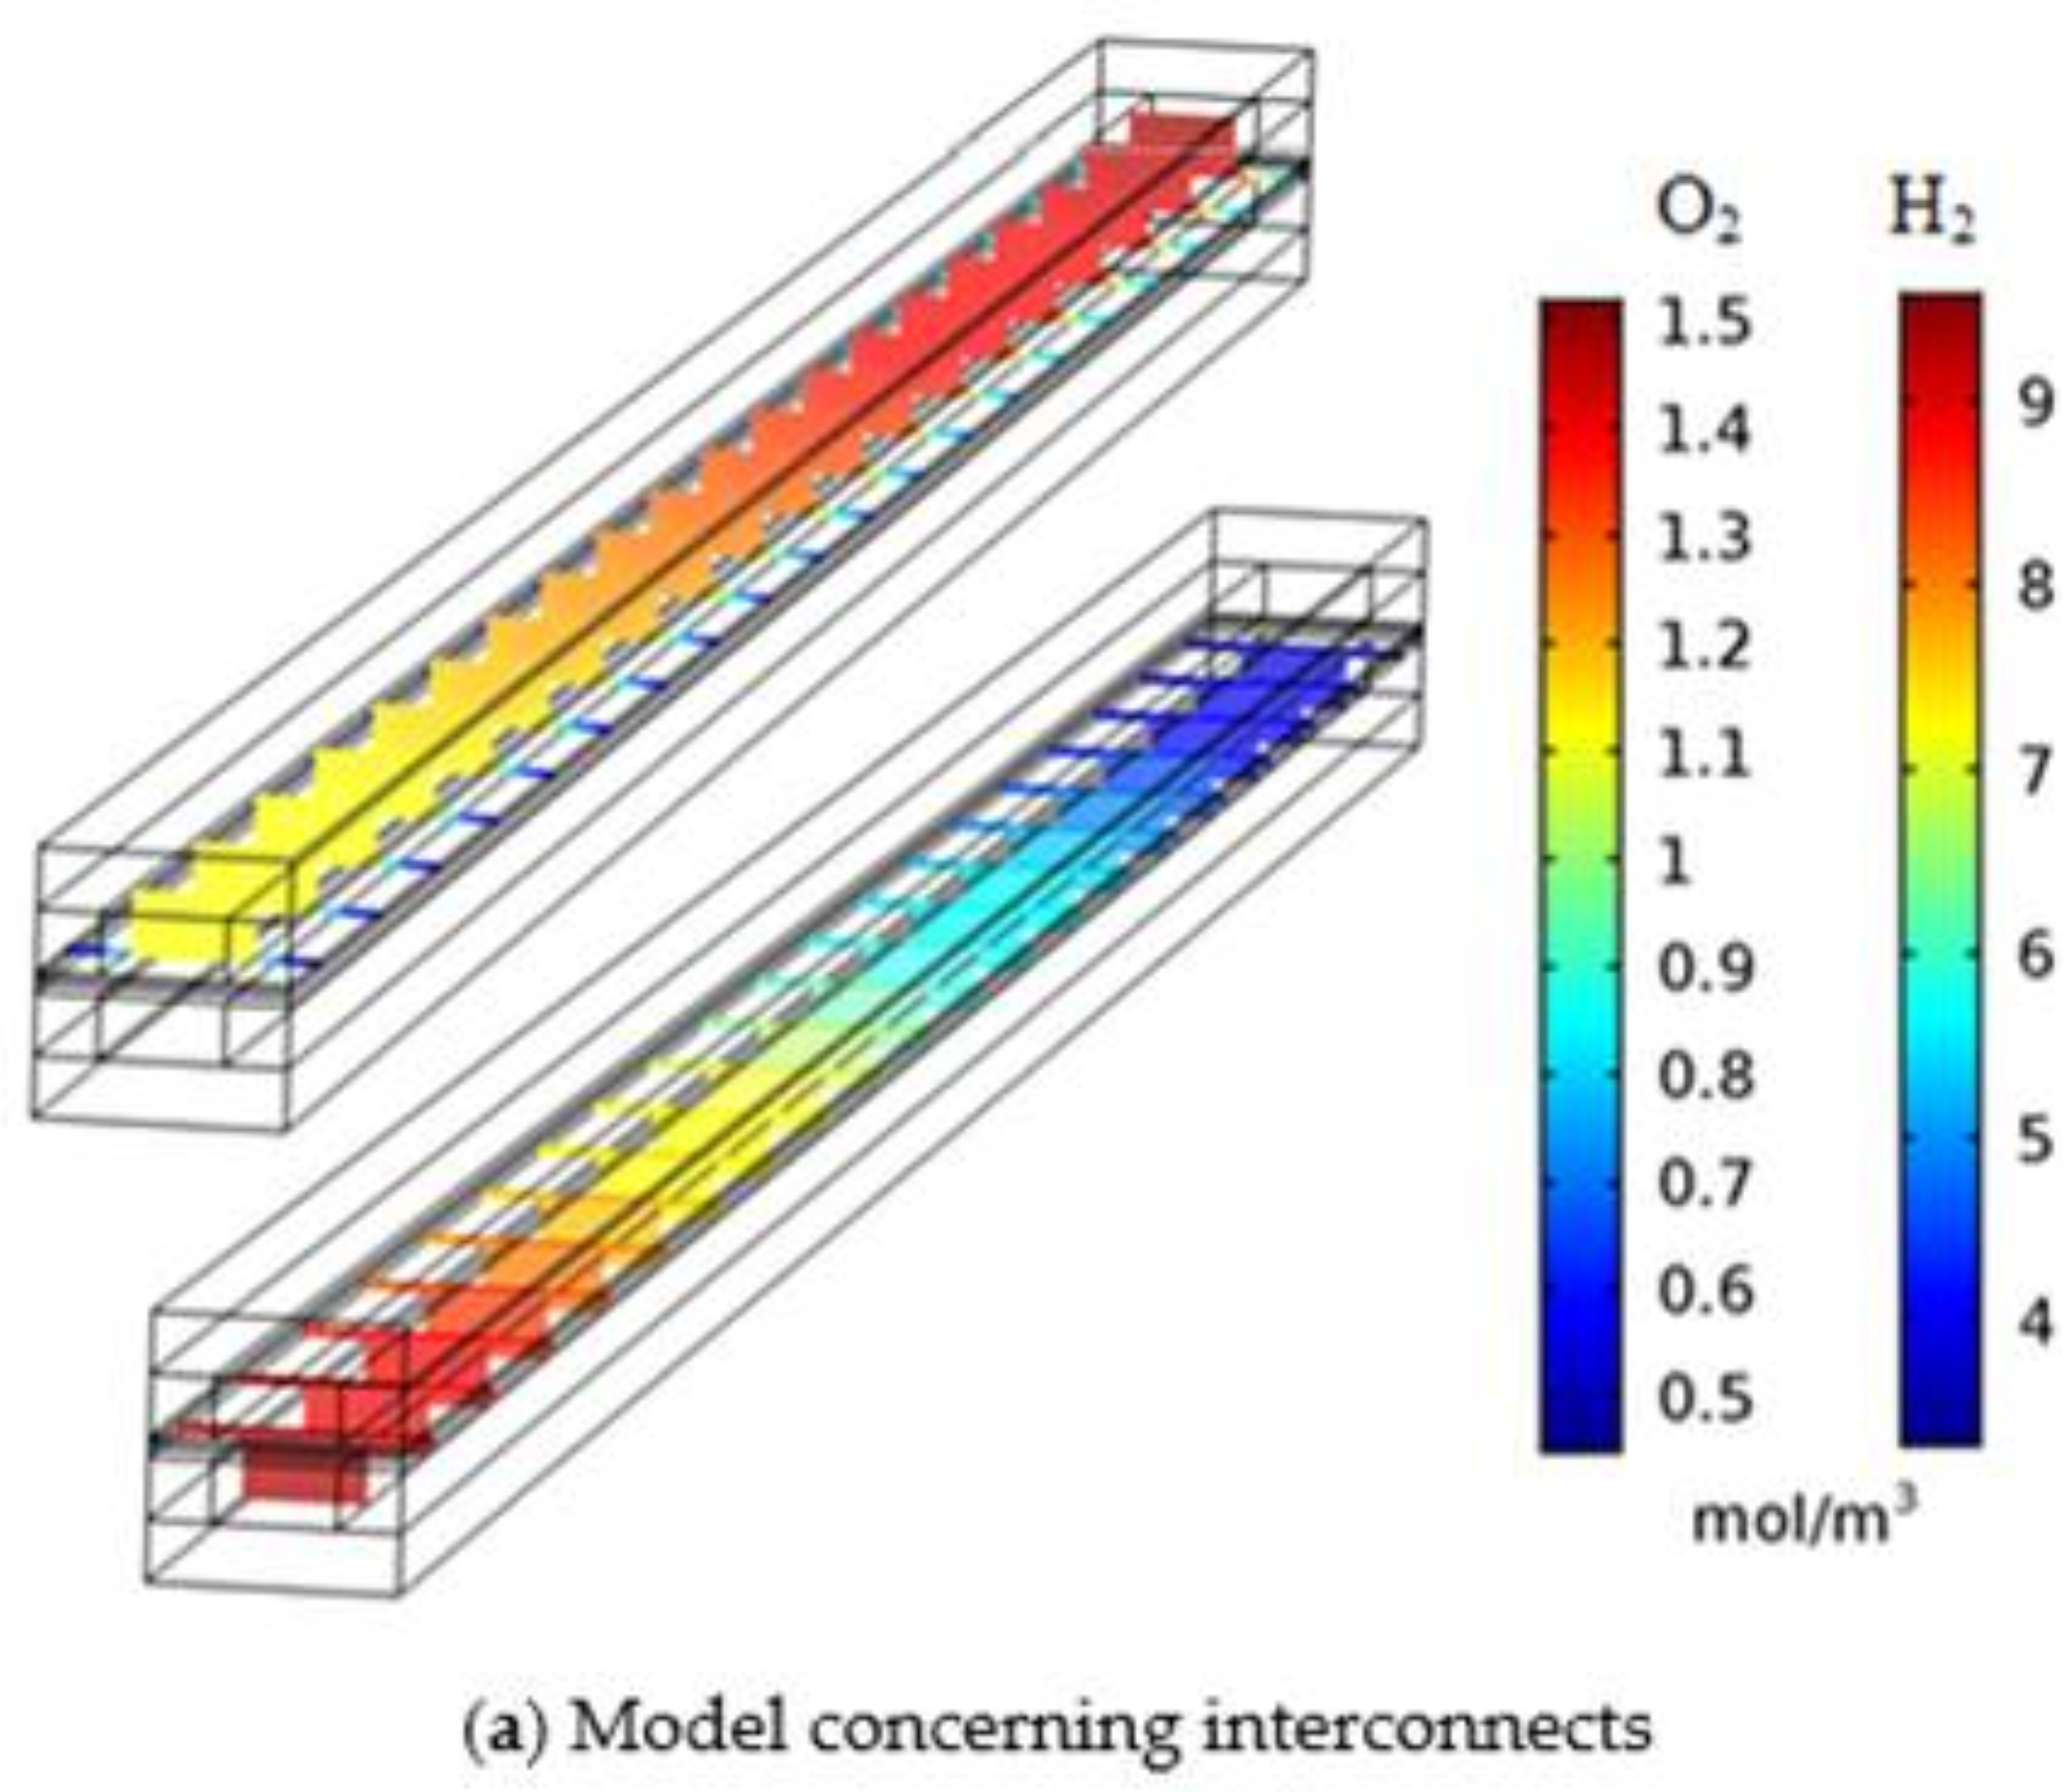
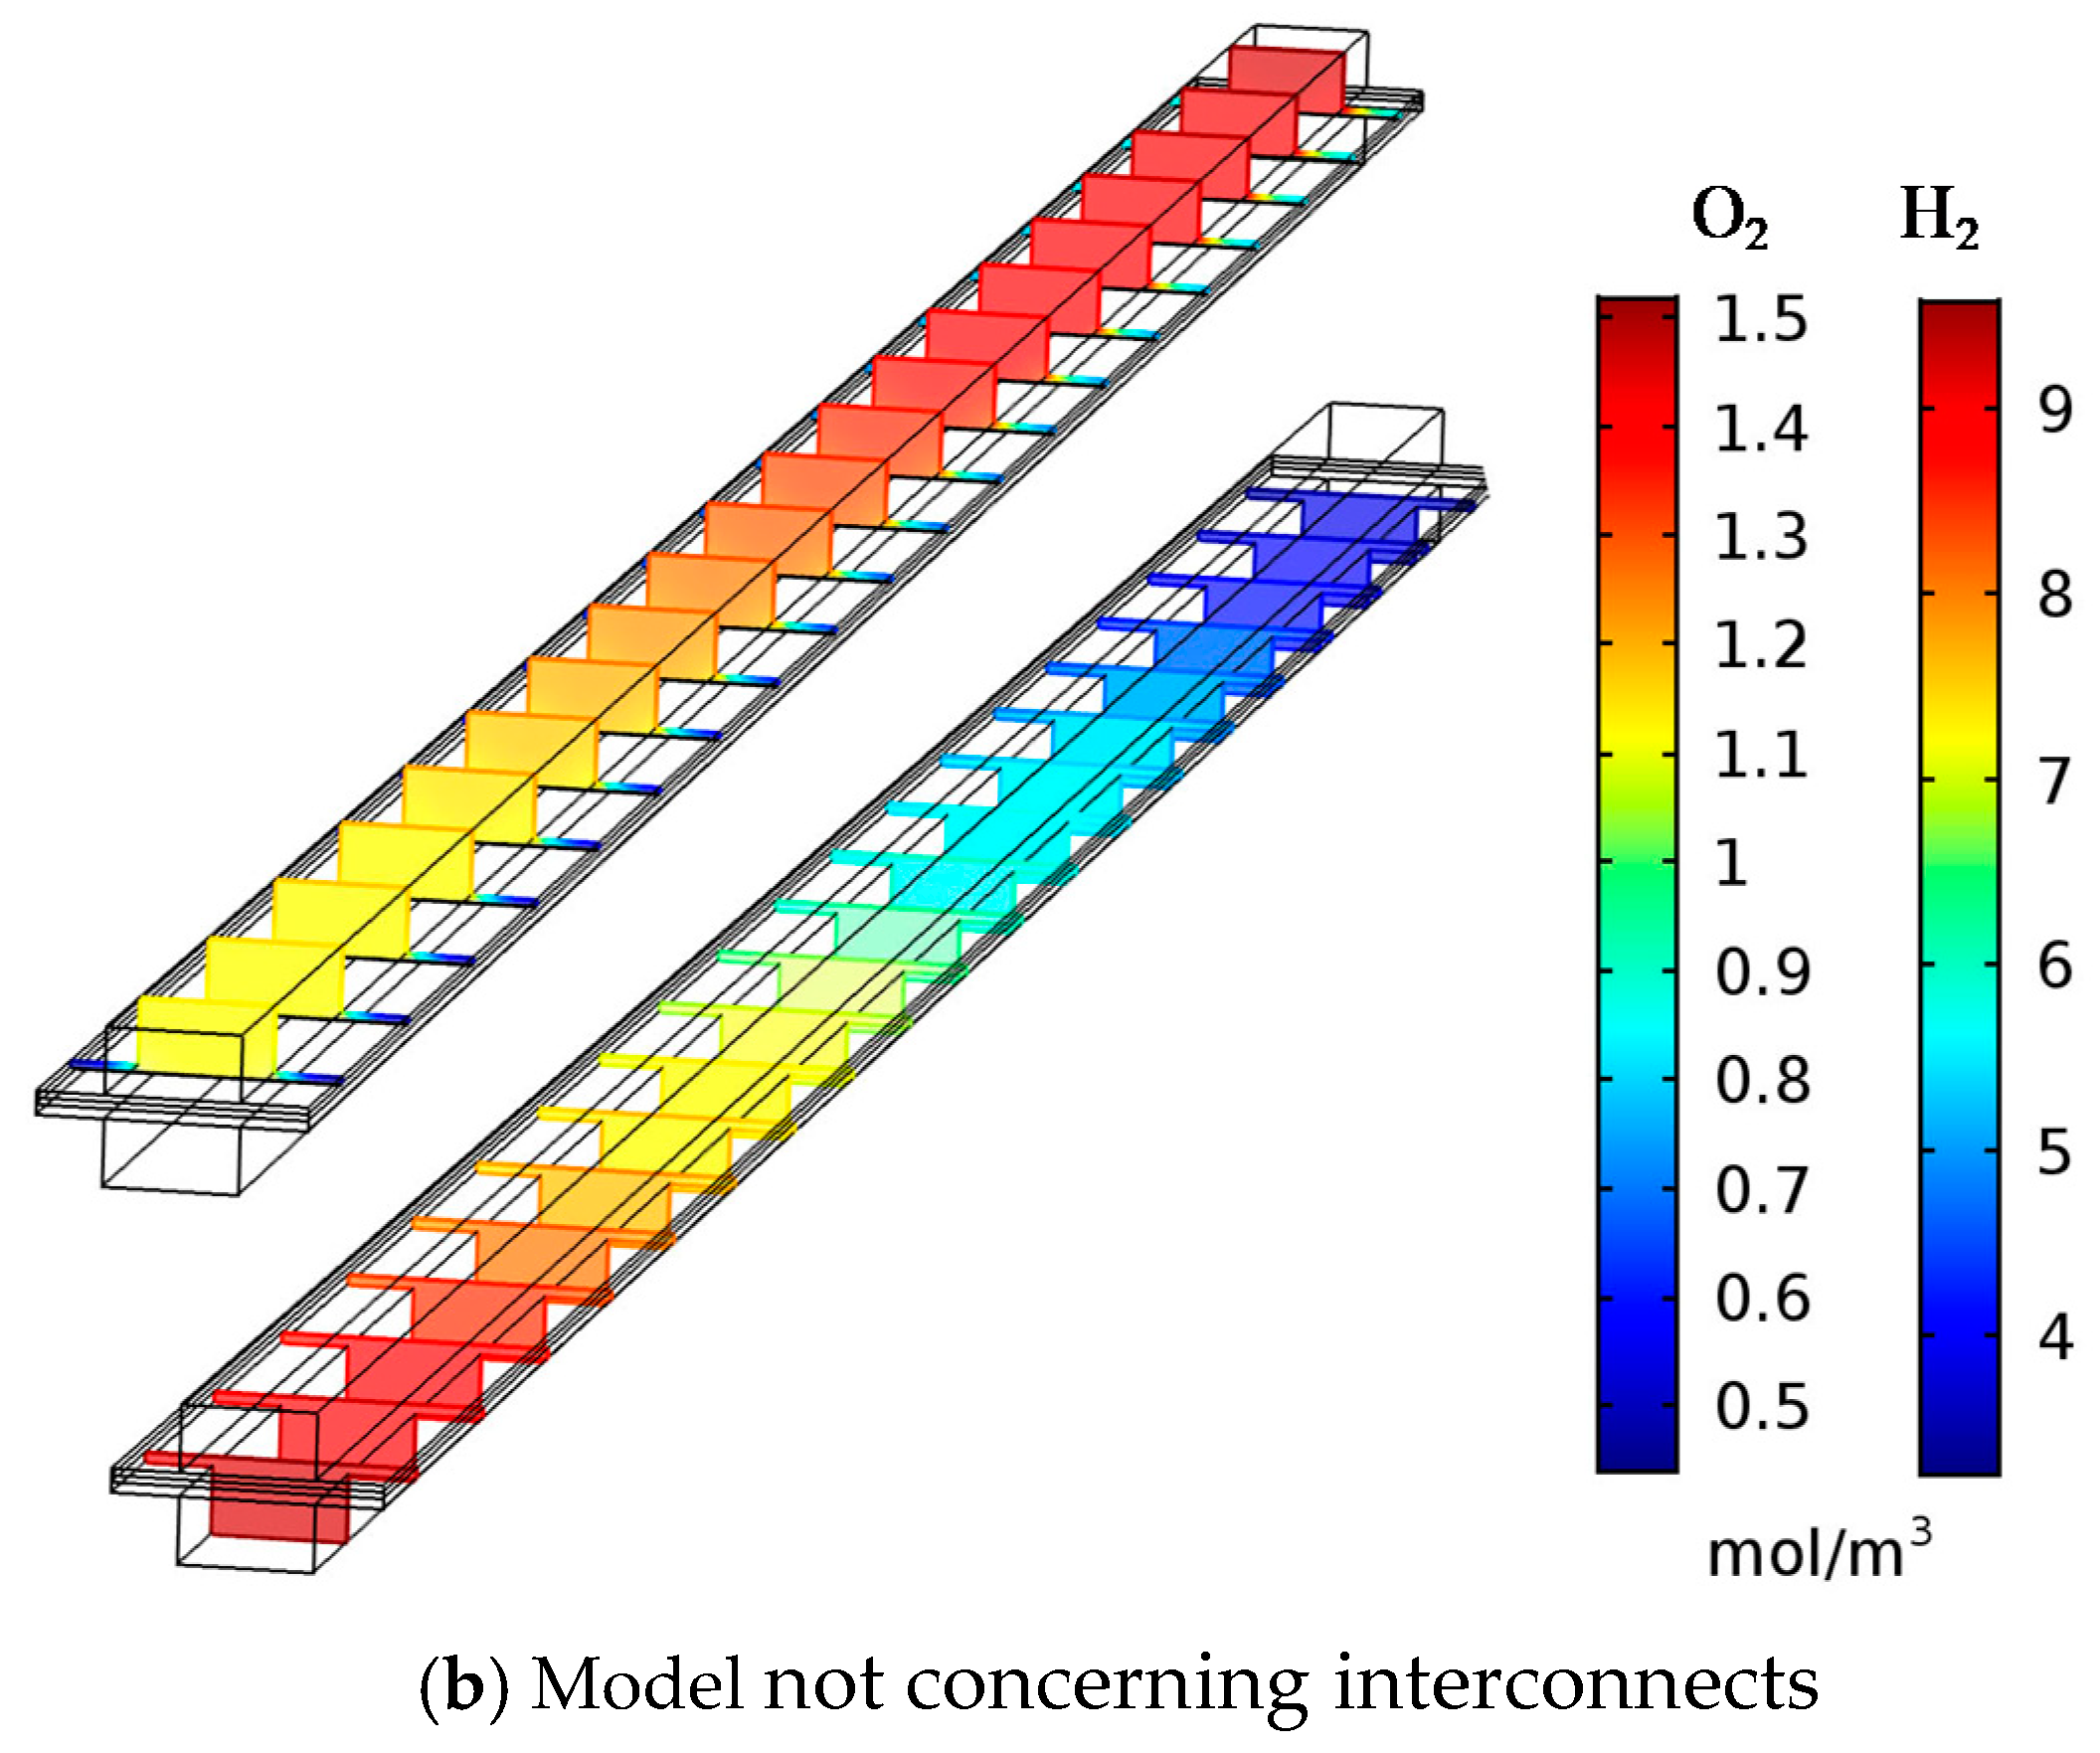
3.2. Effect of Interconnect in Numerical Model and Model Simplification

Previous studies [2] argued the necessitation of the inclusion of the interconnect in the numerical model. The metallic interconnect is usually used in contact with electrodes and reactant gases, enabling the electronic current and the heat transfer. It is made of metallic materials in which the electronic conduction is enough rapid. The exclusion of the interconnect in the current model can avoid the simulation in a full three-dimensional geometry, and thus greatly reduce the computational time and cost, but still be able to simulate fields of flows and pressures in fluid channels. This study also revealed the minimal variation of temperatures along the fuel channel at different operating voltages, such as about 2 °C at an operating voltage of 0.9 V and 50 °C at an operating voltage of 0.5 V, implying that the temperature variation was about 6.3% at most at the operation temperature of 800 °C, which was in the same magnitude of errors between numerical and the experimental results. Therefore, the exclusion of interconnects may be feasible to simplify the model via assuming isothermal conditions in numerical modeling to save computational resources.
To accurately identify the significance of the interconnect on the SOFC performance, the cases with inclusion and exclusion of interconnects in the numerical model were compared and studied. The model with the exclusion of interconnect is shown in Figure 3 including fuel and oxidant channels, gas diffusion electrodes, and the electrolyte layer. The numerical simulation was carried out at 800 °C, the electrical potential at the cathode ranged from 0.5 V to 0.9 V while the anode was grounded, isothermal conditions were assumed, and the other model parameters were the same as those described previously.
The main parameters of performance, cell voltage and the power density with their associated current densities under two simulation conditions of inclusion and exclusion of interconnects, were compared to those from the experiments, as shown in Figure 4. Both two numerical results (with/without interconnects) shared similar tendencies in their current densities and power densities. The errors between the experimental results and numerical results by the exclusion of the interconnect were about 20%. Cell voltages and power densities by the exclusion of the interconnect were about 26% greater than that those by the inclusion of the interconnect at the same current density. The difference in numerical results of the two cases was mainly attributed to the ignored ohmic overpotential in interconnects and applied constant model parameters in the numerical model for absolutely non-uniform temperatures. To discuss further the effect of interconnect on the fuel cell performances, the numerical results of two simulation cases were selected with almost the same current density in the two models. This study further confirmed that the current density was 2348 A/m2 in the case with the exclusion of interconnects, compared to 2313 A/m2 in the case with the inclusion of interconnects. Moreover, contours of mole fraction profiles of both oxygen and hydrogen, model concerning interconnects in Figure 5a and not concerning interconnects in Figure 5b, were almost in the same patterns along the channels in these two cases, which presented reactant profiles at different cross sections along the gas channels in two cases. Therefore, the numerical model with the exclusion of interconnect can be used to accurately evaluate the effect of operating parameters on the performance of the planar solid oxide fuel cell. For the convenience and simplification of numerical calculations in this study, all results and discussions were based on the numerical model with the exclusion of the interconnect unless specifications.

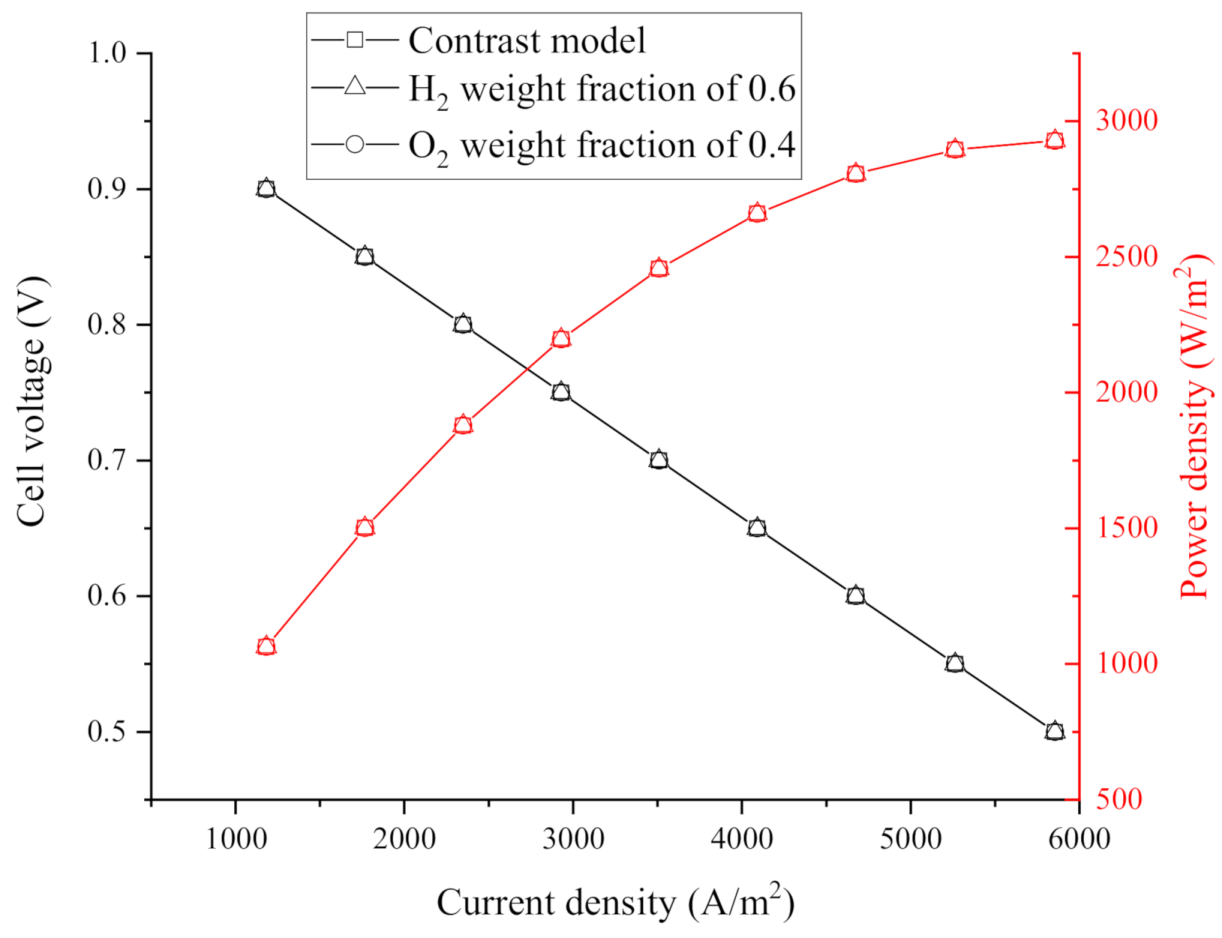
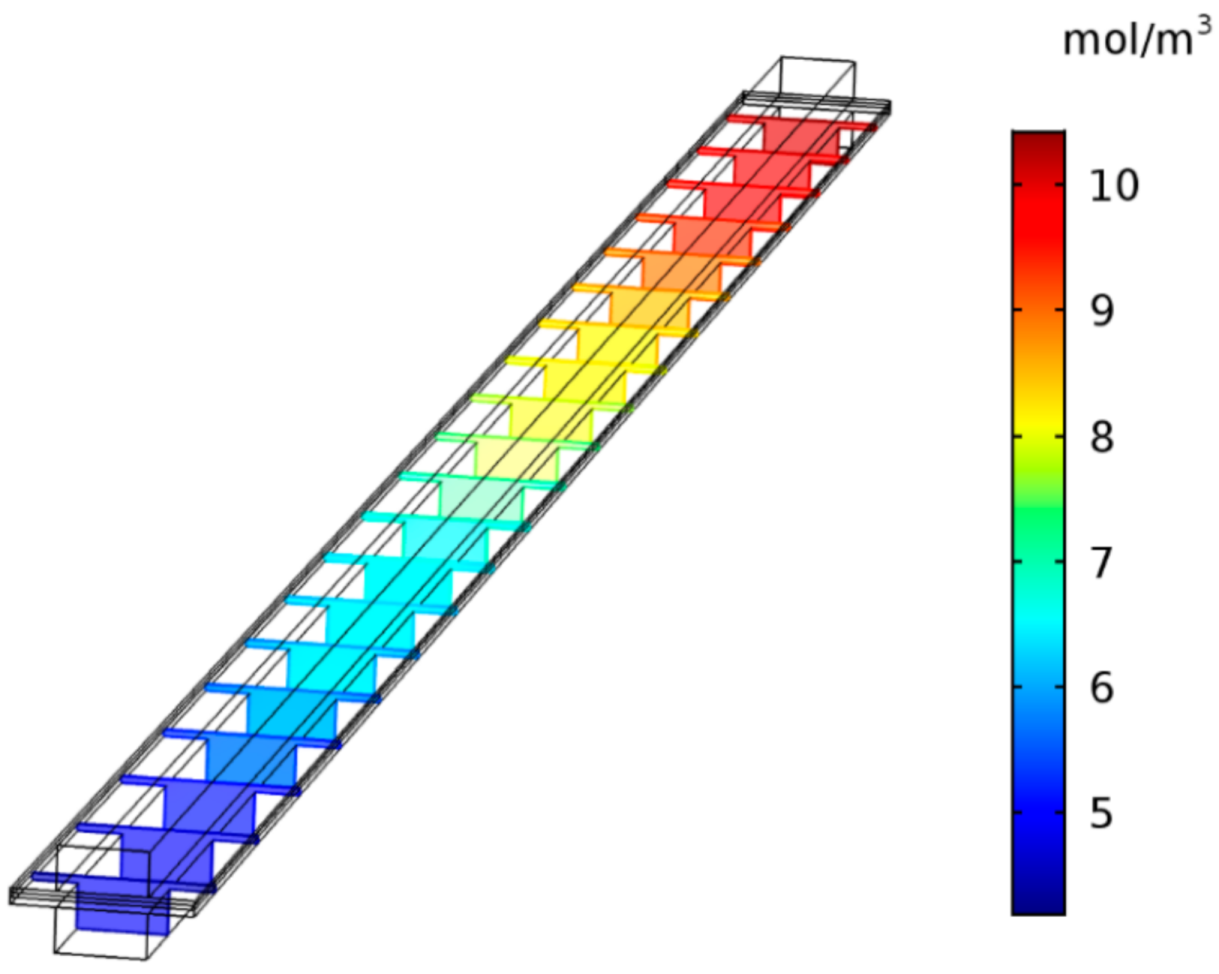
3.3. Effect of Contents of Gas Reactants

In typical SOFC stacks, the excess fuel is generally supplied to avoid the anode oxidation and the cell degradation arising from species concentration gradients and corresponding chemical stresses [29] under high operating temperatures [22]. On the other hand, in practice, there is a desire to improve the one-pass hydrogen utilization efficiency and minimize hydrogen leakage via the exhaust. Practically, the incompletely reacted fuel is generally recirculated back to be mixed with the fresh fuel and thus re-enters the fuel channel. Therefore, the elucidation of the effect of hydrogen concentrations (arising species concentration gradients) on the performance of the given SOFC stacks would be essential to maximize the system efficiency while avoiding materials degradation.
The parametric study was conducted by varying the inlet mass fraction of hydrogen from 0.4 to 0.6 to enhance hydrogen concentration gradients while maintaining constant inlet velocity and other parameters of fuel. The transport properties of the fuel were determined by reference [36]. The numerical results of the main SOFC performance parameters are shown in Figure 6.
The curves of the main SOFC performance parameters were almost completely overlapping. At the inlet hydrogen mass fraction of 0.6 and the cell voltage of 0.8 V, the distribution of hydrogen mole fraction on different cross sections along the anode channel is shown in Figure 7.
Likely, the oxygen mass fraction in the cathode also contributed impacts on the performance of the SOFC. Similarly, while maintaining other parameters as constant, the effect of oxygen gradient by varying oxygen concentration from 0.21 to 0.4 was examined. The numerical results of the main SOFC performance parameters were presented in Figure 6. It is not surprising that the curves of the main SOFC performance parameters are almost completely overlapping in these two cases. The results show that for the currently given parameters, while fuel and oxidant being sufficiently supplied, the increased concentration gradients of either hydrogen in the fuel channel or oxygen in the oxidant channel did not affect the performance of the SOFC.

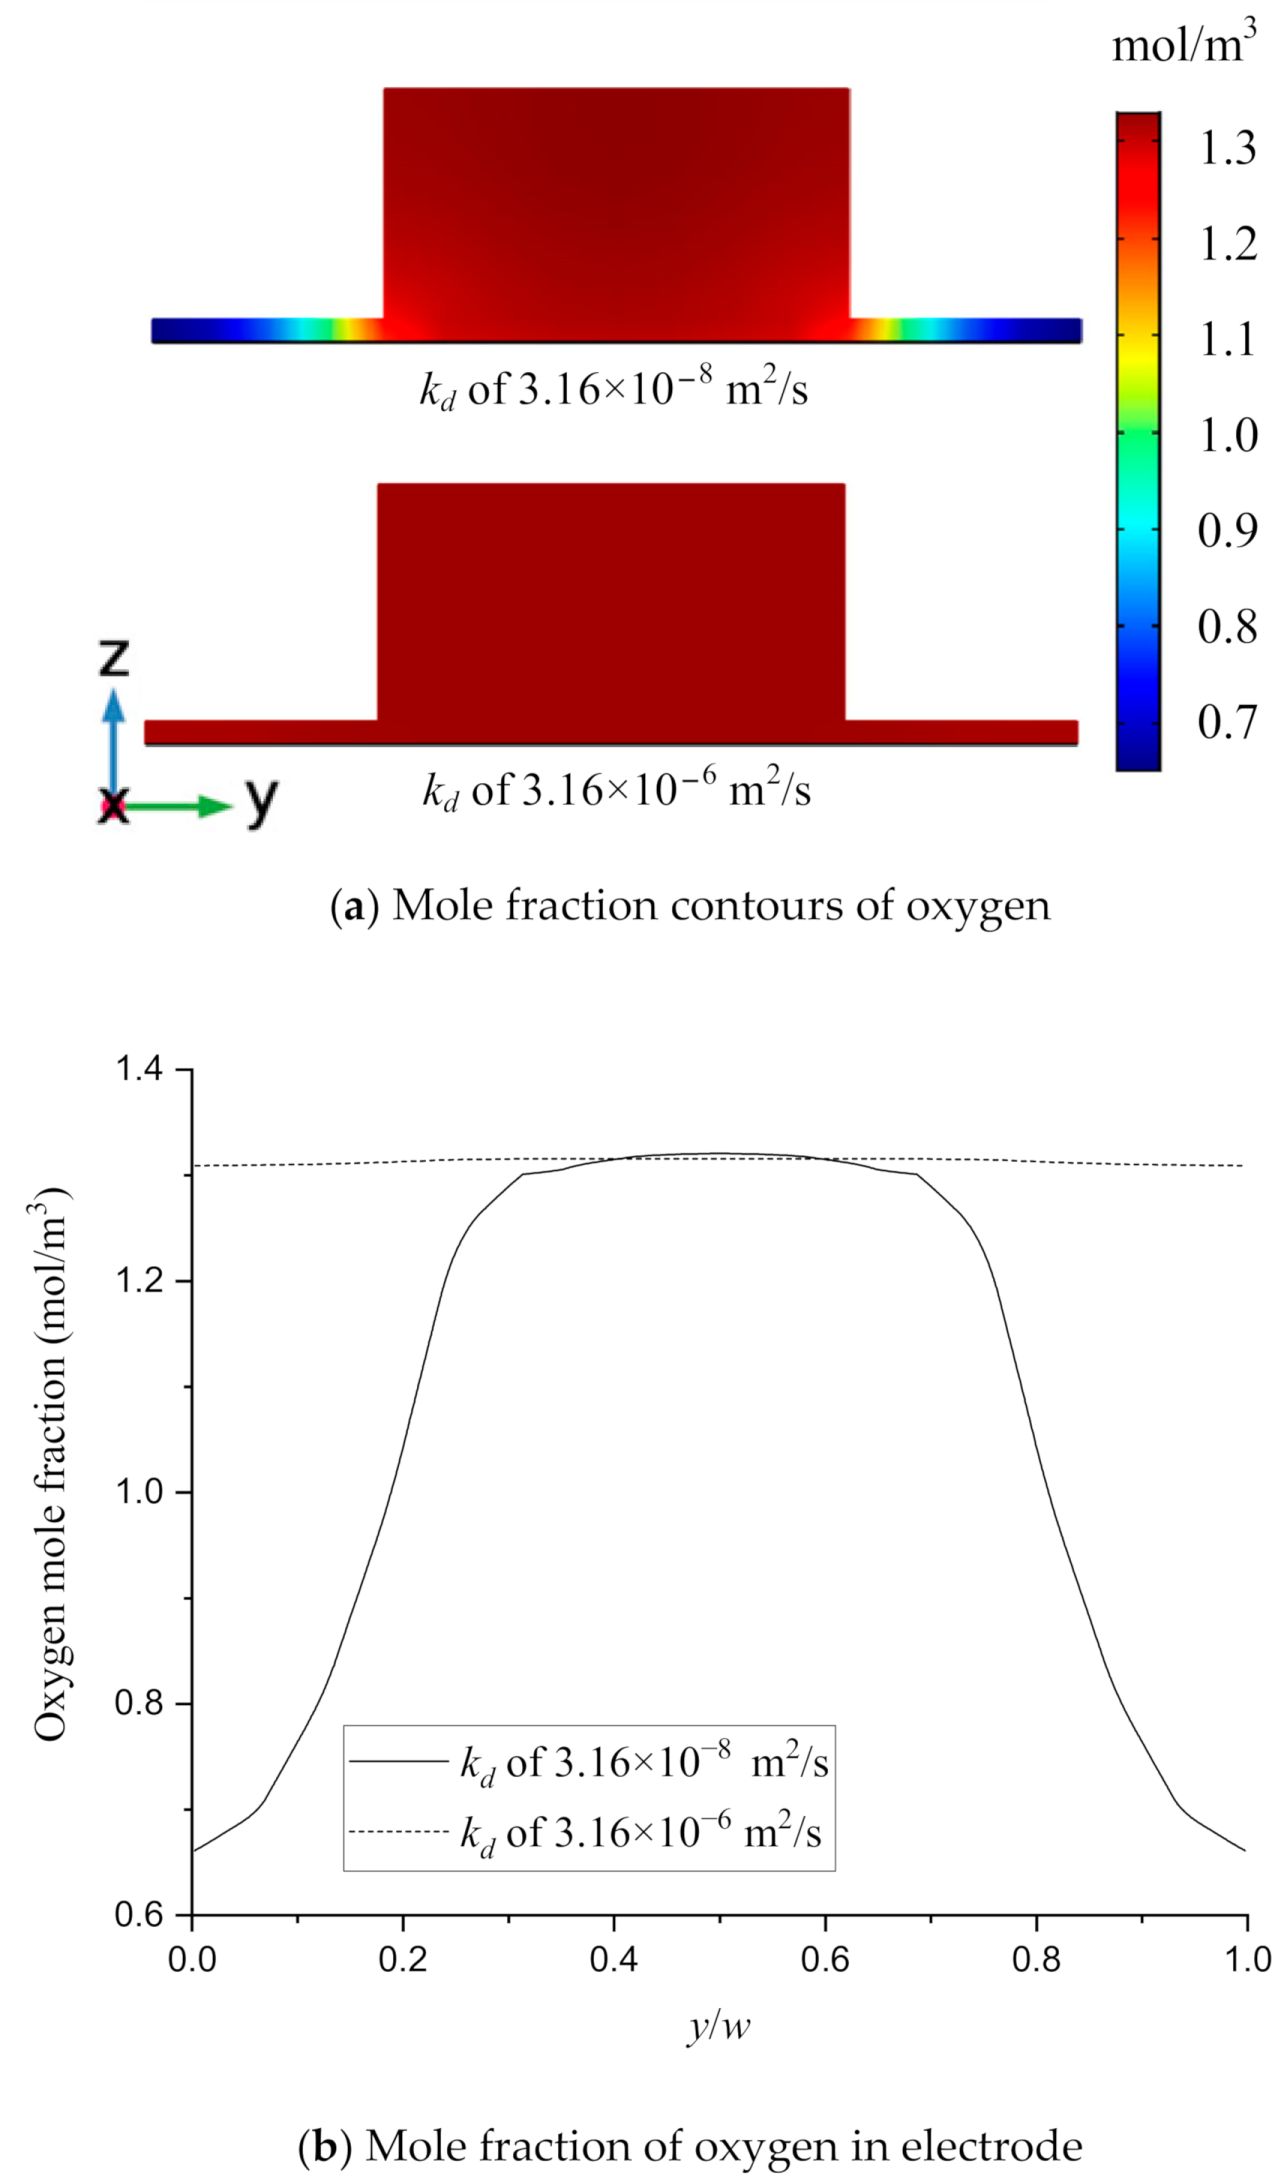
3.4. Effect of the Multi-Reactants Transportation

Multi-reactants mass transportations in the gas channels and electrodes, described by the Maxwell-Stefan equation, were another important factor to be considered in operating SOFC. It has been found in the previous Figure 5 that there were bigger oxygen concentration gradients on the cross sections in the oxidant channel because the oxygen concentration in the cathode electrode was much smaller than that in the oxidant channel. In Section 3.3, it was also found that the increased reactant concentration gradients in the gas channels did not affect the performance of the SOFC, which may imply the likelihood of the greater restriction on the performance of the SOFC existing in multi-reactants transportations in the gas diffusion electrodes.
Further considering multi-reactants transportations in the gas phase of electrodes, the molecular diffusion coefficients Dij was an important parameter describing the mass transfer of a multi-component reactant mixture system, which is defined by the following equation [37]:
D i j = k d T 1.75 ( 1 M i + 1 M j ) 0.5 p ( v i 1 3 + v j 1 3 )
where kd is the reference diffusivity, and Mi and νi are molar mass and diffusion volume, respectively.
Taking oxygen transfer as an example, diffusivity kd of oxygen can theoretically be assumed 100 times greater than the real one which was as a reference, for example, 3.16 × 10⁻⁸ m2/s as the reference and 3.16 × 10⁻⁶ m2/s presenting the case of the improvement in the multi-reactant mass transports in the gas diffusion electrodes. The mole fraction contours of oxygen on the middle cross section of the gas channels and gas diffusion layers were compared at the cell voltage of 0.8 V in Figure 8a, and the mole fraction distributions of oxygen along the normalized width of the electrode are shown in Figure 8b.
Profiles of oxygen mole fractions in Figure 8 showed that the oxygen mole fractions within the cross section vary from 1.330 mol/m3 to 0.652 mol/m3 when kd was 3.16 × 10⁻⁸ m2/s, and the difference was 51%. When kd was increased by 100 times, the difference between the biggest and smallest oxygen mole fractions decreased to 0.5%. Similar results were obtained for the mole fraction distributions of hydrogen, and the difference of the biggest and smallest mole fractions on the cross section was 3.86% when kd was 3.16 × 10⁻⁸ m2/s, which decreased to 0.2% when kd was assumed to be 3.16 × 10⁻⁶ m2/s. The numerical profiles of oxygen mole fractions implied that the multi-reactant mass transports in the gas diffusion electrodes can be improved greatly when kd was assumed to be increased.
The results of main SOFC performance parameters were compared between results of two cases with different gas diffusivities, leading to a similar conclusion as presented in Section 3.3 of analyzing the effect of reactant concentrations in gas channels. For the given transport properties and sufficient supply of reactants, enhanced multi-reactant mass transport in the gas diffusion electrodes did not enhance the performance of the SOFC.

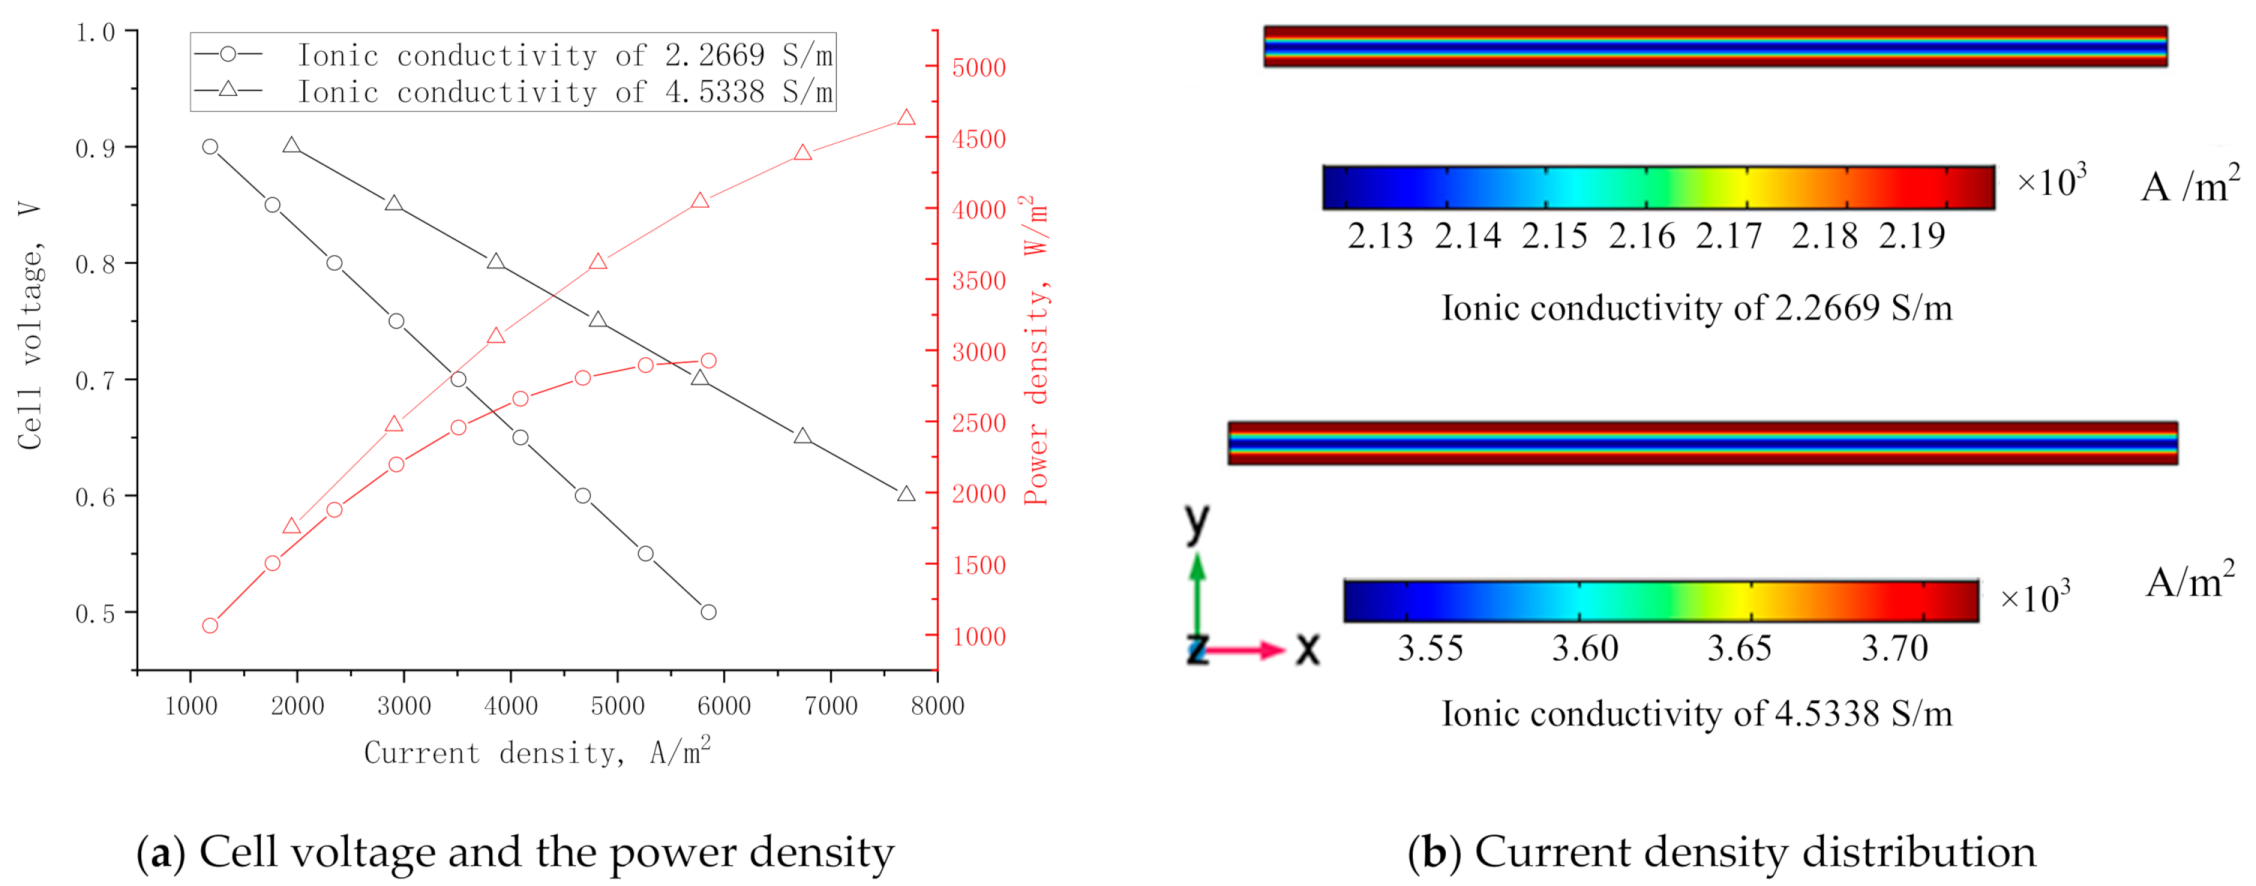
3.5. Effect of Ionic Conduction in Electrolyte

The aforementioned numerical analysis revealed the irrelevance of both the enhanced reactant concentration gradients in flow channels and the improvement in multi-reactant mass transports in gas diffusion electrodes to any enhancement of the SOFC performance for the given parameters of the SOFC unit. This implied the performance improvement of SOFC would be other controlling factors. Alternatively, the SOFC performance must address electric current, concerning the electron transportation in the electrodes and the ion transportation in the electrolyte. Electronic and ionic current densities are both governed by the charge continuity equations associated with Ohm’s law, which involve an ionic conducting phase and an electronic conducting phase. The electron and ion conductivities are two parameters that are usually used to present the conducting process. The ion conductivity in the electrolyte was specifically noticed on its crucial influence on the overall conductivity because its value is lower than the electric conductivities by several orders of magnitude.
To evaluate the effect of conducting the process, the ionic conductivity of electrolyte (YSZ) was assumed to be increased to 4.5338 S/m by 100% from 2.2669 S/m. The doubled value of the ionic conductivity is just a hypothetical and fictitious value to evaluate its affection. The comparison results on main SOFC performance parameters in these two cases are shown in Figure 9a.
As expected, the current density was enhanced greatly, by 65%, at the same cell voltage when the ionic conductivity was increased by 100%, and similarly, the power density was also increased by 65% at the same current density of SOFC. It implied that the oxygen ions conductivity in electrolytes plays a most critical role in the conducting process in SOFC. This agreed well with previous studies [25], which found that the power density increased with the decrease of the electrolyte thickness. The thinner electrolytes, the less resistant the ionic conductivity in the electrolyte.
The current density distributions at the cathode sides of the electrolyte in two cases are depicted in Figure 9b. In addition to the increased average current density with the increase of the ionic conductivity, it was also found that the current density was not uniform within the electrolyte. The nonuniform difference between the biggest and smallest current densities was 3.32% at an ionic conductivity of 2.2669 S/m, and this difference increased to 4.95% at an ionic conductivity of 4.5338 S/m. The nonuniform of current density was likely attributed to the SOFC geometric arrangement of the gas channel and interconnect. The metallic ribs of interconnects were in contact with porous electrodes, enabling the flow of electronic current [38]. Because the electrons are conducted through the ribs and interconnects in the SOFC unit, the area with the bigger current density in the gas diffusion electrodes lies in the contacting part of the interconnect ribs to electrodes, and the area with the smaller current density exists close to the reactant channels. This was not true for the current density along the reactant flow direction, which did not vary obviously. This benefited from the much bigger electron conductivities in the electrodes and excess hydrogen and oxygen supplied into the gas channels.
Further studies following the current study would be a schematic investigation on the optimization of the SOFC performances, correlating several aspects in operational conditions (such as temperatures and pressures and reactant species), material developments (mainly electrolytes), and structures and dimensions (affecting temperature and pressure profiles). The numerical modeling would help in insightful understandings and problem-identification on the affecting factors toward performances of SOFCs, leading a clear path toward the speed-up and optimization of SOFCs.

4. Conclusions

This study focused on the effect of reactant transportations on the performance of a given SOFC. The applied method was numerical modeling techniques based on COMSOL software package thus a three-dimensional SOFC model was established, involving all necessary SOFC components, such as interconnects, reactants flow channels, porous electrodes, and the electrolyte. The numerical results agreed well with the available results in the published literature, and the reliability of the numerical calculations was confirmed. Further studies found it is feasible to exclude the interconnect in the numerical model of the SOFC for the purpose of saving time while maintaining enough accuracy.
In the search for critical factors restricting mass transfers and electrochemical reactions, numerical studies revealed the irrelevance of both the increase in reactant concentration gradients in flow channels and the improvement in multi-reactant mass transports in electrodes to any enhancement of the SOFC performance when sufficient fuel and oxidant supplied for the given parameters of the studied SOFC unit. Further studies identified it is the ionic conductivity of electrolytes that could significantly change the SOFC performance. It was concluded that all factors affecting the ions conductivity in an electrolyte, such as temperatures, electrolyte materials, and dimensions, played a critical role in the energy output and performance of SOFCs.
It is believed that it is of great significance to compare the open-circuit voltage with the theoretical Nernst potential and to achieve a quantitative conclusion about the effects of the reduction of film thickness compared with the increase of conductivity; this will be carried out in future research. Overall, the numerical modeling provides insights into the transportations of involved reactants in the SOFCs, leading a clear path to design and optimize SOFCs.

Author Contributions

Conceptualization, Y.C., Y.W. and K.W.; methodology, Y.C., Y.W. and K.W.; data curation, Y.W. and Z.G.; formal analysis, Y.W. and Y.C.; funding acquisition, K.W. and Y.C.; writing—original draft, X.L. and Y.W.; writing—review and editing, Y.W. and Y.C.; project administration, K.W. All authors have read and agreed to the published version of the manuscript.

Funding

This research was supported by the National Natural Science Foundation of China (Grant No. 51776190 and No. 21676001), the National Key Research and Development program of China-Intergovernmental International Scientific and Technological Innovation Cooperation (Grant No. 2017YFE0105500).

Institutional Review Board Statement

Not applicable.

Informed Consent Statement

Informed consent was obtained from all subjects involved in the study.

Data Availability Statement

The data presented in this study are available on request from the corresponding author. The data are not publicly available due to at the date of publication, no data repository has been established yet.

Conflicts of Interest

The authors declare no conflict of interest.

References

  1. Wachsman, E.D.; Lee, K. Lowering the temperature of solid oxide fuel cells. Science 2011, 334, 935–939. [Google Scholar] [CrossRef]
  2. Raj, A.; Sasmito, A.P.; Shamim, T. Numerical investigation of the effect of operating parameters on a planar solid oxide fuel cell. Energy Convers. Manag. 2015, 90, 138–145. [Google Scholar] [CrossRef]
  3. Liu, S.; Kong, W.; Lin, Z. Three-dimensional modeling of planar solid oxide fuel cells and the rib design optimization. J. Power Sources 2009, 194, 854–863. [Google Scholar] [CrossRef]
  4. Wu, P.; Shy, S. Cell performance, impedance, and various resistances measurements of an anode-supported button cell using a new pressurized solid oxide fuel cell rig at 1–5 atm and 750–850 °C. J. Power Sources 2017, 362, 105–114. [Google Scholar] [CrossRef]
  5. Monder, D.S.; Nandakumar, K.; Chuang, K.T. Model development for a SOFC button cell using H2S as fuel. J. Power Sources 2006, 162, 400–414. [Google Scholar] [CrossRef]
  6. Goldin, G.M.; Zhu, H.; Kee, R.J.; Bierschenk, D.; Barnett, S.A. Multidimensional flow, thermal, and chemical behavior in solid-oxide fuel cell button cells. J. Power Sources 2009, 187, 123–135. [Google Scholar] [CrossRef]
  7. Corigliano, O.; Fragiacomo, P. Numerical modeling of an indirect internal CO2 reforming solid oxide fuel cell energy system fed by biogas. Fuel 2017, 196, 352–361. [Google Scholar] [CrossRef]
  8. Hussain, J.; Ali, R.; Akhtar, M.N.; Jaffery, M.H.; Shakir, I.; Raza, R. Modeling and simulation of planar SOFC to study the electrochemical properties. Curr. Appl. Phys. 2020, 20, 660–672. [Google Scholar] [CrossRef]
  9. Pianko-Oprych, P.; Hosseini, S.M. Dynamic analysis of load operations of two-stage SOFC stacks power generation system. Energies 2017, 10, 2103. [Google Scholar] [CrossRef] [Green Version]
  10. Dillig, M.; Plankenbühler, T.; Karl, J. Thermal effects of planar high temperature heat pipes in solid oxide cell stacks operated with internal methane reforming. J. Power Sources 2018, 373, 139–149. [Google Scholar] [CrossRef]
  11. Suzuki, T.; Hasan, Z.; Funahashi, Y.; Yamaguchi, T.; Fujishiro, Y.; Awano, M. Impact of anode microstructure on solid oxide fuel cells. Science 2009, 325, 852–855. [Google Scholar] [CrossRef]
  12. Lee, Y.; Park, J.; Yu, W.; Tanveer, W.H.; Lee, Y.H.; Cho, G.Y.; Park, T.; Zheng, C.; Lee, W.; Cha, S.W. Nickel-based bilayer thin-film anodes for low-temperature solid oxide fuel cells. Energy 2018, 161, 1133–1138. [Google Scholar] [CrossRef]
  13. Bian, L.; Duan, C.; Wang, L.; Zhu, L.; O’Hayre, R.; Chou, K.-C. Electrochemical performance and stability of La0.5Sr0.5Fe0.9Nb0.1O3-δ symmetric electrode for solid oxide fuel cells. J. Power Sources 2018, 399, 398–405. [Google Scholar] [CrossRef]
  14. Ruiz-Morales, J.C.; Marrero-López, D.; Canales-Vázquez, J.; Irvine, J.T.S. Symmetric and reversible solid oxide fuel cells. RSC Adv. 2011, 1, 1403–1414. [Google Scholar] [CrossRef]
  15. Su, C.; Wang, W.; Liu, M.; Tadé, M.O.; Shao, Z. Progress and prospects in symmetrical solid oxide fuel cells with two identical electrodes. Adv. Energy Mater. 2015, 5, 1500188. [Google Scholar] [CrossRef]
  16. Chelmehsara, M.E.; Mahmoudimehr, J. Techno-economic comparison of anode-supported, cathode-supported, and electrolyte-supported SOFCs. Int. J. Hydrogen Energy 2018, 43, 15521–15530. [Google Scholar] [CrossRef]
  17. Kupecki, J.; Motylinski, K.; Milewski, J. Dynamic analysis of direct internal reforming in a SOFC stack with electrolyte-supported cells using a quasi-1D model. Appl. Energy 2018, 227, 198–205. [Google Scholar] [CrossRef]
  18. Nguyen, X.-V.; Chang, C.-T.; Jung, G.-B.; Chan, S.-H.; Yeh, C.-C.; Yu, J.-W.; Lee, C.-Y. Improvement on the design and fabrication of planar SOFCs with anode–supported cells based on modified button cells. Renew. Energy 2018, 129, 806–813. [Google Scholar] [CrossRef]
  19. Hajimolana, S.A.; Hussain, M.A.; Daud, W.A.W.; Soroush, M.; Shamiri, A. Mathematical modeling of solid oxide fuel cells: A review. Renew. Sustain. Energy Rev. 2011, 15, 1893–1917. [Google Scholar] [CrossRef]
  20. Kong, W.; Li, J.; Liu, S.; Lin, Z. The influence of interconnect ribs on the performance of planar solid oxide fuel cell and formulae for optimal rib sizes. J. Power Sources 2012, 204, 106–115. [Google Scholar] [CrossRef]
  21. Aydın, Ö.; Ochiai, T.; Nakajima, H.; Kitahara, T.; Ito, K.; Ogura, Y.; Shimano, J. Mass transport limitation in inlet periphery of fuel cells: Studied on a planar solid oxide fuel cell. Int. J. Hydrogen Energy 2018, 43, 17420–17430. [Google Scholar] [CrossRef]
  22. Tseronis, K.; Fragkopoulos, I.; Bonis, I.; Theodoropoulos, C. Detailed multi-dimensional modeling of direct internal reforming solid oxide fuel cells. Fuel Cells 2016, 16, 294–312. [Google Scholar] [CrossRef] [Green Version]
  23. Yahya, A.; Rabhi, R.; Dhahri, H.; Slimi, K. Numerical simulation of heat and mass transfer in solid oxide fuel cell in presence of magnet particles deposited in cathode side. Appl. Phys. A 2018, 124, 464. [Google Scholar] [CrossRef]
  24. Barzi, Y.M.; Raoufi, A.; Lari, H. Performance analysis of a SOFC button cell using a CFD model. Int. J. Hydrogen Energy 2010, 35, 9468–9478. [Google Scholar] [CrossRef]
  25. Park, J.M.; Kim, D.Y.; Baek, J.D.; Yoon, Y.-J.; Su, P.-C.; Lee, S.H. Effect of electrolyte thickness on electrochemical reactions and thermo-fluidic characteristics inside a SOFC unit cell. Energies 2018, 11, 473. [Google Scholar] [CrossRef] [Green Version]
  26. Zeng, S.; Zhang, X.; Chen, J.S.; Li, T.; Andersson, M. Modeling of solid oxide fuel cells with optimized interconnect designs. Int. J. Heat Mass Transf. 2018, 125, 506–514. [Google Scholar] [CrossRef]
  27. Khazaee, I.; Rava, A. Numerical simulation of the performance of solid oxide fuel cell with different flow channel geometries. Energy 2017, 119, 235–244. [Google Scholar] [CrossRef]
  28. Akhtar, N.; Decent, S.P.; Loghin, D.; Kendall, K. A three-dimensional numerical model of a single-chamber solid oxide fuel cell. Int. J. Hydrogen Energy 2009, 34, 8645–8663. [Google Scholar] [CrossRef]
  29. Lee, S.; Kim, H.; Yoon, K.J.; Son, J.-W.; Lee, J.-H.; Kim, B.-K.; Choi, W.; Hong, J. The effect of fuel utilization on heat and mass transfer within solid oxide fuel cells examined by three-dimensional numerical simulations. Int. J. Heat Mass Transf. 2016, 97, 77–93. [Google Scholar] [CrossRef]
  30. Yakabe, H.; Ogiwara, T.; Hishinuma, M.; Yasuda, I. 3-D model calculation for planar SOFC. J. Power Sources 2001, 102, 144–154. [Google Scholar] [CrossRef]
  31. Milewski, J.; Świrski, K.; Santarelli, M.; Leone, P. Advanced Methods of Solid Oxide Fuel Cell Modeling; Springer: London, UK, 2011. [Google Scholar]
  32. Virkar, A.V. Low-Temperature Anode-Supported High Power Density Solid Oxide Fuel Cells with Nano-Structured Electrodes; University of Utah: Salt Lake City, UT, USA, 2000. [Google Scholar]
  33. Ma, Z. A Combined Differential and Integral Model for High Temperature Fuel Cells. Ph.D. Thesis, Georgia Institute of Technology, Atlanta, GA, USA, 2000. [Google Scholar]
  34. He, Z.; Birgersson, E.; Li, H. Reduced non-isothermal model for the planar solid oxide fuel cell and stack. Energy 2014, 70, 478–492. [Google Scholar] [CrossRef]
  35. Janardhanan, V.M.; Deutschmann, O. CFD analysis of a solid oxide fuel cell with internal reforming: Coupled interactions of transport, heterogeneous catalysis and electrochemical processes. J. Power Sources 2006, 162, 1192–1202. [Google Scholar] [CrossRef]
  36. Todd, B.; Young, J. Thermodynamic and transport properties of gases for use in solid oxide fuel cell modelling. J. Power Sources 2002, 110, 186–200. [Google Scholar] [CrossRef]
  37. Wesselingh, J.; Krishna, R. Mass Transfer in Multicomponent Mixtures; Delft University Press: Delft, The Netherlands, 2000. [Google Scholar]
  38. Liu, S.; Song, C.; Lin, Z. The effects of the interconnect rib contact resistance on the performance of planar solid oxide fuel cell stack and the rib design optimization. J. Power Sources 2008, 183, 214–225. [Google Scholar] [CrossRef]
Figure 1. Numerical solid oxide fuel cell (SOFC) model.
Energies 14 01212 g001
Figure 2. Comparison of the numerical results with those in [25,27]: (a) cell voltage versus current density and (b) power density versus current density.
Energies 14 01212 g002
Figure 3. Numerical model without the interconnect.
Energies 14 01212 g003
Figure 4. Comparison of main SOFC performance parameters.
Energies 14 01212 g004
Figure 5. Distribution of mole fractions of oxygen and hydrogen along the cathode channel: (a) model concerning interconnects and (b) model not concerning interconnects.
Energies 14 01212 g005aEnergies 14 01212 g005b
Figure 6. Comparison among the different inlet gas conditions.
Energies 14 01212 g006
Figure 7. Distribution of hydrogen mole fraction along the anode channel.
Energies 14 01212 g007
Figure 8. Distribution of oxygen mole fraction on the middle cross section: (a) mole fraction contours of oxygen and (b) mole fraction of oxygen in electrode.
Energies 14 01212 g008
Figure 9. Comparison between two cases with different ionic conductivities: (a) cell voltage and the power density and (b) current density distribution.
Energies 14 01212 g009
Table 1. Geometric and physical parameters of the model.
ParameterSymbolValue
Length of cellLcell100 (mm)
Reactant channel heighthch1 (mm)
Reactant channel widthwch2 (mm)
Interconnect heighthint2 (mm)
Cell unit widthwcell4 (mm)
Anode thicknessta0.15 (mm)
Electrolyte thicknesstel0.1 (mm)
Cathode thicknesstc0.1 (mm)
Operating pressurep01 (atm)
Operating temperatureT0800 (°C)
Table 2. Governing equations.
EquationsDomain
Electrochemical model i e l = ( σ e l e f f φ e l ) = { S c u r r e n t in   anode S c u r r e n t in   cathode
i i o = ( σ i o e f f φ i o ) = { S c u r r e n t   in   anode 0   in   electrolyte S c u r r e n t   in   cathode
Electronic and ionic current densities
E = E O C V | η a c t | η o h m η c o n c Actual potential
i l o c = i 0 [ exp ( α a F η a c t R T ) exp ( α c F η a c t R T ) ] The Butler-Volmer charge transfer kinetics equation
Mass and momentum transport ( ρ u ) = 0 Fluid flow in the gas channels,
ρ ε ( u ) u = ε p + [ μ ( ( u + ( u ) T ) 2 3 ( u ) I ) ] ε κ 1 μ u + ε F Electrodes
Species transport ( ω i ρ u ρ ω i j = 1 n D i j ( x j + ( x j ω j ) p p ) ) = 0 Material transport
Heat transfer ρ ε c p u T = ( k T ) + Q
Table 3. Operation condition, thermal conductivities, densities, and heat capacities.
ParameterSymbolValue
Operation temperature T 1073 (K)
Reference diffusivity k d 3.16 × 10⁻⁸ (m2/s)
Viscosity, fuel μ a 2.4320 × 10⁻⁵ (Pa·s)
Viscosity, oxidant μ c 4.4574 × 10⁻⁵ (Pa·s)
Diffusion volume, H2 ν H 2 7.07 × 10⁻⁶ (m3/mol)
Diffusion volume, H2O ν H 2 O 12.7 × 10⁻⁶ (m3/mol)
Diffusion volume, O2 ν O 2 16.6 × 10⁻⁶ (m3/mol)
Diffusion volume, N2 ν N 2 17.9 × 10⁻⁶ (m3/mol)
Porosity, anode and cathode ε a / c 0.4
Tortuosity, anode and cathode τ a / c 3.8
Pore size, anode and cathode r p o r e , a / c 5 × 10⁻⁷
Permeability, anode and cathode κ a / c 1.76 × 10⁻¹¹ (m2)
Thermal conductivity, anode k a 11 (W/m·K)
Thermal conductivity, cathode k c 6 (W/m·K)
Thermal conductivity, interconnect k i n t 20 (W/m·K)
Thermal conductivity, electrolyte k e l 2.7 (W/m·K)
Composition, anode Ni-YSZ
Composition, cathode LSM-YSZ
Composition, electrolyte YSZ
Composition, interconnect Stainless steel
Density, interconnect ρ int 3030 (kg/m3)
Density, electrolyte ρ e l 5160 (kg/m3)
Heat capacity, anode c p , a 450 (J/kg·K)
Heat capacity, cathode c p , c 430 (J/kg·K)
Heat capacity, electrolyte c p , e l 470 (J/kg·K)
Heat capacity, interconnect c p , int 550 (J/kg·K)
Publisher’s Note: MDPI stays neutral with regard to jurisdictional claims in published maps and institutional affiliations.

