1. Introduction
Energy in its etymological meaning denotes “activity” and it is properly defined as the capacity for taking action or working. The concept occupies an important place as an input in virtually every production process, therefore impacting economic activity and also contributing to economic development. In this light, efficient energy use means to produce at lower cost or of greater value, which implies that energy efficiency is extremely relevant in the economic analysis of growth and development. Furthermore, an important aspect of economic development is the notion of sustainability that has gained momentum in the past decade, and in this regard, energy use should be put into function of sustaining the ecosystem services that the economies depend on—that is to say, it is necessary to take care of the environment as a related area and make use of the renewable sources of energy production.
The coherent study of energy efficiency and its relationship with the environmental issues has recently enjoyed an increasing interest among researchers in the economic circles (see
Section 2 for details). In addition, the importance of energy use in the sustainability framework has been identified with the Sustainability Development Goals (SDGs) set by the United Nations in 2015 and expected to be achieved by 2030. In particular, Sustainable Development Goal 7 (SDG 7) is about “affordable and clean energy” and its mission statement has the aim to “ensure access to affordable, reliable, sustainable and modern energy for all” [
1]. Importantly, this goal has five targets—universal access to modern energy; increase global percentage of renewable energy; double the improvement in energy efficiency; promote access, technology, and investments in clean energy; and expand and upgrade energy services for developing countries—and the progress towards its achievement is measured through six indicators—access to electricity, access to clean fuels for cooking, renewable energy, energy efficiency, access and investment in clear energy, and expanding energy services for developing countries—which clearly outlines energy efficiency with reference to environment and renewable sources [
2].
Yet despite the rising popularity of the topic, we have identified a lack of economic literature dealing with it in a quantitative fashion, which has motivated us to make a step forward and contribute to its enrichment. The main goal of this paper is to examine how efficiently the developed countries use energy proxied through primary energy and electricity (secondary energy). Our secondary goal is to examine how energy efficiency is impacted when the environmental care and energy production from renewable sources are taken into account. Thence, our research interest in this paper aims to provide answers to the following four questions.
Question 1. What is the extent to which developed countries use energy (in)efficiently?
Question 2. What form of energy do developed countries use more efficiently: primary energy or electricity?
Question 3. Does the environmental care increase or decrease energy efficiency?
Question 4. Does energy produced through renewable energy capacity increase or decrease energy efficiency?
In order to answer the foregoing questions, we construct a sample of member states of the Organisation for Economic Co-operation and Development (OECD) and choose the period 2001–2018. Guided by the targets and indicators from SDG 7, we define a set of energy-related variables alongside a few other indicators as proxies for related and important areas, such as technology, urbanisation, and environment, with the aim of developing an integrated framework. We set our objective to minimise energy intensity and energy loss in view of the levels of other energy indicators as input variables. Based on our extensive review of other papers studying efficiency, we opt-in for the data envelopment analysis (DEA) framework and construct an output-oriented model to yield (in)efficiency scores on energy use. In that context, we explain why the DEA framework is a useful method applicable to examining energy efficiency and argue why scholars should seriously consider it for similar empirical analyses.
Our paper contributes to the existing literature in the following ways. Firstly, it sheds light on the quantitative side of the energy efficiency analysis with the aim of providing evidence for drawing coherent conclusions. Secondly, it makes use of derived variables that were specifically defined to capture the essence of energy use. Thirdly, this paper further extends the area of applicability of the DEA framework and its formulation can be used a starting point for future research. Fourthly, the multi-country approach allows for cross-country discussion of the results and opens up other possibilities for linking the concept of energy efficiency with other relevant areas such as economic development. All in all, our research conveys the importance of DEA on energy efficiency and the results we arrive at are beneficial from both theoretical and empirical perspectives.
The rest of the paper is structured as follows.
Section 2 reviews the related literature.
Section 3 discusses the construction of the sample, lists the data sources, and defines the variables included in the empirical analysis.
Section 4 unfolds the main trends throughout the analysed period. The DEA methodology is set up in
Section 5, while the results from the optimisation are presented and discussed in
Section 6. The paper concludes with final remarks given in
Section 7.
2. Literature Review
In this section, we review the literature related to the application of the DEA framework to energy and environmental economics. To that end, we divide the existing literature into two strands—the first one focussing on other literature reviews about the frequency of matching the DEA methodology with energy economics, and the second one reviewing literature with empirical application of the DEA models to yield concrete results regarding energy efficiency.
Of the first strand of literature, the authors of [
3] conducted a literature review on DEA in energy and environmental economics. They analysed 145 articles from two online databases—Scopus and Web of Science—in the period 2000–2018. They provide an extensive analysis of the implemented DEA model in a tabular format. Besides this, they present a distribution of DEA papers in the analysed areas of the 45 journals and they find that the
Journal of Cleaner Production has the highest number of publications (17), followed by
Sustainability (16) and
Energy (14). Furthermore, based on the distribution of papers per year, they provide a line chart and an appropriate analysis indicating that the interest of researchers in these areas has dramatically increased. In 2015, there were only 12, while in 2017, there were 14 papers. In addition, they use the papers from Web of Science to visualise the co-occurrence of the keywords. On the co-occurrent keywords figure, it can be seen that the word “efficiency” has the strongest link with the other keywords. The keywords are clustered in three clusters of their co-occurrence. In the green cluster, the keywords are efficiency, DEA, input, output, and DEA model; in the red cluster, there are China, region, energy, energy efficiency, emission, etc.; while in the blue cluster, there are productivity, economy, sustainability, eco-efficiency, environmental performance, sustainable development, and sustainability. The authors of [
4] make a literature survey on the application of data envelopment analysis in sustainability. They focus on articles in the Web of Science database and, after excluding papers that are not related to DEA in sustainability, their sample consists of 320 papers published in the period 1996 to March 2016. The distribution of papers in the period 1996–2015 is presented in a visual form, which indicates that the interest of DEA in this area has significantly increased in the last five years. The first DEA paper in sustainability is by [
5]. The authors visualise the distribution of papers in journals and they point out that, in 20 journals, approximately 48% of the papers get published. The journal
Energy Economics is in first place, followed by the
Journal of Cleaner Production and
Energy Policy. In this paper, the authors focus on citation analysis by applying three citation methods: (i) Citation chronological graph, (ii) main path analysis, and (iii) Kamada-Kawai algorithms. They find that the current key route of data envelopment analysis application in sustainability is focused on measuring eco-efficiency.
Likewise, the authors of [
6] conducted a literature review on the evaluation of energy efficiency using DEA. They focus on recent publications, i.e., the period from 2011 to 2019, and analyse 281 papers from the Web of Science database. According to the distribution of papers per year, the visualised data in a bar chart demonstrate that there is a gradual increase over years and the highest number of papers (61) was in 2019. They present a tree map with the number of publications across journals, with
Energy Economics assuming the leading role with 26 papers, followed by
Sustainability with 25 papers and
Energy with 22 papers. In order to visualise the keywords and their context evolution in the analysed period, they use Citespace. Accordingly, they present a figure from which it can be seen that DEA models are enriched in order to enable a better evaluation of energy efficiency and, besides the theory enrichment, there are several DEA applications. Models that are used in the analysed papers range from traditional as CCR and BCC to SBM models, from using one output to inclusion of output that is undesirable, and from a static to a network structure. The data refer to countries, regions, industries, and companies, and most of the studies use regions as DMUs. When data envelopment analysis is used to measure the total factor energy efficiency (TFEE), energy, capital, and labour are taken as inputs, GDP is expected output, and carbon emissions are the undesirable output.
Another systematic review on studies that assess the performance of renewable energy using the DEA framework was done by [
7]. They search studies in Science Direct, SCOPUS, and Google Scholar, and implement the Preferred Reporting Items for Systematic Reviews and Meta-Analyses (PRISMA) statement. By analysing 72 scholarly articles, they provide visual presentation of the distribution of these studies, from which it can be noted that the first study was published in 2001 (Ramanathan, 2001) and the peak (14 studies) was achieved in 2017. The studies are categorised according to seven technologies: Renewable energy, solar energy, wind energy, municipal solid waste, biomass, hydropower, and other renewable energies (biogas, biofuel, and geothermal). Based on the chart of the distribution of studies in the identified areas, the renewable energy has the highest percentage (43.06%), followed by solar energy (15.28%), and wind energy and municipal solid waste (both with 13.89%). They provide tabular representation of DEA studies for each of the identified renewable energy technologies with focus on authors and year, scope, duration, methodology, and references. In addition, they present a distribution of the studies according to the employed DEA method from which it can be noted that a two-stage DEA model is applied in 28 studies, a traditional DEA model is applied in 18 studies, a three-stage DEA model in 8 studies, a DEA model with special data in 5 studies, an extended DEA model in 4 studies, and a Slack-based model and a Malmquist model are applied in 3 studies.
The DEA class of methods is particularly recommended for in-depth analysis of energy efficiency. [
8] provide a comprehensive literature review on DEA models applied to energy efficiency. They use the PRISMA statement in order to identify and select the proper papers. They identify 144 papers in the period from 2006 to 2015, published in 45 journals and indexed in the Web of Science database. In the first year of the analysed period, only one paper was identified but the interest of researchers in energy efficiency has grown over the years and, from 2013 to 2014, the number of papers has increased from 20 to 42. In the journal
Energy Policy, 17.36% of the articles get published, followed by the journals
Renewable and Sustainable Energy Review and
Energy with 19 and 13 papers, respectively. According to expert opinions, all papers are classified in 9 areas so that energy efficiency issues is the area with highest number of papers (35), followed by the other application areas (25 papers) and environmental efficiency as well as renewable and sustainable energy (each with 23 papers), while the water efficiency is an area that has the least number of papers (4). The authors provide detailed tabular format for the distribution of the papers in each of the areas that consists of author(s) and year, scope, duration, application, purpose of the study, and results and outcome. In addition, they provide distribution of papers regarding the nationality of the authors in a tabular format. They have identified 29 nationalities and countries, with China on the top in terms of the number of published papers on energy efficiency (44 papers), followed by Iran (18 papers), USA (9 papers), Taiwan, Spain, and Korea (each with 8 papers). Finally, a recent literature review made by [
9] shows that there are 10,300 DEA-related publications in journals over the period 1978–2016. The authors have listed the top 20 journals where 2974 articles employing the DEA framework were published. In the list,
Energy Policy ranks in 10th place with 94 articles followed by
The Journal of Cleaner Production in 14th place with 71 articles and
Energy Economics in 15th place with 69 articles. Additionally, they present the 50 most used keywords in a tabular format with “energy efficiency” being in the 18th place (in 286 articles) and “sustainable development” in the 44th place (in 151 articles). The analysis does also reveal that the most popular research keywords that appeared in DEA-related articles in 2015 and 2016 were: Eco-efficiency, undesirable outputs, directional distance function (DDF), environmental efficiency, carbon dioxide emissions, sustainable development, sustainability, and environmental protection.
Of the second strand of literature, the authors [
10] conduct a study that focusses on the energy trend in the world and consequently describe how the DEA as a non-parametric approach for measuring efficiency can be applied to the energy industries. The energy is categorised as primary and secondary. The primary energy consists of fossil-fuel energy (oil, natural gas, and coal) and non-fossil energy (renewable and nuclear), while the secondary energy refers to electricity. The authors use charts to present the energy trends in the world for the main categories of energy and their sub-categories. They present formulations for using DEA for the fossil and non-fossil energy.
Furthermore, the authors of [
11] evaluate the efficiency of energy consumption in the manufacturing as main industrial sector in China with panel data for the period 2004–2014 by applying the non-parametric DEA methodology. The DEA model is constructed by using piecewise linear utility function. In the DEA model, one output indicator (energy consumption intensity) and five input indicators (competition within industries, technological Progress, energy consumption structure, opening up, environmental regulations, and energy efficiency policy) are used. The energy efficiency policy is an environmental indicator and is considered as both quantitative and qualitative indicator, so two DEA models are developed accordingly. One model considers only the quantitative environmental regulations, while the other integrates the quantitative and qualitative environmental regulations. Based on the comparison of the obtained results (with and without energy policy), it was found that low energy policy encourages the development of high energy-consumption industries, while its impact on the development of low or moderate energy-consumption industries is low.
Wier et al., 2005 [
12] evaluate the environmental performance of Danish product and household types by using the DEA methodology. Based on the overall score for environmental performance, they find that middle-income families living in houses, which represent a large proportion of all Danish families, are characterised by the least environmentally friendly consumer basket. In contrast, those families that live in urban flats are characterised by the most environmentally friendly consumer basket.
An interesting approach for environmental assessment with focus on corporate sustainability by employing DEA is proposed by [
13]. They use 153 observations on S&P 500 corporations in 2012 and 2013. The empirical data are from 7 US industries (consumer discretionary, consumer staples, energy, healthcare, industrials, information technology and materials). The following variables are taken into account: Estimated annual CO
2 saving and return on assets as desirable outputs; direct and indirect CO
2 emissions as undesirable outputs; and number of employees, working capital and total assets as inputs. Their approach provides an answer to the question of which technology innovation should be selected to reduce the undesirable output (CO
2 emissions). They find that, amongst the seven industries, the energy sector is the best one to invest in technology in order to achieve corporate sustainability.
Lastly, the authors of [
14] propose a new approach that deals with the difficulties—theoretical and empirical—of the DEA framework for environmental assessment. The DEA environmental assessment can be applied to measure the performance of decision-making units (DMUs) that use inputs and produce desirable but also undesirable outputs. For example, desirable output is electricity, while undesirable output is the amount of CO
2 emissions. The authors propose a solution to four difficulties arising from the application of the DEA environmental assessment. They are disposability concepts, disposability unification, undesirable and desirable congestion, and values that are zero or negative.
4. Main Trends
4.1. Descriptive Statistics
Descriptive statistics are reported in
Appendix B where
Table A2 reports the summary statistics for all countries over the entire period and
Table A3 and
Table A4 contain the country means over the entire period. Given that the values of the energy-related variables differ significantly from one to another country and yield outlying results, we calculate weighted means as well as weighted standard deviations for these indicators. The time evolution of the variables can be discerned from
Figure A1 and
Figure A2 in
Appendix C.
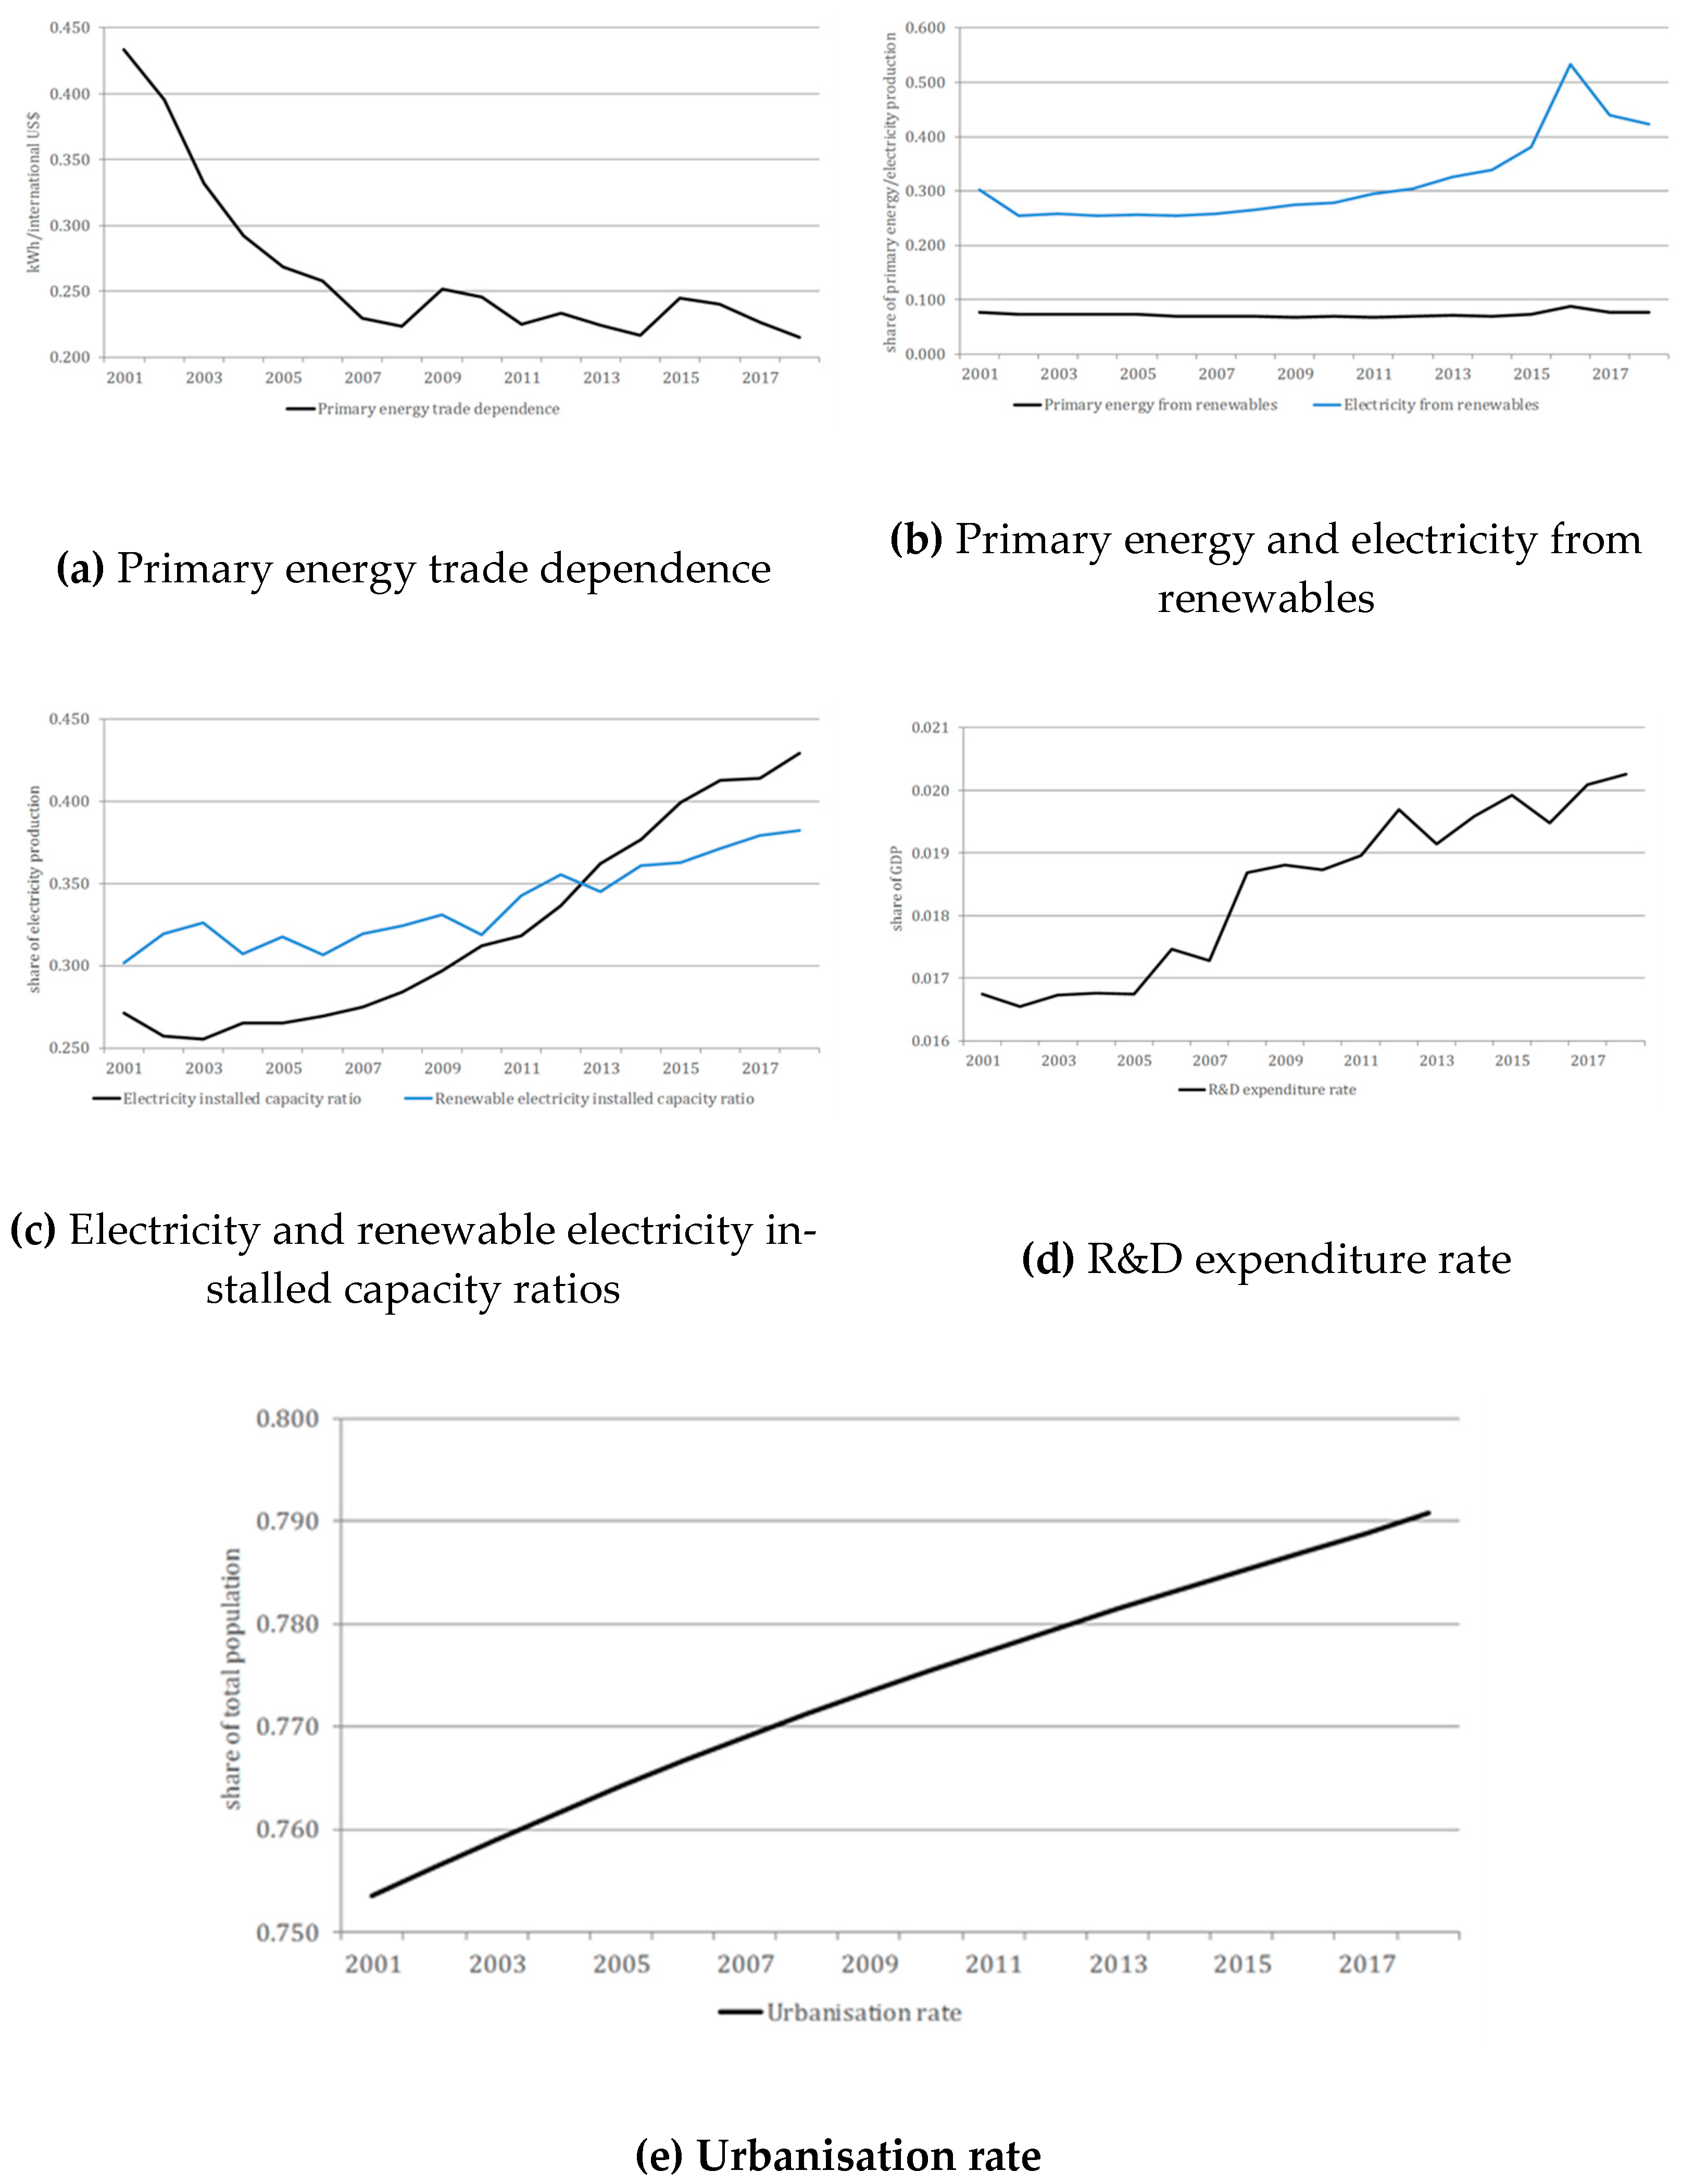
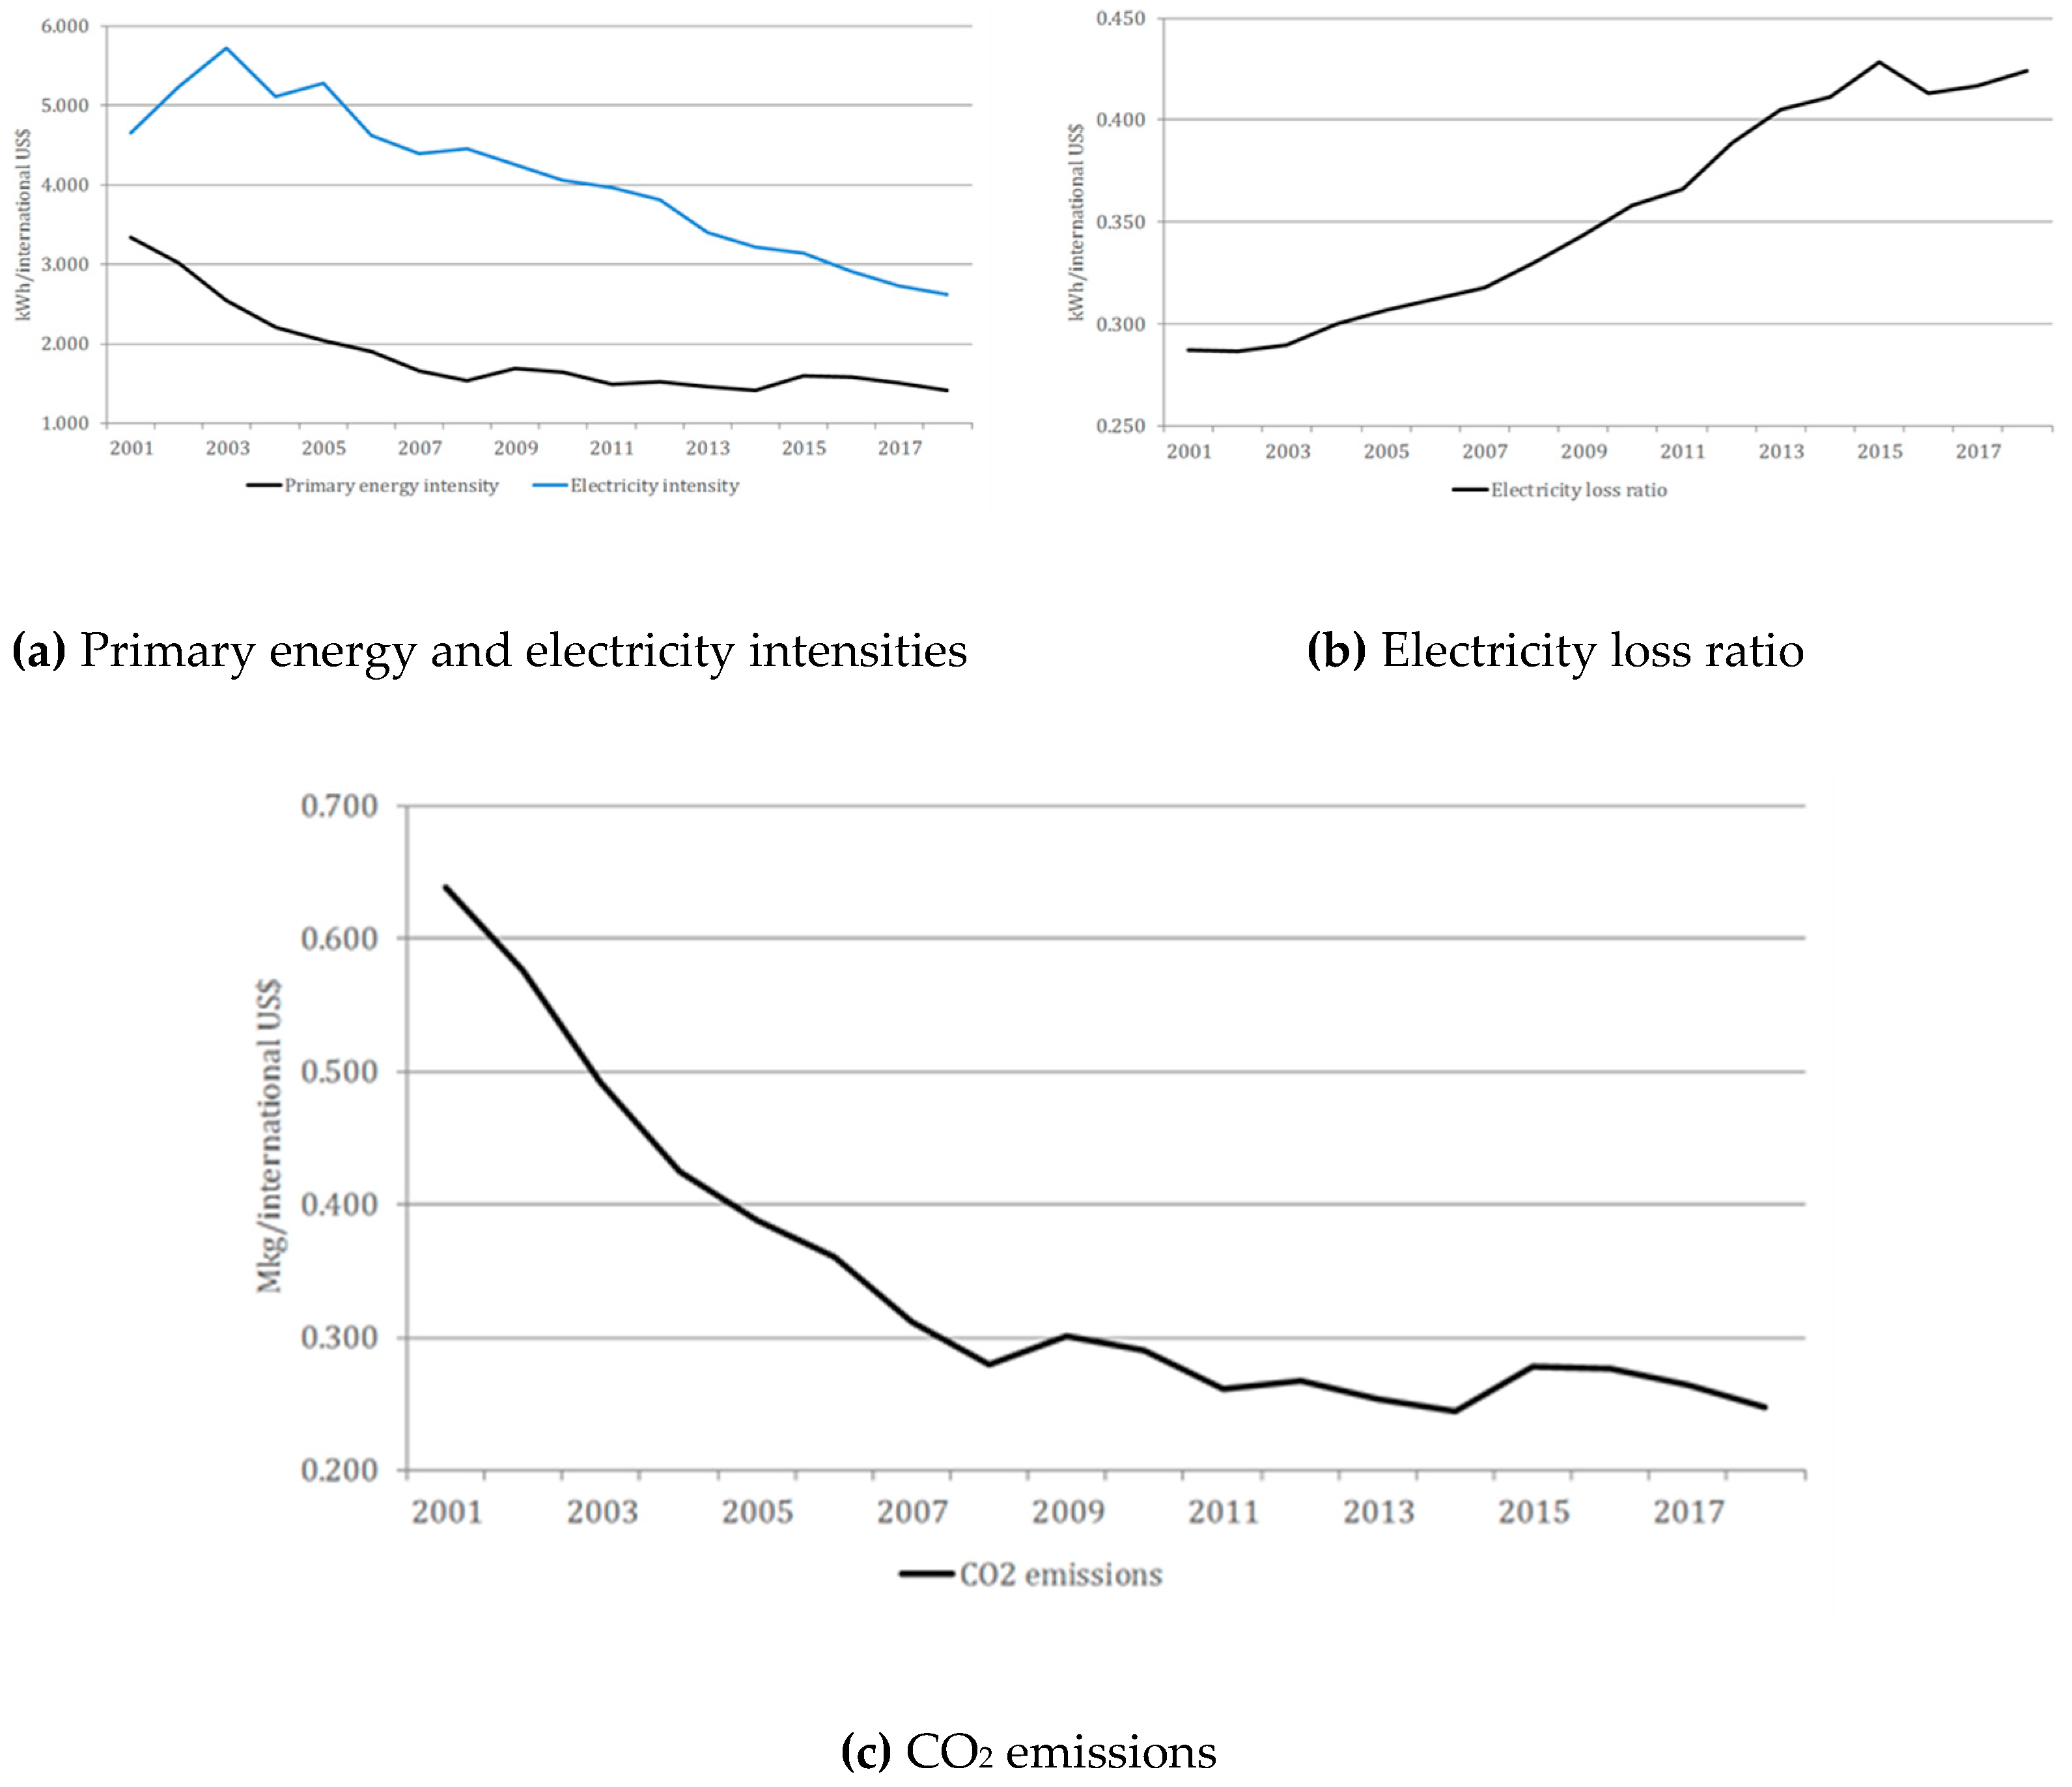
The mean value for primary energy intensity is 1.643, meaning that 1.643 kWh are needed to generate an output of 1 US$ across the analysed countries on average. Czech Republic, Slovakia, Iceland, Poland, and Canada are countries with the highest intensities, in all above 3, while Switzerland, Ireland, and Denmark record the lowest intensities, in all below 1 on average. The general trend is that the inefficiency measured through this variable is steadily decreasing over time—namely, from 3.331 in 2001 to 1.421 in 2018. The mean electricity intensity is several times lower and equals 0.222. All countries have average intensities below 0.5, except for Iceland, which stands out with 0.866 and is the only country that has attained intensity above 1 in some years. Again, the inefficiency measured through this variable follows a downward trend and it went down from 0.433 in 2001 to 0.215 in 2018. In regard to the electricity loss ratio, the quantity of energy that remains unused is around 6.4% on average across countries. Only Turkey, Mexico, Luxembourg, and Hungary have mean amount of unused energy above 10%. Unlike the previous two measures of inefficiency, this one has remained fairly constant around 7% on average throughout the entire period.
Trade dependence has a moderate weighted mean index value of 0.405, indicating that countries need to trade primary energy of about 40.5% of the produced amount in order to fill the production-consumption gap. Countries that are the most independent of trading primary energy are Denmark (18.2%), Mexico (20.4%), and United States (27.3%), while countries that depend the most on the trade are Luxembourg and Ireland whose traded amounts of primary energy are 62 and 10 times the quantity they produce, respectively. The evidence is conclusive that the trade dependence across countries reduces over time, being more than two times lower in 2018 than the peak achieved in 2003.
Primary energy produced from renewable sources accounts for 13.9% on average across countries with a standard deviation of 13.1%. Iceland, Luxembourg, and Portugal are countries with full production from renewables, while Australia, Mexico, and Poland generate less than 5% of their primary energy from these sources. Likewise, the share of electricity generated from renewables amounts to 20.1% with higher standard deviation of 18.8%. The only country that fully produces electricity from renewables throughout the entire period is Iceland and Norway follows closely with about 98.8%. However, it is worth noting that Luxembourg has had full electricity generation from renewables since 2016 but because of the lower share in the previous years, its average share is only 32.4%. The shares of both primary energy and electricity produced from renewable sources tend to move upwards as time goes by and have ramped up from less than 30% in the early 2000s to more than 40% in the 2010s.
The installed electricity capacity averages around 25.7% of the total electricity production, ranging from 16.5% in Iceland to 170.4% in Luxembourg. Yet this large difference between the two countries, most countries have fairly equal installed capacity in the interval from 20 to 30%, which can be further confirmed by the standard deviation of only 4.6%. With respect to the installed capacity for generating electricity from renewables, it averages around 30.3% and is highest in Greece with 56.3% and South Korea with 48.4%. Both capacity measures follow upward movements from year to year.
Of the variables proxying for the related areas, it is worth noting that countries spend about 1.8% of GDP on research and development on average, being slightly higher in the end years compared to the start years of the analysed period. The share ranges from 0.7% in Greece, Slovakia, and Turkey to 3.3% in Finland, South Korea, and Sweden. Next, the mean carbon dioxide emissions amount to 0.342 Mkg per 1US$, with lowest average emissions of 0.088 Mkg/US$ in Switzerland and highest of 0.837 Mkg/US$ in Poland. CO2 emissions had a downward-sloping curve in the 2000s, but it eventually flattened out in the 2010s. Finally, the average level of urbanisation across the sampled countries equals 0.774, indicating that 77.4 of the total population inhabits urban areas, and it tends to go slightly up over time.
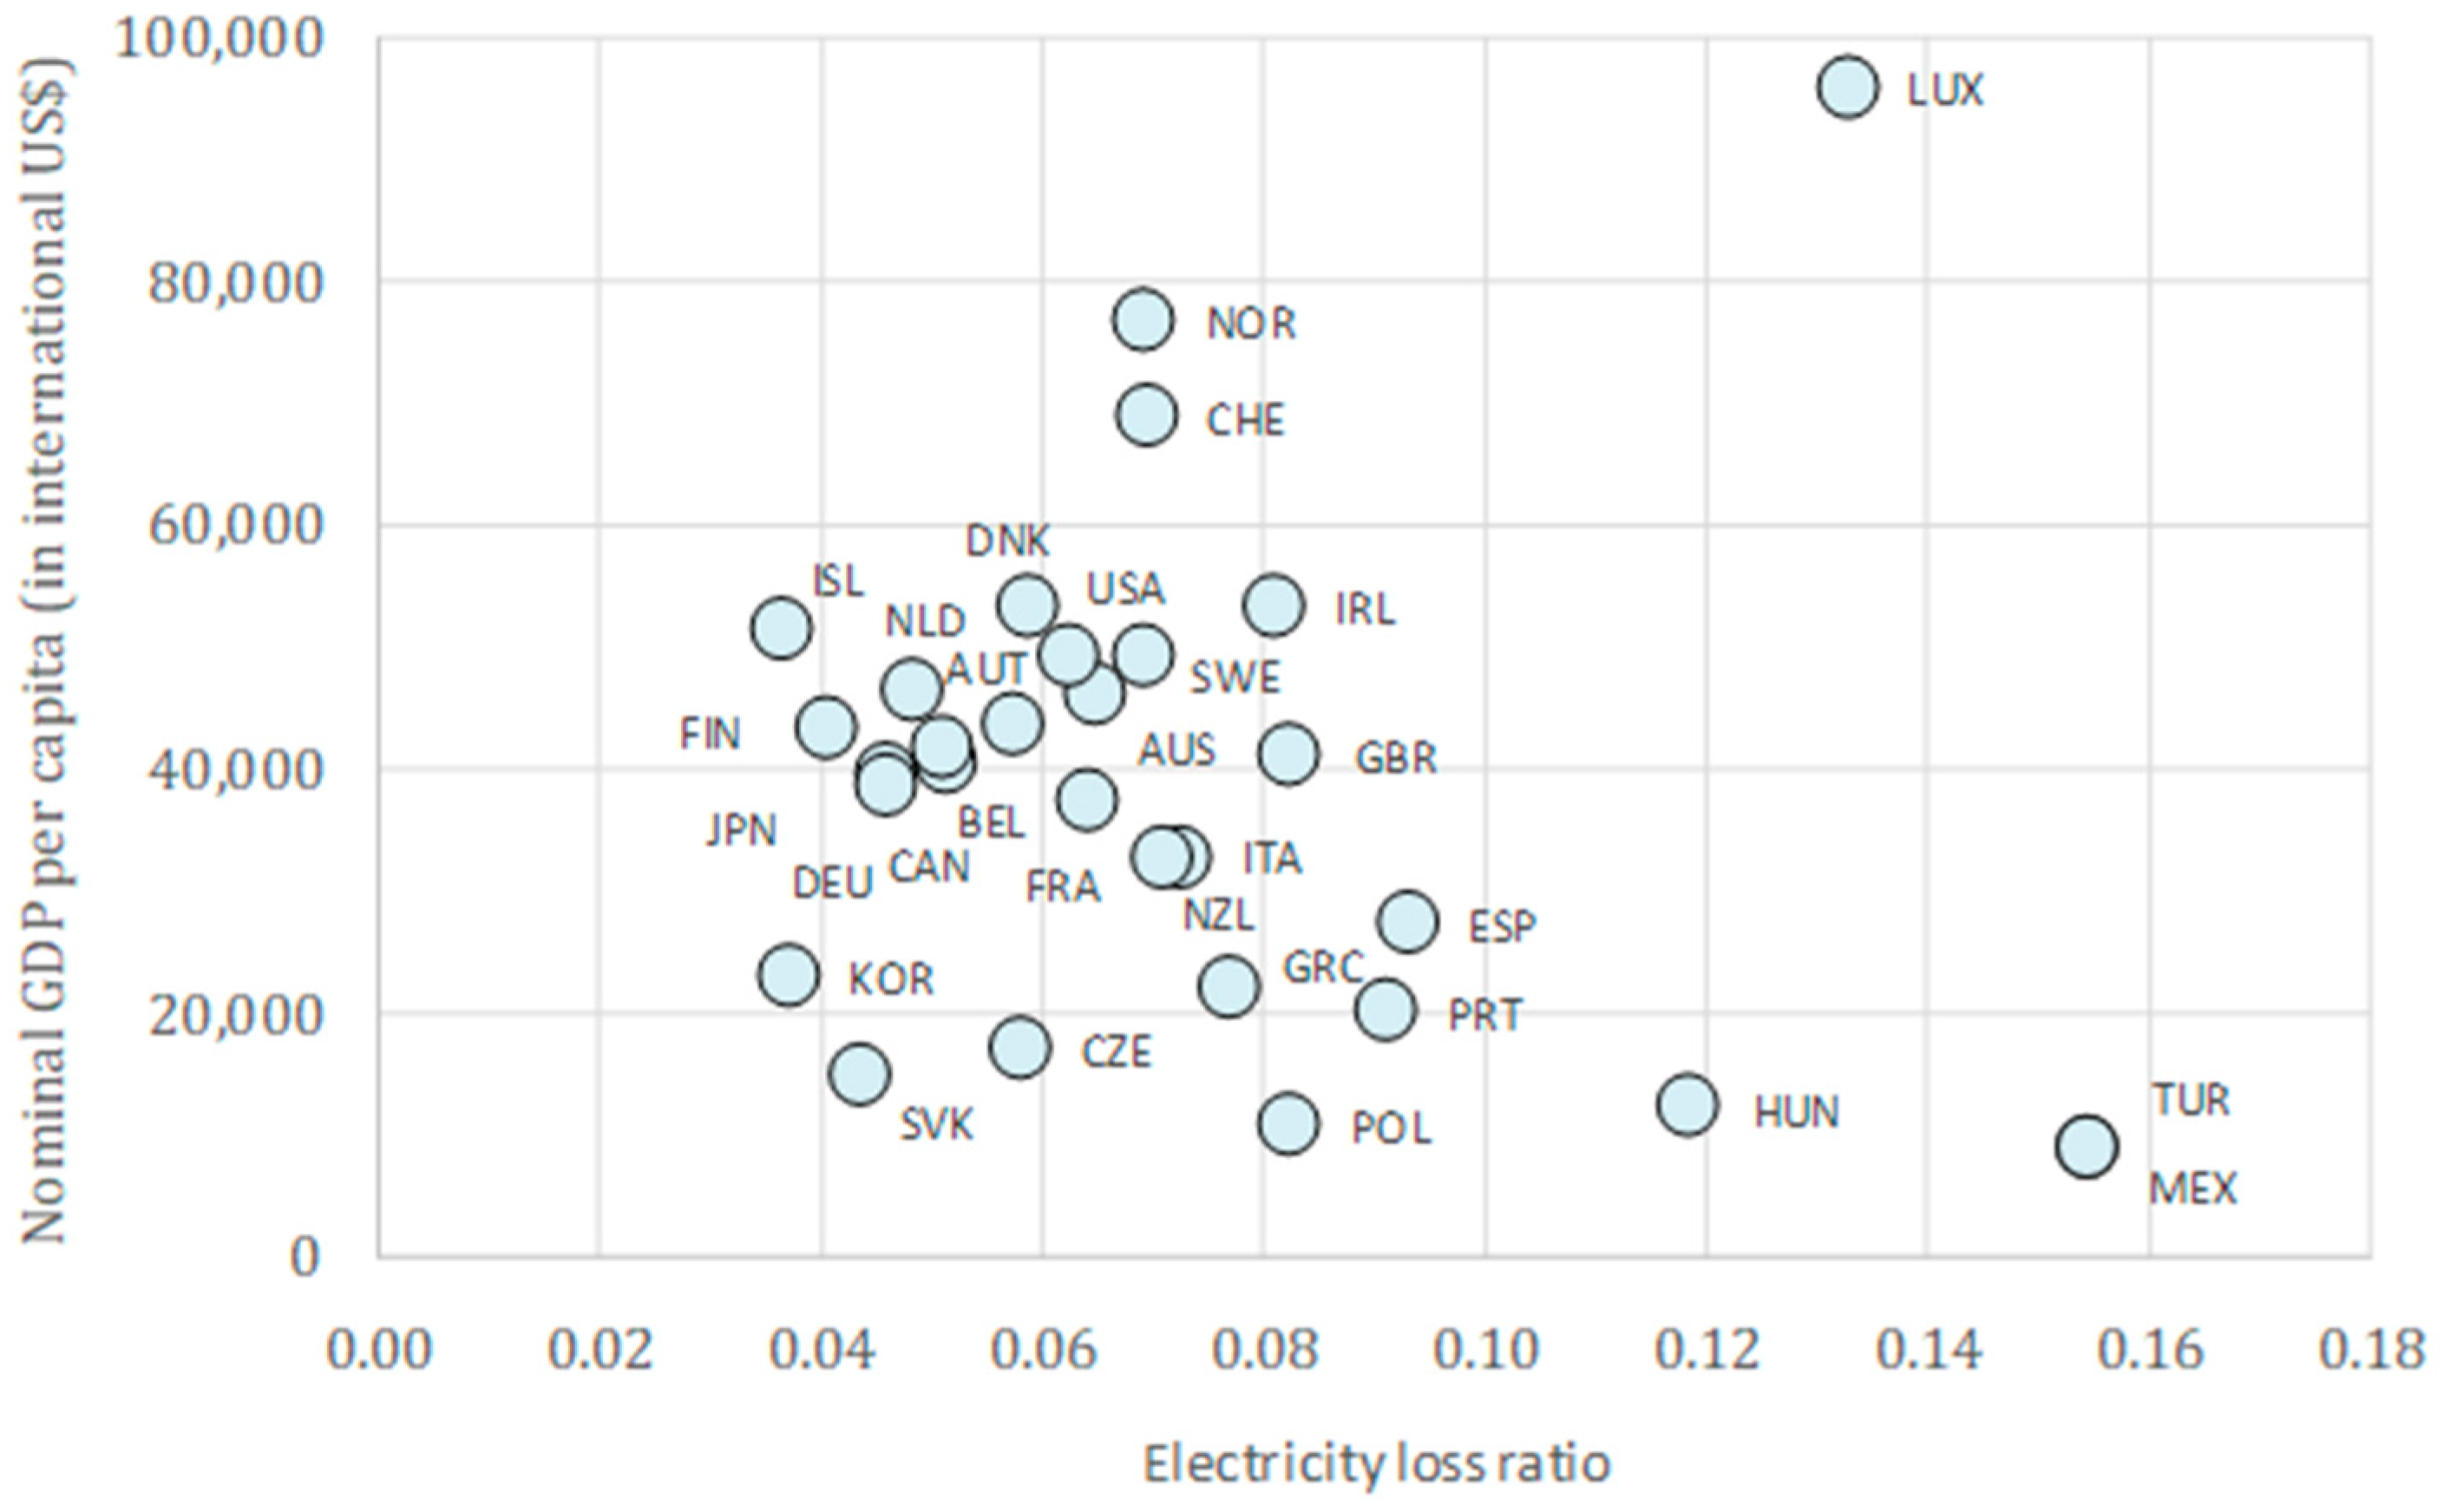
4.2. Energy Use and Economic Development
In this section, we study energy use across countries as measured through the energy output variables with respect to their economic development as proxied by the nominal GDP per capita (see
Figure A3,
Figure A4 and
Figure A5 of
Appendix D).
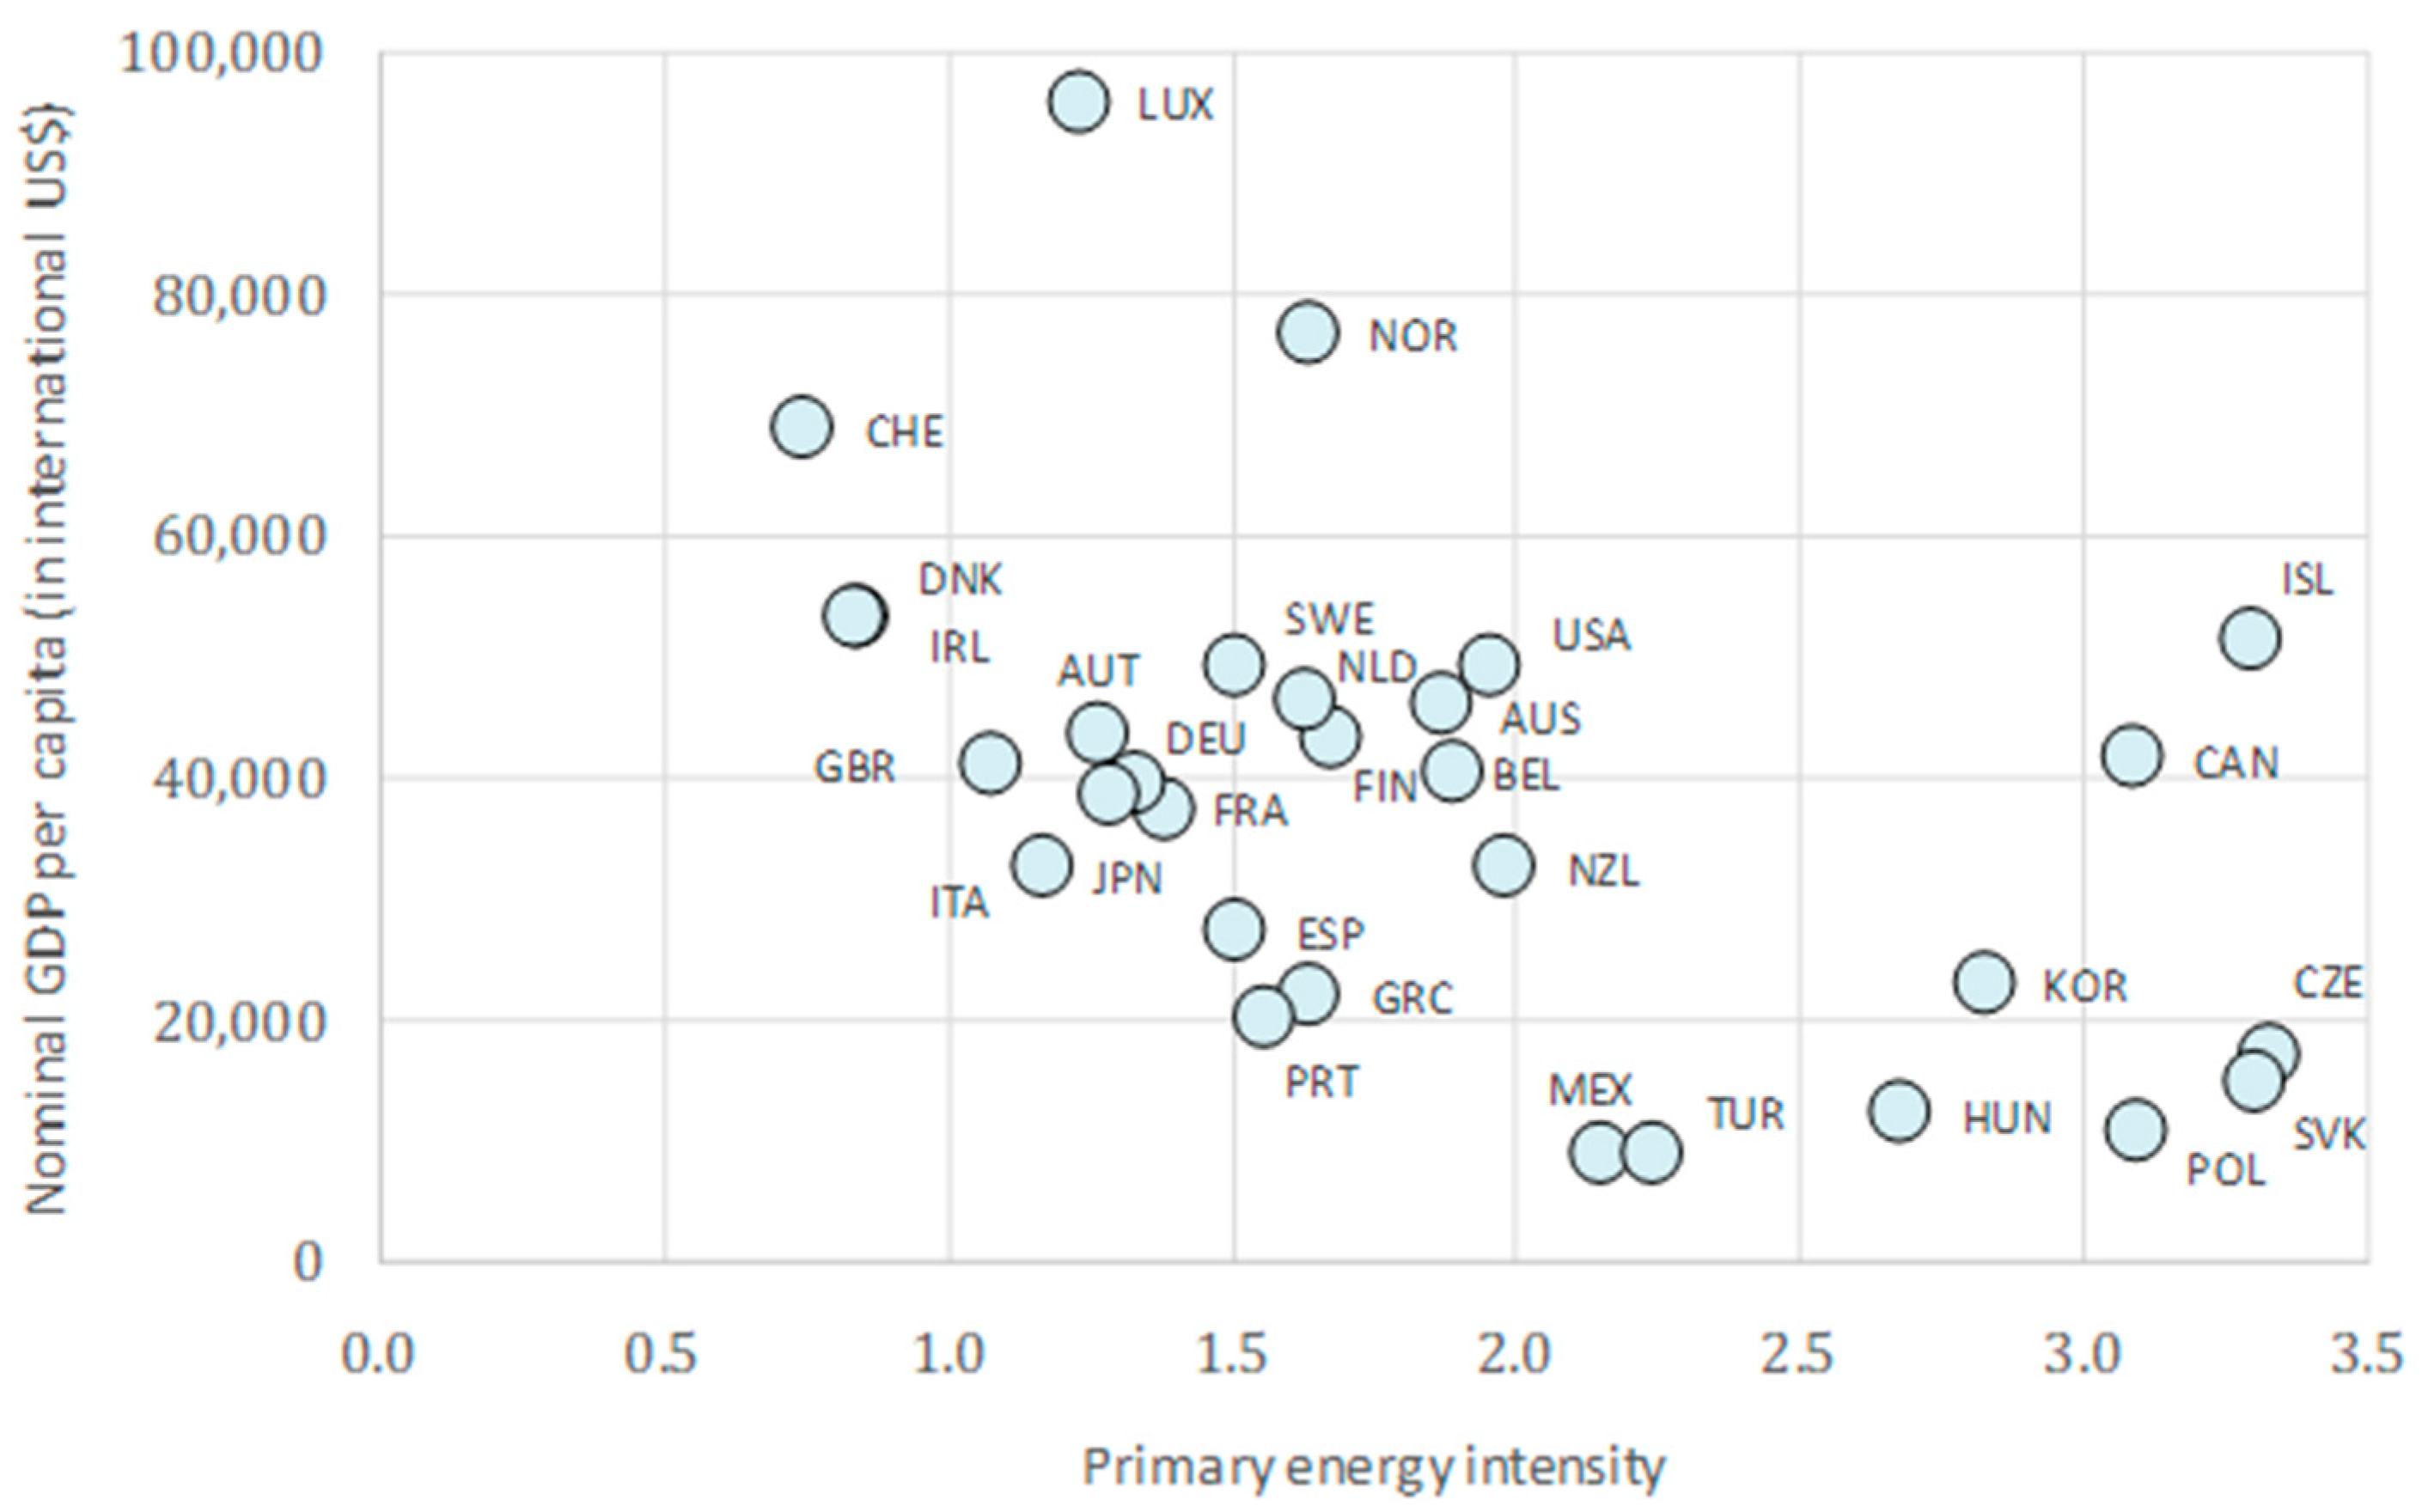
The correlation coefficients for all three output variables—primary energy intensity, electricity intensity, and electricity loss ratio—with the nominal GDP per capita are negative, which indicates that, in general, countries with higher economic development tend to use energy in a more efficient manner.
Primary energy intensity has a moderate to strong negative correlation coefficient of −0.53. Most countries with average GDP per capita between 20,000 to 50,000 US$ are clustered with intensity values between 1.0 and 2.0, while the intensity of all six countries with GDP per capita lower than 20,000 US$ exceeds 2.0. Countries that stand out and, at the same time, record high GDP per capita and high intensity above 3.0 are Iceland and Canada.
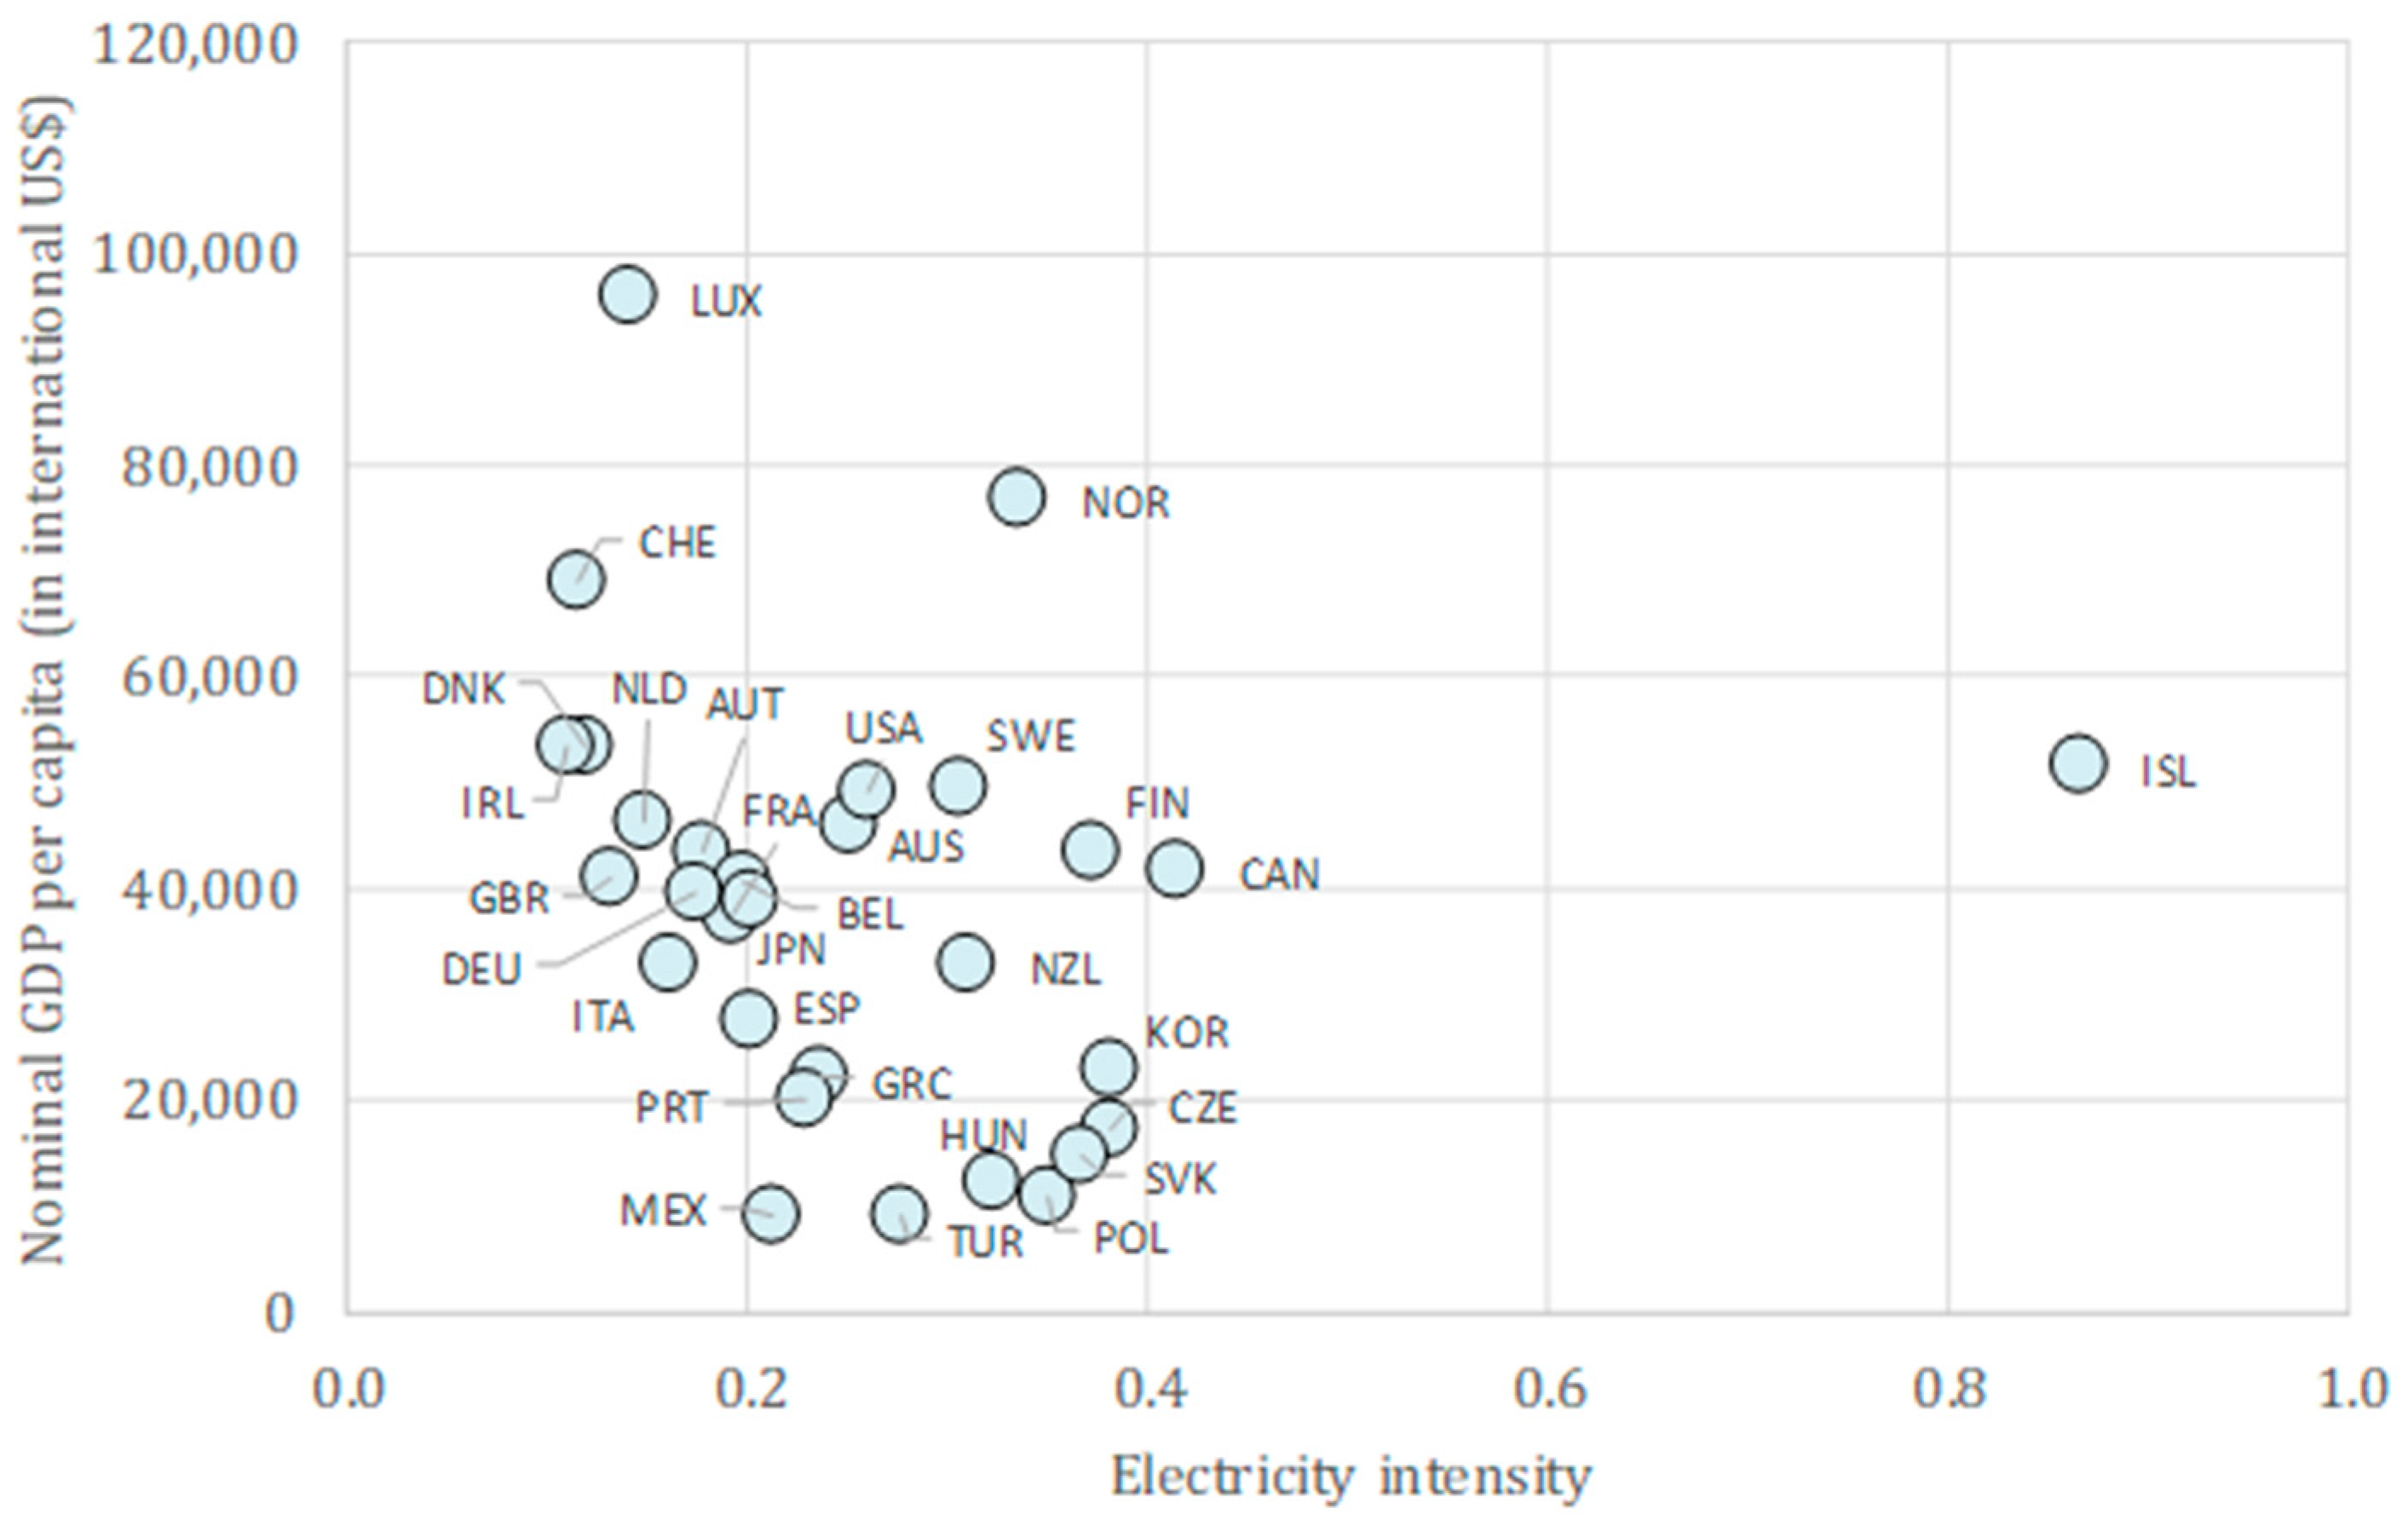
Electricity intensity and nominal GDP per capita have weak negative correlation coefficient of −0.27. Almost all countries are scattered in a cluster with intensity values between 0.1 and 0.4. Countries standing out of the cluster and hinting to a negative direction are Luxembourg, Norway, Switzerland, and Iceland. The last one, albeit with a very high GDP per capita, has electricity intensity that is more than two times that of the next country.
Electricity loss ratio has very weak negative correlation coefficient of −0.10. Countries are scattered with no visible direction and similar loss ratios in the interval from about 3 to 9% are associated with different levels of GDP per capita. Hungary, Turkey, and Mexico point out to a negative direction with loss ratios above 10% but this tendency is well off-set by Luxembourg as a country with the highest GDP per capita and second highest loss ratio.
At first glance, these findings seem to somewhat contradict the popular view that countries with higher energy intensity are economically more developed with high-intensity industrial production, while those with lower energy intensity are developing countries with labour-intensive economies. Nonetheless, it has to be to noted that even though countries differ significantly in terms of economic development, OECD consists of relatively well-developed economies where countries with the least GDP per capita have still much more advanced economies than the developing world. Thence, it can properly be concluded that the negative direction does not imply that the industrialised economies attain more efficient energy use than the labour-intensive ones but that, amongst the industrialised ones, those with higher GDP per capita usually perform better.
5. Methodology
The main goal of our empirical analysis is to get efficiency scores with regards to the energy efficiency indicators for each country over the analysed period. Since we aim to employ energy-related indicators as both output and input variables and enrich the analysis with other variables capturing technology and urbanisation as input variables, we find it convenient to follow the efficiency literature [
23] and implement the data envelopment analysis (DEA) using DMUs.
DEA was introduced in empirical economics by [
24,
25]. It is a non-parametric technique that, through linear programming, approximates the true but unknown technology without imposing any restriction on the sample distribution. Its main advantage over the parametric methodologies is that it does not require functional assumptions for efficiency assessment [
26]. The authors of [
27] also identify the following technical advantages compared to the parametric methods: (i) It is not necessary to find out the concrete form of production function and is with less restrictions; (ii) it is easier to deal with the case with multiple inputs and multiple outputs; (iii) the technological efficiency analysis enables the enterprises to find out which input is not efficiently utilised and to look for the best way to improve efficiency in addition to knowing the input efficiency of the evaluated structure in question compared to the most outstanding enterprises; and iv) the non-parameter approach allows not only to arrive at a conclusion about the technological efficiency but also to calculate the economic efficiency, allocation efficiency, and pure technology efficiency, which makes it possible to conduct an inclusive evaluation and should be regarded as a comprehensive assessment index of achievements. In fact, DEA is a complex benchmarking technique that yields production possibilities where efficient multi-criteria DMUs positioned on this surface shape the frontier [
28]. The identified benchmarks for each inefficient unit should serve as a “soft target” because some of them may have an advantage that the inefficient one could not replicate [
29].
There are several assumptions that we find it necessary to establish before moving on to the optimisation problem that we are going to solve. They are presented in turn.
Assumption 1 (Linearity). The objective function in the optimisation using DEA is linear.
This assumption implies that the optimisation is done using a linear programming technique. However, this may be problematic in practice because the objective function and the constraints are expressed as fractions and they are thus non-linear, which requires the optimisation problem to be formulated in a linear form.
Assumption 2 (Non-negativity). The values of the inputs and outputs as well as the weights are non-negative, i.e., .
Non-negativity means that the selected variables as inputs and outputs cannot take any negative values or, alternatively, need to undergo a procedure that will allow them to be included in the analysis with non-negative values.
Assumption 3 (Convexity constraint). The weights sum up to 1, i.e., .
The convexity constraint is the main feature that distinguishes the BCC DEA from the CCR DEA and assumes that the model accounts for variable returns to scale (VRS) instead of constant returns to scale (CRS).
As lower values of the energy indicators that we use as outputs indicate efficiency, we set up a minimisation output-oriented model with an objective function
where
is the set of
inputs,
is the set of
outputs,
are the intensity weights for the linear combination of the sampled countries and
denotes the efficiency score. The constraint in (4) results directly from Assumption 3, while the constraints in (5) and (6) illustrate Assumption 2.
At the end, we consult [
27] and introduce two definitions as necessary pre-conditions to achieve relative DEA-efficiency.
Definition 1. If the optimal program satisfies , then is weakly DEA-efficient.
This definition states that is the efficient score that can be obtained from the optimisation. In other words, this means that a weakly DEA-efficient when lies on the DEA frontier. In case , then the is an inefficiency margin, which reveals by how much the output level should be improved at the given inputs to reach efficiency.
Definition 2. If the optimal program satisfies Definition 1 and Assumption 2 holds, then is relatively DEA-efficient.
The importance of Definition 2 is that it gives conditions that should be satisfied in order to reach a stronger form of DEA-efficiency.
6. Results and Discussion
This section reports and discuss the results obtained in the empirical analysis.
6.1. Baseline Models
We develop separate models for primary energy and electricity as the two forms of energy that are subject to examination in our empirical analysis. In the baseline DEA model for primary energy, we employ primary energy trade dependence, primary energy from renewables, R&D expenditure, and urbanisation rate as input variables and primary energy intensity as the only output variable. In the case for electricity, our baseline DEA model includes electricity from renewables, electricity installed capacity ratio, R&D expenditure, and urbanisation rate as input variables, and electricity intensity as well as electricity loss ratio as output variables. We run two versions of this model—the first one with the electricity installed capacity ratio and the second one with the renewable electricity installed capacity ratio. Given the discrepancies in the values of the variables from year to year as well as the missing values for R&D expenditure, we calibrate the model with the country averages over the entire period. The inefficiency margins from the baseline models are presented in Columns 1, 3 and 5 of
Table A5 in
Appendix E.
The average inefficiency margin minimising primary energy intensity is 16.1%, indicating that there is room for further reduction while keeping all inputs unchanged. Seven of the sampled countries, namely Australia, Canada, Czech Republic, Denmark, Mexico, Poland, and Slovakia, are relatively DEA-efficient with DMUs on the frontier, whereas Belgium, Japan, Luxembourg, Finland, and Spain are farthest from the frontier with inefficiency scores above 30%. It is tempting to conclude that the first group of countries performs better than the second group where a mismatch of the inputs to produce optimal output has been established but the results unfold an opportunity for the countries from the second group to make new decisions with little effort to yield better output. Literally speaking, being on the DEA frontier means that all possibilities to use the current inputs to produce better output have been exploited and the only way to make an improvement is to better the input levels. For example, the finding that Canada is on the frontier means that it has already absorbed all possibilities to reduce primary energy intensity as a target output given the values of its input variables and no re-allocation with constant inputs would make any change. This implies that the country has to make improvements in the areas measured through its inputs in order to further reduce primary energy intensity. On the other hand, the inefficiency score of 37.8% for Luxembourg indicates that the country could reduce primary energy intensity by this rate through re-allocation efforts under constant inputs. Nevertheless, the re-allocation efforts that could increase efficiency are usually met by constraints of other nature, thus posing practical difficulties to achieving higher efficiency level.
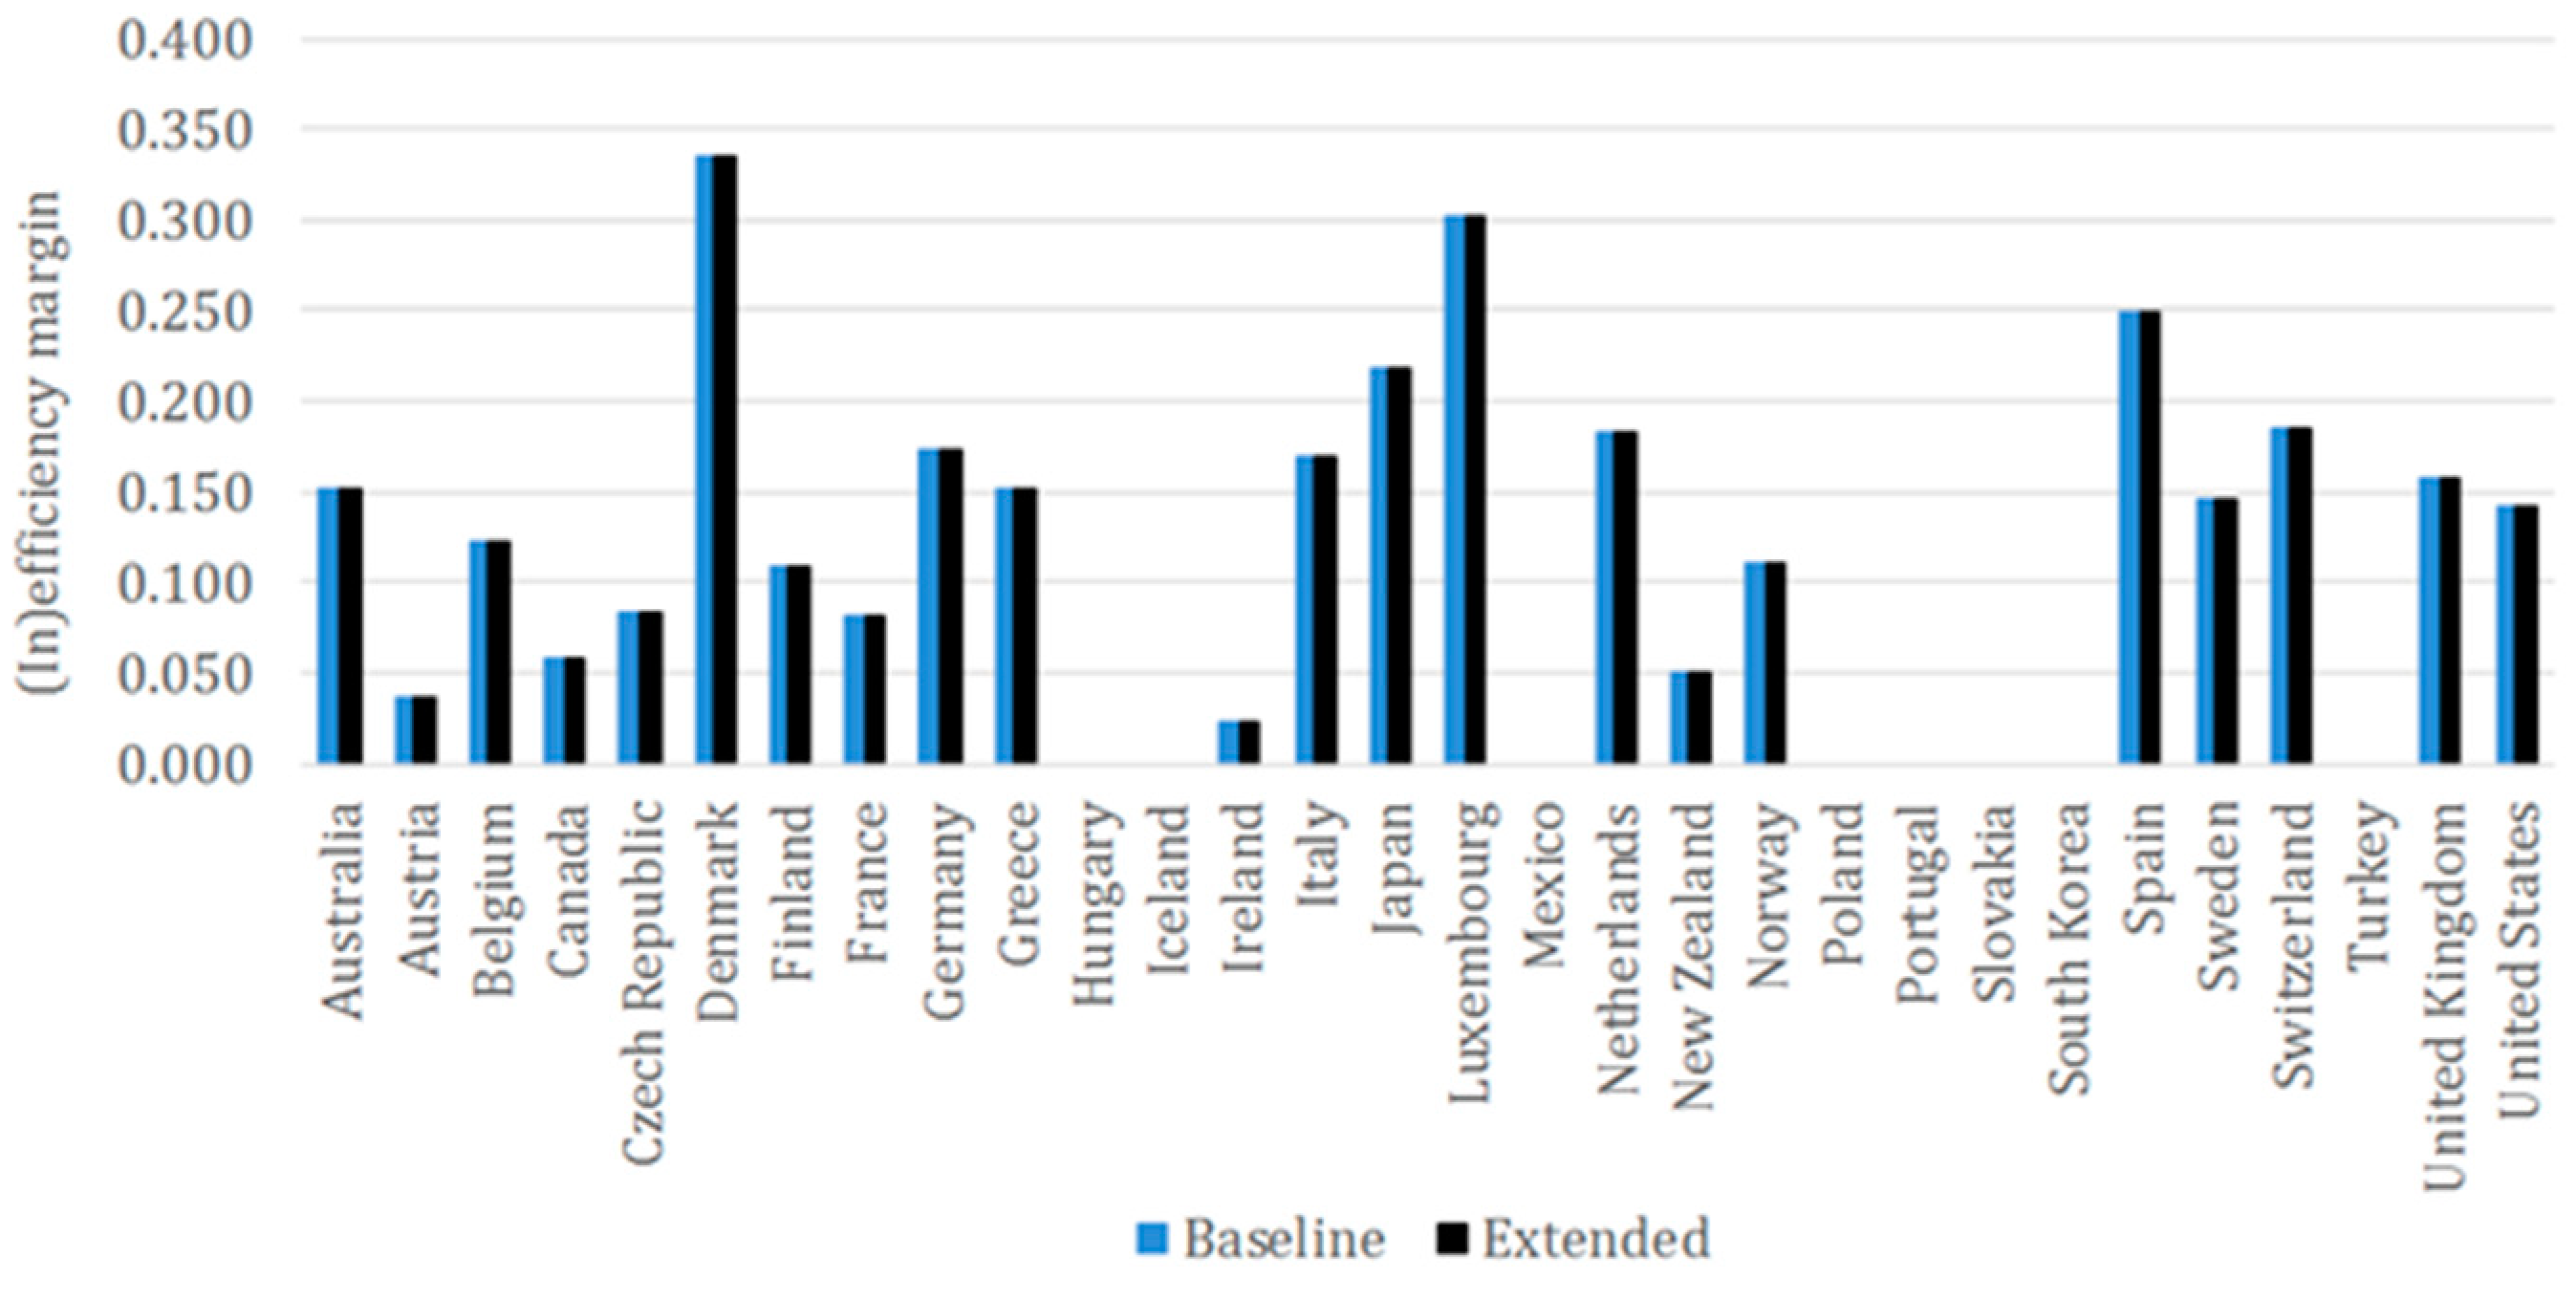
In the model where the objective is to minimise electricity intensity and electricity capacity is used as an input, the average inefficiency score is lower and equals to 10.8%. This finding reveals that countries make more efficient decisions regarding electricity use, which can be explained through the fact that primary energy is a complex grouping of various forms of energy that is much more difficult to deal with than electricity. In total, eight countries lie on the frontier in this set-up, whereas Denmark and Luxembourg score the highest inefficiency margins, both above 30%. Though Mexico, Poland, and Slovakia are again on the DEA frontier, it is worth noting that there are significant differences across countries compared to the case with primary energy, which further supports the notion that managing primary energy is very different from managing electricity. For instance, Belgium, which had an inefficiency of 39.8%, now scores an inefficiency of 12.2% and South Korea, whose inefficiency margin was 22.3%, is on the frontier in this set-up. However, there are also examples with change in the opposite direction. United States scored an inefficiency of 7.6% while optimising primary energy intensity and its inefficiency with respect to the electricity intensity has almost doubled to 14.2%.
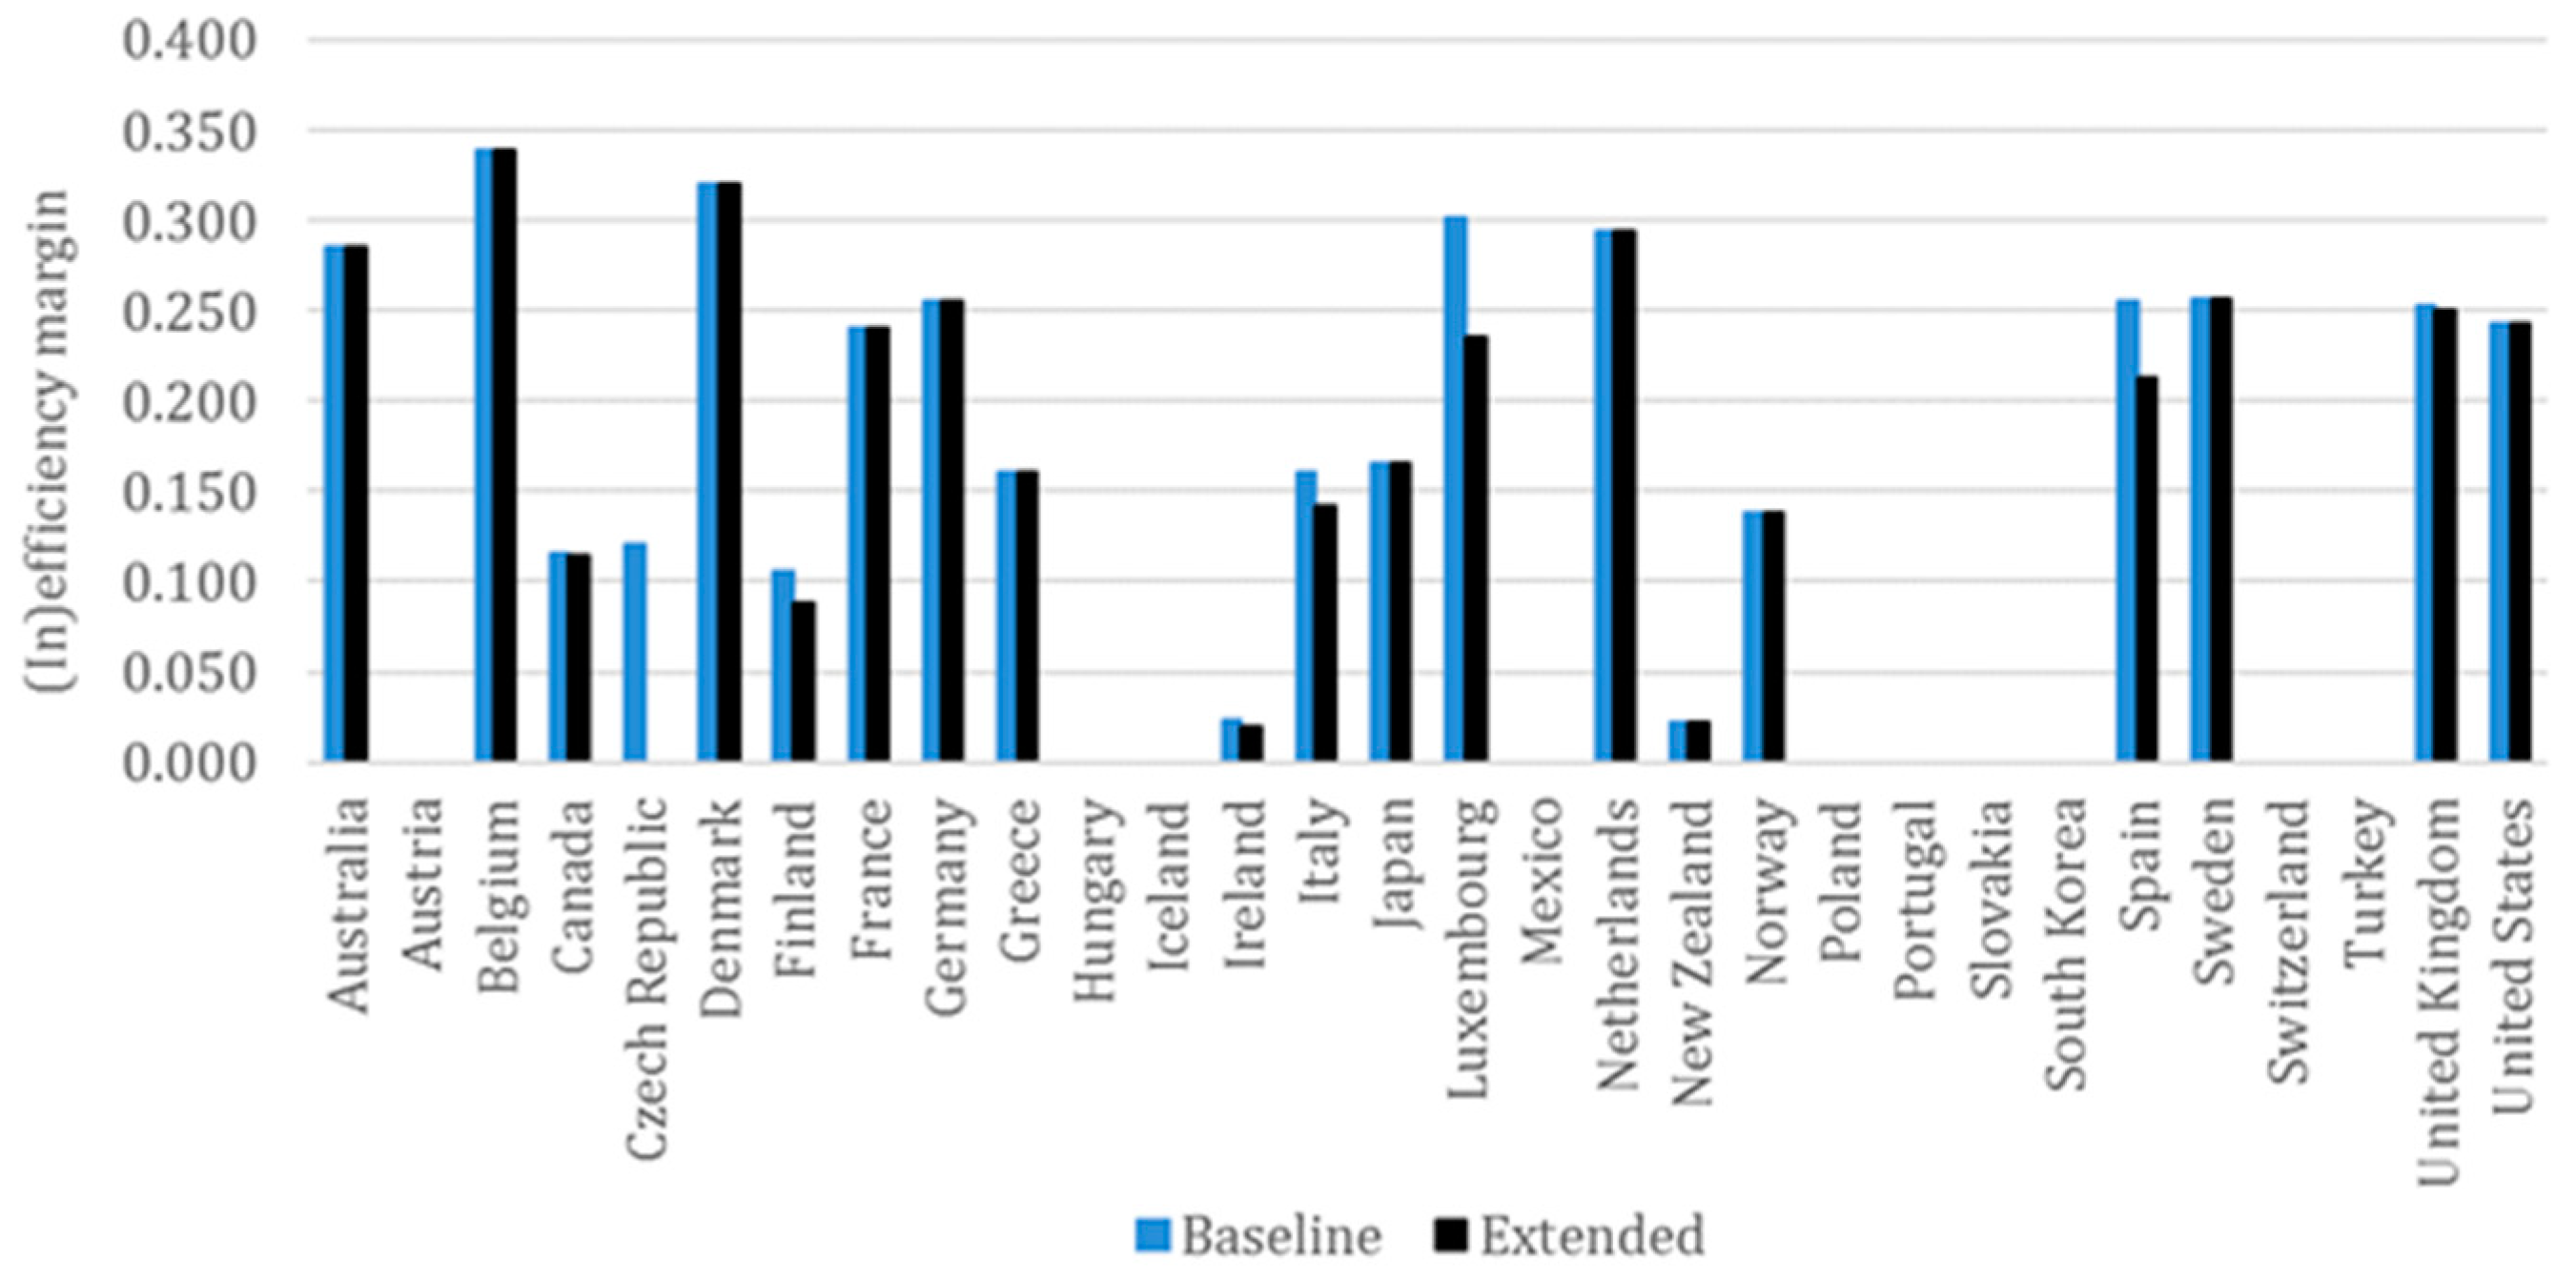
The results obtained from the model for electricity intensity and renewable electricity capacity as an input are only partially consistent with the model using electricity capacity. Countries have a slightly higher mean inefficiency of 13.5% and, although Austria and Switzerland bring the number of countries on the DEA frontier up to 10, there is a general trend of increased inefficiency compared to the other version of this model. A more thorough examination of the differences reveals that the inefficiency margins go up for countries whose renewable electricity capacity is greater than the electricity capacity.
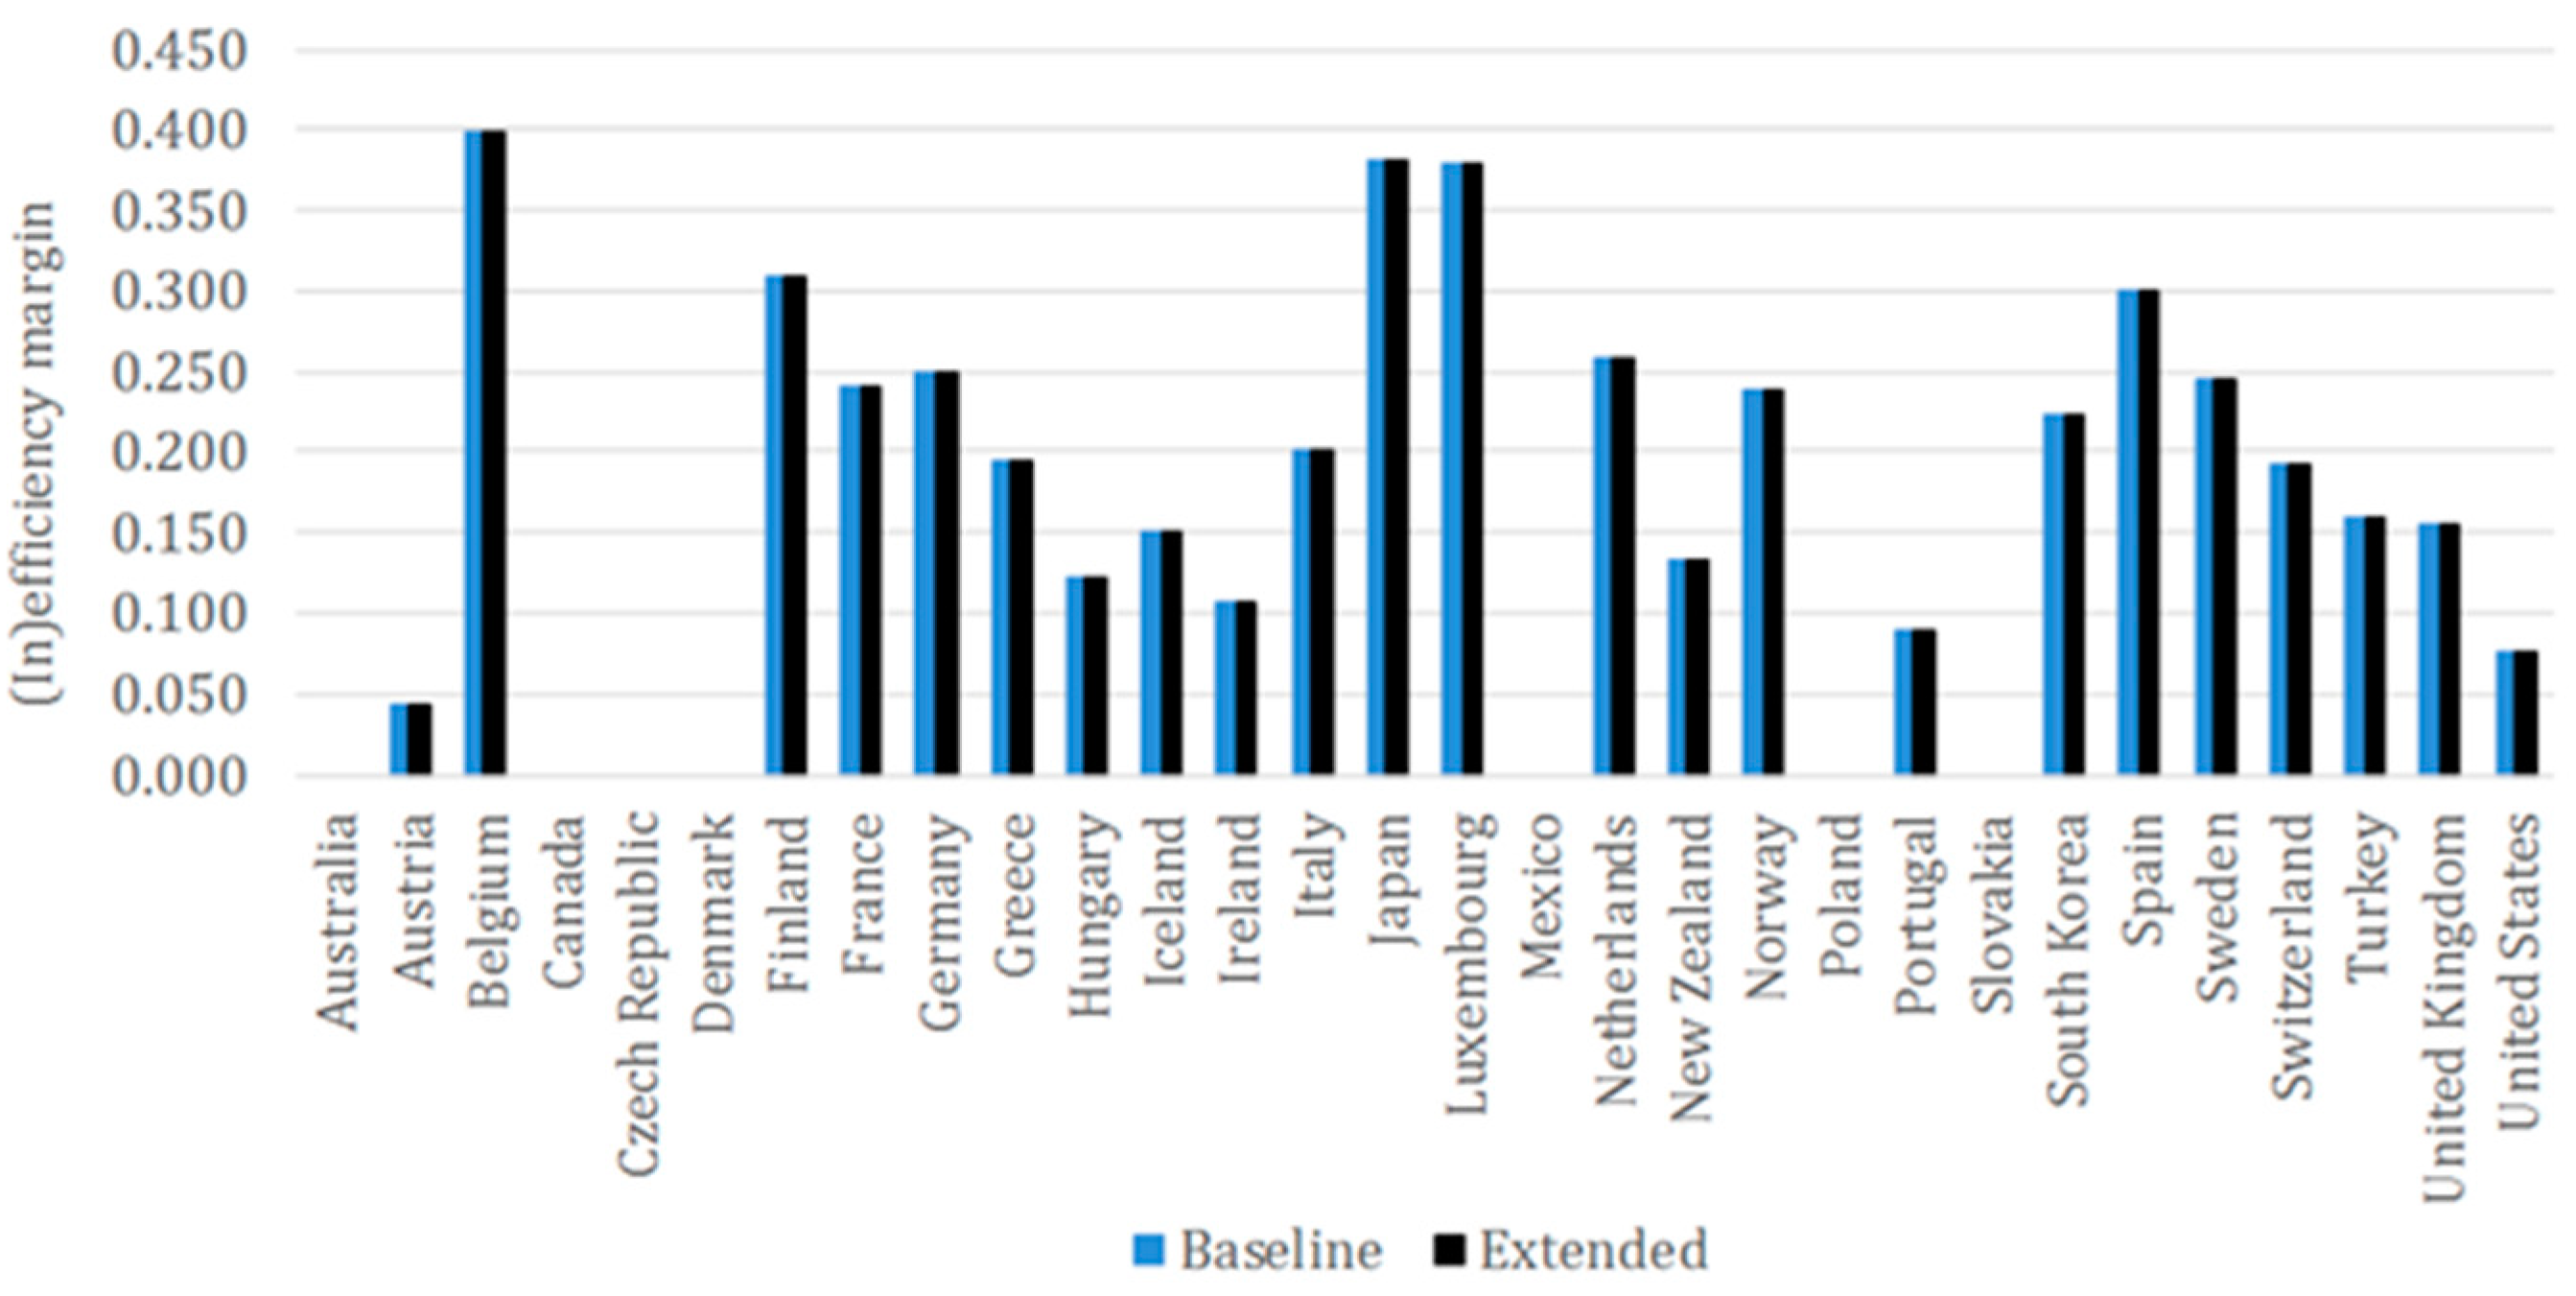
6.2. Extended Models
We extend the baseline models by adding the environment component proxied by the CO
2 emissions as an output variable in each of them. The inefficiency margins from the extended models are reported in Columns 2, 4 and 6 of
Table A5 in
Appendix E, while
Figure A6,
Figure A7 and
Figure A8 in
Appendix F make a comparison between the margins obtained from the baseline and extended models.
The inefficiency scores yielded in the extended models for optimising primary energy intensity and electricity intensity when electricity capacity is included are fully consistent with those in the baseline models. The steady scores amidst the addition of CO2 emissions means that countries face a split-off of the improvement across the output variables that they could achieve with a better match of the inputs at its current levels. Slight differences are noticeable in the extended model for electricity with renewable electricity capacity as an input and all of them point to a decreased inefficiency. As a result, the mean inefficiency margin amounts to 12.6%, which is 0.9 percentage points lower to that in the baseline model. Czech Republic is the country with most significant change from an inefficiency of 12.0% in the baseline model to DEA efficiency on the frontier in the extended model.
7. Conclusions
Our study of energy use and economic development reveals that OECD member states with higher nominal GDP per capita, in general, use primary energy and electricity more efficiently. The findings that we arrive at in the empirical analysis offer answers to our research questions. Firstly, we find that the sampled countries on average have an inefficiency margin of 16.1% for primary energy use and from 10.8 to 13.5% for electricity use. Secondly, based on the results, we conclude that the sampled countries use electricity more efficiently than primary energy by a slight margin. Thirdly, the inclusion of the environmental care does not affect efficiency, except for the case with electricity produced from renewable sources where the inefficiency margin with environment decreased from 13.5 to 12.6%, indicating that the efficiency has increased. Fourthly, the inclusion of electricity production through renewable electricity capacity moved the inefficiency margin up from 10.8 to 13.5%, indicating that the efficiency has decreased. These results imply that countries have the opportunity to improve their energy management that could increase the efficient use of primary energy and electricity by the calculated margins under constant inputs. In other words, although the (in)efficiency margins point out to a mismatch in the utilisation of inputs, they also uncover a hidden potential to increase the efficient use of energy through re-allocation without the necessity to change the input values. The approach we develop to study energy efficiency primarily using energy-related variables with several other indicators that proxy for other related and important concepts is not ideal though, and it has some limitations that need to be addressed in future research papers on the topic. Firstly, the right choice of variables as inputs is oftentimes difficult and may lead to omission of important concepts. In first place, this applies to the geographic and climate factors that can impact the way a country manages its energy resources. Secondly, another related problem is the lack of data for specific variables that could calibrate the model in a proper way. Thirdly, the DEA framework assumes linearity and employs techniques of linear programming, which may not always be true and can produce results that lead up to conclusions that do not reflect reality. Fourthly, although the approach is sound to study efficiency and it can very well support important decisions regarding energy use, it does not explicitly tell what should be done to make a re-allocation that will bring closer to the frontier or how should the inputs be changed to free some room for improvement.
We acknowledge that any future research on this topic should start off from the possibility to solve the foregoing limitations and produce a more coherent and all-embracing empirical analysis. A major next step to consider is expanding the sample size by bringing in more countries with varying levels of economic development.


