Design and Assessment of District Heating Systems with Solar Thermal Prosumers and Thermal Storage
Abstract
1. Introduction
2. Methodology
2.1. Framework Overview
2.1.1. Demand Model
2.1.2. District Heating Network Model
- Network layout design
- Pipe design and mass conservation
- Network Simulation
2.1.3. Supply and Storage Technology Models
- Solar thermal collector (STC)
- Gas boiler (GB)
- Thermal Energy Storage (TES)
2.2. Simulation Analysis and Scenarios
2.2.1. Simulation Scenarios
- District heating system (DHS) scenario: centralized gas boiler (GB) + Thermal Energy Storage (TES); district heating network (DHN); rooftop solar thermal collector (STC).
- Individual heating system (IHS) scenario: each building has a standalone heating system with GB, TES and rooftop STC.
2.2.2. District Scenarios
2.2.3. System Operation Strategies, Boundary Conditions and Energy Balance
2.2.4. Performance Indicators
- Network thermal loss
- Pumping Energy
- Equivalent Annual Cost (EAC)
- GHG emissions
- Solar fraction (SF)
3. Case Study
4. Results and Discussion
4.1. District Heating Network Design and Operations
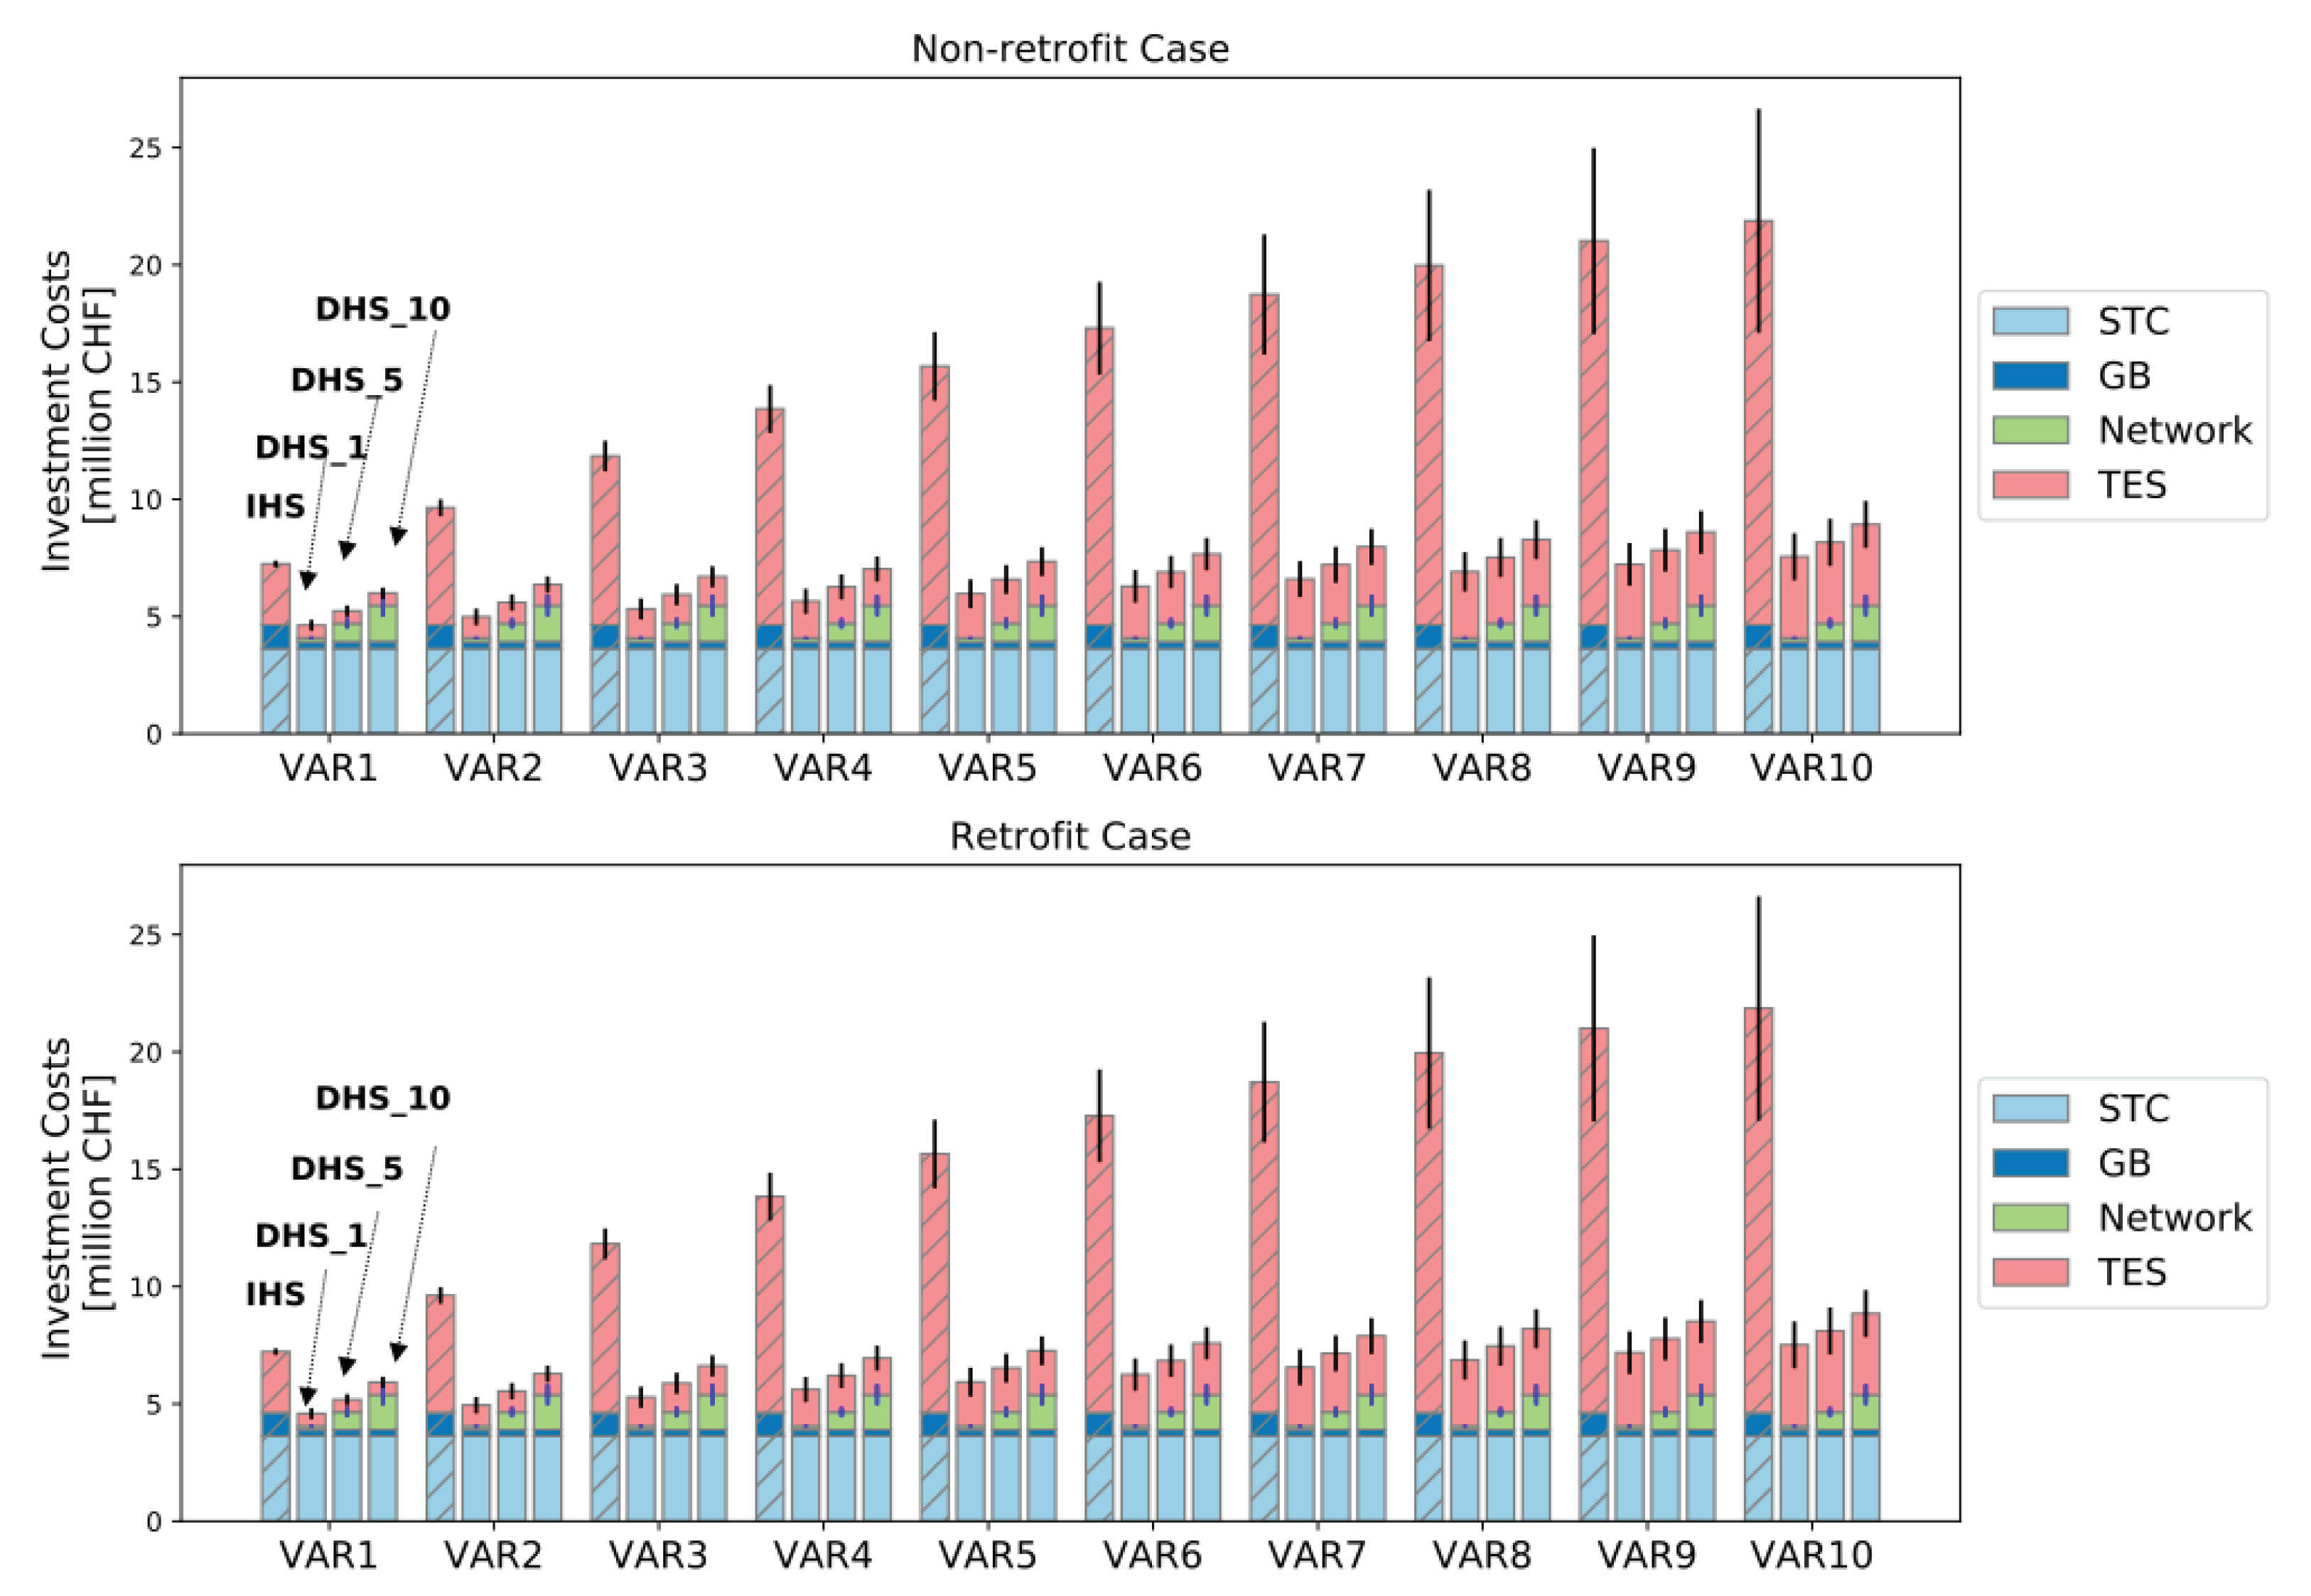
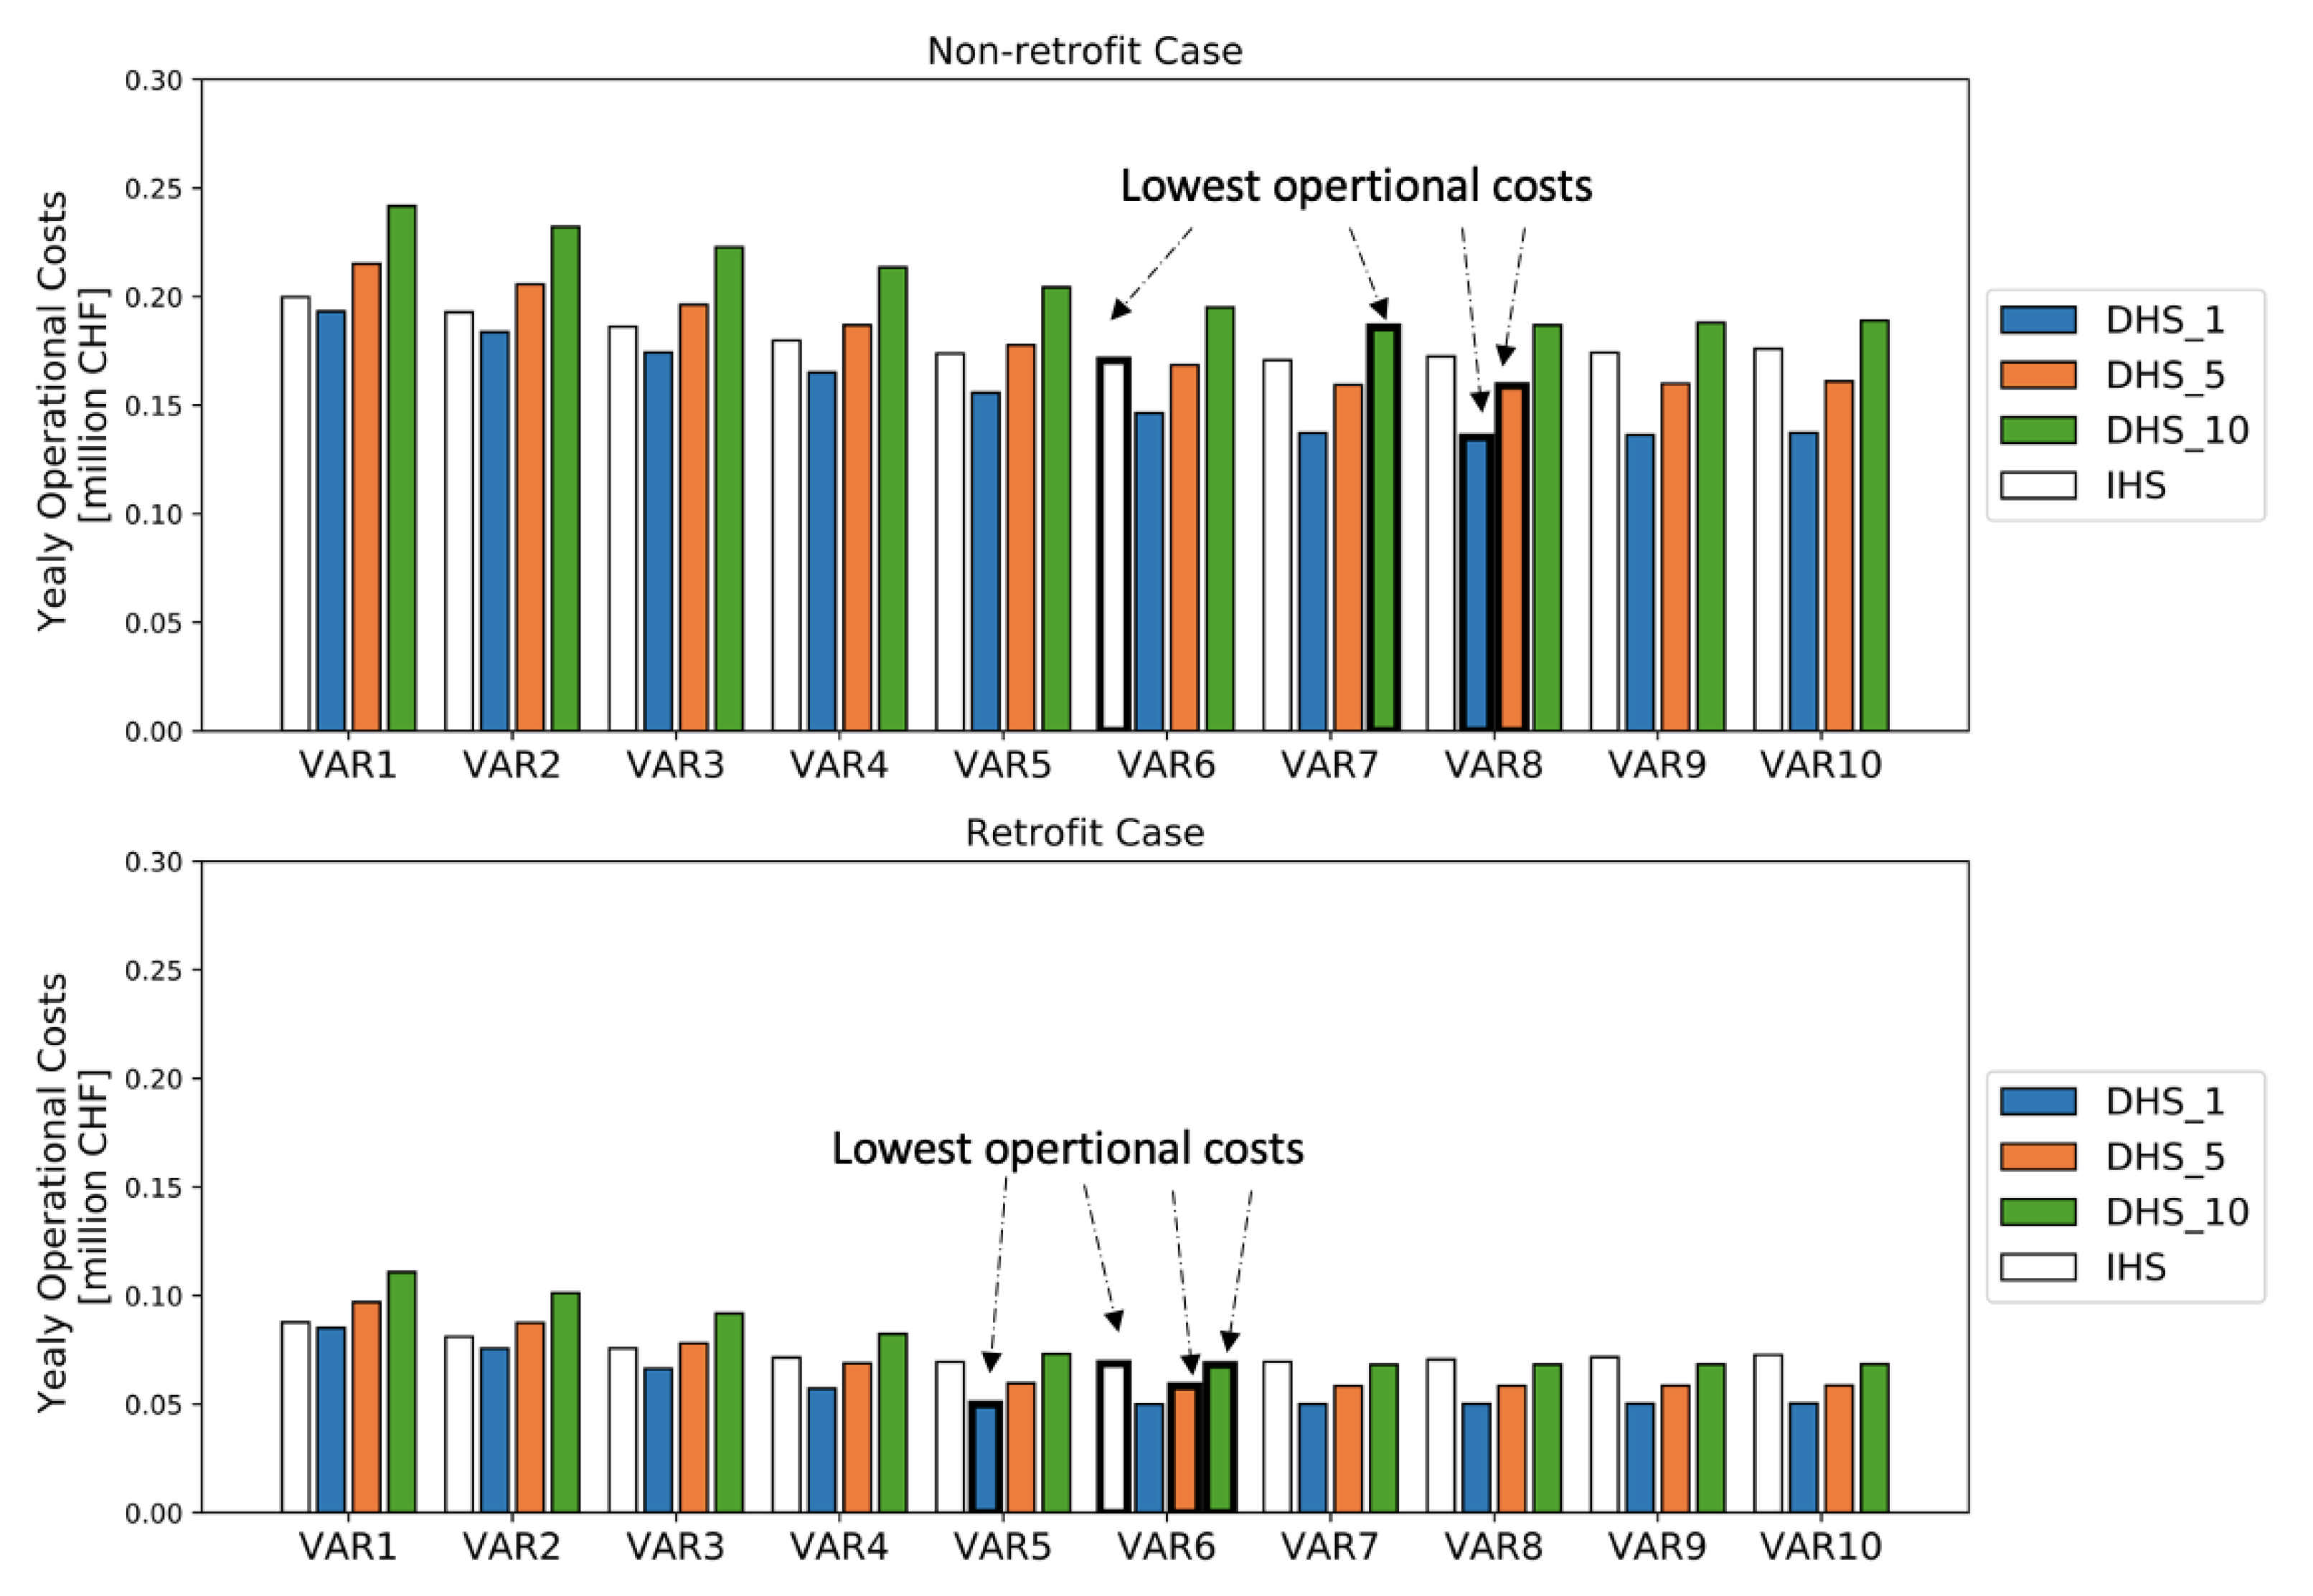
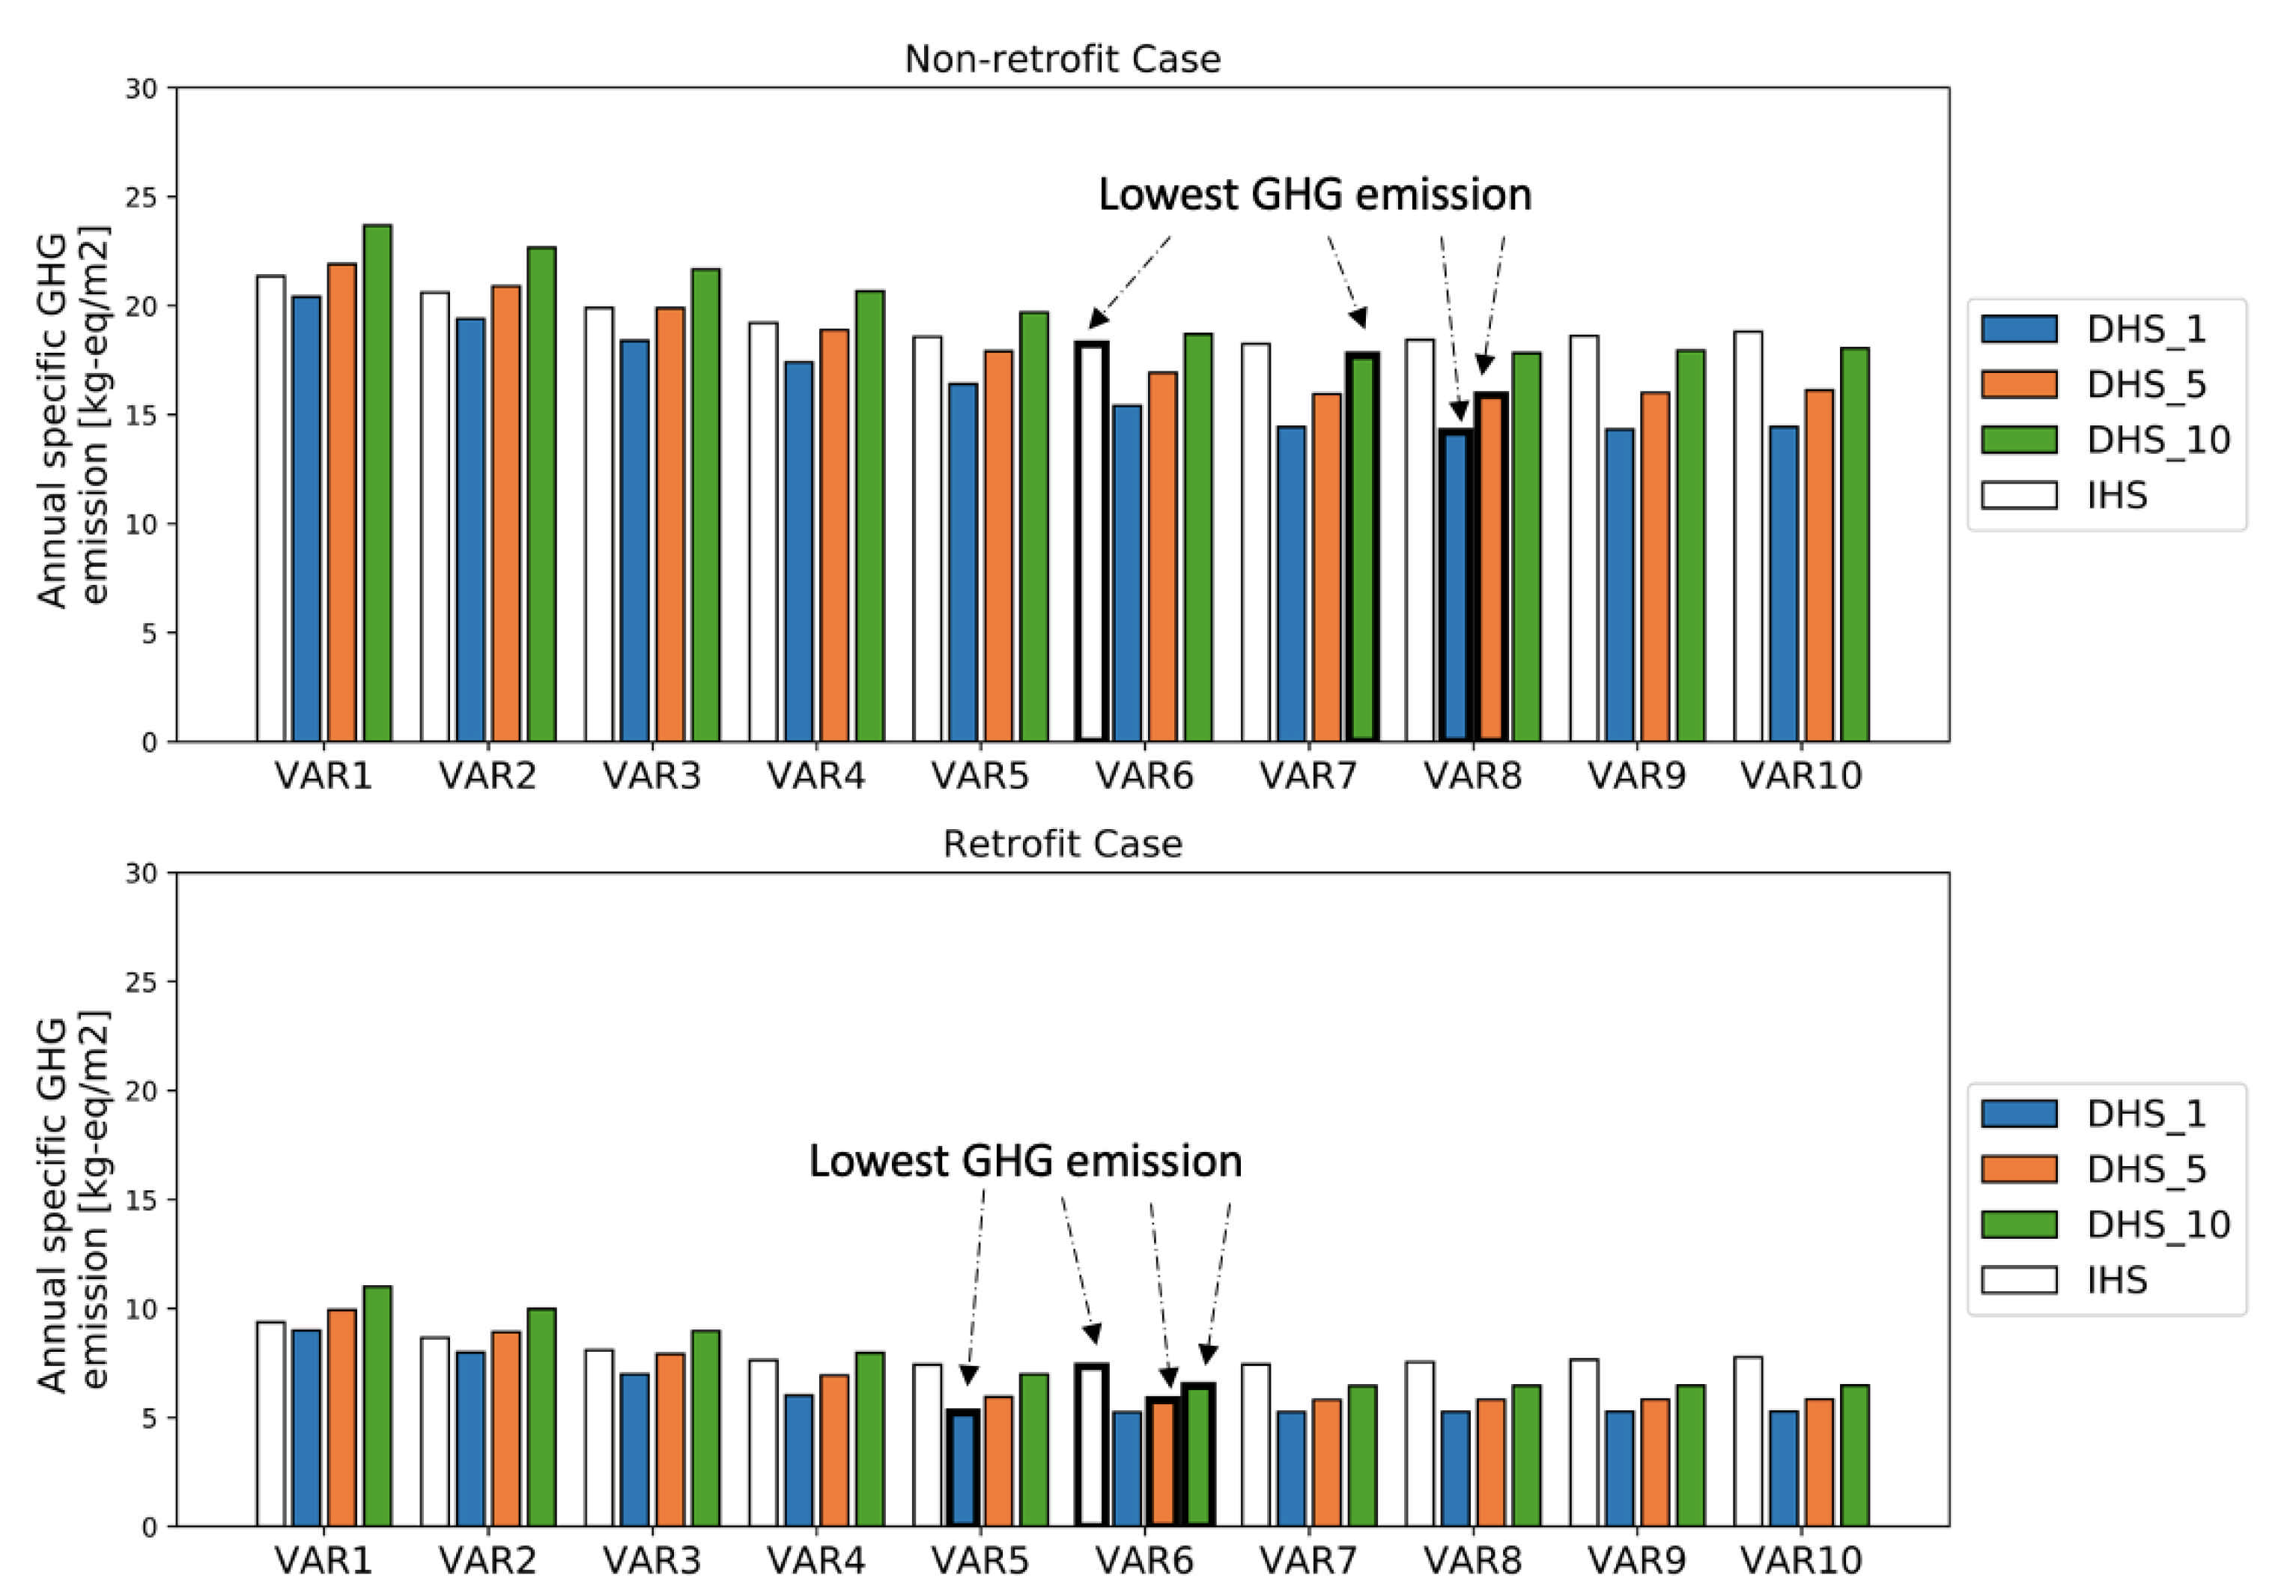
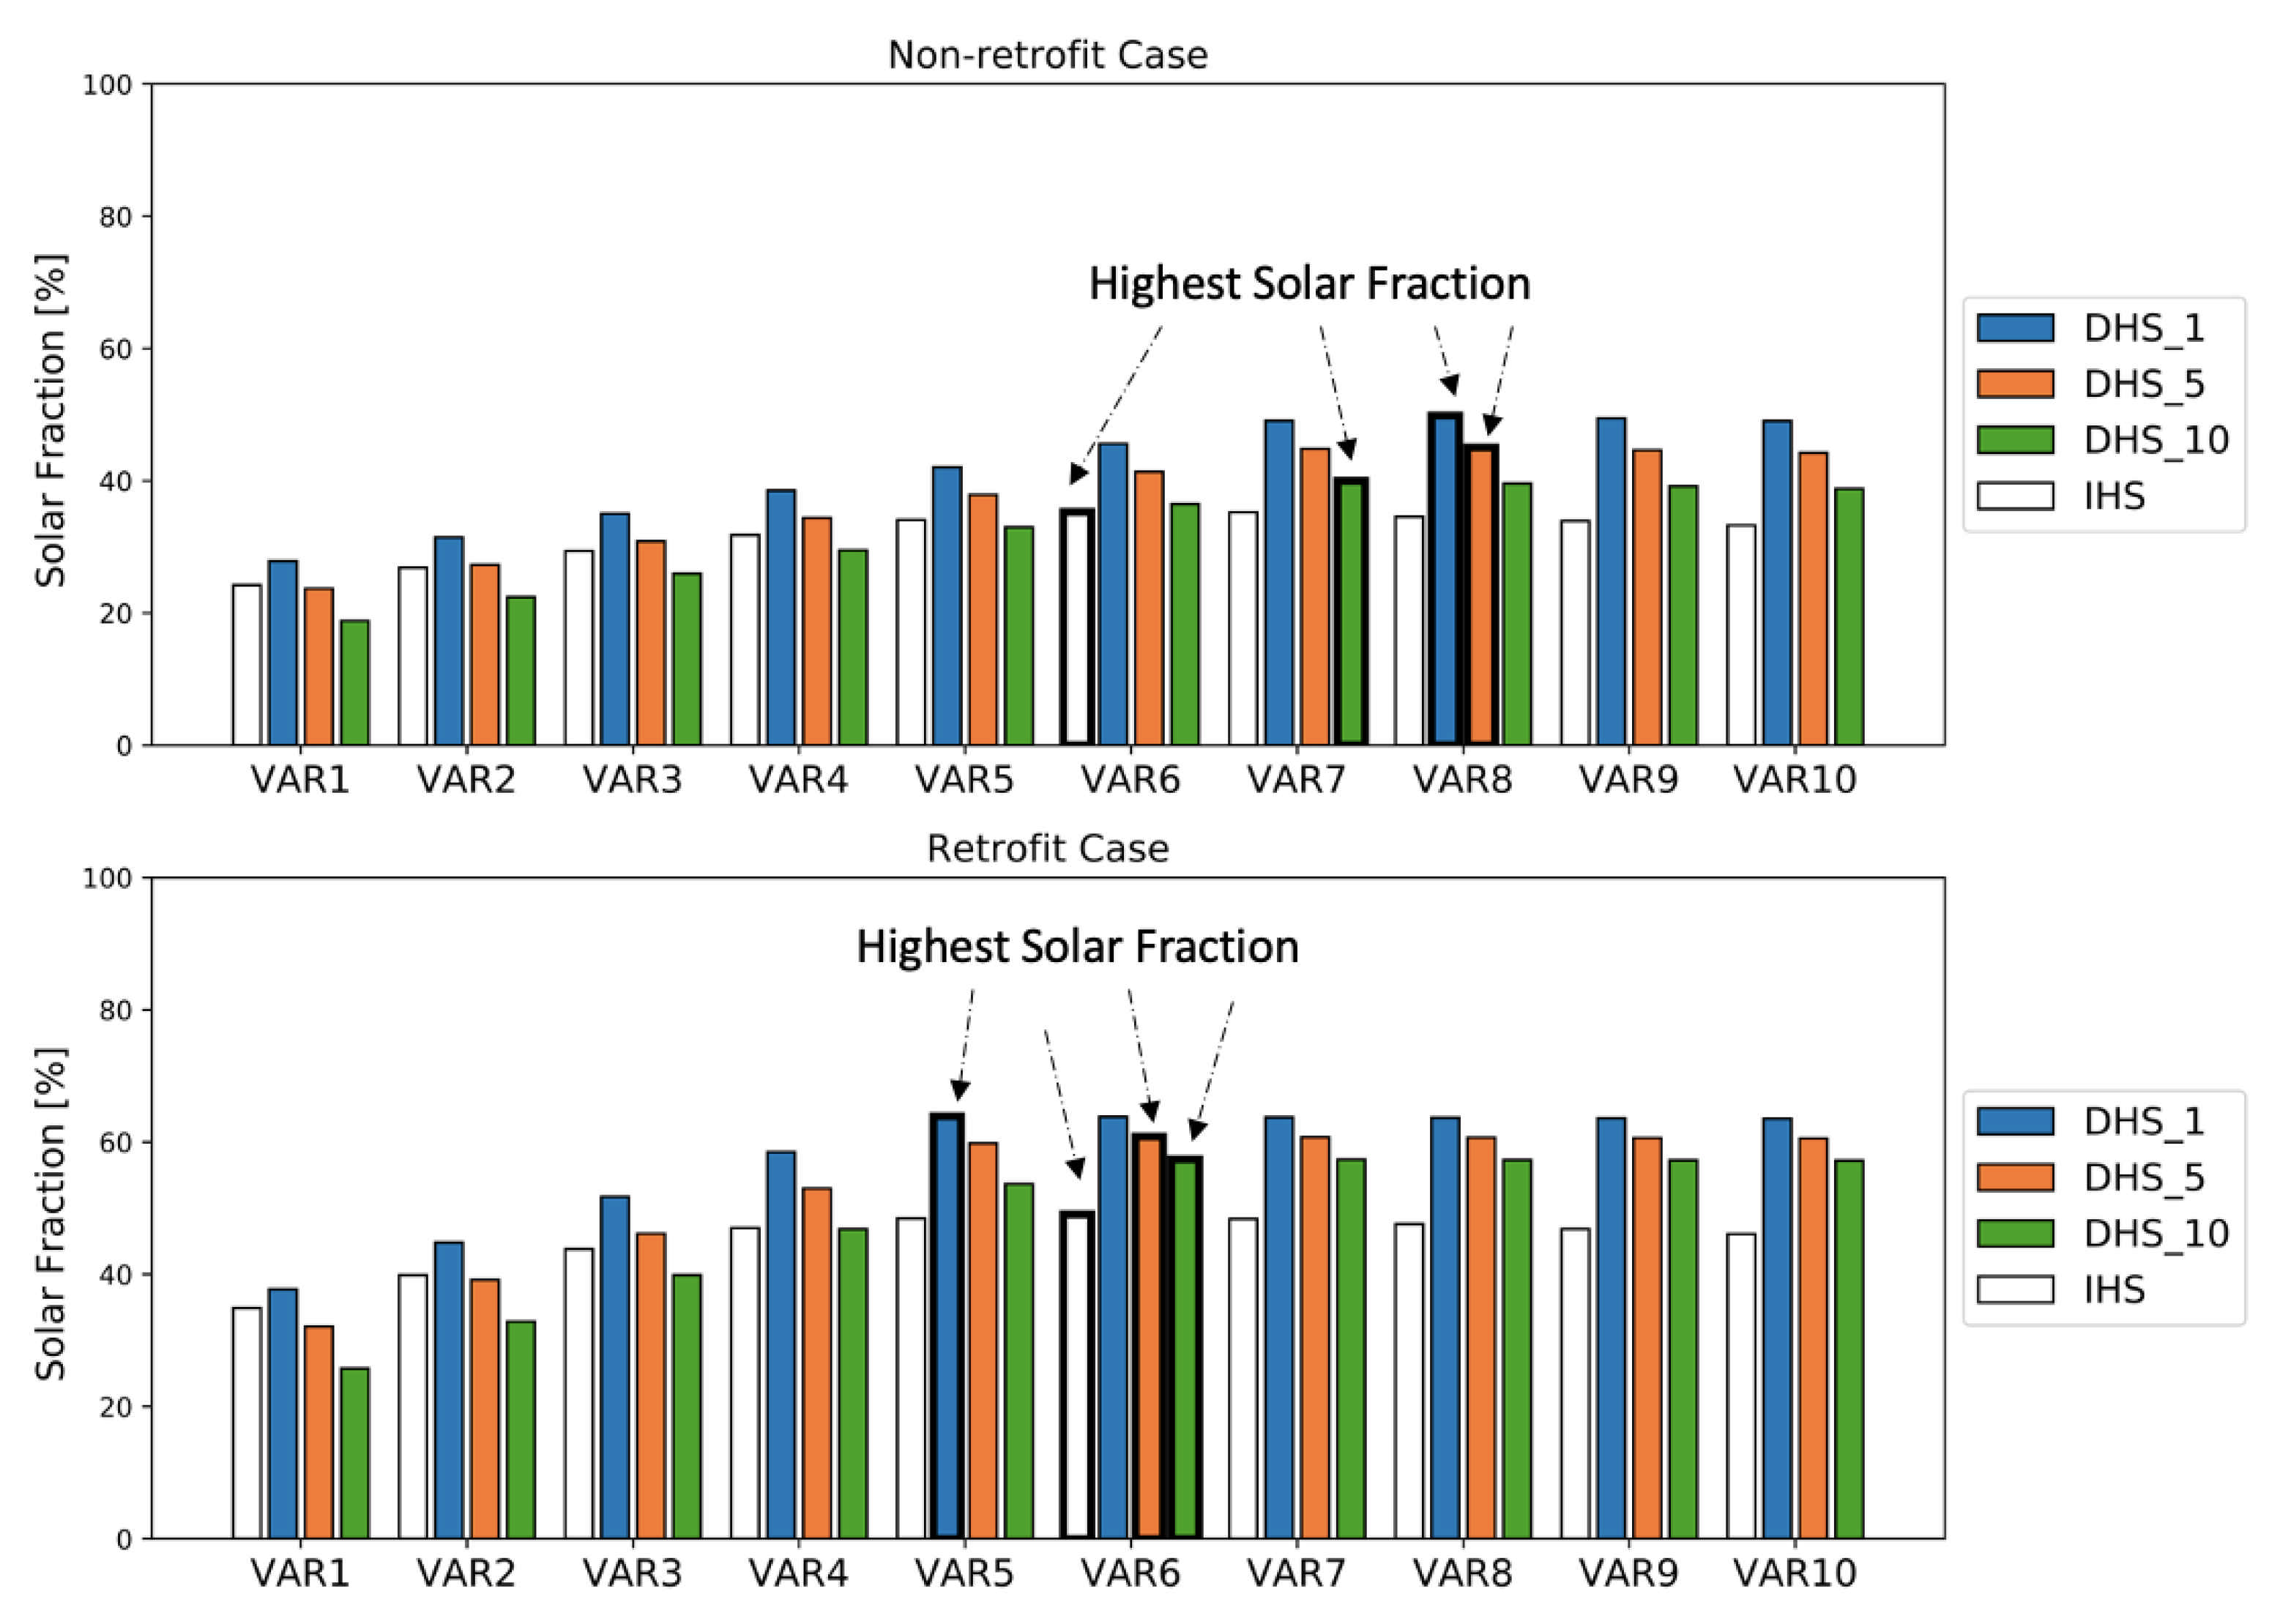
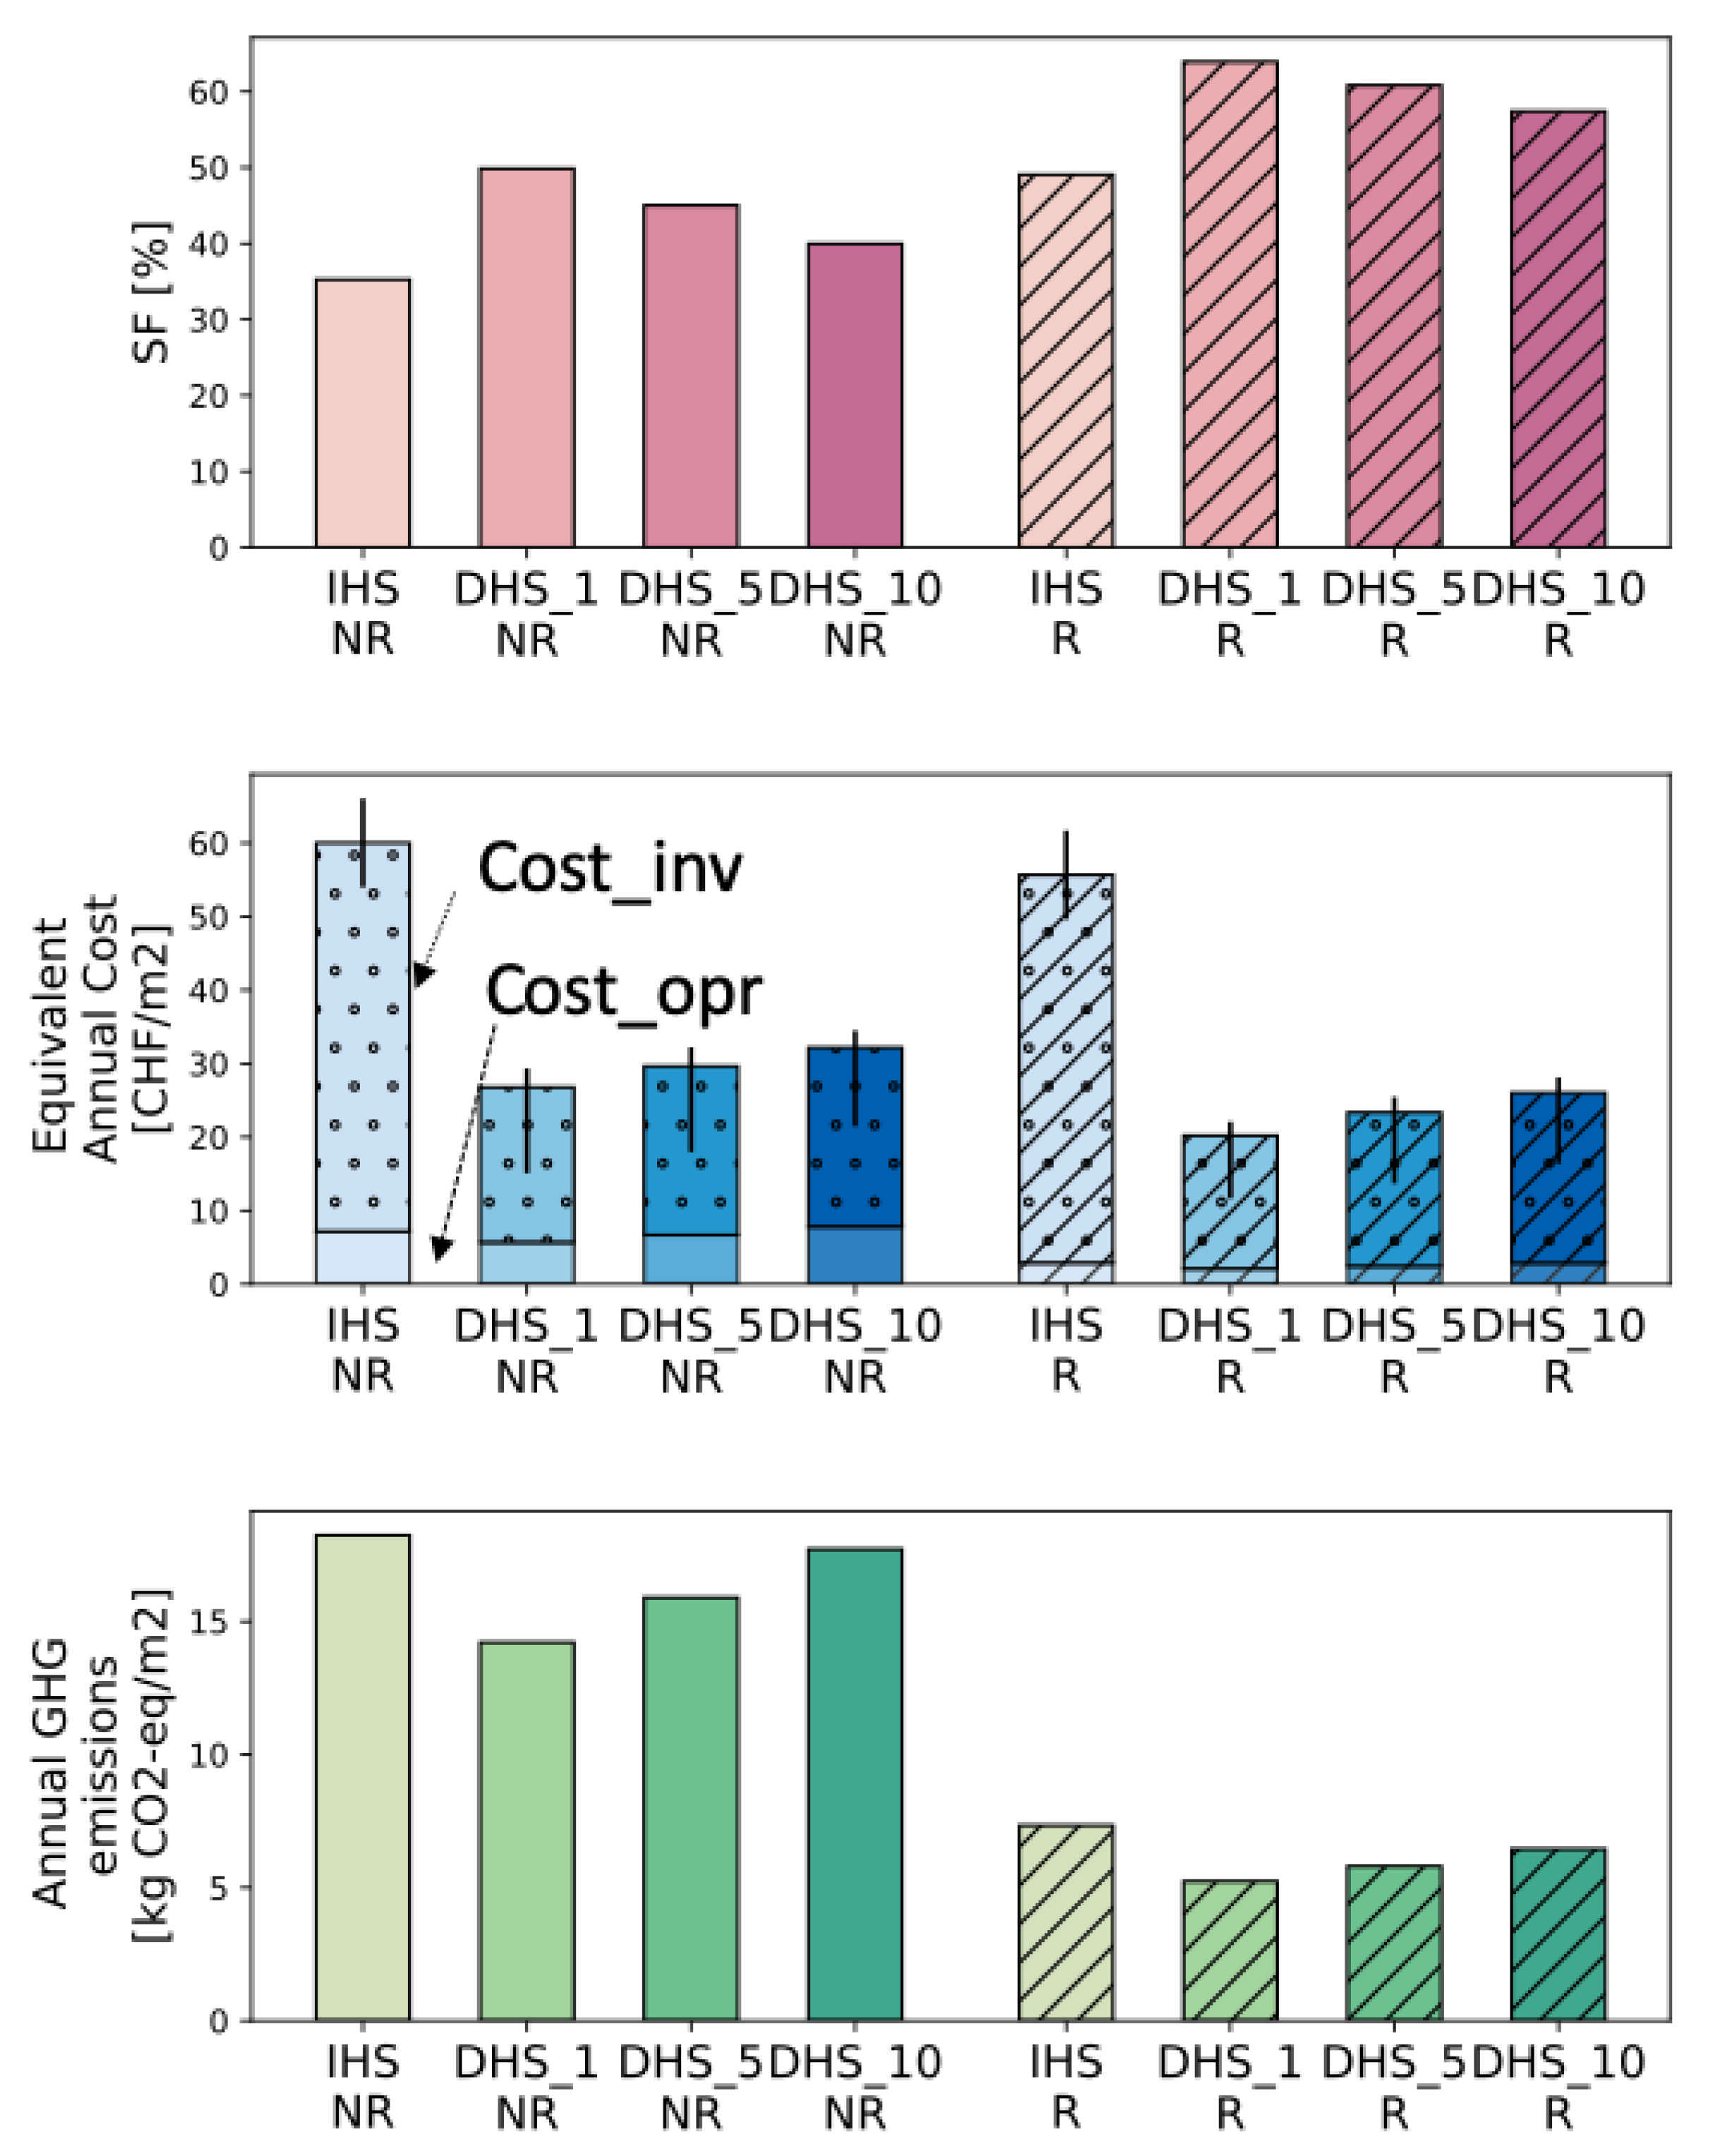
4.2. Economic, Energy and Environmental Analyses of Scenarios
5. Conclusions
Author Contributions
Funding
Institutional Review Board Statement
Informed Consent Statement
Data Availability Statement
Acknowledgments
Conflicts of Interest
Abbreviations
| AF | Annuity Factor |
| DHN | District Heating Networks |
| DHS | District Heating System |
| EAC | Equivalent Annual Cost |
| GB | Gas Boiler |
| GHG | Greenhouse Gas |
| IHS | Individual Heating System |
| MFS | Multi-Family House |
| SF | Solar Fraction |
| SFM | Single-Family House |
| STC | Solar Thermal Collector |
| TES | Thermal Energy Storage |
| VAR | Volume to Area Ratio |
| Matrix | |
| Incidence matrix (network) | |
| Matrix of mass flow rate for all source/sink (network) | |
| Matrix of mass flow rate in the network (network) | |
| Sets | |
| Technologies | |
| Buildings in the district | |
| Time (8760 hours in a year) | |
| Parameters and Variables | |
| Cylindrical wall area of TES [m2] | |
| Top wall area of TES [m2] | |
| Area of STC [m2] | |
| Investment Cost [CHF] | |
| Annual Operational Cost [CHF] | |
| Annual Emissions [kg CO2-eq/m2] | |
| Pipe inner diameter [m] | |
| Friction factor [-] | |
| Solar irradiation [W/m2] | |
| Thermal transfer coefficient for pipe [W/mK] | |
| Pipe length for pipe [m] | |
| Mass flow rate at pipe [kg/s] | |
| Mass flow rate at source/sink node i [kg/s] | |
| Mass flow in tank [kg] | |
| Pressure at node i [Pa] | |
| Pressure difference along pipe [Pa] | |
| Pressure difference at substation [Pa] | |
| Annual heat loss [Wh] | |
| Annual heat demand [Wh] | |
| Annual auxiliary energy consumption [Wh] | |
| Pumping power [W] | |
| Output power from STC [W] | |
| Output power from GB [W] | |
| GB Input gas consumption [W] | |
| Constant lost factor(TES) [W] | |
| Discharge heat flux from TES [W] | |
| Charge heat flux to TES [W] | |
| Net energy demand from the heating network at building i [W] | |
| Net energy feed into the heating network at building i [W] | |
| Total heat loss from network [W] | |
| Heating load at building i [W] | |
| Reynolds number [-] | |
| r | Interest rate [-] |
| State of Charge (TES) [Wh] | |
| Temperature at node i [ K ] | |
| Inlet temperature of pipe [ K ] | |
| Outlet temperature of pipe [K] | |
| Mixture temperature [K] | |
| Inlet temperature of splitter [K] | |
| Outlet temperature of splitter [K] | |
| Ambient temperature [K] | |
| Ground temperature [K] | |
| Inlet temperature (STC) [K] | |
| Temperature of the hot layer (TES) [K] | |
| Temperature of the cold layer (TES) [K] | |
| Temperature of the tank environment (TES) [K] | |
| U | Thermal transmittance of tank walls (TES) [W/m2K] |
| TES volume [m3 ] | |
| Maximum allowable velocity [m/s] | |
| Thermal loss factor (TES) [-] | |
| Thermal loss factor(TES) [h] | |
| Time constant (TES) [-] | |
| Water density [kg/m] | |
| Pipe roughness [m] | |
| Water thermal capacity [J/kgK] | |
| Pump motor efficiency [-] | |
| Pump isentropic efficiency [-] | |
| Substation efficiency [-] | |
| GB efficiency [-] | |
| STC efficiency [-] | |
| Natural gas emission factor [kg CO2-eq/kWh] | |
| Electricity grid mix emission factor [kg CO2-eq/kWh] | |
| , , | efficiency coefficients for STC [-] |
| Yearly operational fuel consumption [kWh] | |
| Yearly operational electricity consumption [kWh ] | |
Appendix A. Input Data
| Technology | Parameter | Value |
|---|---|---|
| STC | Conversion factor | 0.854 |
| Loss coefficient | 4.06 W/m2 K | |
| Loss coefficient | 0.0090 W/m2 K2 | |
| GB | efficiency | 0.95 |
| TES | Aspect ratio (height to width ratio) | 1 |
| Thickness & thermal conductivity | Wall: Concrete Shell 0.5 m; 1.63 W/mK | |
| Insulation layer: Foam Glass gravel 0.3 m; 0.095 W/mK | ||
| DHN | Substation Efficiency | 0.95 |
| Pump isentropic & motor efficiency | 0.85; 0.85 | |
| pipe thermal transfer coefficient | [W/mK] (A linear correlation with pipe diameter extrapolated based on [36]) | |
| pipe roughness | 0.2 mm |
| Cost | |
|---|---|
| STC | 2.40–1.50 kCHF/m2 (based on the STC area) [44] |
| GB | 0.26–3.06 kCHF/kW (based on the GB capacity) [44] |
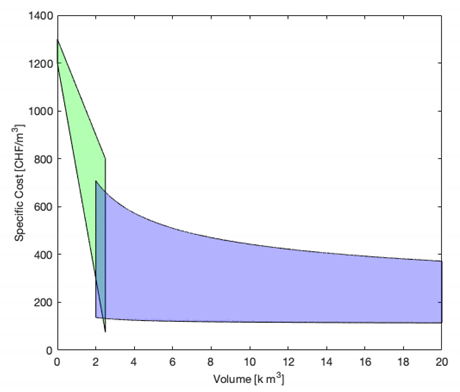
| TES | 114–1300 CHF/m3 (based on TES volume) shown in Figure A1 [45] |
| Pipe | CHF/m (linear extrapolation based on data from [46]) (In the sensitivity analysis, a variation of is applied) |
| Pump | Big central pump: [8] Small decentral pumps at prosumer: 295 CHF/pump |
| Energy Carrier | CO2 Emission Factor (kg CO2-eq/kWh) | Fuel Cost (CHF/ kWh) |
|---|---|---|
| Natural Gas | 0.249 | 0.098 |
| Electricity | 0.139 | 0.205 |
Appendix B. Case Study Information
| BUILDING | Building Type | Conditioned Floor Area (m) | Construction Age | Solar Area (m) |
|---|---|---|---|---|
| R1 | MFH | 483 | −1930 | 77 |
| R2 | MFH | 524 | 2011– | 79 |
| R3 | SFH | 291 | 1951–70 | 38 |
| R4 | MFH | 474 | 1991–00 | 50 |
| R5 | SFH | 262 | 1931-50 | 84 |
| R6 | SFH | 399 | −1930 | 54 |
| R7 | MFH | 498 | 1951–70 | 65 |
| R8 | MFH | 411 | −1930 | 59 |
| R9 | MFH | 269 | 2001–10 | 37 |
| R10 | MFH | 553 | 1951–70 | 66 |
| R11 | SFH | 509 | 1971–80 | 66 |
| R12 | MFH | 766 | 1931–50 | 97 |
| R13 | MFH | 866 | −1930 | 86 |
| R14 | MFH | 363 | 1951–70 | 31 |
| M1 | MFH | 2665 | 1981–90 | 265 |
| M2 | MFH-mixed | 907 | −1930 | 21 |
| M3 | Office | 4530 | 2001–10 | 227 |
| M4 | Office-shop | 1615 | −1930 | 162 |
| M5 | Office-shop | 1790 | −1930 | 162 |
| M6 | MFH-mixed | 917 | 1931–50 | 215 |
| M7 | MFH | 1233 | 1931–50 | 50 |
| M8 | MFH-mixed | 922 | 1931–50 | 50 |
| M9 | Office-shop | 1615 | −1930 | 94 |
| M10 | MFH-mixed | 917 | 1931-50 | 14 |
Appendix C. District Heating Design Outcomes
| District Scenarios | DHS_1 _NR | DHS_1 _R | DHS_5 _NR | DHS_5 _R | DHS_10 _NR | DHS_10 _R |
|---|---|---|---|---|---|---|
| Min diameter [mm] | 7 | 10 | 7 | 10 | 7 | 10 |
| Mean diameter [mm] | 37.6 | 35.9 | 37.6 | 35.9 | 37.6 | 35.9 |
| Max diameter [mm] | 68 | 64 | 68 | 64 | 68 | 64 |
| Total length [m] | 438 | 438 | 2190 | 2190 | 4380 | 4380 |
References
- IEA. Energy Policies of IEA Countries. Switzerland 2018 Review; Technical Report; International Energy Agency: Paris, France, 2018. [Google Scholar]
- S.Ostermeyer. Building Market Briefing Switzerland; Technical Report; European Institute of Innovation and Technology: Budapest, Hungary, 2017. [Google Scholar]
- Lund, H.; Werner, S.; Wiltshire, R.; Svendsen, S.; Thorsen, J.E.; Hvelplund, F.; Mathiesen, B.V. 4th Generation District Heating (4GDH). Energy 2014, 68, 1–11. [Google Scholar] [CrossRef]
- Šajn, N. Briefing European Parliamentary Research Service; Technical Report; European Parliament: Brussels, Belgium, 2016. [Google Scholar]
- Cesena, E.A.M.; Good, N.; Syrri, A.; Mancarella, P. Techno-economic assessment of distribution network reliability services from microgrids. In Proceedings of the 2017 IEEE PES Innovative Smart Grid Technologies Conference Europe (ISGT-Europe), Torino, Italy, 26–29 September 2017; pp. 1–6. [Google Scholar] [CrossRef]
- Ahmed, A.; Mancarella, P. Strategic techno-economic assessment of heat network options for distributed energy systems in the UK. Energy 2014, 75, 182–193. [Google Scholar] [CrossRef]
- Chambers, J.; Narula, K.; Sulzer, M.; Patel, M.K. Mapping district heating potential under evolving thermal demand scenarios and technologies: A case study for Switzerland. Energy 2019. [Google Scholar] [CrossRef]
- Pirouti, M.; Bagdanavicius, A.; Ekanayake, J.; Wu, J.; Jenkins, N. Energy consumption and economic analyses of a district heating network. Energy 2013, 57, 149–159. [Google Scholar] [CrossRef]
- Wang, H.; Duanmu, L.; Li, X.; Lahdelma, R. Optimizing the district heating primary network from the perspective of economic-specific pressure loss. Energies 2017, 10, 1095. [Google Scholar] [CrossRef]
- Ljubenko, A.; Poredoš, A.; Morosuk, T.; Tsatsaronis, G. Performance analysis of a district heating system. Energies 2013, 6, 1298–1313. [Google Scholar] [CrossRef]
- Lizana, J.; Ortiz, C.; Soltero, V.M.; Chacartegui, R. District heating systems based on low-carbon energy technologies in Mediterranean areas. Energy 2016. [Google Scholar] [CrossRef]
- Sibbitt, B.; Onno, T.; McClenahan, D.; Thornton, J.; Brunger, A.; Kokko, J.; Wong, B. The Drake Landing solar community project—Early results. In Proceedings of the 2nd Canadian Solar Research Network conference, Calgary, AB, Canada, 10–14 June 2007; pp. 1–11. [Google Scholar]
- Sibbitt, B.; McClenahan, D.; Djebbar, R.; Thornton, J.; Wong, B.; Carriere, J.; Kokko, J. The performance of a high solar fraction seasonal storage district heating system-Five years of operation. Energy Procedia 2012, 30, 856–865. [Google Scholar] [CrossRef]
- Brand, L.; Calvén, A.; Englund, J.; Landersjö, H.; Lauenburg, P. Smart district heating networks—A simulation study of prosumers’ impact on technical parameters in distribution networks. Appl. Energy 2014, 129, 39–48. [Google Scholar] [CrossRef]
- Ben Hassine, I.; Eicker, U. Impact of load structure variation and solar thermal energy integration on an existing district heating network. Appl. Therm. Eng. 2013, 50, 1437–1446. [Google Scholar] [CrossRef]
- Yang, L.; Entchev, E.; Rosato, A.; Sibilio, S. Smart thermal grid with integration of distributed and centralized solar energy systems. Energy 2017, 122, 471–481. [Google Scholar] [CrossRef]
- Bordin, C.; Gordini, A.; Vigo, D. An optimization approach for district heating strategic network design. Eur. J. Oper. Res. 2016, 252, 296–307. [Google Scholar] [CrossRef]
- Damien, C.; Cynthia, N.; Guillaume, B.; Pascal, S.; Dominique, M. Dynamic modelling of a district cooling network with modelica. In Proceedings of the BS2015: 14th Conference of International Building Performance Simulation Association, Hyderabad, India, 7–9 December 2015. [Google Scholar]
- Schmidt, T.; Mangold, D.; Müller-Steinhagen, H. Central solar heating plants with seasonal storage in Germany. Sol. Energy 2004, 76, 165–174. [Google Scholar] [CrossRef]
- Calise, F.; D’Accadia, M.D.; Vicidomini, M.; Scarpellino, M. Design and simulation of a prototype of a small-scale solar CHP system based on evacuated flat-plate solar collectors and Organic Rankine Cycle. Energy Convers. Manag. 2015, 90, 347–363. [Google Scholar] [CrossRef]
- Hsieh, S.; Omu, A.; Orehounig, K. Comparison of solar thermal systems with storage: From building to neighbourhood scale. Energy Build. 2017, 152, 359–372. [Google Scholar] [CrossRef]
- Tol, H.; Svendsen, S. Improving the dimensioning of piping networks and network layouts in low-energy district heating systems connected to low-energy buildings: A case study in Roskilde, Denmark. Energy 2012, 38, 276–290. [Google Scholar] [CrossRef]
- Brange, L.; Lauenburg, P.; Sernhed, K.; Thern, M. Bottlenecks in district heating networks and how to eliminate them—A simulation and cost study. Energy 2017, 137, 607–616. [Google Scholar] [CrossRef]
- Bünning, F.; Wetter, M.; Fuchs, M.; Müller, D. Bidirectional low temperature district energy systems with agent-based control: Performance comparison and operation optimization. Appl. Energy 2017, 209, 502–515. [Google Scholar] [CrossRef]
- Swisstopo. 2016. Available online: https://www.swisstopo.admin.ch/ (accessed on 1 January 2018).
- Meteonorm. 2016. Available online: http://www.meteonorm.com/ (accessed on 1 January 2018).
- Wang, D.; Landolt, J.; Mavromatidis, G.; Orehounig, K.; Carmeliet, J. CESAR: A bottom-up building stock modelling tool for Switzerland to address sustainable energy transformation strategies. Energy Build. 2018, 169, 9–26. [Google Scholar] [CrossRef]
- NREL. EnergyPlus. 2015. Available online: https://energyplus.net/ (accessed on 1 April 2019).
- BFS. Bundesamt für Statistik, Gebäude und Wohnungsstatistik (GWS) 2013; Technical Report; Bundesamt für Statistik: Bern, Switzerland, 2013. [Google Scholar]
- SIA. SIA 2024, Standard-Nutzungsbedingungen für die Energie-und Gebäudetechnik; Technical Report 2006; Swiss Society of Engineers and Architects: Zürich, Switzerland, 2006. [Google Scholar]
- Esri. ArcGIS. 2015. Available online: https://www.arcgis.com (accessed on 1 February 2018).
- District Heating Network Design and Configuration Optimization with Genetic Algorithm. Sustain. Dev. Energy Water Environ. Syst. 2013, 1, 291–303. [CrossRef]
- Price, E.; Ostfeld, A. Graph Theory Modeling Approach for Optimal Operation of Water Distribution Systems. J. Hydraul. Eng. 2016, 142, 04015061. [Google Scholar] [CrossRef]
- Frederiksen, S.; Werner, S. District Heating and Cooling; Studentlitteratur: Lund, Sweden, 2013. [Google Scholar]
- Wang, D.; Orehounig, K.; Carmeliet, J. A Study of District Heating Systems with Solar Thermal Based Prosumers. Energy Procedia 2018, 149, 132–140. [Google Scholar] [CrossRef]
- Liu, X.; Jenkins, N.; Wu, J.; Bagdanavicius, A. Combined analysis of electricity and heat networks. Appl. Energy 2015, 61, 155–159. [Google Scholar] [CrossRef]
- Kaarup Olsen, P. Guidelines for Low-Temperature District Heating; Technical Report April; Danish Energy Agency: Copenhagen, Denmark, 2014. [Google Scholar]
- Mavromatidis, G. Model-Based Design of Distributed Urban Energy Systems under Uncertainty. Ph.D. Thesis, ETH Zurich, Zurich, Switzerland, 2017. [Google Scholar]
- Swamee, D.; Jain, A. Explicit Equations for Pipe Flow Problems. J. Hydraul. Div. 1976, 102, 657–664. [Google Scholar] [CrossRef]
- Duffie, J.A.; Beckman, W.A.; Worek, W.M. Solar Engineering of Thermal Processes, 2nd ed. J. Sol. Energy Eng. 1994, 116, 67–68. [Google Scholar] [CrossRef]
- Vandewalle, J.; D’Haeseleer, W. The impact of small scale cogeneration on the gas demand at distribution level. Energy Conver. Manag. 2014, 78, 137–150. [Google Scholar] [CrossRef]
- Solar District Heating Guidelines: Collection of Fact Sheets WP3–D3.1 & D3.2; Technical Report August; Steinbeis Research Institute for Solar and Sustainable Thermal Energy Systems: Stuttgart, Germany, 2012.
- Kalogirou, S.A. Solar Energy Engineering: Processes and Systems: Second Edition; Elsevier Inc.: Amsterdam, The Netherlands, 2014; pp. 1–819. [Google Scholar] [CrossRef]
- Jakob, M. INSPIRE-Tool. 2015. Available online: http://www.inspire-tool.ch (accessed on 1 August 2016).
- Rager, J.M.F. Urban Energy System Design from the Heat Perspective using mathematical programming including thermal storage. EPFL 2015, 6731, 193. [Google Scholar]
- Nussbaumer, T.; Thalmann, S. Influence of system design on heat distribution costs in district heating. Energy 2016, 101, 496–505. [Google Scholar] [CrossRef]
- Mauthner, F.; Herkel, S. IEA SHC Task52—Deliverable C1: Classification and Benchmarking of Solar Thermal Systems in Urban Environments; International Energy Agency: Paris, France, 2017. [Google Scholar] [CrossRef]
- Jenni Energietechnik. Preisliste Solarpakete und Energiezentralen; Jenni Energietechnik AG: Oberburg, Switzerland, 2014. [Google Scholar]



Publisher’s Note: MDPI stays neutral with regard to jurisdictional claims in published maps and institutional affiliations. |
© 2021 by the authors. Licensee MDPI, Basel, Switzerland. This article is an open access article distributed under the terms and conditions of the Creative Commons Attribution (CC BY) license (http://creativecommons.org/licenses/by/4.0/).
Share and Cite
Wang, D.; Carmeliet, J.; Orehounig, K. Design and Assessment of District Heating Systems with Solar Thermal Prosumers and Thermal Storage. Energies 2021, 14, 1184. https://doi.org/10.3390/en14041184
Wang D, Carmeliet J, Orehounig K. Design and Assessment of District Heating Systems with Solar Thermal Prosumers and Thermal Storage. Energies. 2021; 14(4):1184. https://doi.org/10.3390/en14041184
Chicago/Turabian StyleWang, Danhong, Jan Carmeliet, and Kristina Orehounig. 2021. "Design and Assessment of District Heating Systems with Solar Thermal Prosumers and Thermal Storage" Energies 14, no. 4: 1184. https://doi.org/10.3390/en14041184
APA StyleWang, D., Carmeliet, J., & Orehounig, K. (2021). Design and Assessment of District Heating Systems with Solar Thermal Prosumers and Thermal Storage. Energies, 14(4), 1184. https://doi.org/10.3390/en14041184


