1. Introduction
Disturbing climate changes have marked today’s world. They make global warming and its catastrophic consequences more evident day by day. To tackle this problem efficiently, the European Union (EU) has defined a set of ambitious targets to limit the increase in average global temperature. These include reducing greenhouse gas (GHG) emissions by 40% by 2030 and by 80–95% before 2050, compared to the 1990 levels [
1]. To achieve this target, the EU must effectively localize the source of emissions and look for alternatives to the current processes in a short period.
The main sources of GHG emissions in Europe are energy-producing industries, followed by fuel combustion by users (Fuel combustion by users (excl. transport): emissions from fuel combustion by manufacturing industries and construction, and small scale fuel combustion for space heating and hot water production for households [
2]), the transport sector, industrial process and product use (Industrial Process emissions occurring from chemical reactions during the production [
2]), and agriculture [
2]. In 2017, the CO
2 emission reduction of industrial processes was one of the top priorities in Europe’s emission reduction strategy. The contribution of this sector for the EU-28 was reported as 9% of total emissions in 2017 [
3].
However, for Austria the industrial sector accounted for 21% of GHG emissions caused by production processing [
4] and 28% of the total final energy consumption, respectively [
5] in 2017. This was one of the motivations for the creation of NEFI (
www.nefi.at, accessed on 21 January 2021) (New Energy for Industry), a consortium of Austrian companies, research institutes, and public institutions. One of the objectives of NEFI is to provide an integrated approach to profound decarbonization pathways for the energy system in Austria, driven by a transformation of the industrial sector towards being sustainable, efficient, and a low-carbon economy. The present work seeks fulfillment of this objective for the pulp and paper industrial sub-sector.
The pulp and paper sector (P&P) is one of the oldest and most significant industrial sectors in Austria, and accounted for 0.89% of the Austrian gross domestic product (GDP) in 2017 [
6,
7]. The process of paper production consists of three stages, each of which has several sub-processes and can take different routes. This makes the sector very complex and energy-intensive, ranking it the highest final energy consumer in industry, by approximately 20 TWh in 2017 (corresponding to 23% of total final industrial energy use). [
5] The P&P sector is also responsible for 7% of industrial emissions, and can play an essential role in the decarbonization of the Austrian industrial energy system. Although the sector has started to reduce CO
2 emissions, by 20% in the last decades [
8], due to improvements in energy efficiency (e.g., waste heat recovery) and the reduction of fossil fuel consumption (from 58% in 2000 to 40% in 2017 [
9]) by replacement with biofuels (mostly black liquid), a significant emission reduction potential still exists.
1.1. State of Research
In recent years, many studies have started to consider the potential for reducing energy consumption and the options for cutting CO
2 emissions in the pulp and paper industry. The Joint Research Centre (JRC) prepared a report by Moya and Pavel in 2018 [
10]. They predicted a 1.1% increase in the European P&P sector’s energy consumption and CO
2 emissions of 4.8% in 2050 compared to 2015 without technological updates. Their analysis, using a bottom-up model, showed that the application of the best available technologies in papermaking could lead to a 14.4% reduction in energy consumption in Europe, resulting in a 62.2% reduction in CO
2 emissions due to the contribution of technological improvement. Most of the energy improvement came from the integration of state-of-the-art technologies into new equipment, such as heat recovery, black liquor gasification, and highly efficient appliances. However, most CO
2 savings were due to the conversion from fossil fuels to biofuels and the use of new technologies.
In 2012, Fleiter et al. [
11] investigated the diffusion of 17 process technologies for improving energy efficiency and resulting CO
2 reduction for the German pulp and paper sector up to 2035 using a techno-economic approach. Based on their results, electricity and fuel consumption in 2035 would be reduced by 16% and 21%, respectively, in the techno-diffusion scenario compared to the frozen efficiency scenario. This energy-saving could reduce CO
2 emissions by 19%. They stated that the most impressive technologies are waste heat recovery in paper mills and new paper drying technologies. Several other energy-saving technologies were not included in the study. They concluded that a significant potential for saving still exists, especially if the system boundaries extend across the enterprise level.
P. Griffen et al. [
12] conducted a study on the decarbonization of the P&P sector in the UK in 2018. They believe that the P&P sector is a heterogeneous sector with a wide range of product outputs, and lies roughly on the borderline between energy-intensive and nonenergy-intensive industrial sectors. They developed a series of low carbon technology roadmaps based on various alternative scenarios for the UK paper sector. The results of their study indicate that achieving a significant reduction in GHG emissions in the long term will depend on the adoption of some key technologies such as heat recovery techniques, energy efficiency improvements, use of bioenergy, and electrification (besides the decarbonization of grid electricity). Based on their assumptions, under a reasonable action scenario, the sector’s total greenhouse gas emissions would decrease by about 80% over the period 1990–2050 through the installation of all efficiency technologies by 2025 and the replacement of retired equipment with the best practice by 2030.
The Confederation of European Paper Industries (CEPI) [
13] has been working to develop a roadmap for the transition to a competitive low-carbon economy in 2050. CEPI aims to reduce CO
2 emissions by 80% compared to 1990, and cut CO
2 emissions to 12 million tons (10 million tons direct), compared to 49 million tons (32 million tons direct) in 2015. CEPI also has a goal to reduce energy demand in the wood fiber industry by 20% and to increase product value by 50% by 2050, compared to the 2010 benchmark, using improved energy efficiency, fuel switching, and demand-side flexibility. They introduced a group of breakthrough technologies that can reduce CO
2 emissions in various areas from 20% (e.g., deep eutectic solvents technology) to 100% (100% electricity technology). These were presented in the report “Two Team Project”.
1.2. Open Research Questions and Structure of This Paper
The previous section provided the current state of research that considered energy consumption and carbon emission reduction potential in the P&P sector. However, there are still some less addressed topics in the literature, which are discussed in this paper:
An energy flow Sankey diagram and allocation of the total, final and useful energy consumption
A bottom-up model for energy efficiency and CO2 reduction potential for various P&P products and the sector as a whole
A comprehensive technology overview by considering the best available technology (BAT) and innovative technology (IT)
A bottom-up technology model and analysis of high-impact technologies toward the climate goal.
To tackle the mentioned issues, this work considers the Austrian pulp and paper sector as a case study, and the possibility of decarbonization by 2050 is evaluated based on the following steps.
In
Section 2, an extensive literature review was made on the main processes and the state of the art in the industry, emphasizing the energy consumption of each step. In this section, the current situation of the Austrian P&P sector is also examined in terms of CO
2 emissions and energy consumption.
Section 3 describes the methodology for model development to calculate CO
2 emissions and energy consumption at the process level for the different types of pulp and paper production. The model is based on a technology-based linear bottom-up approach, and will also be used in the next section to analyze decarbonization paths.
Section 4 evaluates the opportunities and challenges of reducing carbon dioxide (CO
2) and industrial energy demand in the Austrian P&P sector. In this section, based on the literature review, a technology database is presented in two groups: BAT and IT. Six promising technologies are selected from the database and explained with further details for the Austrian case. Subsequently, in
Section 5, the technology-specific information is integrated into the bottom-up model to evaluate the decarbonization pathways and scenarios. The impact of energy efficiency and the emission reduction potential of each technology on the sector is investigated through six individual scenarios. Finally,
Section 6 presents the conclusions of the most important results. These findings help to identify the steps that need to be taken by experts and policymakers to ensure the decarbonization of the Austrian paper sector.
2. The Pulp and Paper Industry
2.1. Structure of Pulp and Paper Sector
The paper industry is one of the most expressive industries globally, producing over 400 million tons of paper per year [
14]. Pulp and paper mills are highly complex, and involve various process steps, including wood preparation, pulp production, chemical recovery, bleaching, and papermaking, to transform the wood into the final product [
15]. Paper mills can be fully integrated or non-integrated mills. Integrated mills include a pulp mill and a paper mill on the same site. These types of mills receive logs or chips and produce paper.
In contrast, non-integrated mills produce pulp and paper in separate mills. The non-integrated paper mill uses dried pulp as the feedstock for paper production. The dried pulp is produced in integrated mills or non-integrated pulp mills and sold on the open market. Integrated mills are usually larger, more cost and energy effective, and have cheaper production than separate mills. Nevertheless, smaller non-integrated mills can strategically benefit from being closer to the consumer.
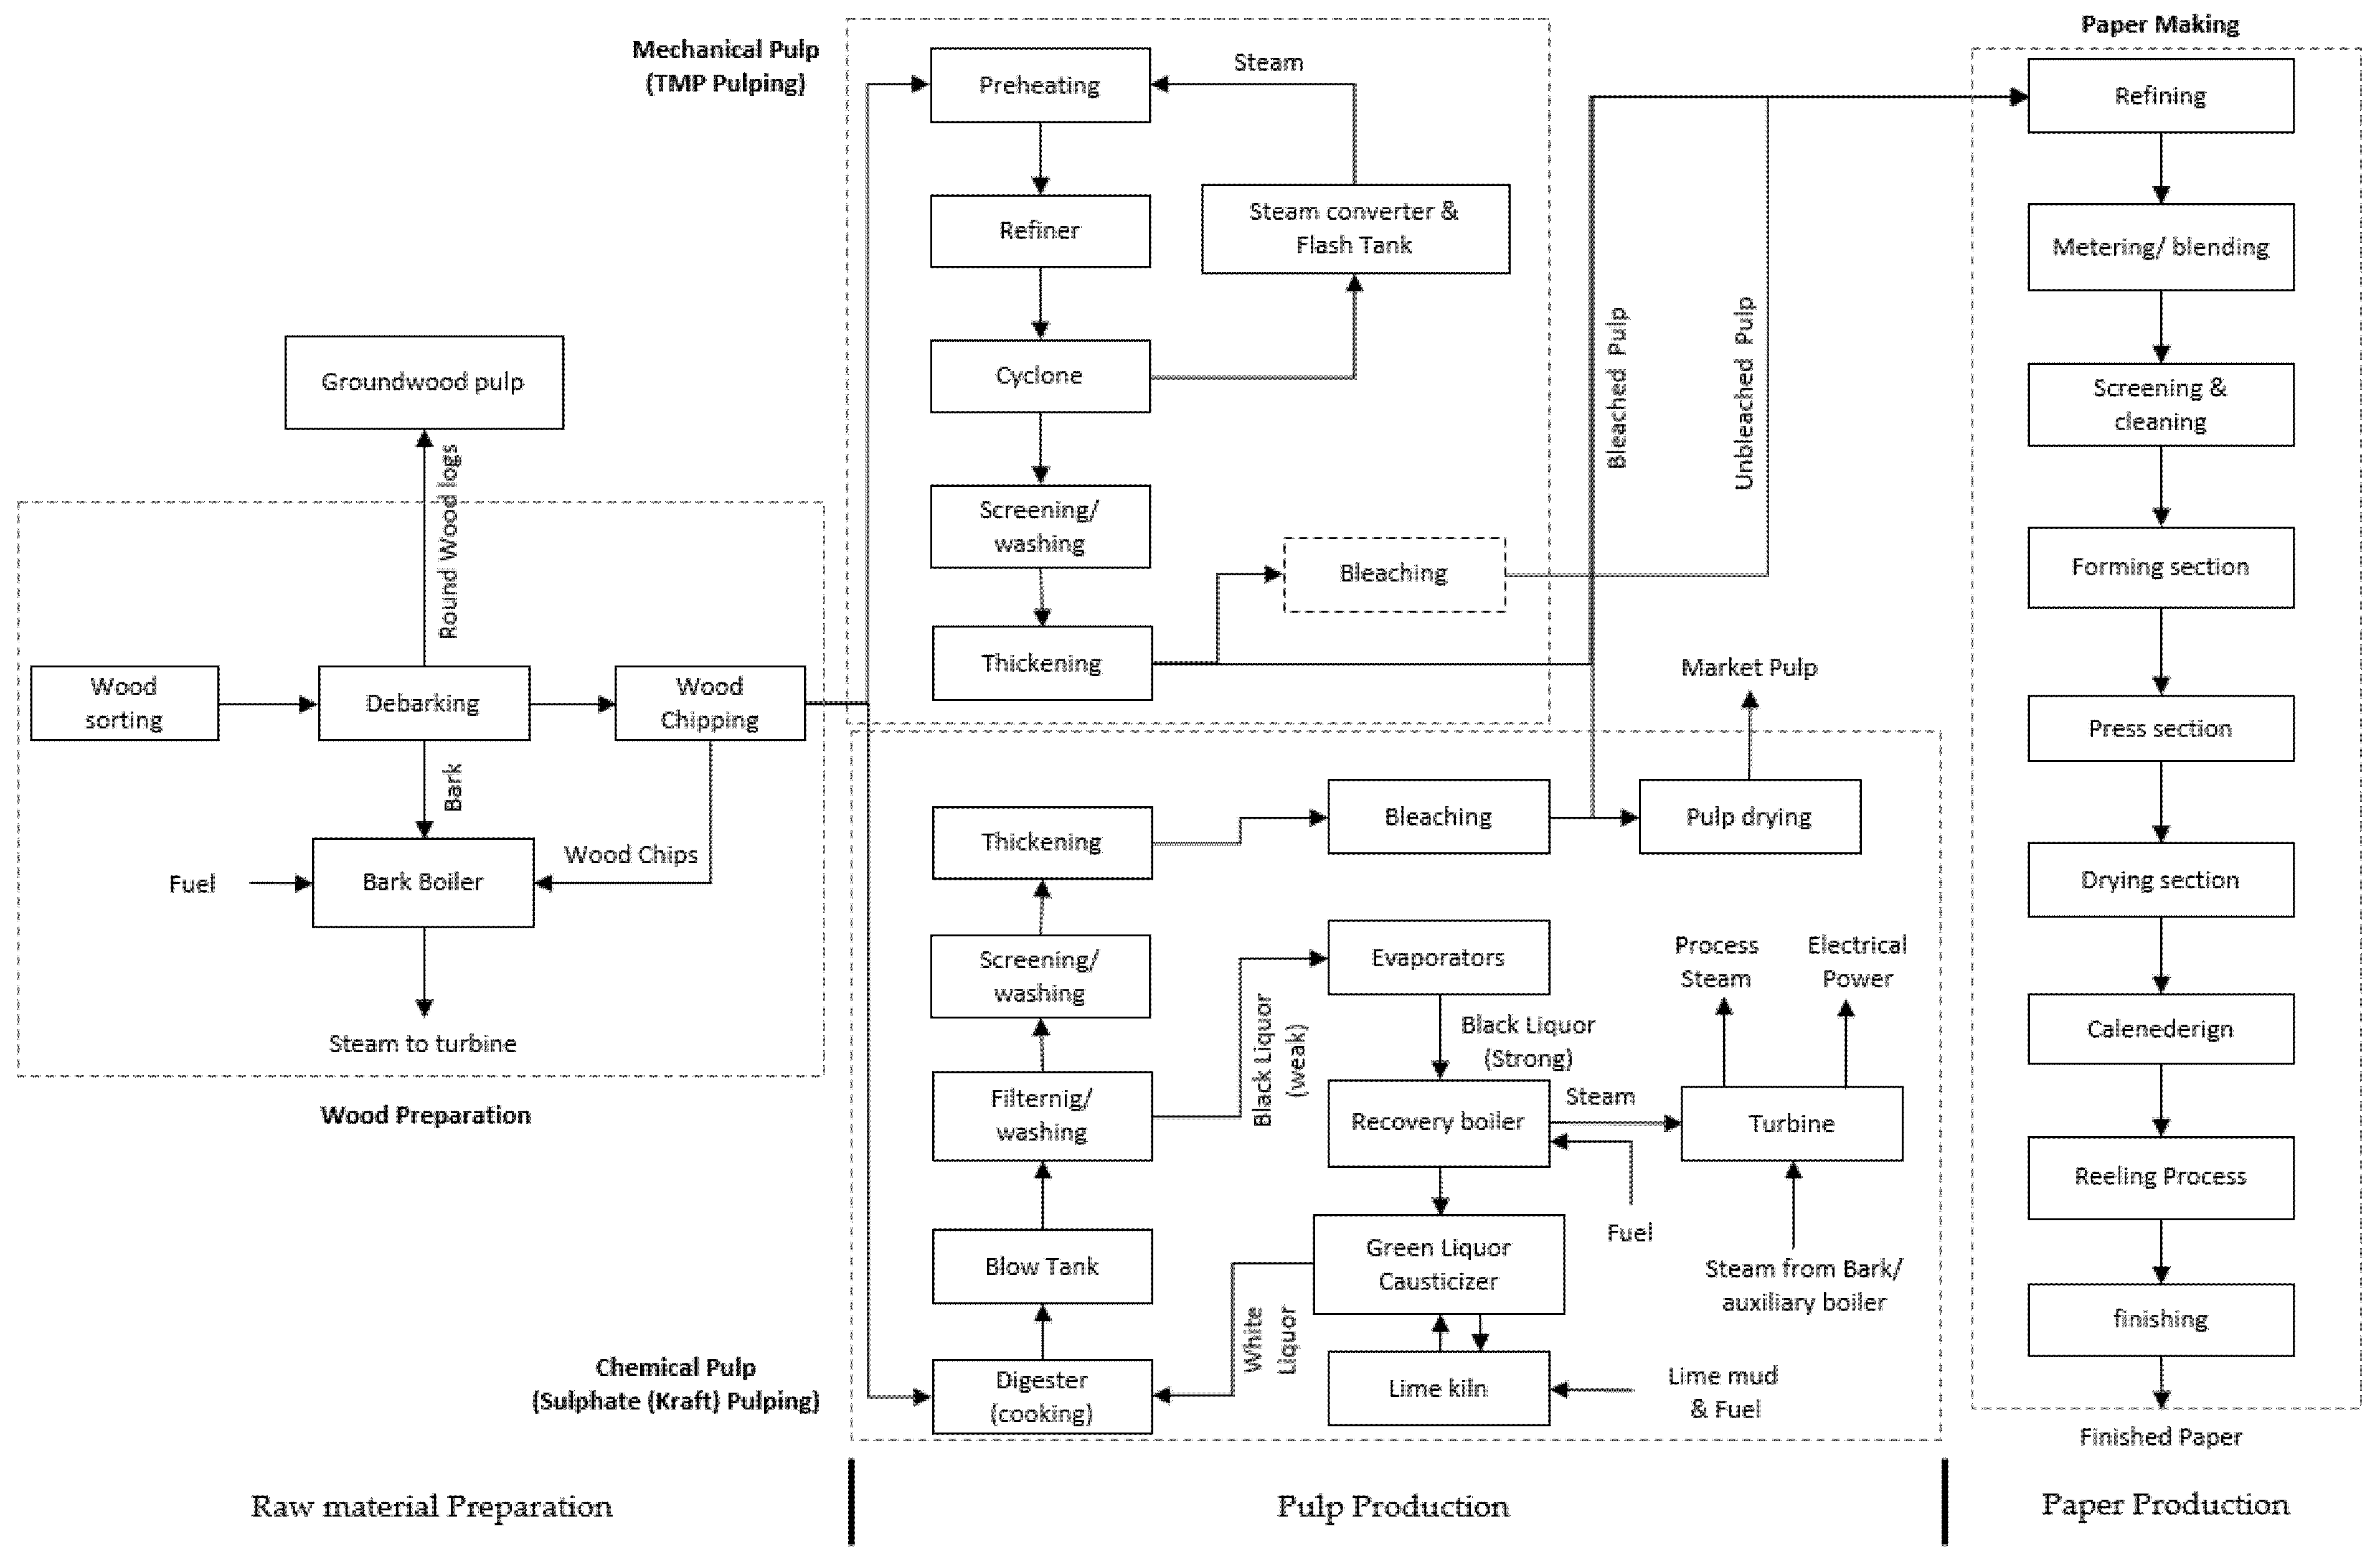
Figure 1 shows the main process steps in the integrated paper mill for the two most common steps of pulping (thermomechanical pulping (TMP) and sulphate (kraft) pulping and paper making [
16,
17].
2.1.1. Raw Material Preparation
Wood is the primary raw material for the production of pulp. Wood comes to the mill in the form of long raw logs (with bark) in the wood yard. The main processes in the raw material preparation are debarking the wood logs to remove the bark, wood chipping (which reduces the wood logs to small chips), and screening to ensure that the wood chips are the right size for further processing. In general, the wood yard operations are independent of the type of pulping process [
15].
The two major products resulting from the raw material preparation process are chips and bark. The chips are the main product. Their quality is of high importance, as the consumption of raw material increases if the chips produced are not homogeneous. Furthermore, a homogenized chip distribution improves the energy efficiency of the system. Another main product is the bark, which is the by-product and is typically used as fuel in the burner for energy production, or can be sold for other purposes off-site [
15]. Raw material processing consumes roughly 10% of electricity use [
15]. The main energy consumers are conveyor motors, debarking operational motors, and wood chipping motors (see
Table 1). Thermal energy is only needed in some mills in cold climates, where the logs have to be de-iced with hot water before debarking [
16].
2.1.2. Pulp Production
The second step in paper processing is the production of pulp from raw materials (virgin wood or recycled fibers). Wood is usually composed of about 60–65% cellulose and hemicelluloses, the paper’s main fibrous components [
15,
19]. The remaining material mass consists mostly of lignin, with small amounts of extractives and ash. The fundamental aim of the pulping process is to release the fibers from the lignin that holds the fibers together in the wood. Typically, wood is composed of about 50% fiber, 20 to 30% non-fibrous sugars, and 20 to 30% lignin [
15,
17]. In the pulping process, wood chips are separated into individual cellulose fibers by removing the wood lignin [
15,
17]. The pulp is produced by three main methods: mechanical, chemical, and recycled fiber (RCF) pulping (There are another types of pulp production, semi-chemical, dissolving, and non-wood pulp, which are not considered in this paper).
Mechanical pulp: the primary form of pulping is mechanical pulping, which has been extensively replaced by chemical pulping. Mechanical pulping processes separate the fibers from each other by mechanical means, retaining part of the lignin in the paper and increasing the yield (mass of pulp/mass of original fiber source) to around 85–90%.
The main kinds of mechanical pulping are the production of groundwood pulping (GW), refiner mechanical pulping (RMP), thermomechanical pulping (TMP), and chemithermomechanical pulping (CTMP). Two main techniques are used to produce mechanical pulping: pressing logs against a rotating grindstone for GW pulping, and feeding the wood chips between metal finishing discs and defibrating them for RMP, TMP, and CTMP. Typically, mechanical pulp is used for low-grade paper such as newsprint and magazines, the fibers with this pulp type are short and weak, and sometimes need to be combined with strong chemical fibers (especially for GW). The main energy source for mechanical pulp is electricity, which is usually converted into heat that can be partially recovered and used in other processes. However, some types of pulp (TMP, CTMP) use steam on the wood chips before they are used in the equipment (see
Table 2) [
15,
17].
Chemical pulp: The most common pulping process is chemical pulping, divided into two types: kraft (sulphate) pulp and sulphite pulp. In both types, the digester processes the raw material with watery chemical solutions at high temperatures and high pressure to extract pulp fibers.
Kraft pulp is the most common kind of chemical pulp, accounting for about 80% of the world’s pulp production. As illustrated in
Figure 1, for kraft pulp, the wood chips are mixed with a strongly alkaline solution known as white liquor, which includes sodium hydroxide and sodium sulfide, in the batch or continuous digester for several hours under high pressure and high-temperature (155–175 °C) conditions [
17]. After the cooking step in the digester, the hot pulp is transferred under pressure to the blow tank, where softened wood chips decompose into fibers or pulp. Then, in the next stage, in the filtering and washing step, the pulp and the cooking liquor, which is called black liquor, are separated. During the cooking process in the digester, almost half of the wood is not solved, and as a result, black liquor includes organic and inorganic substances. In the next step, black liquor is sent into the chemical recovery system to recover the cooking chemicals and energy.
Chemical recovery is an essential part of the chemical pulping process. The chemical recovery system by evaporating the water content of the black liquor in the recovery boiler, on the one hand, recovers the white liquor (by causticizing the green liquor with lime (
Figure 1)) and, on the other hand, generates high-pressure steam. The white liquor is returned to the digester, and the steam is used in the heat and power plant (CHP) to generate the process steam (medium-low pressure steam) and electricity. In most cases, the recoverable black liquor’s fuel value is sufficient to make the kraft pulp mills largely self-sufficient in heat and electrical energy. Chemical recovery also offers the mill regeneration of chemical digestion at a rate up to 98%, which leads to a significant reduction in the costs of purchasing process chemicals and energy [
15,
17].
The production of sulphite pulp is not so common compared to the production of kraft pulp. Pulp produced by sulphite pulp usually has weaker strength properties compared to kraft pulp, although sulphite pulp offers other advantageous properties for some specialty pulp applications (such as textile production). In the sulphite pulping process, the wood chips are digested with the cooking liquor, an acidic mixture of sulphurous acid and bisulphite ion. The acidic solution in the cooking liquor leads to a decomposition of the lignin bonds between the wood fibers. Like the kraft pulp, energy can be recovered in the sulphite process, and the solvent can be regenerate. Due to sulfite pulp’s lower color content, it can be bleached more easily than kraft pulp, but it is not as strong [
15,
17].
In total, chemical pulping has a low fiber yield, in the range of 40–55%, compared to mechanical pulping, but the pulp produced is of very high quality and is mainly used to produce higher-grade paper, such as office paper. Nowadays, chemical pulp consumption has grown because the demand for printing and writing paper is increasing. In contrast, due to the rising use of social media, newsprint consumption has decreased, causing a reduction of mechanical pulp demand [
15].
Recycled fibers pulp (RCF): this type of pulp production requires a more straightforward process than the pulping of virgin wood, and consumes less energy than the other types. The main step in RCF pulping is to dissolve the shredded paper in hot water by mechanical means to separate the fibers without damaging and destroying them. For paper grades requiring white pulp, an additional step of de-inking takes place. Recycled fiber pulp is also subjected to mechanical removal of impurities. In some pulp mills, recycled fiber and virgin fibers are used together, and recycle fiber is added to the virgin (wood) pulp [
15].
After the pulp has been produced by mechanical, chemical, or RCF processes, the pulp is washed and screened to remove impurities such as remaining pieces of wood and uncooked chips that have not been properly pulped. In the final step, depending on the product’s end-use, bleaching is applied to give the pulp a white color by adding chemical components. This is not an essential process and is only applied to paper types that require good optical properties: graphic paper, whiteboard, etc. An additional drying step is required when the pulp and paper mills are not in the same location (non-integrated mills). The pulp drying process is energy-intensive and not significant for the paper manufacturing process. Therefore, cost and energy savings can be achieved by integrating the pulp and paper mills.
2.1.3. Paper Production
After pulping, the bleached or unbleached pulp is transferred to the papermaking process. In most paper mills, more than one type of pulp is used to obtain paper with the desired properties. The pulp is delivered in the form of a fiber suspension to integrated mills or in dry form (10% moisture content) to non-integrated mills. First, the pulp undergoes preparation steps to ensure that it is delivered to the paper machine in the best condition, such as fiber slurry (dissolving in a suspension), blending of different pulps, or refining (to change the morphology of the fibers). Other processes such as cleaning or screening can be used to achieve a better paper quality, depending on the pulp’s conditions. Paper fillers may also be added to the pulp. Mineral fillers are used to reduce pulp consumption and change the properties of the paper produced, or chemical additives are added to improve quality and optical properties, such as texture and brightness.
After the stock preparation steps, the pulp is fed into the paper machine through the headbox. In the paper machine, the paper is formed, and most of the paper’s properties are established. The paper machine is a large dewatering device consisting of a headbox, a wire section, a press section, and a dryer section [
17]. The headbox aims to produce a homogeneous distribution of the fibers over the papermaking process’s entire width to achieve uniform paper formation. In the wire section (forming section), pulp with a fiber content of about 0.5% to 1% [
17,
23] is introduced and supported by a single/twin-wire, then the water is removed from the bottom side by gravity or other elements, and the pulp leaves the section with a fiber content of 15–20% [
17]. After that, the formed paper, which is still very week, enters the press section. In this section, the paper web is passed through a set of rollers to remove water and increase the fiber content to 45–50% [
17,
23]. The remaining water is then removed from the paper in the drying part, and the fiber content is increased to 90–95% [
17]. Drying is normally carried out with steam-heated cylinders enclosed in a hood. The dryer section consumes a large amount of energy in the form of steam (see
Table 3 for the dryer section’s energy consumption for each paper type). However, all paper mills have installed heat recovery systems in the drying section to utilize the exhaust air (generally with the temperature 80 to 85 °C and humidity 140 to 160
) and recover it in a heat exchanger [
17].
Afterward, the paper can be subjected to finishing processes, namely coating and calendering. Coating is the application of chemicals to the paper to give it superior surface properties. It is only applied to some types of paper. The drying process can be divided into pre-coating drying and post-coating drying when the coating is needed. The calendering process consists of running the paper through a set of rolls, increasing surface smoothness, and improving its appearance. Finally, the paper is rolled and stored for delivery to market.
While pulping (i.e., chemical peeling) is more energy self-sufficient, the energy needed for papermaking must be supplied from the grid.
2.2. Austrian Pulp and Paper
2.2.1. Overview of the Pulp and Paper Sector
Today, more than 90 million tons of paper are produced in about 900 pulp and paper mills in the EU [
24]. With around 5 million tons of paper in 2017, Austria accounted for 5.3% of EU paper production [
24]. The Austrian P&P sector consists of 21 companies with 24 mills [
9]. According to the Association of the Austrian paper industry (Austropapier (
https://austropapier.at/unternehmen, accessed on 30 November 2020)), the paper manufacturers’ production capacity and structure are not particularly equal. The three largest companies account for more than one-third (39% or 2280 kilo tons) of the annual production (pulp, market pulp, and paper). Eleven medium-sized mills account for 54% of total production, and the remaining smaller mills have a low production capacity of less than 7% (426 kilo tons) [
25]. About 25% of pulp and 88% of paper production is exported, mainly to European countries such as Germany, Italy, and Slovenia [
9].
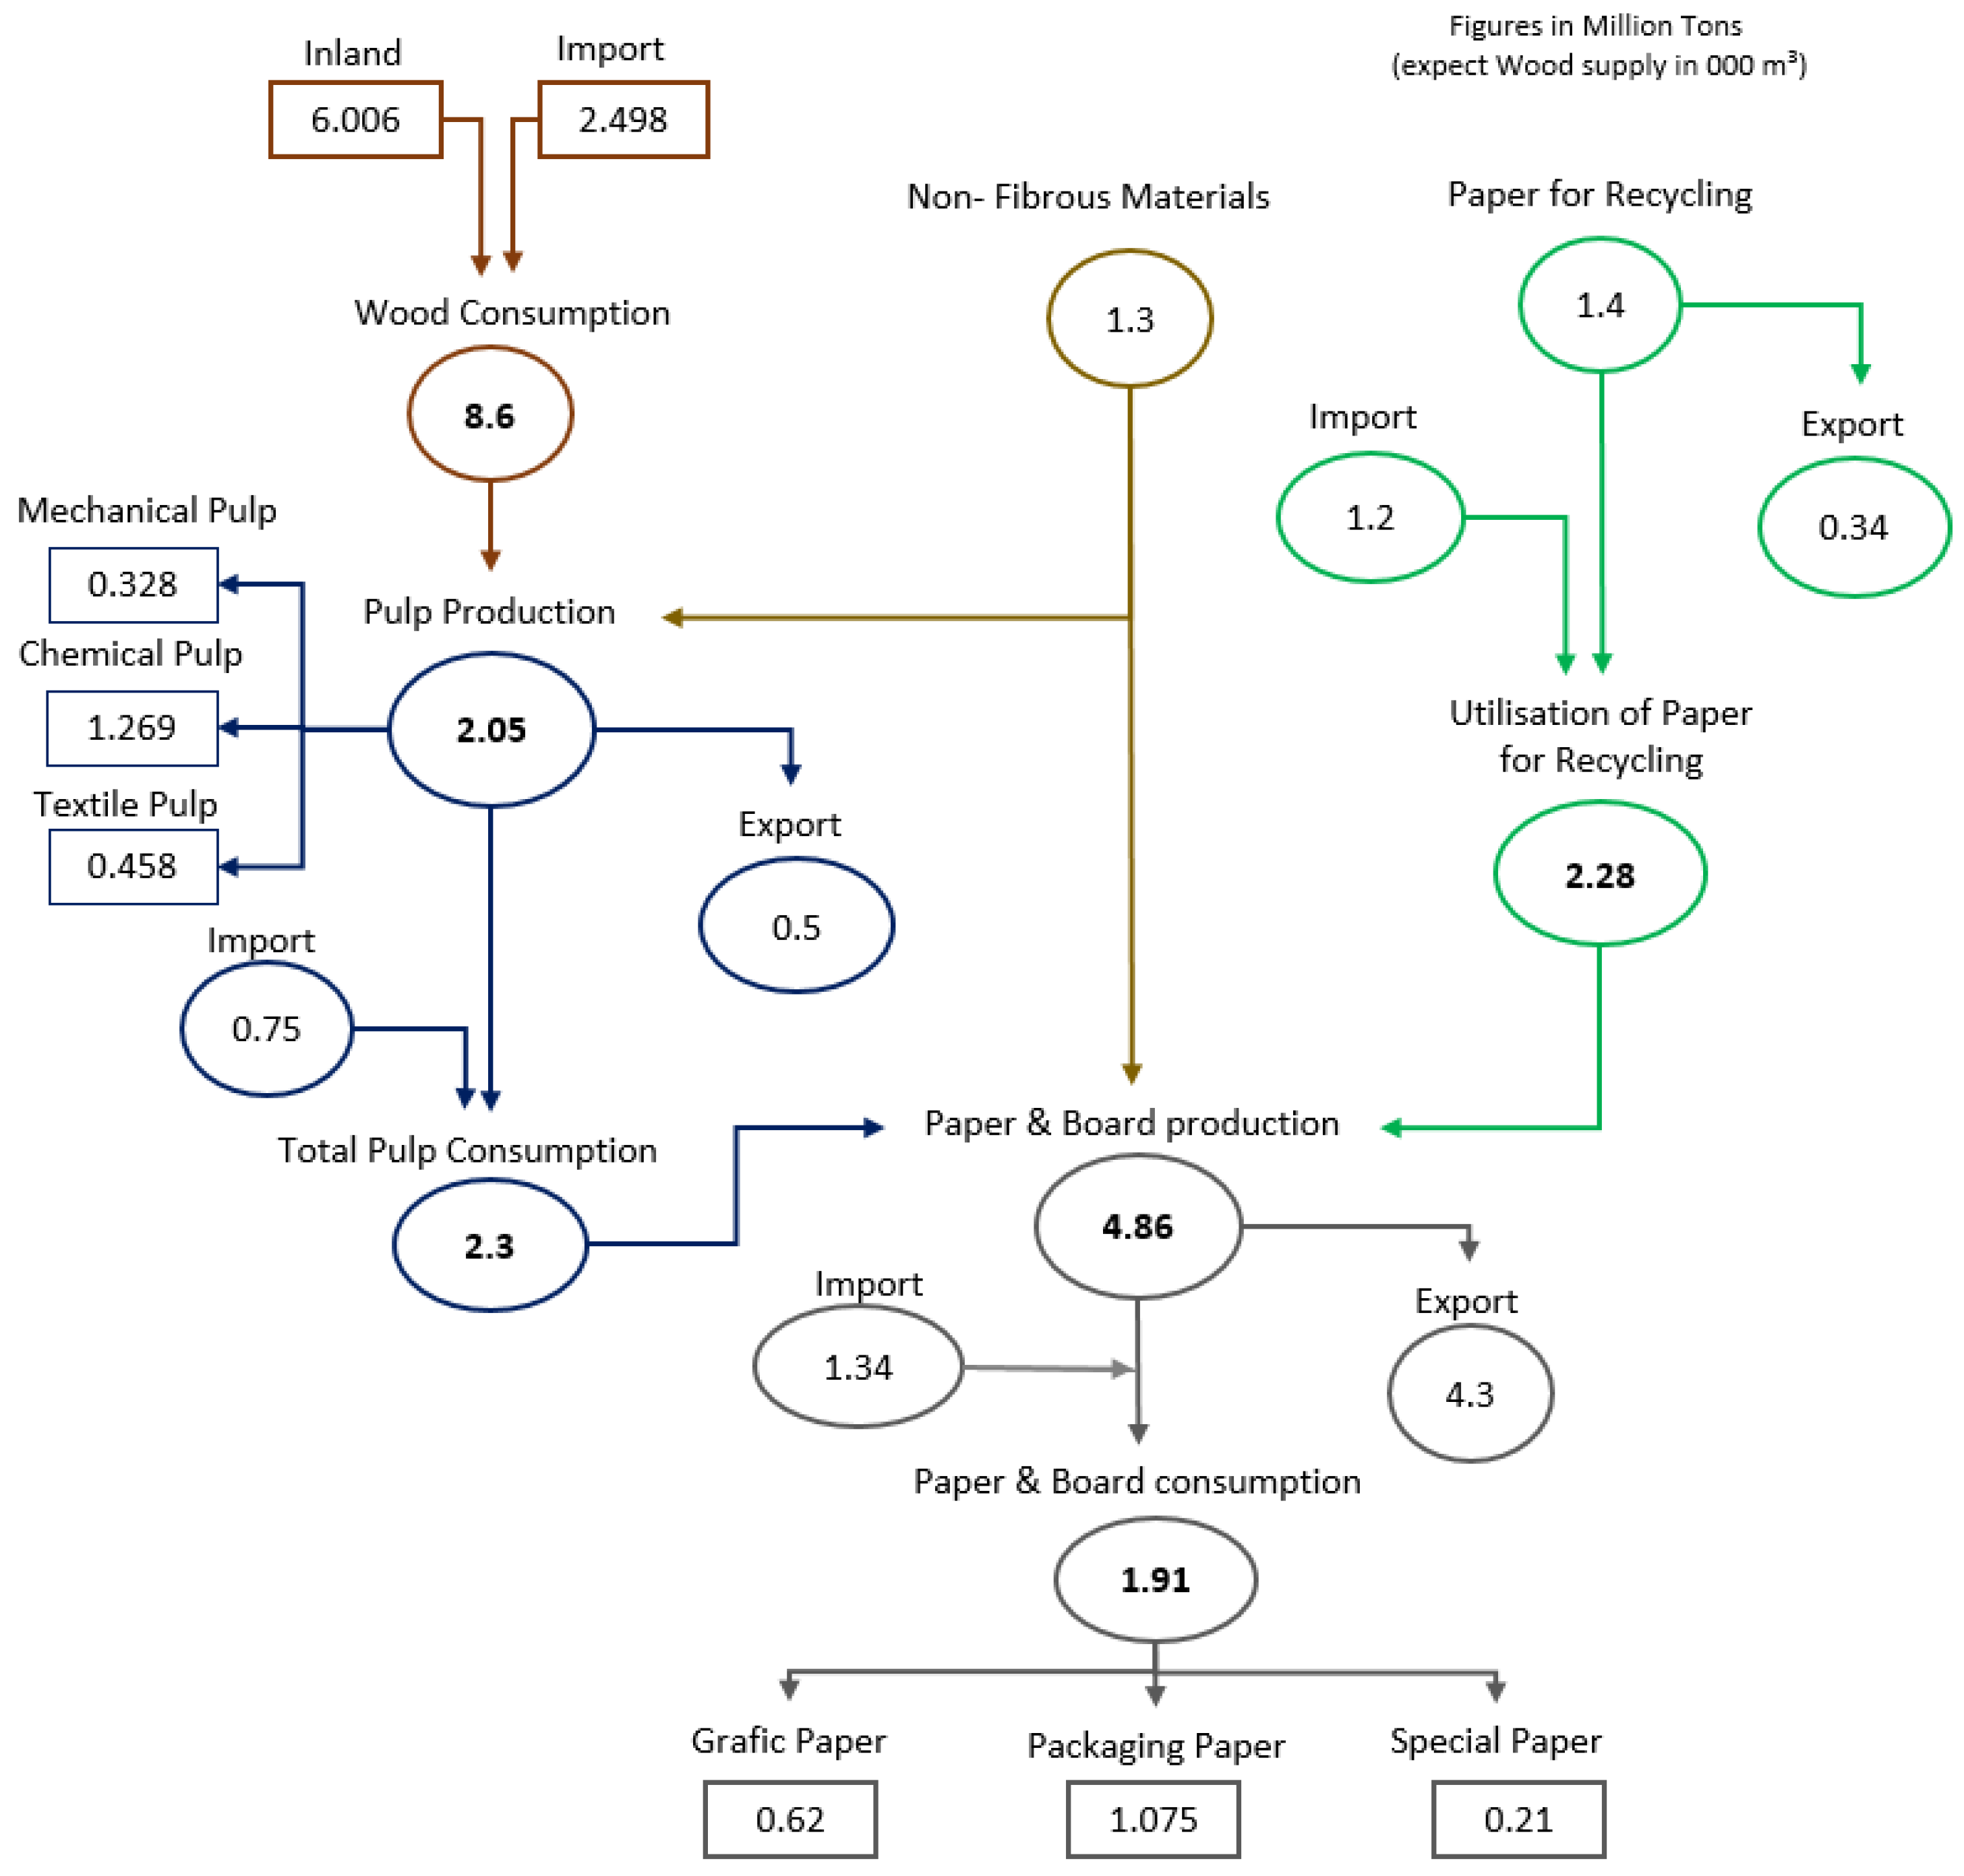
The production processes of pulp and paper are quite heterogeneous: approximately 51% of the total pulp is produced from raw wood using mechanical (16%), chemical (62%, (approx. 75% kraft pulp and 25% sulphite pulp [
14])), and textile (22%) pulp, and the rest of the pulp is RCF pulp from (de-inked and non-deinked) recovered paper (The paper recycling rate was 74% in 2017 in Austria [
9]). Paper production is also divided into graphic paper (53%), paper and board for packaging (41%), and special types of paper such as sanitary and beverage labels (6%) [
9]. Based on the Austropapier data from 2017,
Figure 2 prepares a general description of the pulp and paper sector’s material flow and sectoral production activities.
2.2.2. Energy Use and Emission Impacts of Paper Production
As mentioned in the previous sections (
Section 2.1.1,
Section 2.1.2 and
Section 2.1.3), paper production is an energy-intensive process and requires energy input in the form of heat and electricity. Heat is typically consumed as high-pressure steam in turbo generators to produce electricity. The heat is then extracted to medium and low-pressure steam for utilization in production processing, such as wood chipping, pulp production, heating of cooking liquor in chemical pulping, evaporating water from the pulp, and paper sheet in the dryer section, etc. [
15]. In Austria, the paper sector is the largest industrial final energy consumer, with a consumption of 23%, which corresponded to 20 TWh of the total industrial final energy consumption in 2017. This amount of final energy is consumed for steam generation in the drying and separation processes (73.5%), industrial furnaces (3.1%), electric motors (20.1%), and space heating (2.5%) [
26].
In total, the sector utilized 4.532 TWh electricity and 11.3 TWh steam as useful energy [
9] for the production of pulp and paper. About 75% of this energy is used in papermaking processes (67% in the drying section [
15]), 10% in chemical pulping, and 4% in mechanical pulping processes [
27]. However, the Austrian P&P sector is equipped with local heat and power generators, especially in integrated paper mills and chemical pulping mills. The biofuel obtained from chemical pulping, mainly black liquor, and bark and wood wastes are used in the cogeneration plants (CHP) and generate the main part of the electricity demand, approximately 2.856 TWh, corresponding to 63% of the total electricity demand in 2017, through the use of high-pressure steam in turbines (about 5% of this electricity is produced by on-site hydropower plants) [
9]. Subsequently, the steam output at medium/low-pressure is applied to production processing, making the sector completely self-sufficient in terms of steam generation. The excess heat and electricity are also fed into the grid [
9]. Based on Austropapier [
9] and Statistics Austria data [
5,
28,
29],
Table 4 presents a clear distribution of energy consumption (total, final, and useful), energy self-production, and system self-sufficiency in the year 2017.
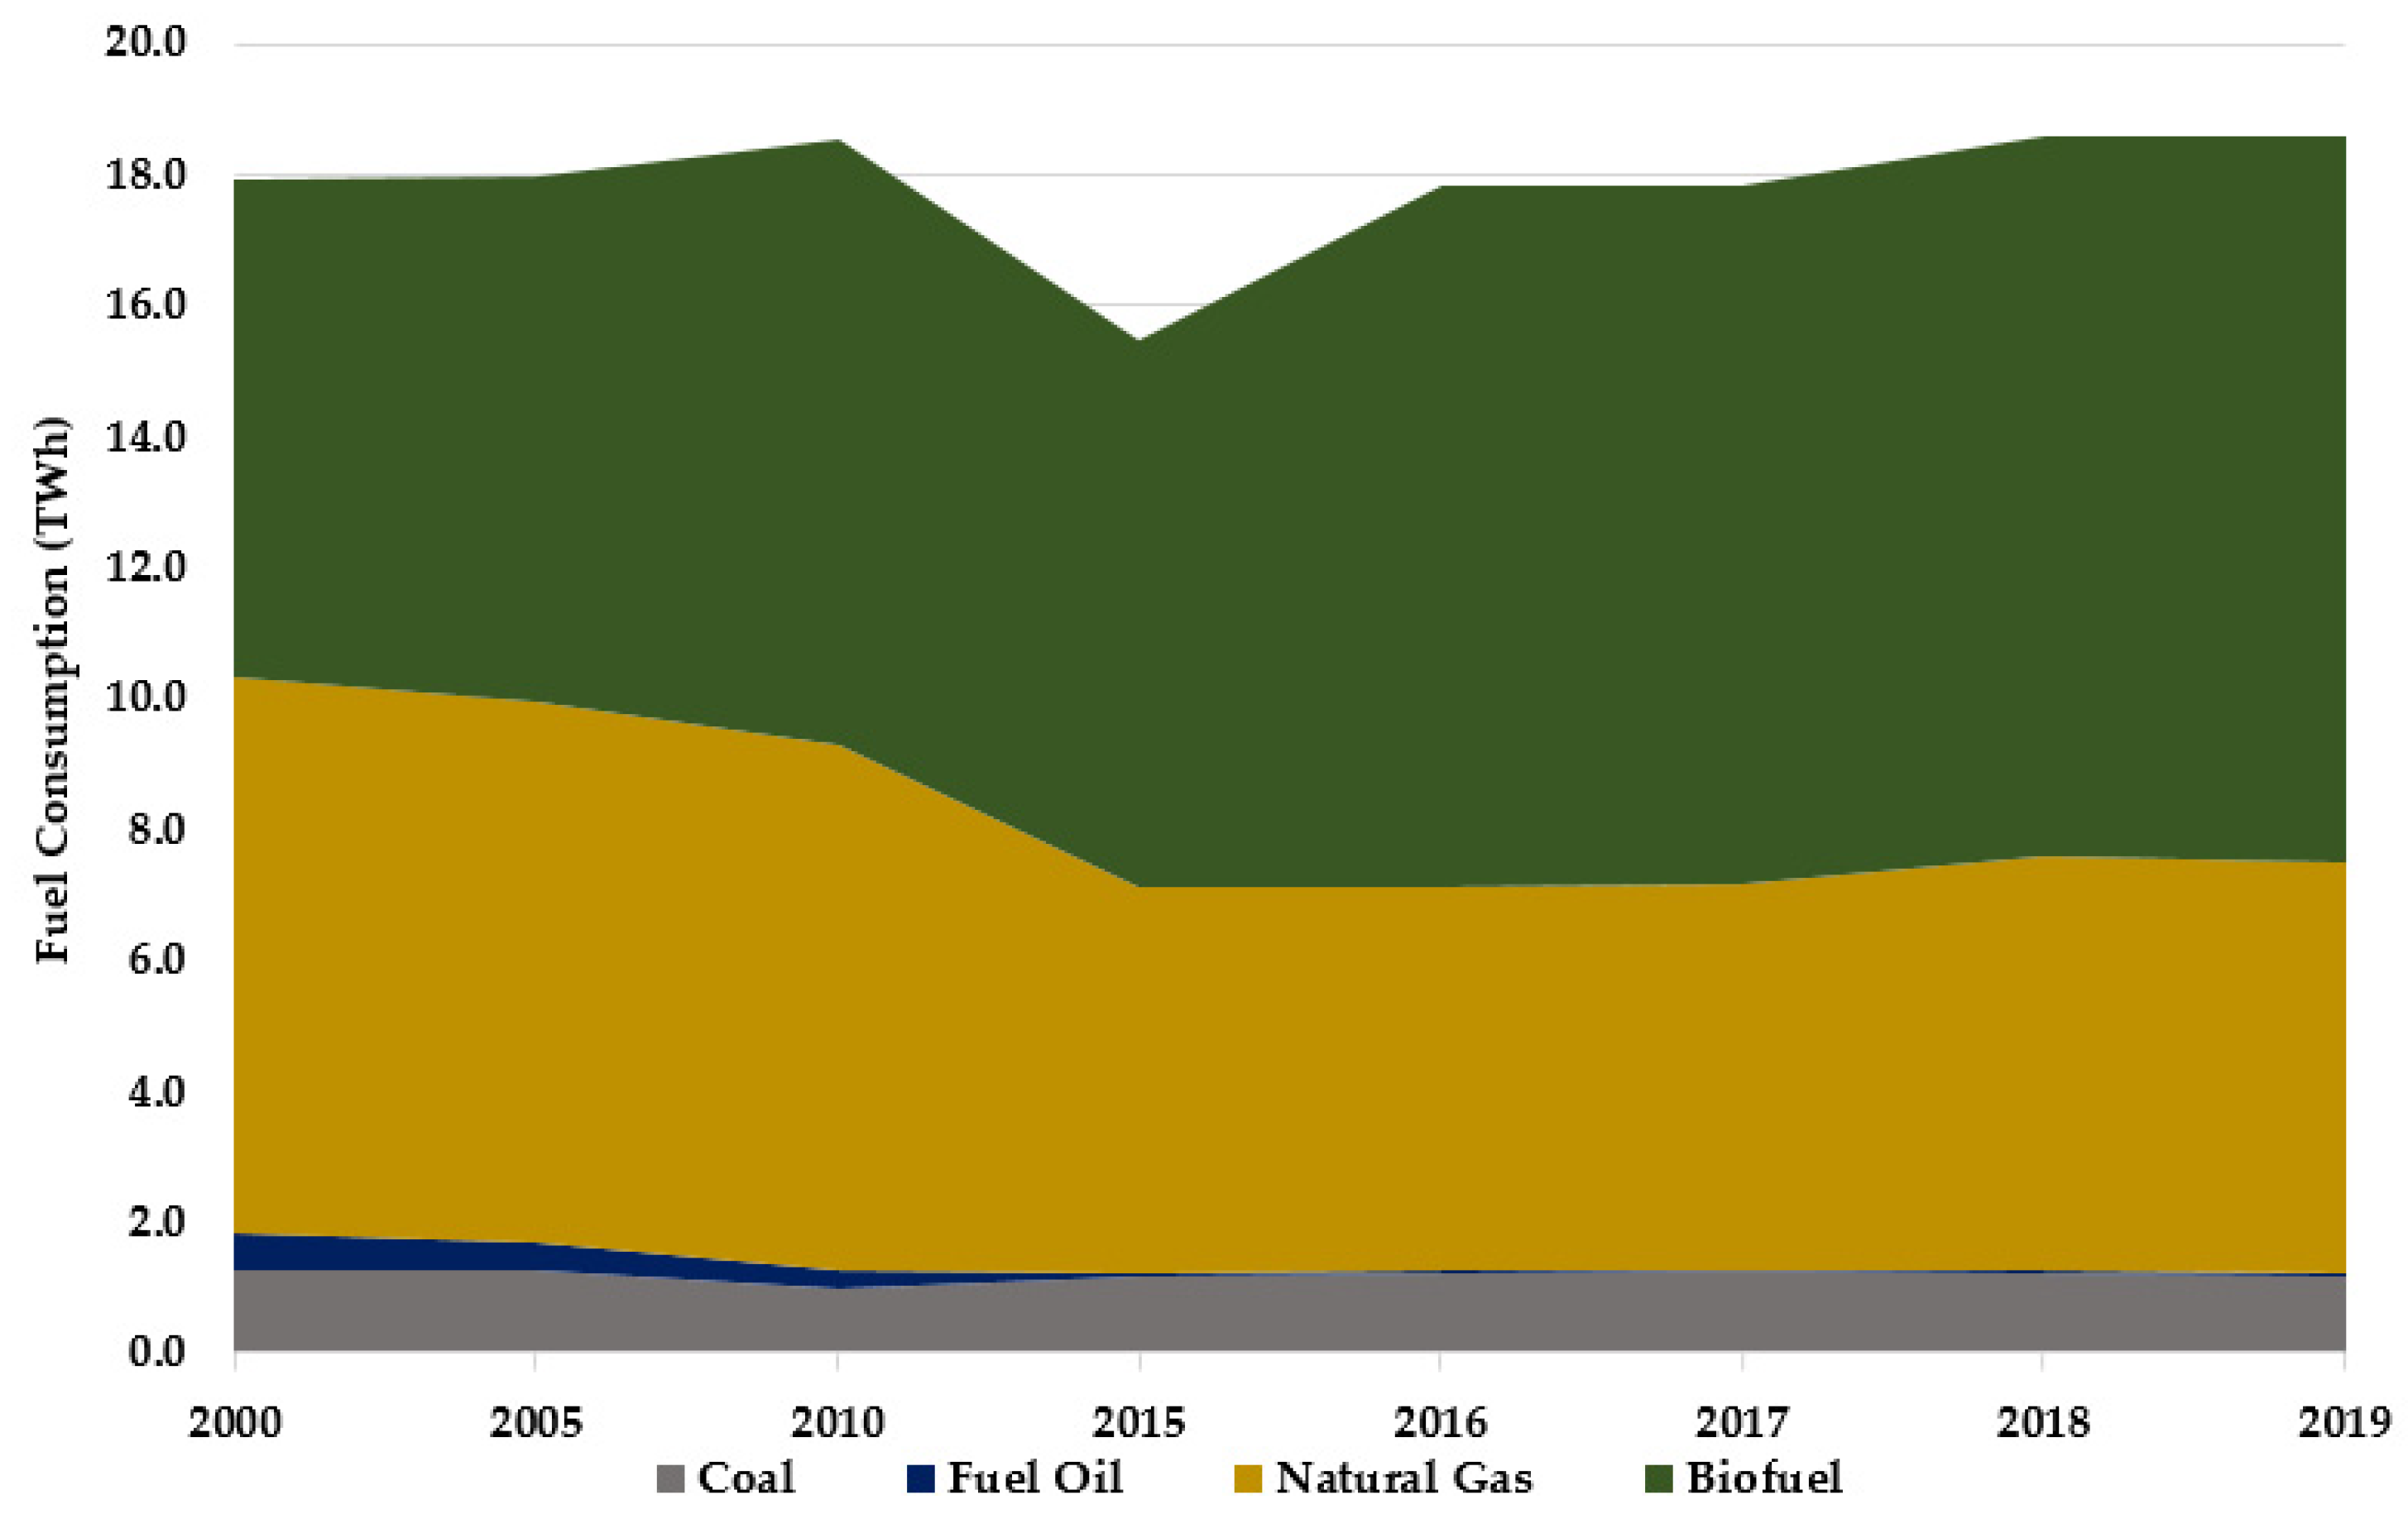
As shown in
Table 4, a large amount of fuel is required to generate energy (heat and electricity). In 2017, the total fuel consumption was 18 TWh, of which about 40% was fossil fuels (e.g., coal, oil, natural gas) and 60% was biofuels (e.g., bark, sludge, and black liquor) [
28,
29]. The use of more renewable energy and biofuel instead of fossil fuel energy to reduce the fossil fuel CO
2 emission is a priority of Austrian climate and energy policy. The Austrian P&P industry has also followed this policy [
9,
30]. The pulp and paper industry, on one hand, is a significant energy consumer, but on the other hand, it is a source of energy production, by producing black liquor and waste wood as biofuel during the production processing. Hence the industry has decided to use more inside-produced biofuels instead of fossil fuels.
This can be seen in the historical development of fuel consumption in the sector from 2000 to 2017 in
Figure 3; it is evident that the energy source has changed significantly. While fossil fuel consumption decreased dramatically from 60% in the year 2000 to 40% in 2017, the share of and biofuel increased from 40% to 60% during this time.
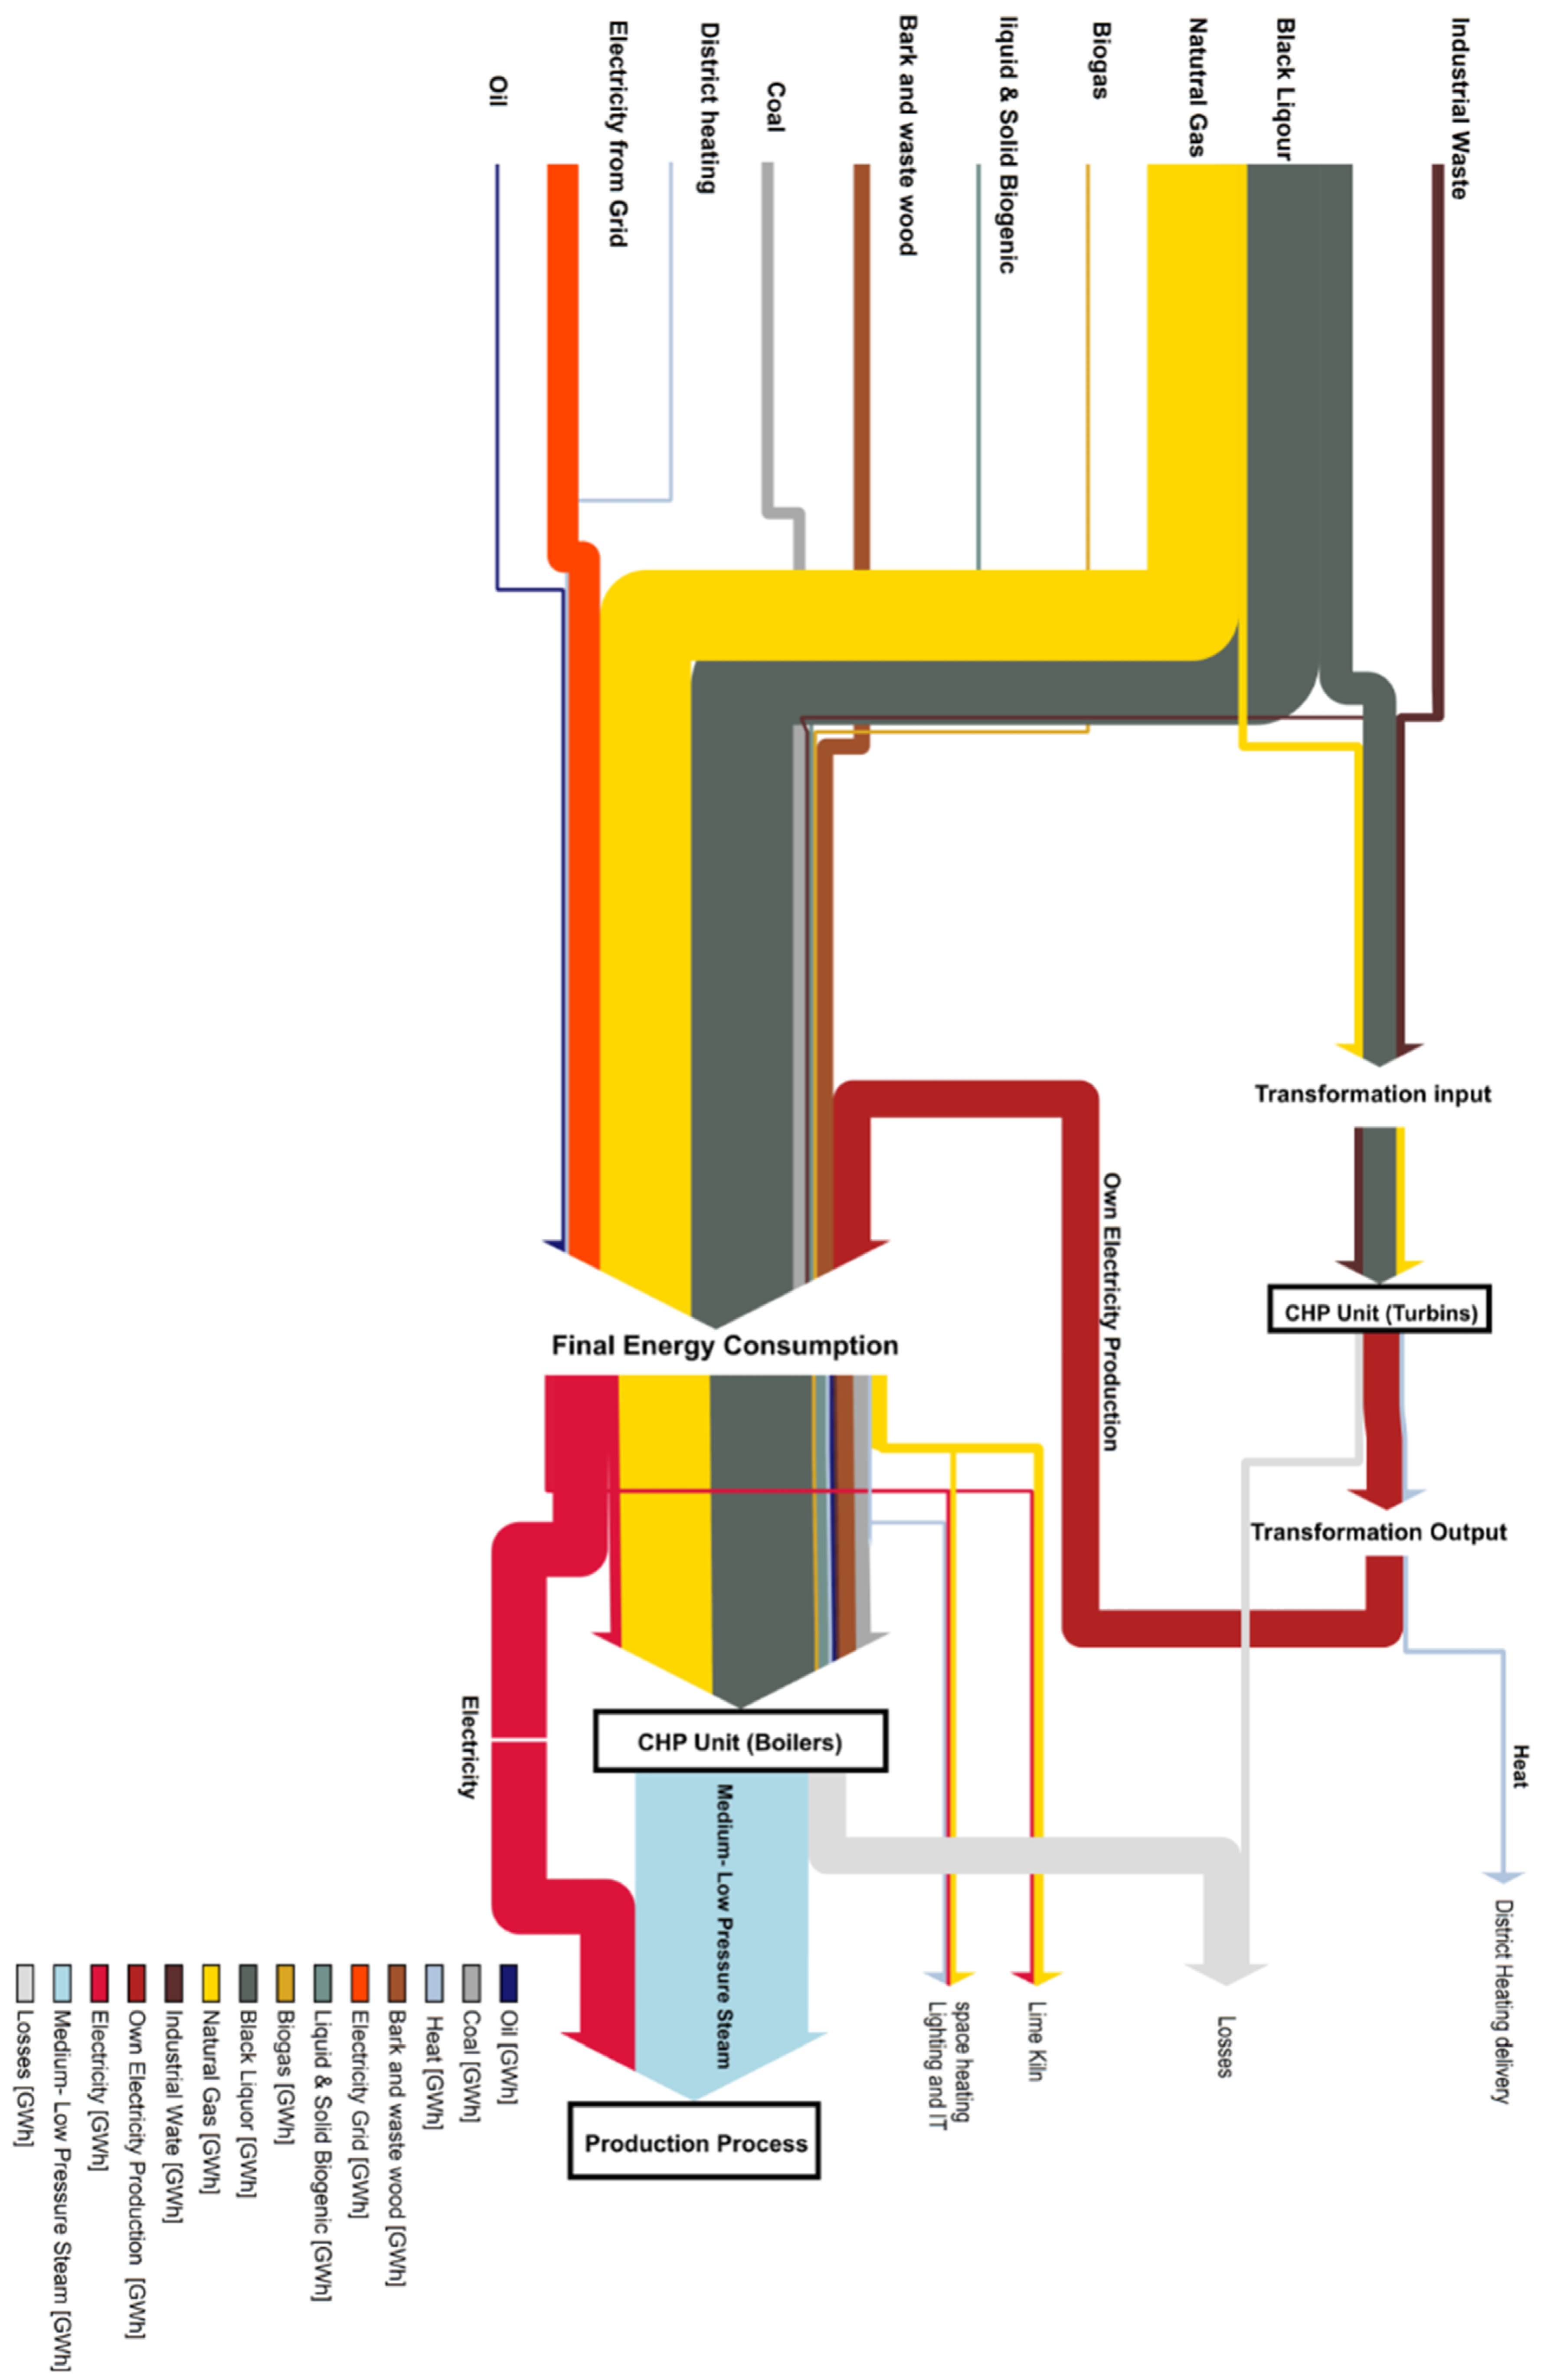
To give a general overview of the energy flow in the pulp and paper sector,
Figure 4 shows a Sankey diagram in which all fuel types and the Austrian P&P sector’s own energy production are considered as a case study.
While pulp and paper is an energy-intensive sector and consumes a lot of energy in Austria, it is one of the least CO
2-intensive industrial sectors. Greenhouse gas emissions in P&P can be attributed to direct and indirect emissions. Direct emissions are emissions from the burning of fuels on-site (fossil fuels and biofuels) and non-energy related sources such as carbon dioxide emissions as a by-product of the chemical reaction in the lime kiln. The in-direct emission comes from the external power supply that has been purchased for the plant [
15,
17].
For calculating the total CO
2 emissions from the P&P sector, only fossil fuel emissions are taken into account. The biofuel emissions are classified as carbon-neutral, according to the GHG Protocol of the Intergovernmental Panel on Climate Change (IPCC) [
35]. The carbon neutrality of bioenergy does not mean that emissions from bioenergy are not considered. Instead, they are assigned to the forest and land-use sector [
36]. Hence, the main reason for the difference in carbon dioxide intensity between paper manufacturing and other industrial sectors is the extensive use of biofuel as an energy source [
15].
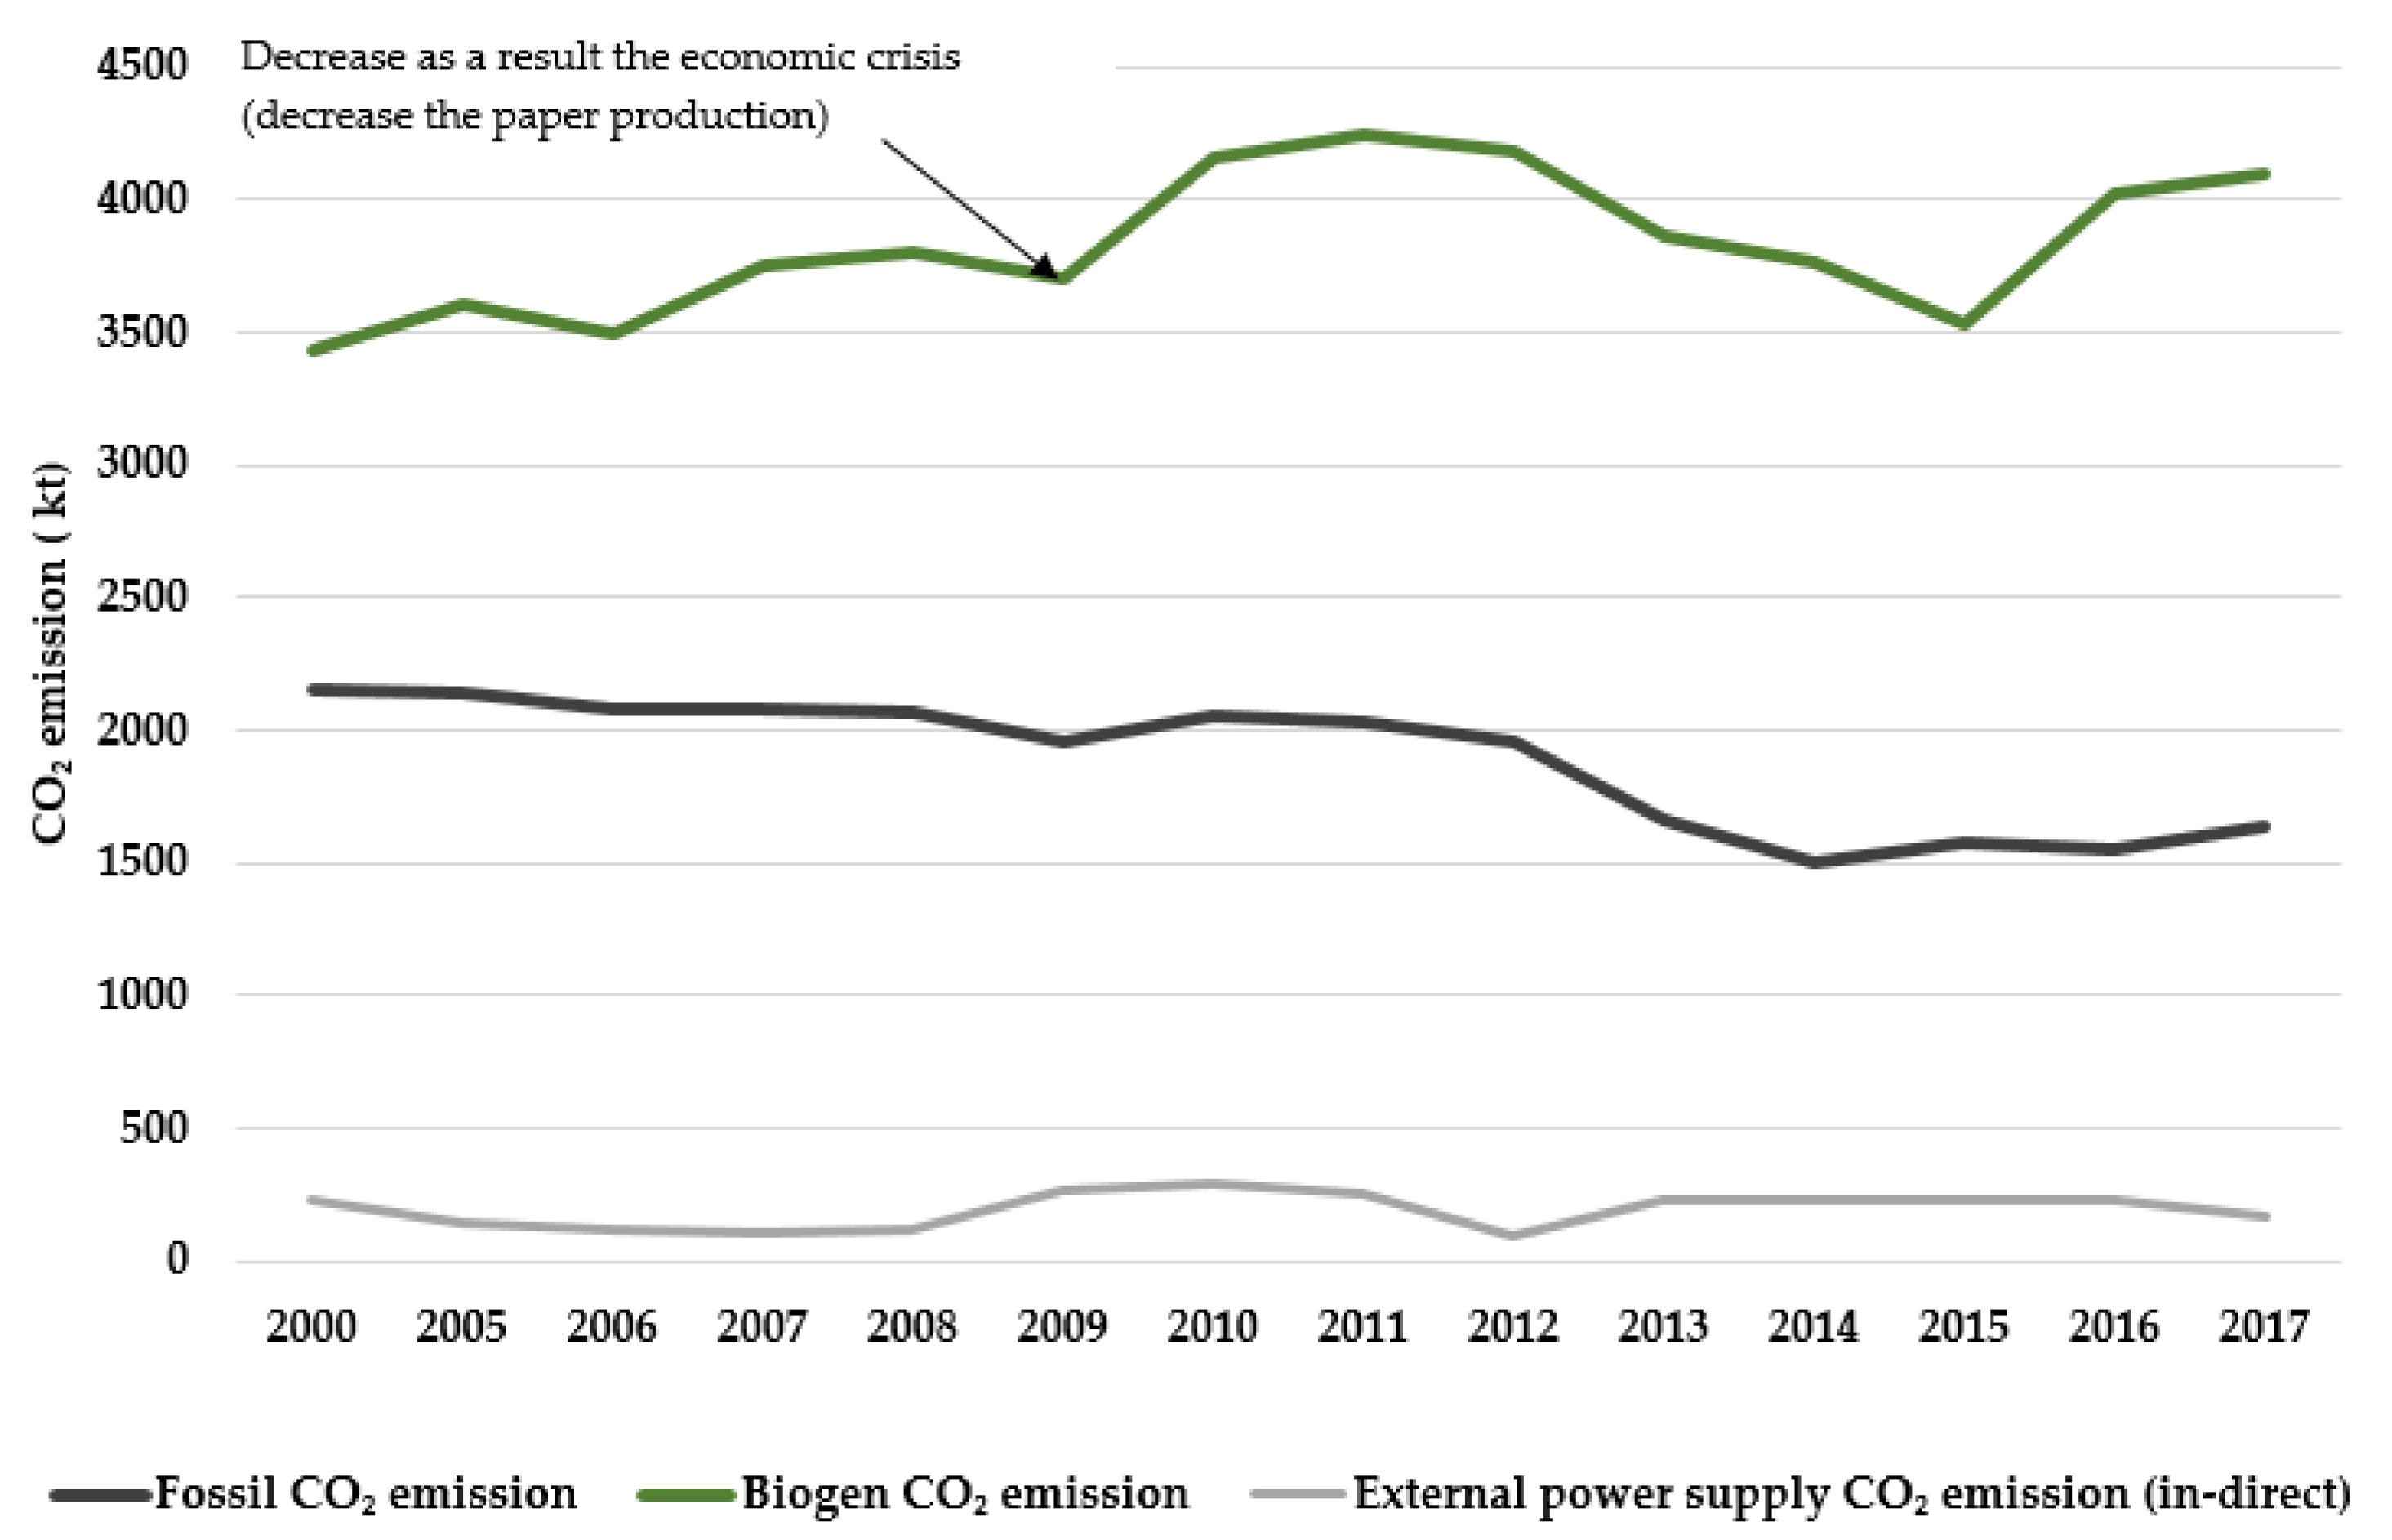
In 2017 the total emission of the Austrian P&P sector was 1811 kilotons (kt) [
8], which was 90% direct and 10% indirect emissions, corresponding to 7% of total industrial emissions. As illustrated in
Figure 5, P&P showed a general decreasing trend in direct fossil CO
2 emissions from 2157 kt (0.54 kt CO
2 per kt paper) in 2000, to 1639 kt (0.37 kt CO
2 per kt paper) in 2017 [
8,
9]. This was mainly due to the increased use of biofuel instead of fossil fuels as an energy source. (
Figure 4).
3. Modeling Approach
To assess the potential of technology-based energy efficiency improvement and CO2 mitigation measures on the P&P processes, we developed an analytical model based on a linear bottom-up approach. By calculating the energy consumption of each step of the production process, the fuel consumption and CO2 emissions can be estimated. This approach makes it possible to calculate the impact that selected measures in a specific process would have on the energy consumption and CO2 emissions of the entire production process.
The first application of the model is the calculation of annual emissions and energy consumption of each paper product individually (printing and writing paper, tissue, newsprint, and packing paper), considering different production conditions such as integrated (int) or non-integrated (n.int) production, type of pulp used, and RCF content, to obtain the specific energy consumption and CO2 emission of each of those products and to understand the sources of CO2 throughout the process.
In the second application, the model is used to calculate the energy consumption and CO
2 emissions of the entire sector in Austria, using as input the pulp and paper’s annual production. Since the pulp is sold separately as market pulp, the total production of pulp is not directly related to paper production, so the calculation methodology for the entire industry considered the production of pulp and paper separately (instead of pulp produced to sustain the production of paper). The two variants of the model diverge on the method used to calculate fuel consumption.
Table 5 compares the two variants of the applied model.
With both approaches, the impact of selected new technology on energy and emission savings, by considering the time required for the diffusion of the technology, can be analyzed.
3.1. Mathematical Formulation: Energy and Fuel Consumption for Specific Paper Grades
The energy consumption to produce each paper grade depends on the characteristics of the paper produced, which are defined in the model by the following variables:
Paper grade produced (printing and writing paper, tissue, newsprint, or packing paper);
Mineral filler mass content in the paper (mf);
Integrated or non-integrated production;
Type of virgin pulp used: chemical (kraft, sulphite), mechanical (GW, TMP);
Recycled fibers (RCF) content in pulp ();
Seven different cases were studied (filler content is always considered 10%), shown in
Table 6.
For each case, the impacts of producing one ton of paper are calculated (
). The dry mass of fillers and pulp necessary for the production are calculated according to Equations (1) and (2), respectively.
represents the mass percentage of paper fillers in the paper.
The pulp used is considered to be a mixture between one type of virgin pulp and RCF pulp, and the mass of each type of pulp was calculated based on
, which represents the mass percentage of RCF in the pulp.
The wood used to produce the virgin pulp (chemical and mechanical) is calculated by using the pulp yield (dry mass of pulp over the dry mass of wood: Equation (5)) of each pulping process (
Table 7).
The absolute heat consumption for each sub-process (
) used to produce
is then the product of the specific heat consumption of the process (
) by the mass output of the process (
). The specific heat consumption per ton of pulp or paper (
) corresponds to the sum of all processes used for production (found in
Table 1,
Table 2 and
Table 3) divided by the pulp or paper produced (
): Equation (6). The same calculation is made for electricity (
): Equation (7).
This study assumes that the paper mill is equipped with a CHP plant (biofuel and natural gas CHP unit) to generate the required heat and electricity. The power to heat ratio is also considered to be 30% in the CHP unit.
3.2. Mathematical Formulation: Energy and Fuel Consumption of the Entire Industry in Austria
The total consumption of heat needed for the total annual production of P&P in Austria of each product (
: pulp or paper) is calculated by the multiplication of the specific heat need (
: Equation (6)) for the production of product (
) with the annual production of the product (
(
). The total heat consumption by the industry (
, Equation (8)) corresponds then to the sum of the heat needed for the production of all products. The same methods are used for electricity consumption (
, Equation (9)), using the specific electricity needs (
: Equation (7)) to produce each product
Following, the values of fuel consumption are estimated. Fuel is used to cover the industry’s heat demands and produce electricity (excess electricity is sold). The heat demand is the main driver of fuel consumption. For each year analyzed, the ratio between the total heat consumption by the industry in Austria and total fuel consumption was calculated (
, Equation (10)) from the values reported each year by Austropapier (
and
,
, respectively) [
9,
30,
31,
32,
33,
34], and used to calculate the amount of fuel needed to cover the heat demands calculated previously, according to the equation (Equation (12)).
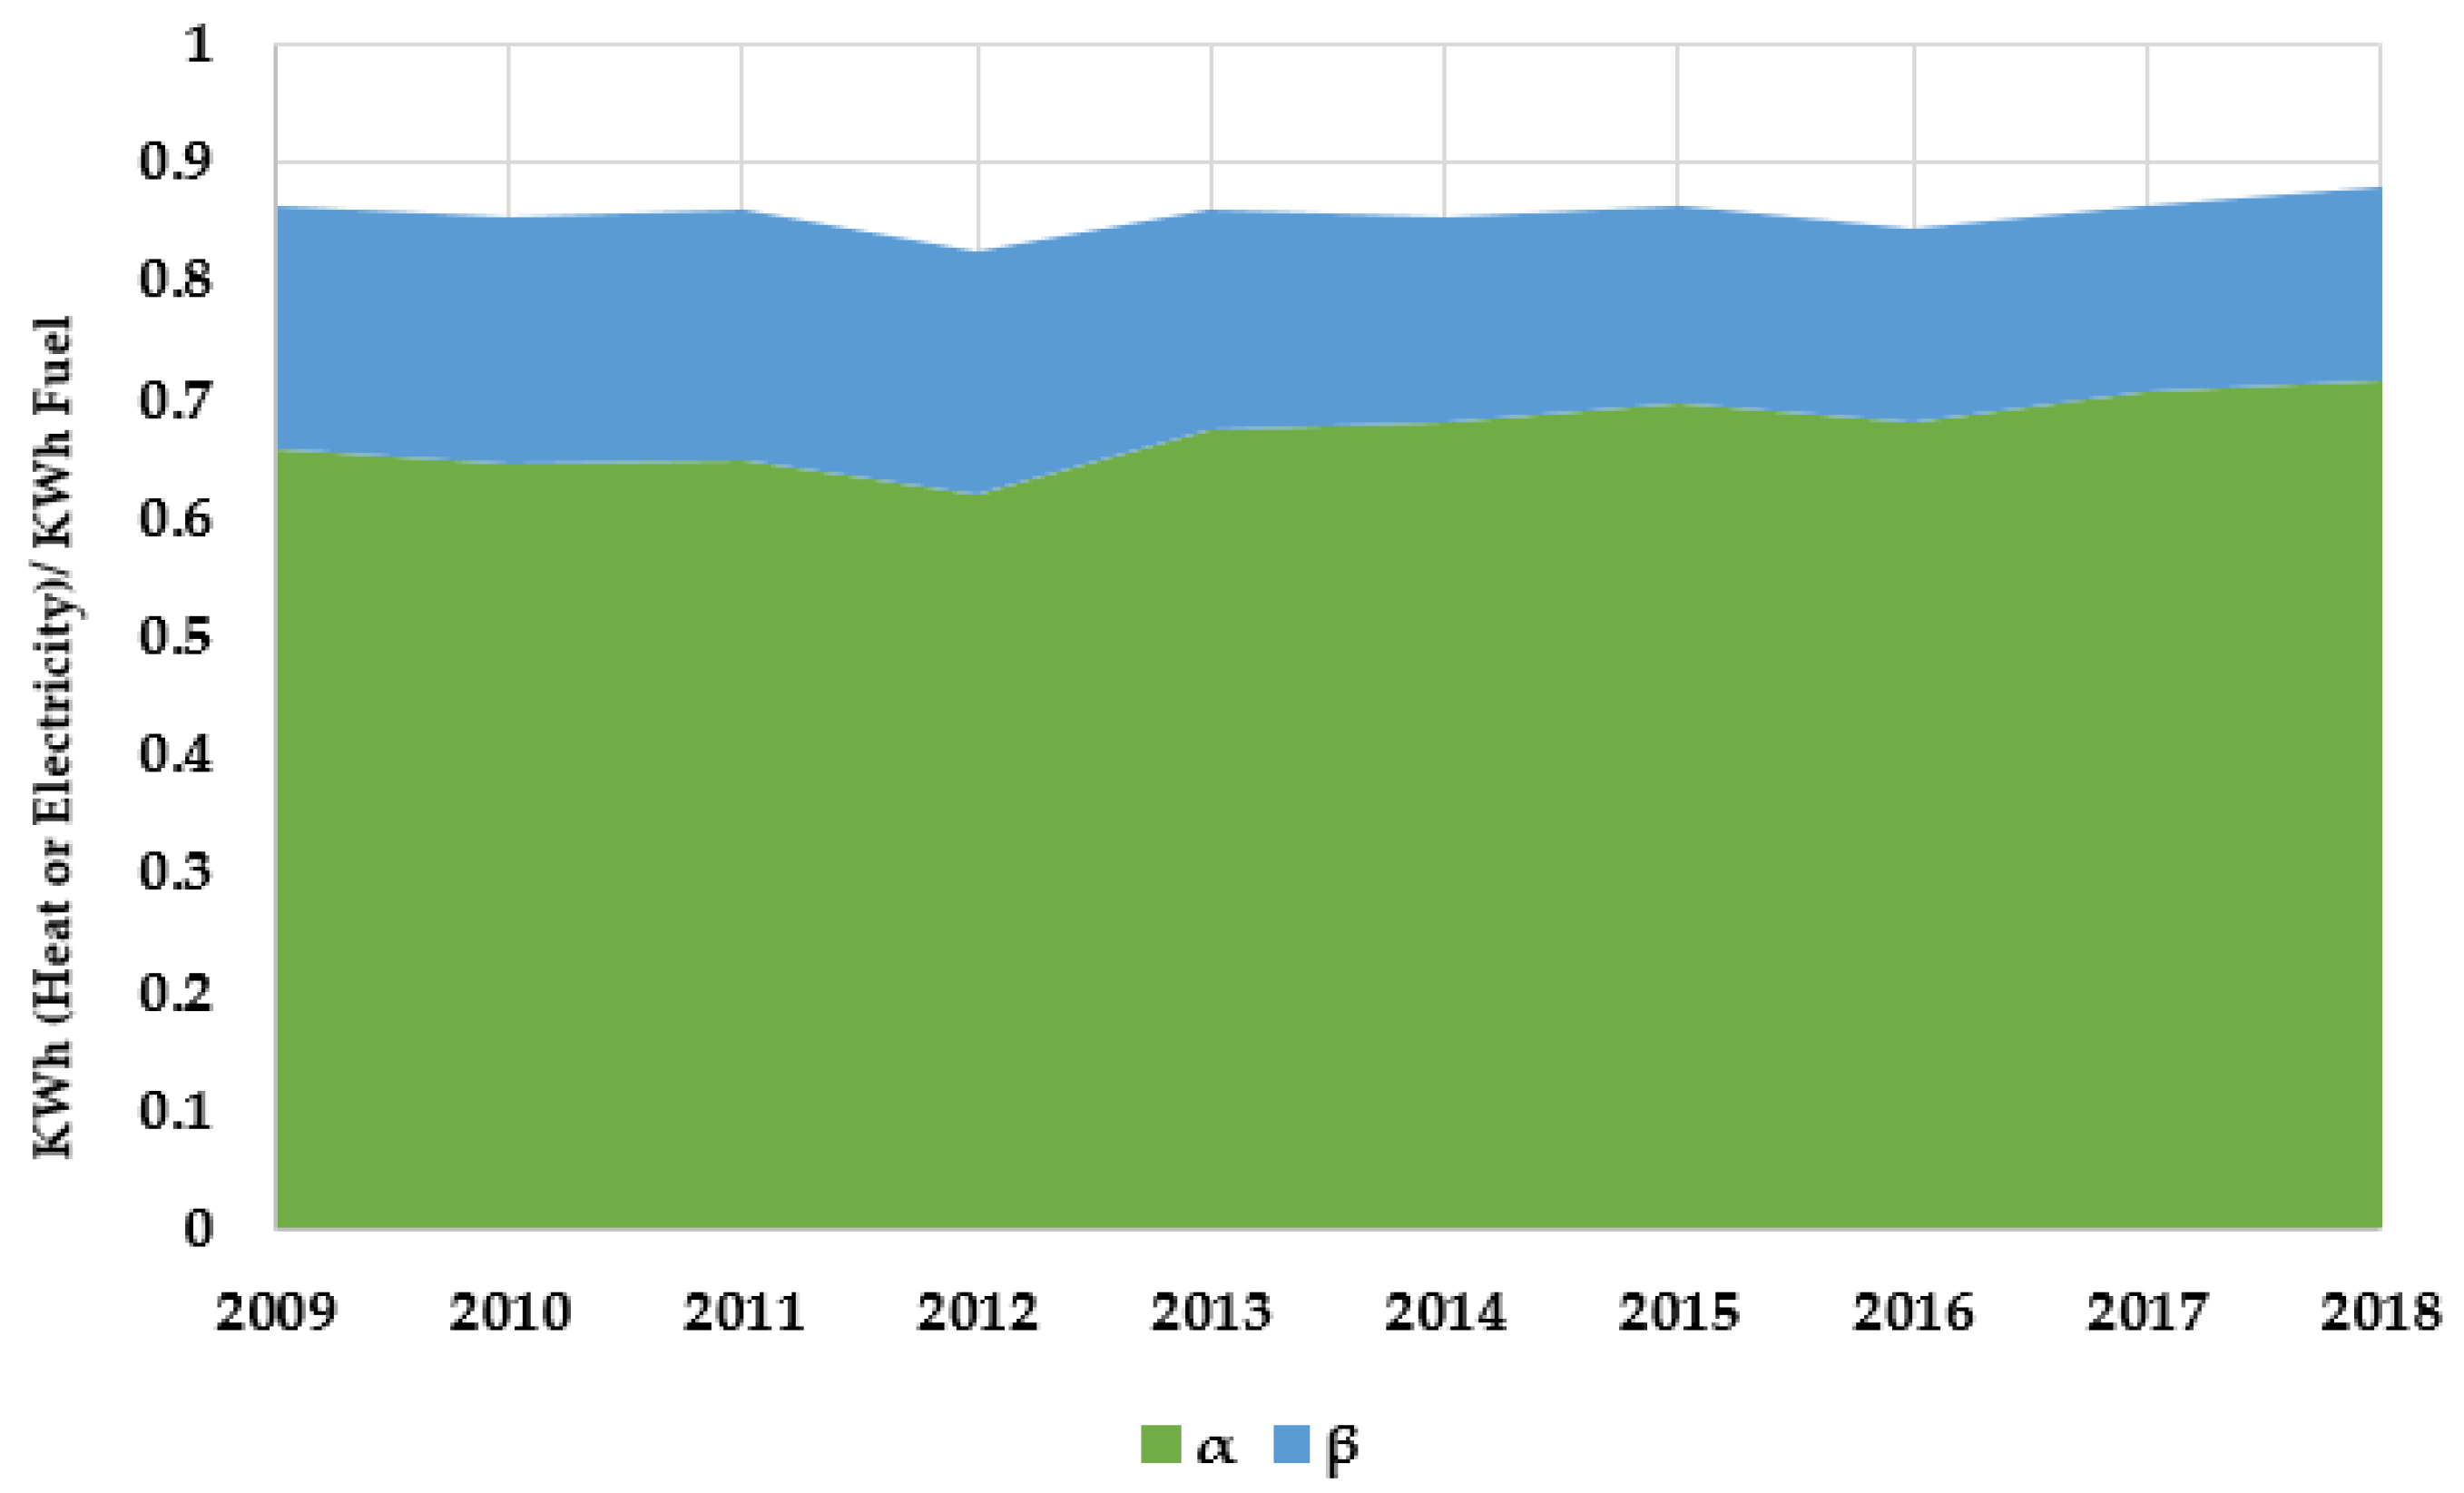
Similarly, the ratio between the values of electricity consumption (
) and fuel consumption was calculated (
, Equation (11)). The time evolution of
α and
β from 2009 to 2018 is presented in
Figure 6.
The prediction of the total fuels used (
Fy), and the total electricity consumption (
Ey) in the future is then estimated based on
and
; Equations (12) and (13), respectively.
The fractions of fossil fuels (coal, oil, and natural gas) and biofuels used every year in the P&P sector (
) were also obtained from the same source. Equation (14) represents the consumption of each fuel in year
y.
The estimation of the purchased electricity was made by calculating the ratio between the electricity consumed from the grid and the total electricity consumption
(Equation (15)),
and
, respectively, were also reported by Austropapier [
9,
30,
31,
32,
33,
34].
For future prospection, the total electricity purchased from the grid each year (
) was then estimated based on
(Equation (16)).
3.3. Mathematical Formulation: CO2 Emission
The CO
2 emissions due to the consumption of fossil fuels (
) is calculated as the summation of the amount of fossil fuels consumed (
) multiplied by the emission factor of each fossil fuel (
), reported to Austria’s National Inventory Report [
38] (Equation (17)).
The CO
2 emitted due to the consumption of grid electricity (
) is calculated as the product of the grid electricity consumed (
) multiplied by the respective emission factor for the paper industry (
). To calculate
(Equation (19)), the total emissions from energy production of the electricity grid (
) is estimated as the summation of the product of the consumption of each fuel used to power the grid (
) [
39] and the respective emission factors (Equation (18)). The grid emission factor is then calculated as the division between
and the total grid electricity in year
y (
). The value used in this section corresponds to the most recent data available.
The CO
2 emission due to the purchase of grid electricity is then calculated (Equation (20)).
4. Decarbonization Technology Selection
Based on the literature, there are already a number of opportunities for reducing energy consumption and greenhouse gas emissions in the pulp and paper industry, and others will be available in the future. In general, upgrading existing mills with energy-efficient technologies, such as switching fuel from fossil fuels to on-site produced biofuels (bark and black liquor) in combination with CHP, improving the energy management system, increasing the use of waste paper and paper recycling, and implementation of innovative technologies are the key options identified to reduce CO
2 emissions and energy consumption in the P&P sector [
10,
16,
40].
In this work, a list of best available technologies (BAT) and emerging innovative technologies (IT) has been compiled based on a comprehensive literature review in
Table 8 and
Table 9. These technologies are applicable at different stages of the pulping and papermaking process. For each technology, the energy-savings (heat or electricity) and the CO
2 reduction potential in the associated process are considered, and to find out how mature the technology is, the technology readiness level (TRL) is monitored.
In Austria, in line with other European paper production sites, the P&P sector has started to improve its energy efficiency in recent decades. The implementation of best available technologies as the use of waste heat recovery systems, the switch from fossil fuels to on-site biofuel production in integrated mills (
Figure 3 and
Figure 4), and the use of recycled paper in paper processing in the Austrian P&P sector have led to a reduction of CO
2 emissions by around 30% in the last twenty years (
Figure 5) [
9,
25]. However, to reach the target of decarbonization of the entire industry by 2050, direct emissions remain a challenge for the sector, and further efforts in the P&P sector are needed.
Regarding the state-of-the-art situation of the Austrian P&P sector, mentioned in the previous paragraph, six technologies were selected from those listed in
Table 8 and
Table 9 in this study, and their individual impacts on the Austrian P & P sector were evaluated. The technology selection was based on three criteria:
The selected technologies are applied in one of the energy-intensive steps: Chemical pulping and drying, which use approximately 67% of the total energy required for paper making [
10,
15] of paper production. In this case study, they have a high energy saving potential (electricity/steam) and influence directly or indirectly CO
2 emissions.
The technologies have a high TRL (min 6) and have been proven on an industrial scale or are almost commercial in the short and medium-term.
Finally, not yet employed in the Austrian P&P sector.
The chosen technologies are as following:
Steam cycle washing (SCW): This is a new washing technology that uses steam to wash the pulp after chemical pulping instead of water. As a result, it is possible to produce higher consistency and stronger (10%) pulp, and reduce energy for pumping and heating in the thickening, screening, and evaporation operations. The global effect is a reduction of 30–40% of the energy needed (fuel or steam consumption) for kraft pulping (overall, not just digesting). This process is in demonstration and is close to the commercialization phase with a TRL 7–8 [
15,
43,
46].
Impulse drying (ID): This technology is not a replacement for the current drying section. It is a modification in the press section, which consists of pressing the paper against a high-temperature element. This way, the dry content in the paper may become as high as 65%, resulting in an energy saving of 0.44–0.9 GJ per ton of paper, corresponding to 10–25% energy (steam) consumption reduction in papermaking. This technology is in the demonstration phase with TRL 7 [
15,
43,
47].
Condebelt drying (CD): This is a replacement of the current drying section, in which the paper web is dried in a drying chamber between two steel belts instead of on traditional steam-heated cylinders, achieving higher dryer rates and efficiency. This dryer improves fiber properties such as strength (20–60% increasing), smooth surface, dimensional stability, and moisture resistance. With Condebelt drying, the same strength values can be achieved with recycled fibers as with fresh fibers in conventional drying. The CD reduces energy consumption by 15% (1.6 GJ steam per ton of paper and 20 kWh electricity per ton of paper). This technology is in the demonstration phase with TRL 7–8 [
15,
43,
47].
Gas-fired dryers (GFD): Gas-fired dryers are an alternative to the current drying drums heating by steam, in which the same method is applied but the drums are heated by combustion inside the drum. This process has a much higher efficiency (energy efficiency increase from 60–65% in steam-operated, compared to 75–80% in gas-operated), and higher temperatures are achieved, resulting in higher drying rates and a faster process. This method reduces the drying energy consumption by 10–20% and increases the production rate by up to 20%. The technology is still in the pilot stage with TRL 6–7, and has low CAPEX since it is an adaptation of the technology used today [
15,
43,
48].
Dry sheet forming (DSF): A new method of forming which results in large reductions of drying energy. In this method, the paper is formed without the addition of water to the pulp. The sheet is supported by an air jet and a solution of resigns is sprayed on the surface to help to form the paper sheet. This forming method is only suitable for tissue or hygienic paper since the surface smoothness decreases and the thickness has higher variations, but the resulting paper is soft. It is estimated that by using this technology, 50% of the drying energy requirement (fuel used for heat production) can be saved, but the electricity consumption may increase 150 to 250 kWh per ton of paper in an air-layered system to maintain the airflow and motor drive for the equipment. This technology is semi-commercial for the production of special products and will be further developed in the near future for the production of standard paper grades. The TRL of this technology is near 7 [
15,
43,
47].
Direct electric heating (DEH): DEH can contribute to the electrification of the steam supply of the P&P industry by replacing fossil fuels (especially natural gas) with electric boilers with an efficiency of 90%. Since electric boilers exist and are commercially available, this technology can be easily installed in P&P mills. Since the energy demand for paper production by applying this technology is the same with current production processing (and only fossil fuels are replaced by electricity), the feasibility of this option strongly depends on the power grid capacity to achieve such a high load increase without increasing the use of fossil fuels. The generation of a CO
2-free electricity grid would lead to complete decarbonization of the P&P sector by electrification options [
41,
45,
49].
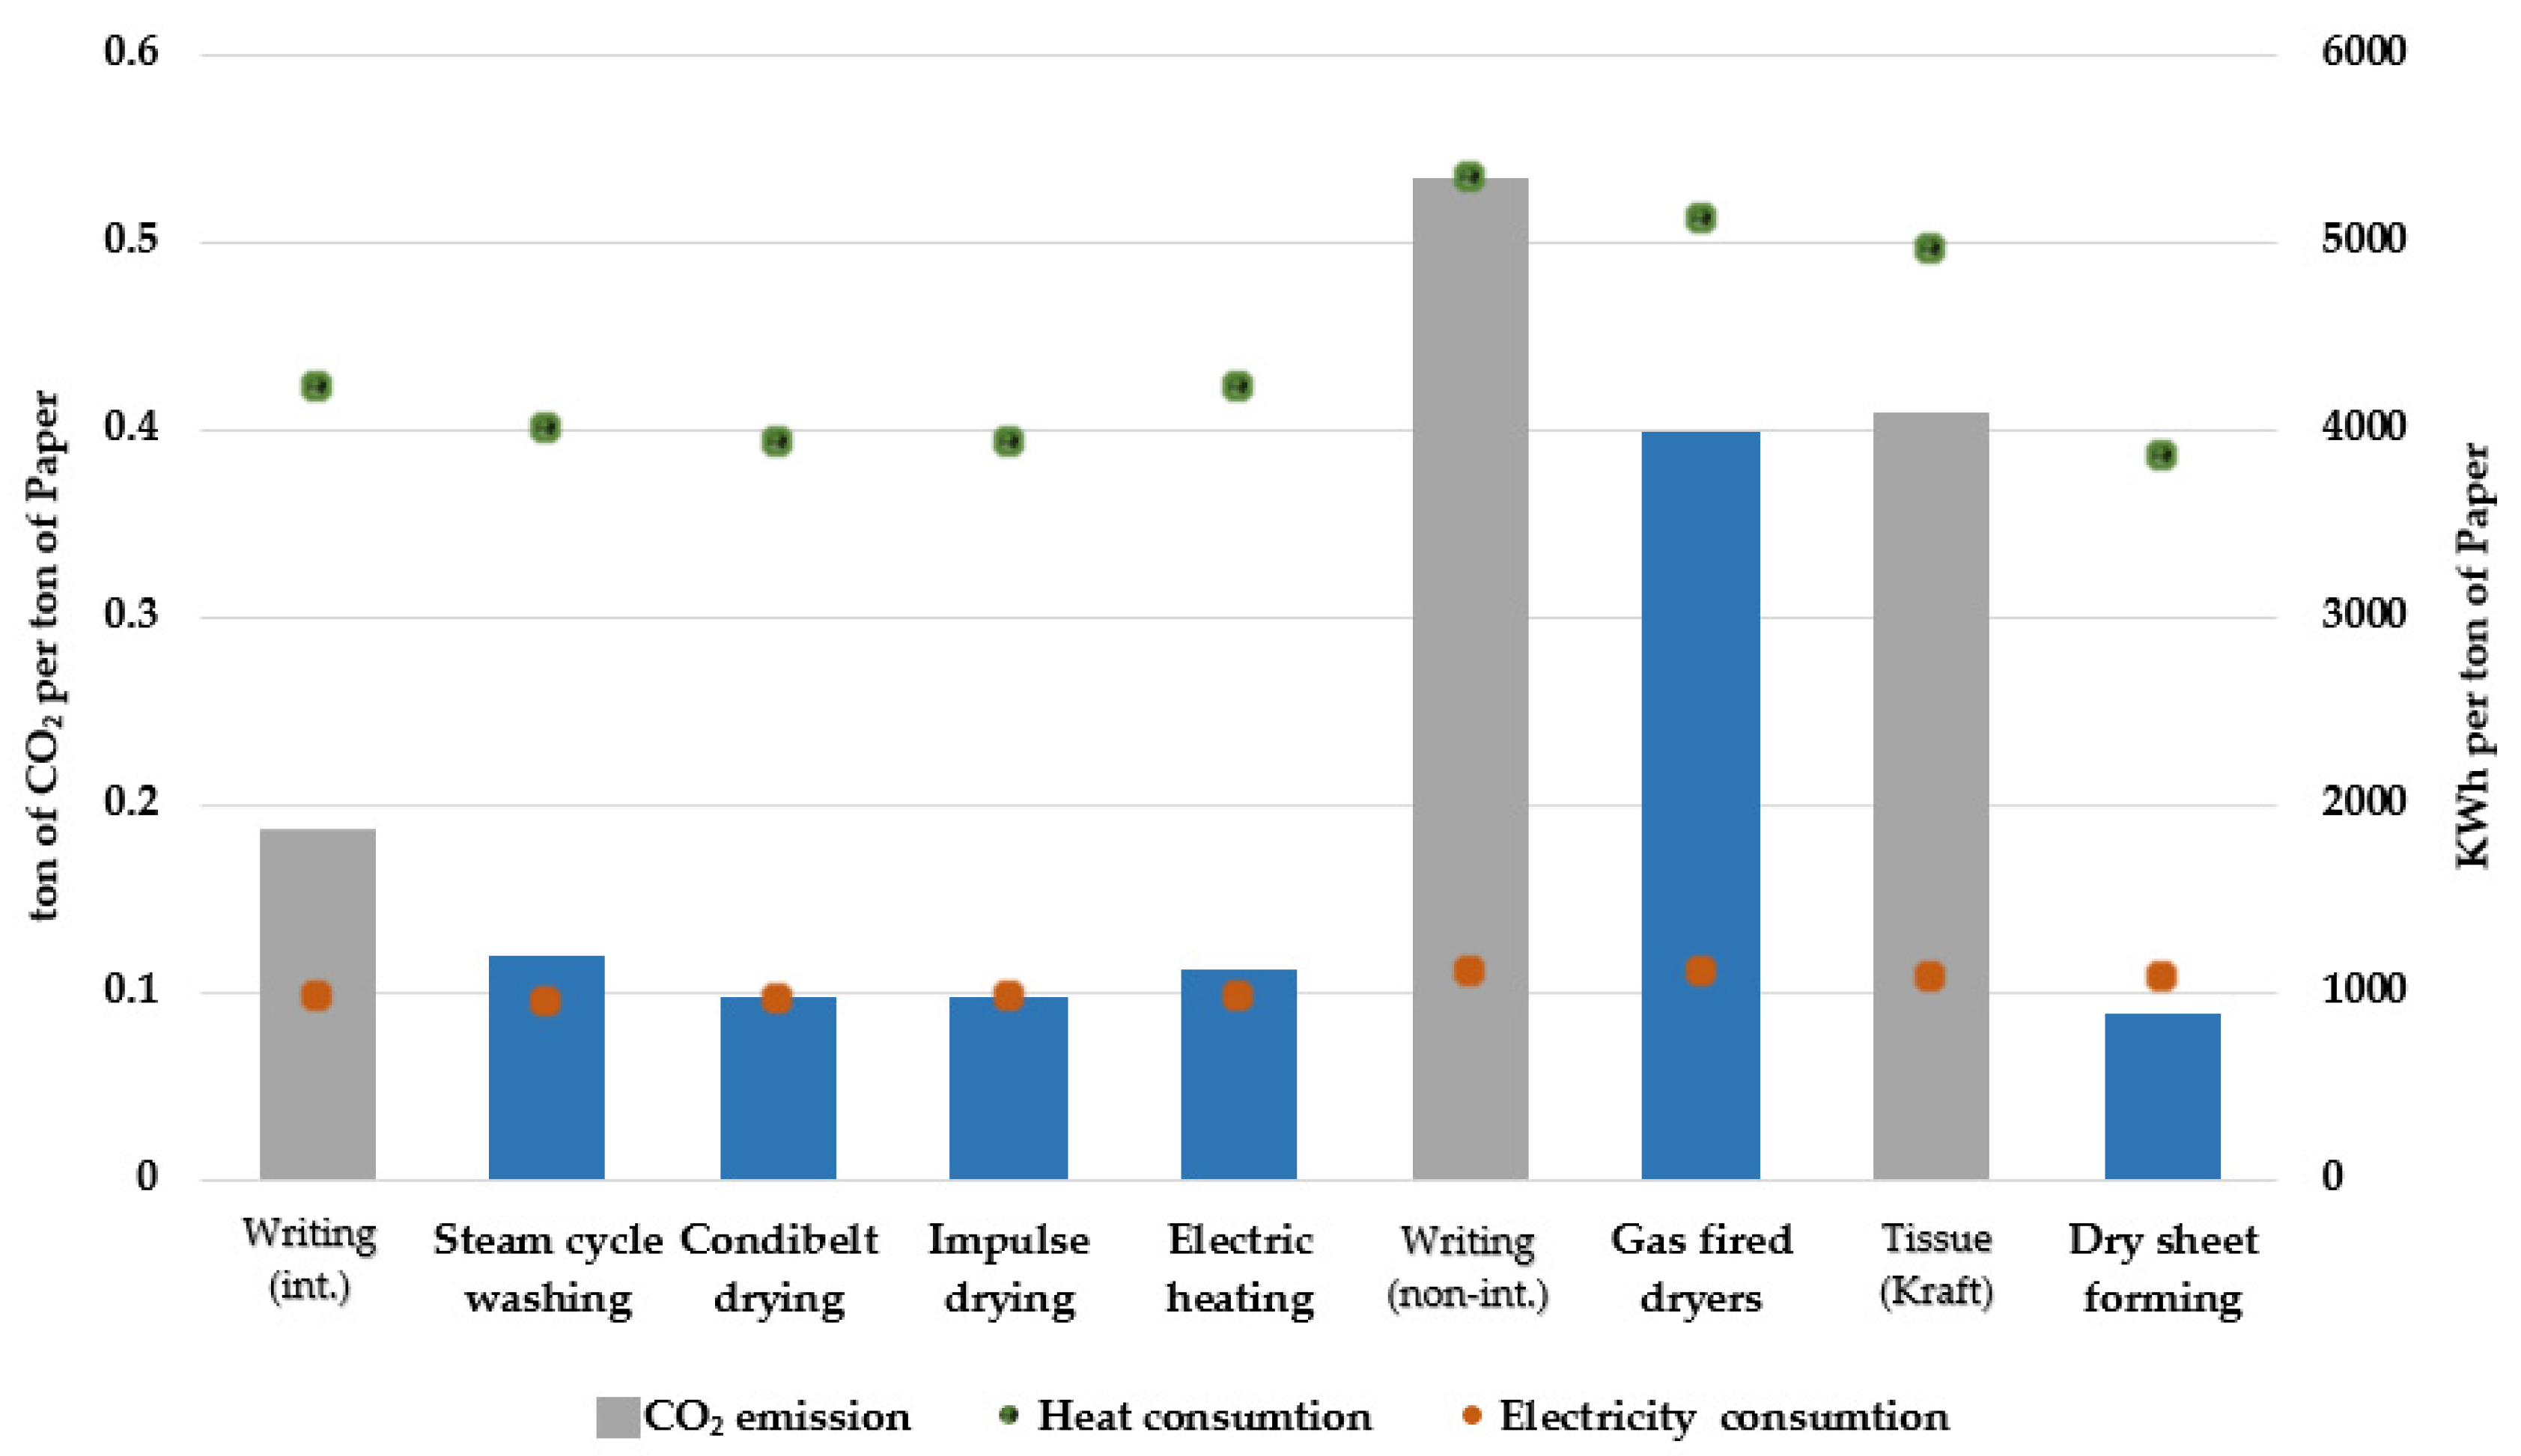
The abovementioned technologies are applied as single technologies (no technology combination) in the relevant paper grades shown in
Table 6. Steam cycle washing, impulse drying, Condebelt drying, and direct electric heating are used in integrated writing paper mills and gas-fired dryer, and dry sheet forming in the non-integrated writing paper and integrated tissue paper mills. The effects of every single technology on the individual paper grade were analyzed using the developed model. The specific energy (heat and electricity) consumption and specific CO
2 emissions of paper grade utilizing the technology were compared with the current situation of the selected paper grade, shown in
Figure 7.
The comparison between writing paper production by the integrated and non-integrated mills shows that the first one consumes less energy (especially heat), which directly affects the emission reduction. As depicted in
Figure 7, the modeling results reveal that the use of drying technologies reduces the specific CO
2 emissions in each paper grade due to energy (heat) demand reduction.
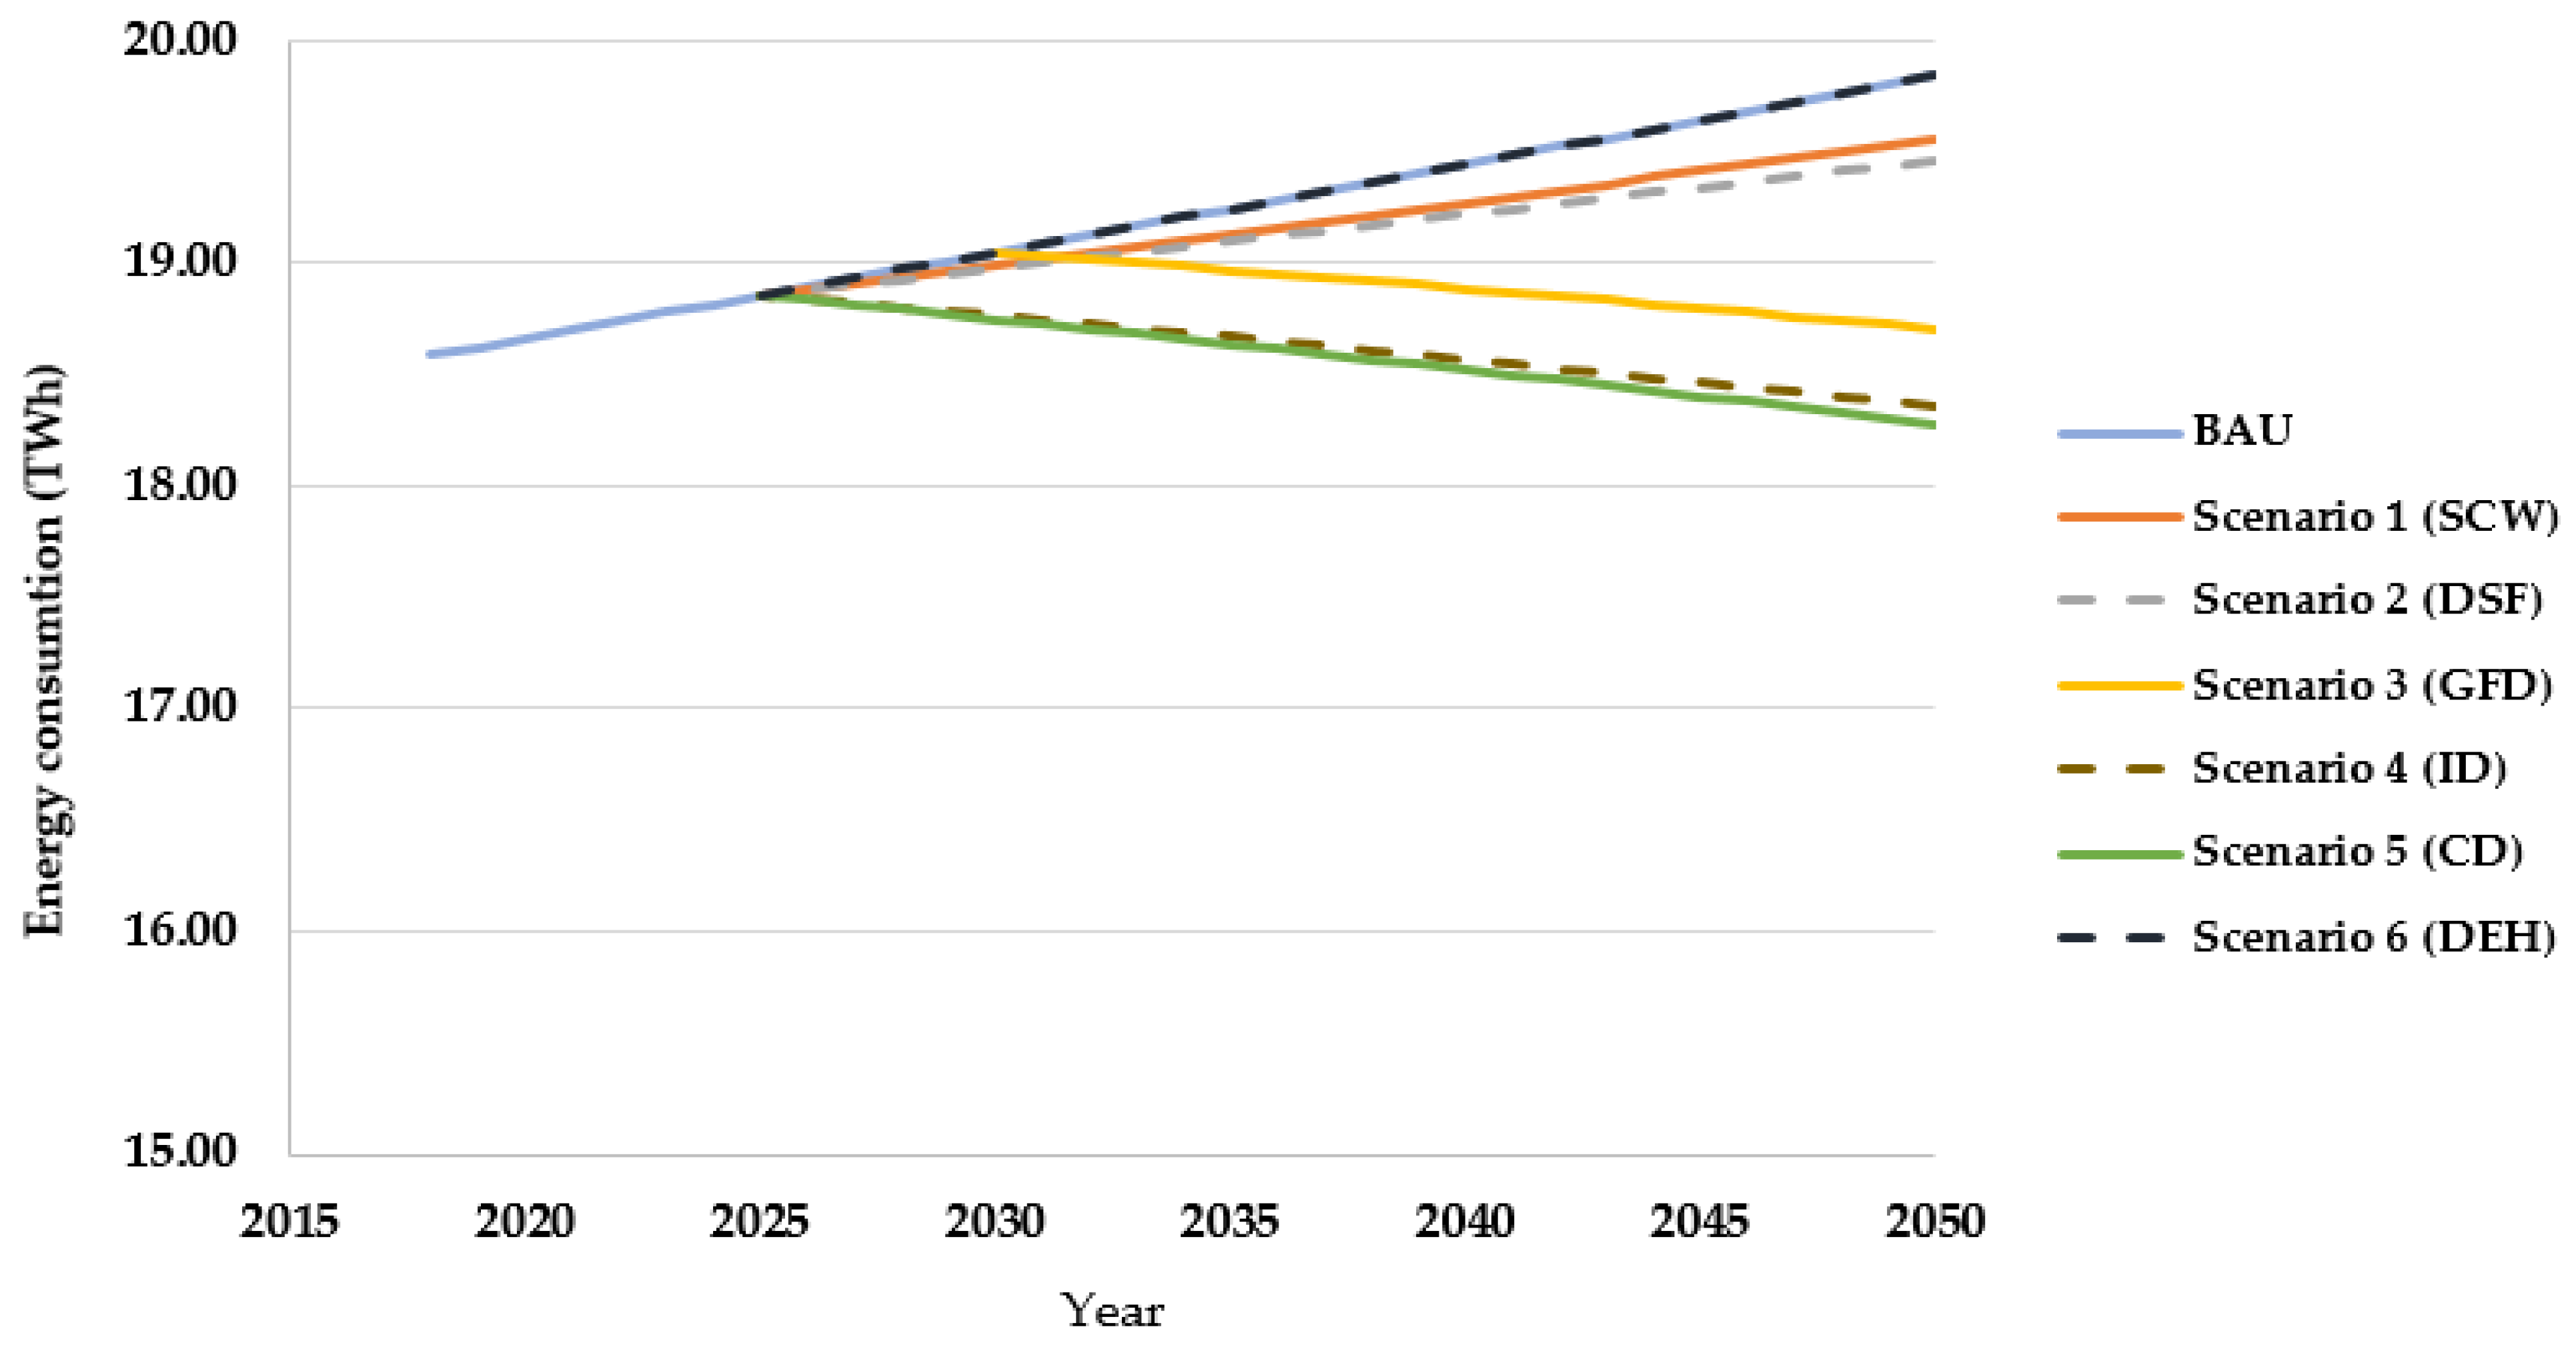
5. Scenario Definition and Results
In this section, energy efficiency improvement and CO2 emission reduction in the P&P sector are predicted using several scenarios for Austria until 2050. The business-as-usual (BAU) scenario analyzes the situation of the sector without significant technological improvement, and six alternative scenarios will be used to analyze the impact of implementing each of the six selected technology individually. In this work, a combination of technologies is not considered.
All scenarios have a starting point based on the development of consumption of paper products in Europe, as predicted by Lamberg et al. [
50] in
Table 10. The P&P production growth rate could be affected by unexpected future events and trends, such as the increasing digitalization of media and communication, energy and raw material prices, etc. However, considering this effect is not this study’s argument, it is assumed that paper production will follow the same trend as paper consumption in Europe.
For each investigated technology, the deployment year was assigned based on its commercial status: demonstrated and semi-commercial technologies with TRL 7–8 are applied in the year 2025 and pilot or scaling technologies with TRL 6–7 in the year 2030. The maximum relative deployment (share of production using the technology) in the sector for the first year of technology usage was estimated, taking into account two factors: CAPEX (capital expenditure) and the need to adapt the production process to the new technology. From this starting point, the deployment rate increases linearly until 2050 to 100%. A 100% deployment of technology to the production of one grade of paper means that it is assumed that all production lines of this grade of paper utilize this technology, but not lines producing other grades. To calculate the scenarios, the variables were divided into two groups: dynamic variables, which evolve according to the specific assumptions of each trend, and constant variables. The constant variables are:
- -
The ratio between heat consumption and fuel consumption (), with a value of 0.63 corresponding to the base year 2017;
- -
The average emission factor associated with grid electricity consumption is the same (efgrid);
- -
The emission factors of each fuel used (ei) corresponding to the base year.
To analyze the scenarios, the impact of the selected technologies across the P&P sector was assessed in annual time steps up to 2050, and CO2 emissions and energy consumption was calculated using the developed model.
The results of such an analysis do not provide an accurate prediction for the pulp and paper sector due to the impact of other options, e.g., the uncertainty regarding the decarbonization of the energy system, power generation resources, flexibility options, and the use of renewable energy policies, etc., which are not addressed in this work. However, these results provide valuable conclusions on the influencing factors that need to be considered by experts and policymakers.
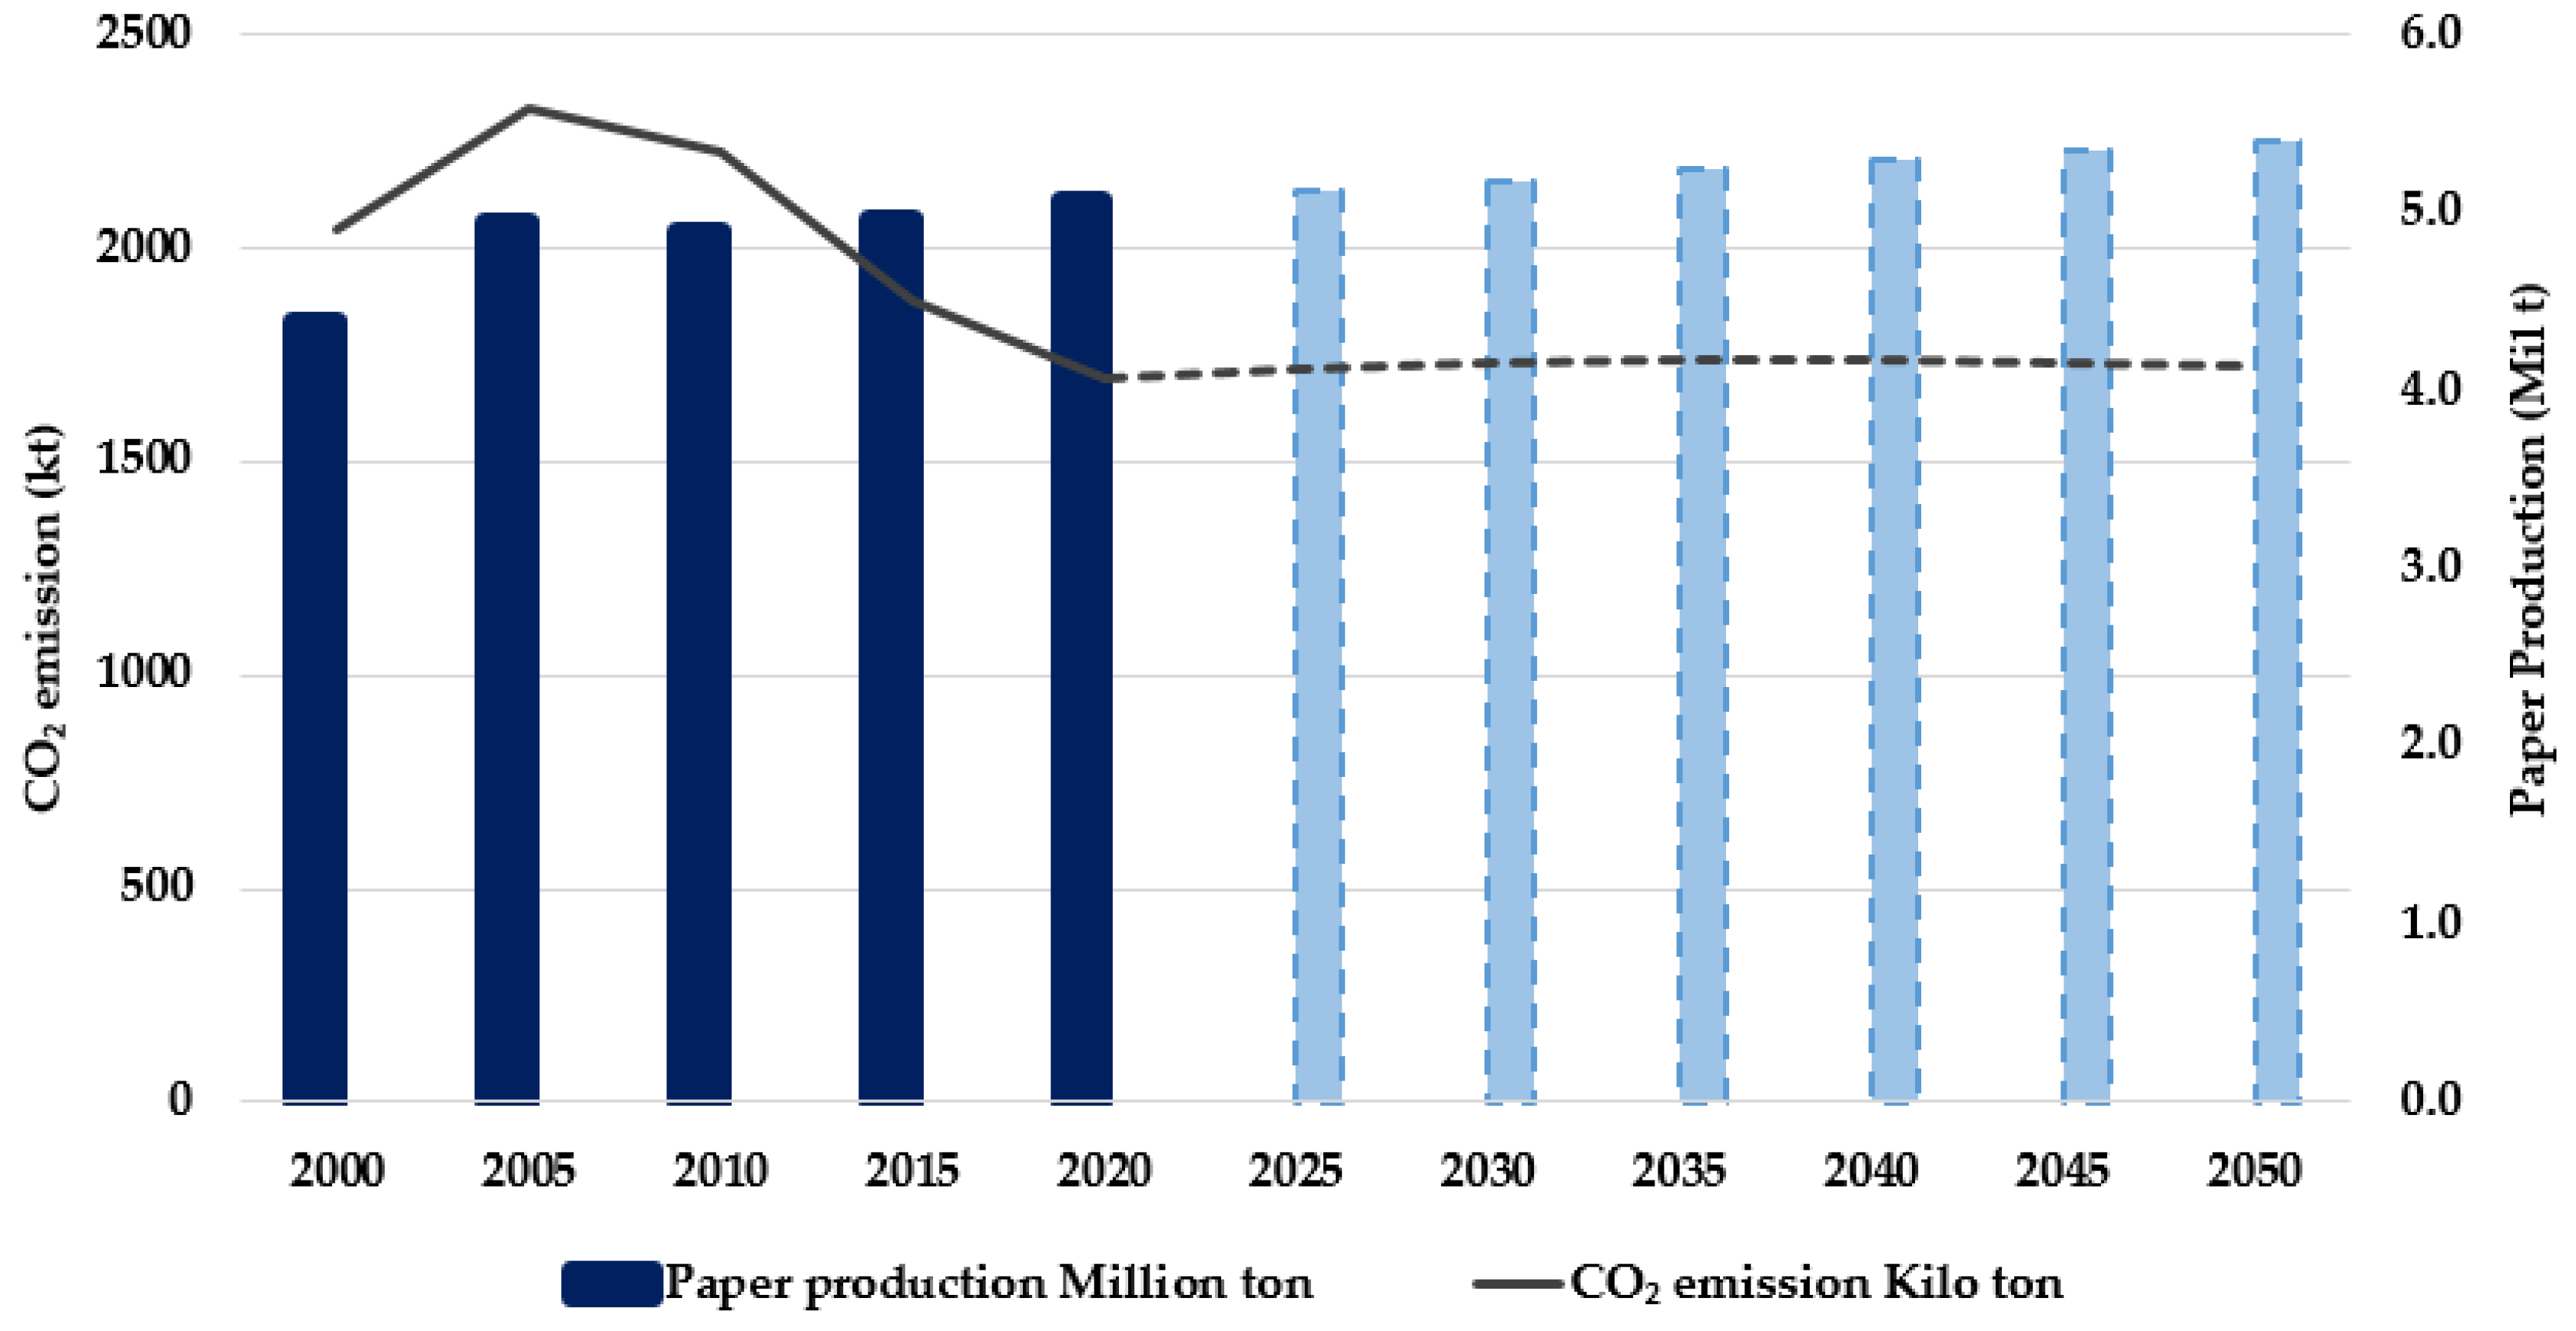
Figure 8 presents the modeling results for the projection trend of paper production and CO
2 emissions for the BAU scenario, without technological improvements and changes to the type of energy source consumed for heat generation.
6. Discussion
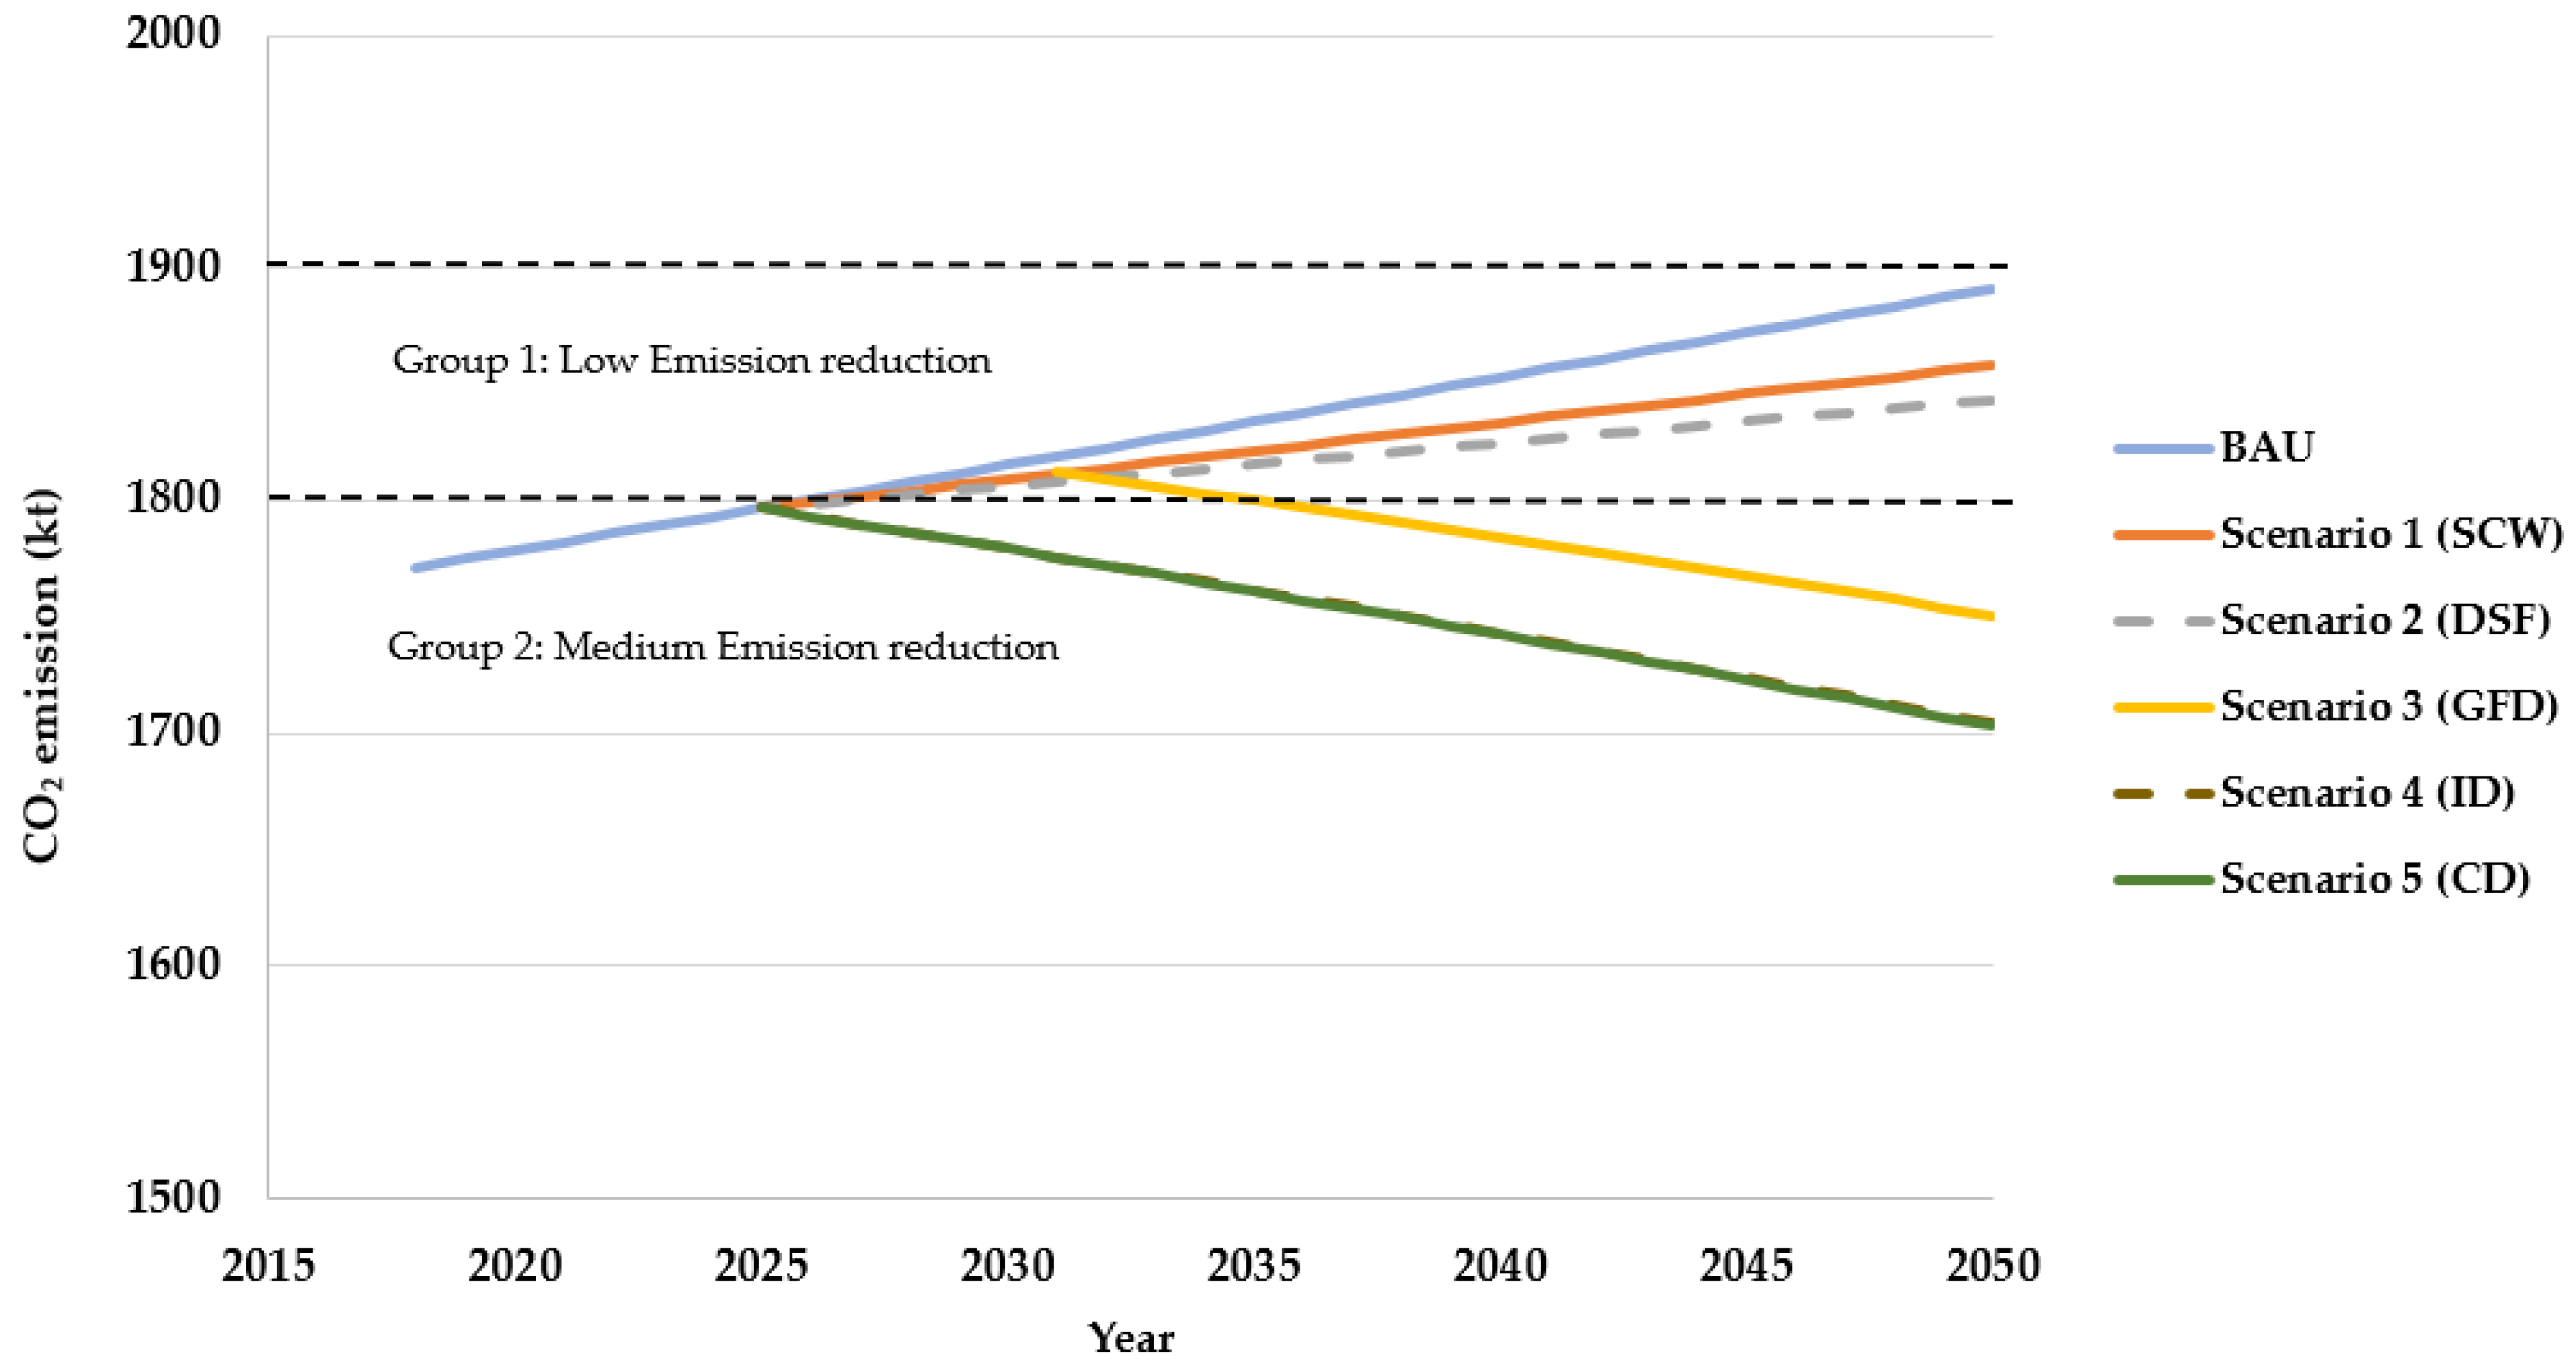
The result of the BAU scenario indicates that without technological development and improvement of energy efficiency, CO2 emissions of the Austrian P&P sector in 2050 will be 8.7%, and the energy consumption 10%, higher compared to the base year 2017. This is mainly due to the increase in paper production.
According to the potential for reduction of CO2 emissions in 2050, the result of other suggested scenarios can be divided into the following groups:
Low emission reduction (<5%): this group includes two technologies, SCW (steam cycle washing) technology for chemical pulp production with a maximum carbon reduction of 1.8%, and DSF (dry sheet forming) technology for small production segments of tissue paper with a reduction of emissions in the P&P sector of less than 3% and a decrease in total energy consumption of 2% compared to the BAU scenario. Although these technologies have a significant impact on the specific grade applied (DSF is able to reduce the emission of tissue paper production by 80% due to reduction of fuel consumption), their impact on the overall sector is minor.
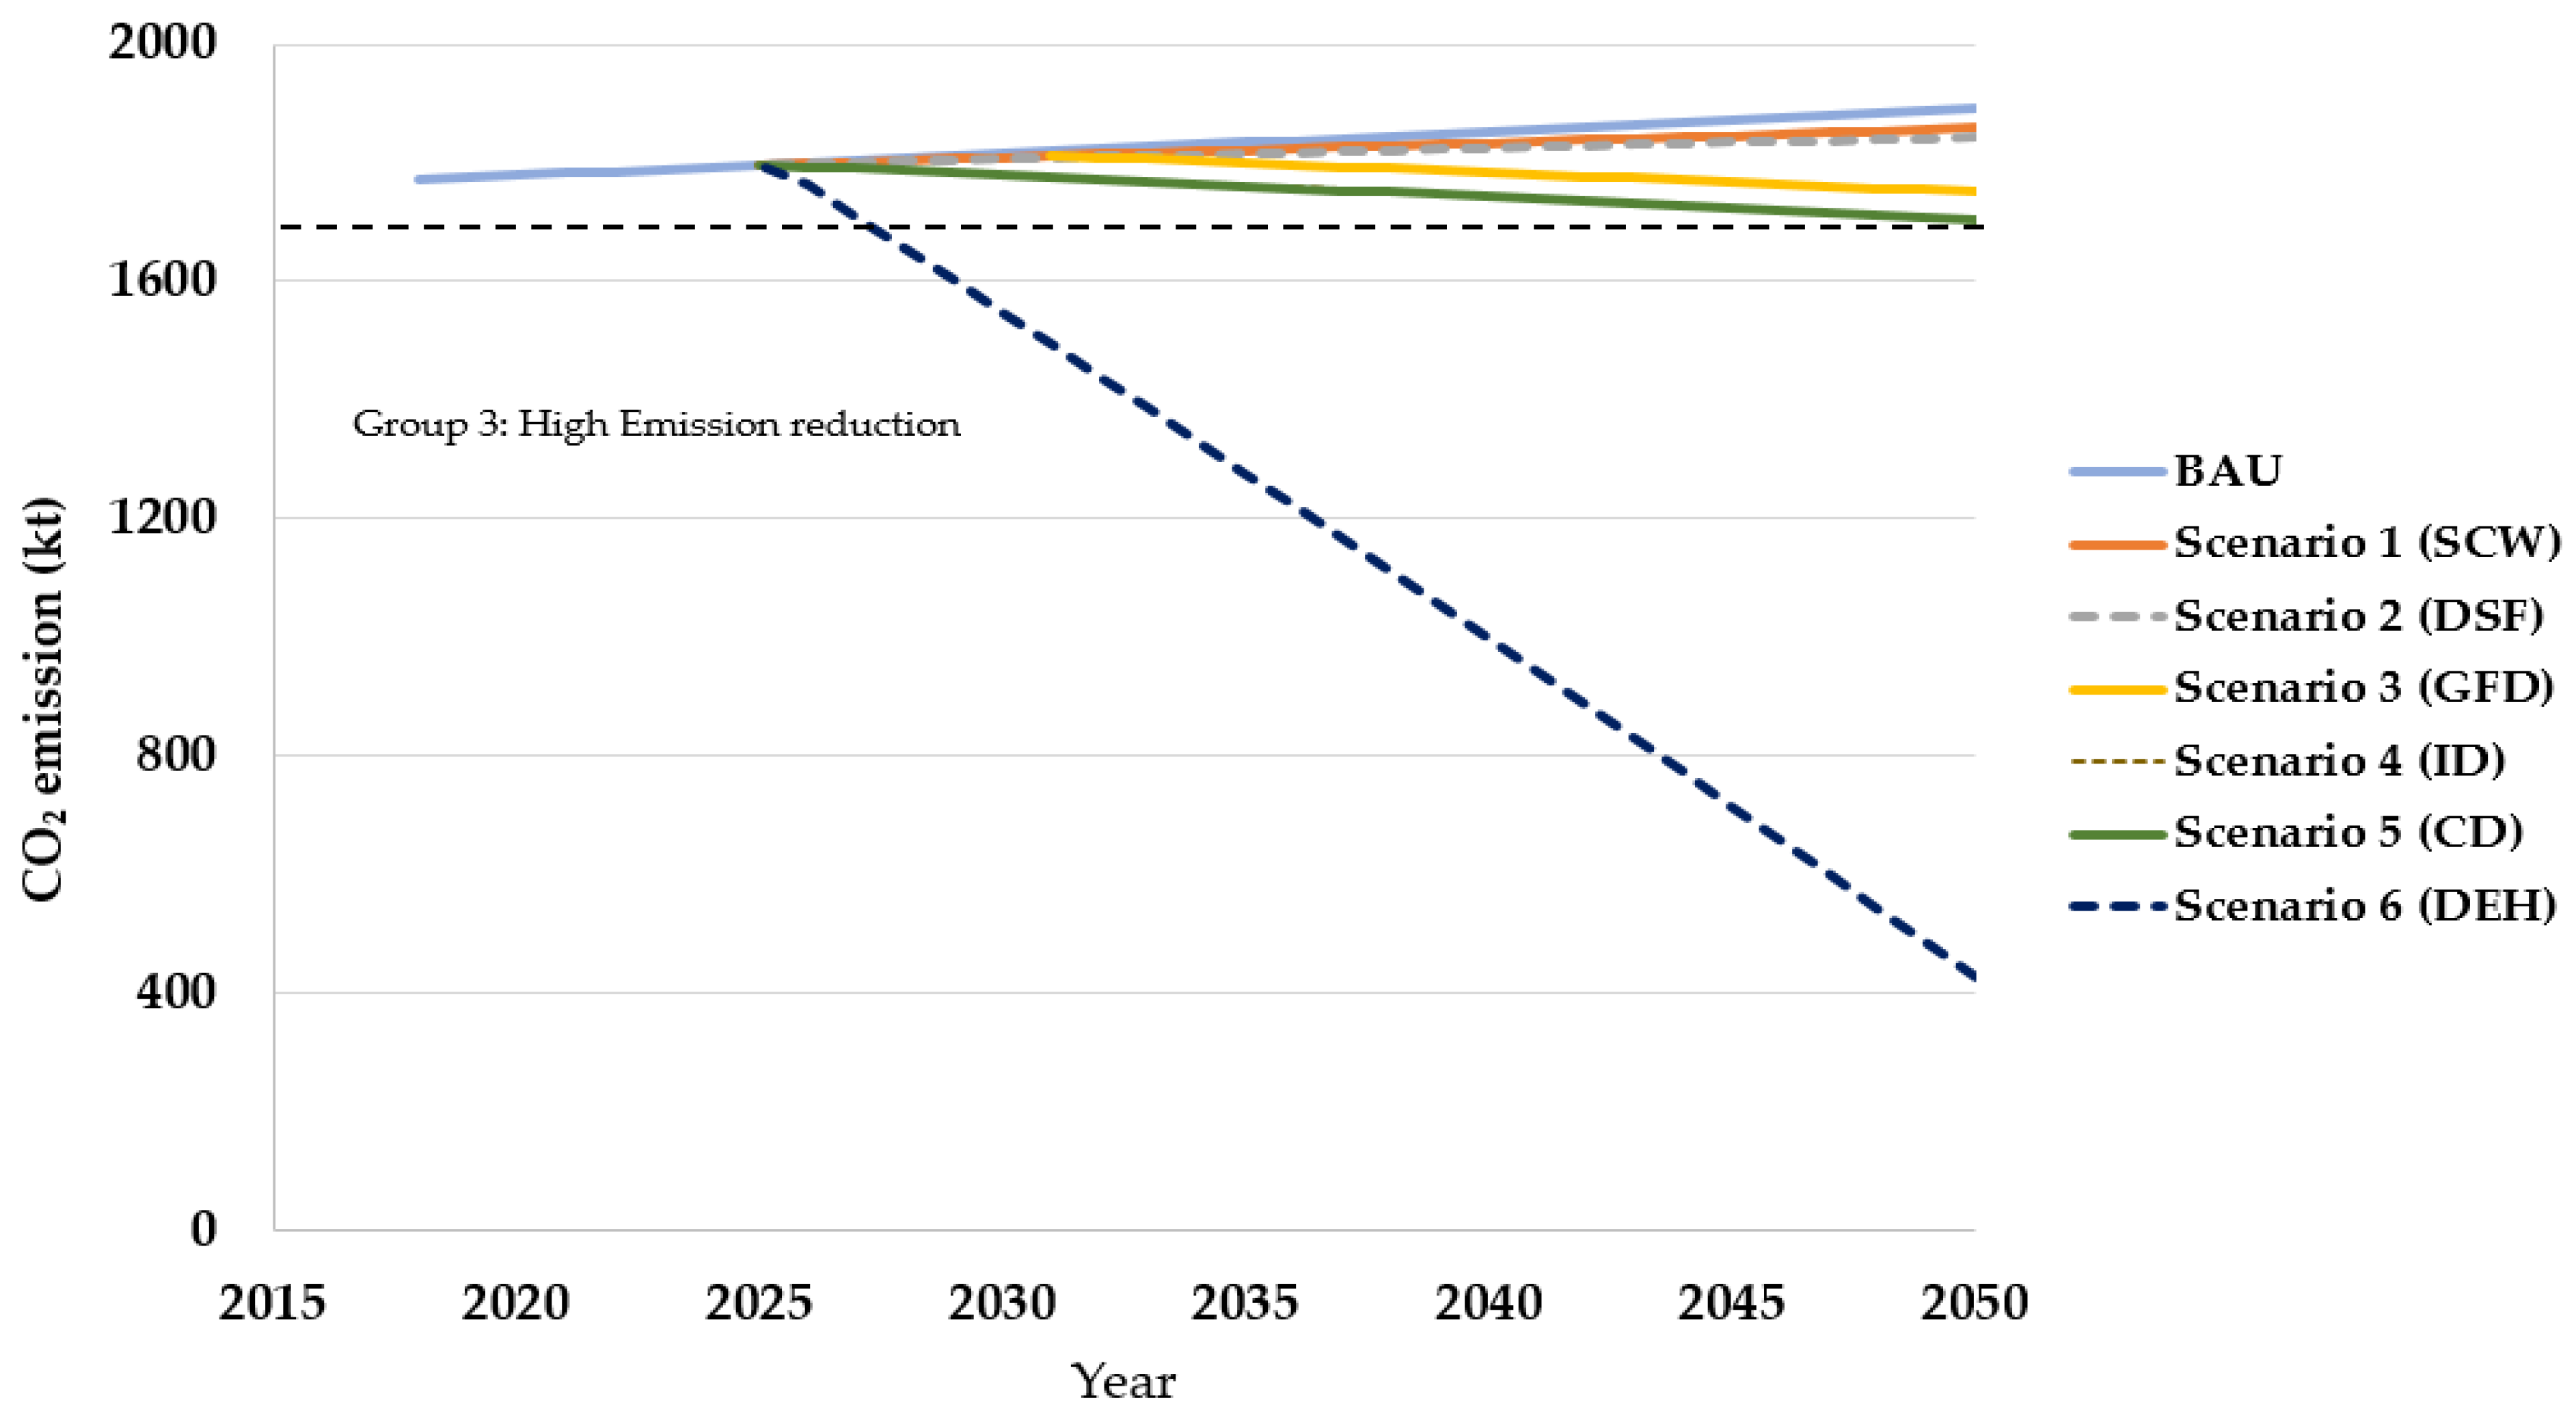
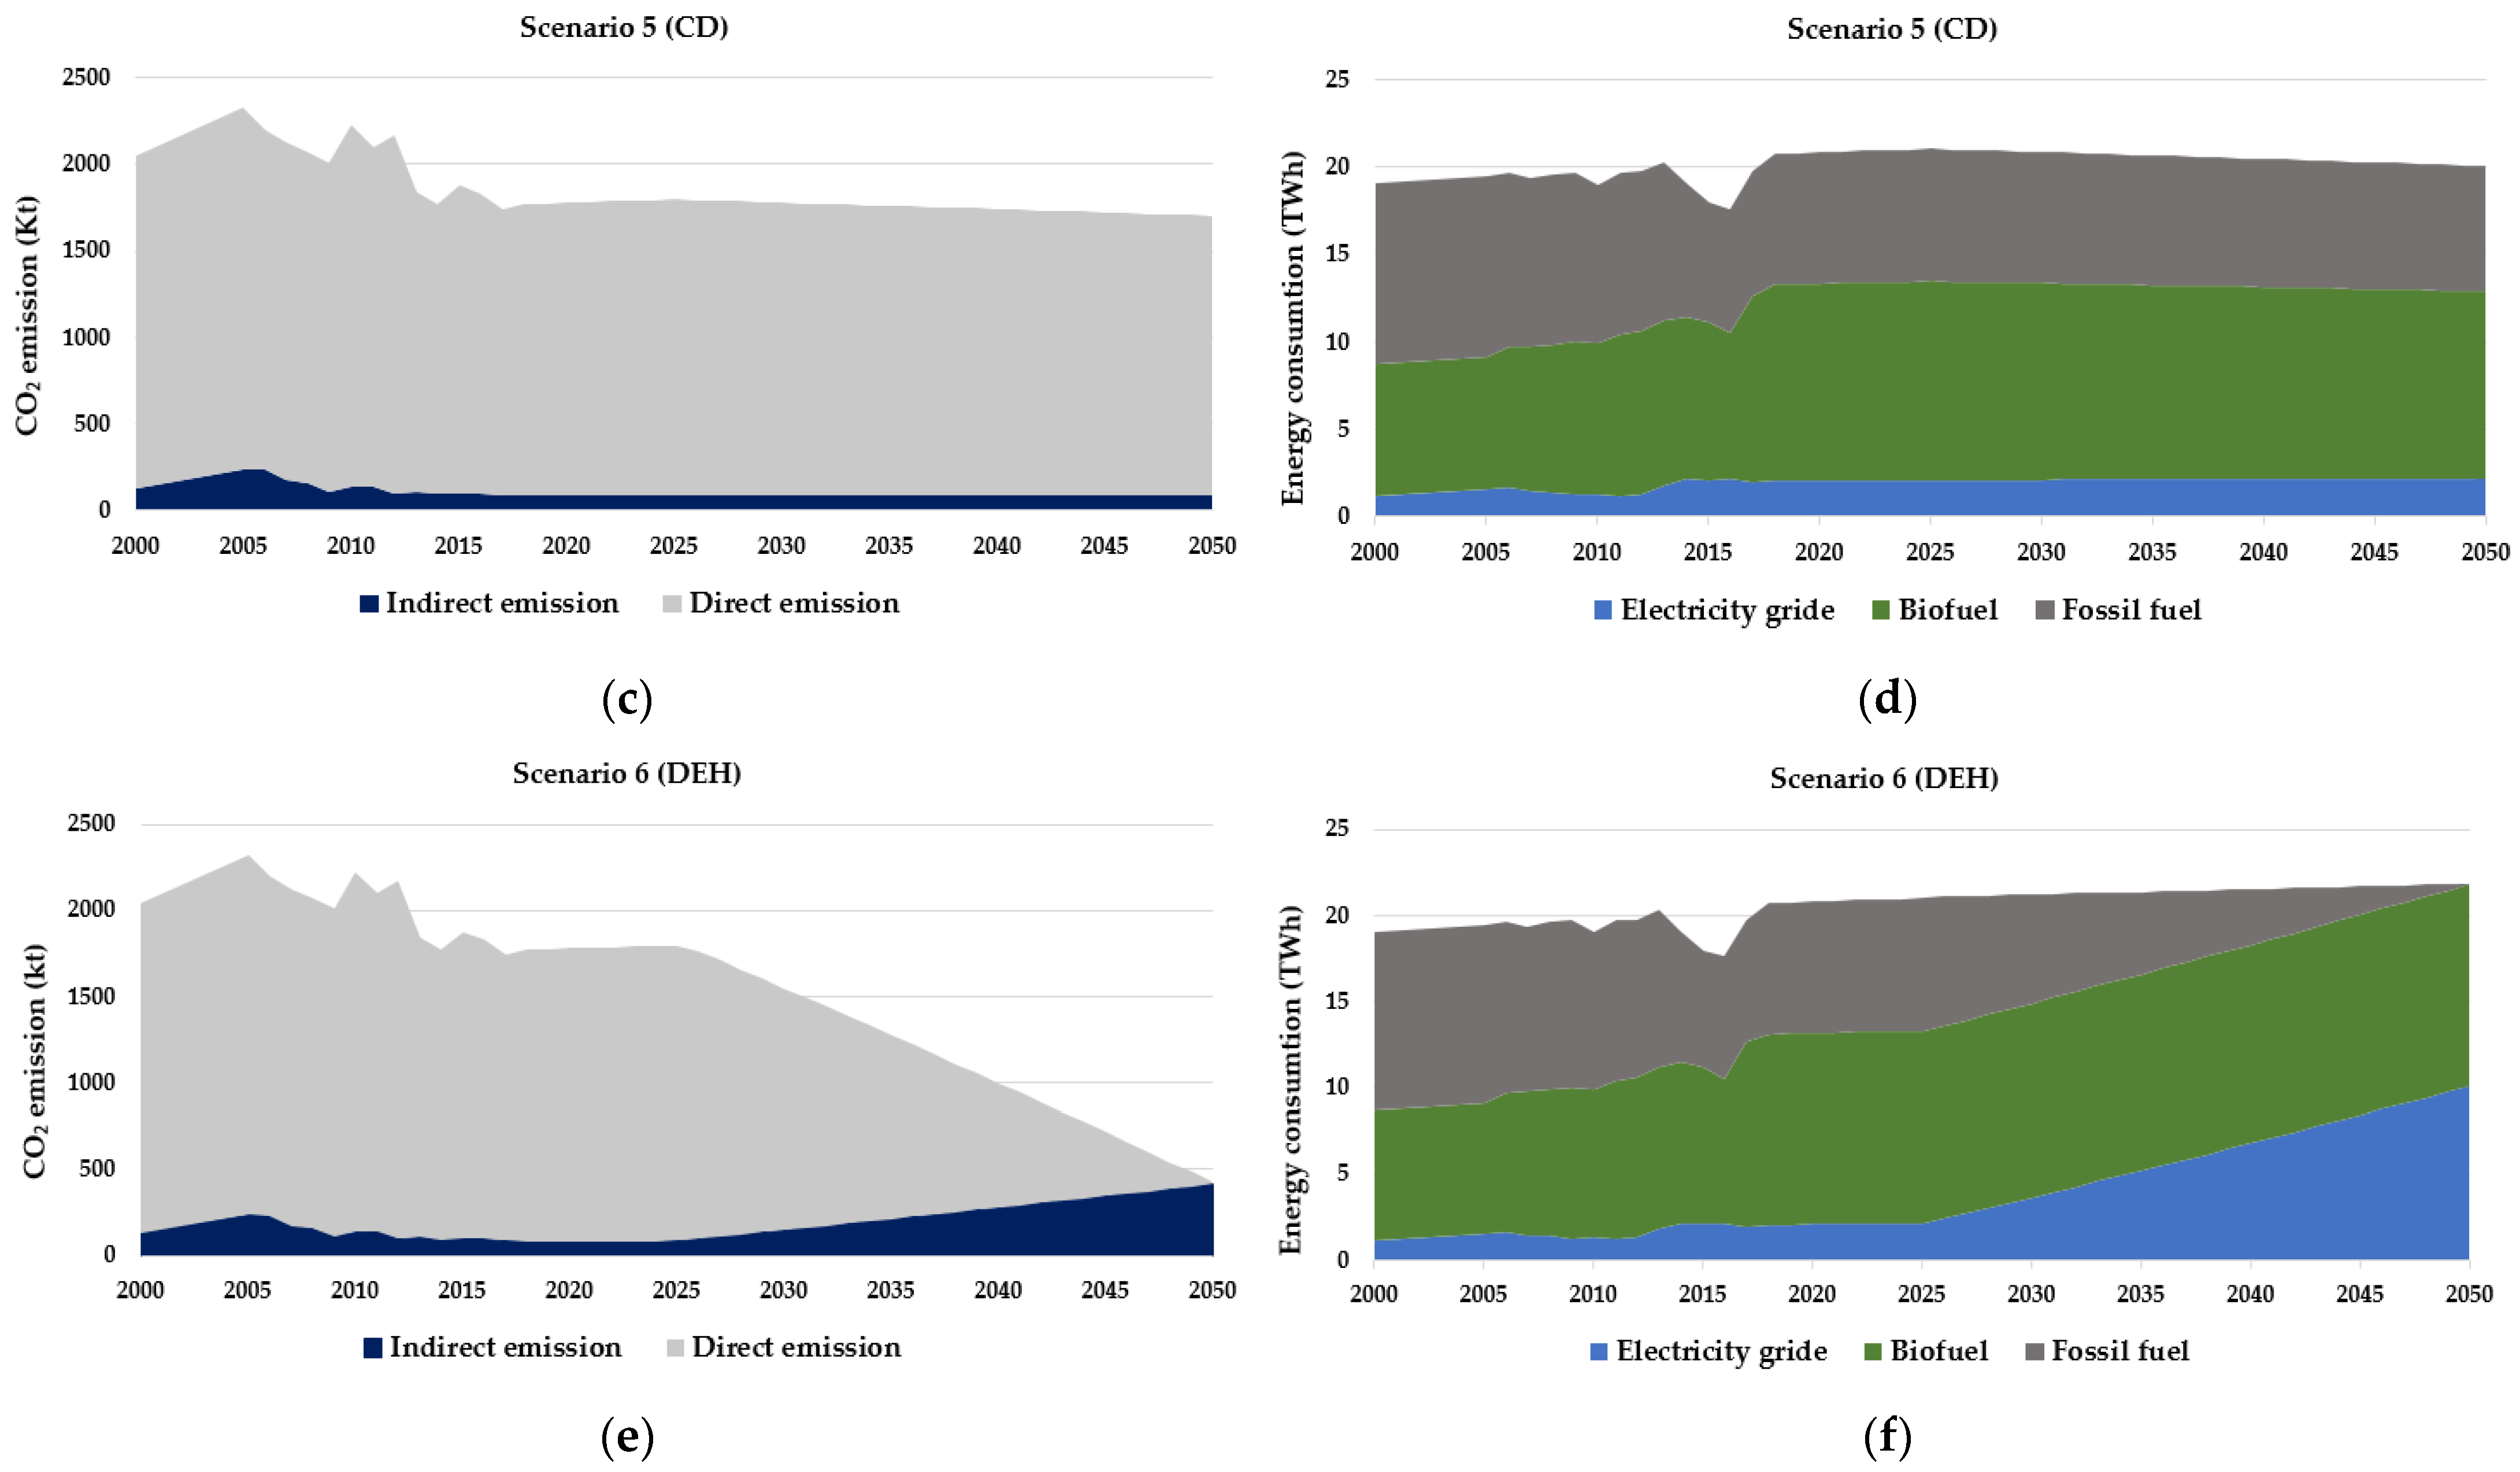
Medium emission reduction (5–10%): this is the category of scenarios in which drying technologies are applied with a maximum carbon reduction of 10% compared to the BAU scenario. The promising technologies in this group are CD (Condebelt drying) with 10% emission reduction potential, ID (impulse drying) with 9.8% emission reduction potential, and GFD (gas-fired dryers) with 7.5% emission reduction potential. The first two options, CD and ID, represent greater heat savings (11%), but GFD would require a less radical change in the production line and a lower investment, which could mean higher deployment in the future. The gas-fired dryer increases the efficiency of heat supply to the drying process but depends on methane combustion, so CO2 emissions are unavoidable. Nevertheless, methane can be obtained from biogas or biomass gasification, and emissions can be prevented, at least partially.
High emission reduction (>75%): this category includes the electrification of the P&P sector using DEH (direct electric heating) technology. DEH replaces the fossil fuel boiler for steam supply with the electric boiler, providing no sustainable improvement in energy efficiency, but eliminating up to 75% of CO
2 emissions. The total energy consumption in this scenario is the same as in the BAU scenario by 2050; however, fossil fuels are completely replaced by grid electricity, which has a significant impact on reducing CO
2 emissions. By applying this technology, direct CO
2 emissions from fossil fuel combustion are removed, and only indirect emissions are calculated, which can be realized depending on the CO
2 intensity of the electricity generation. Electrification of the P&P sector with DEH has the potential to fully decarbonize the sector if CO
2-free electricity is available in sufficient quantities. In 2016, about 63% of Austria’s electricity was generated from renewable sources (hydropower, wind, photovoltaic, etc.), 30% from fossil fuels, and 7% from other sources [
51]. However, an electricity supply from entirely renewable sources is doubtful because, on the one hand, renewable resources in Austria are limited. On the other hand, the demand for renewable energy by other sectors such as industry (use as raw materials), heat-generating industry, transport sector, etc., is increasing and makes this an uncertainty [
52].
This work addresses only a few of the promising technologies from the literature. Although some of the investigated technologies had only a small impact on emission reduction, such measures should be taken to improve energy efficiency and avoid carbon dioxide emissions at each stage of the production process (i.e., pulp production and paper drying). It must be noted that the efficiency measures calculated in this work are based on an additional paper demand, and a lower paper demand or the use of more recycled paper would be helpful in this case. In addition changing the technology in the production process, and decarbonization of the steam supply system also play an important role. Decarbonization of the steam supply system is achieved by electrifying the heat using equipment, such as the electric boiler or replacing fossil fuels with biofuels (e.g., using clean methane or hydrogen instead of natural gas). However, ensuring carbon-free electricity and sufficient biofuel resources is crucial for limiting GHG emissions in the supply chain.
Other technologies besides those considered are expected to play an essential role in the future of the P&P sector. Specifically, the increase of heat recovery and process control, the implementation of black liquor gasification along with carbon capture and storage, and utilizing other electrification options, such as electric heat pumps and electrolysis, alongside the decarbonization of the electricity supply.
7. Conclusions and Outlook
The P&P sector is a dynamic manufacturing industry that will keep its role in Austria’s industrial production, and as an important economic sector. However, the sector, which consumes about 20 TWh of final energy, is responsible for 7% of Austria’s industrial CO2 emissions. For the purpose of reducing CO2 emissions and energy consumption during the production process, this study analyzed the role of mitigation technologies individually for energy consumption and CO2 emissions of the Austrian P&P sector until 2050. This was achieved by using a bottom-up model. The model was applied to analyze the energy consumption (heat and electricity) and CO2 emissions in the main process, related to the P&P production from virgin or recycled fibers. Afterward, technological options to reduce energy consumption and fossil CO2 emissions for P&P production were investigated, and various low-carbon technologies were applied to the model. The modeling results revealed that the technologies applied in the production process (chemical pulping and paper drying) would have a minor impact on emission reduction (maximum 10% due to the use of an impulse dryer), whereas the electrification of the steam supply by replacing fossil fuel boilers with a direct heat supply (such as commercial electric boiler) would enable reducing emissions by up to 75%. This means that the goal of 100% CO2 emission reduction by 2050 cannot be reached with a single method alone. Therefore, the following points appear to be essential, and should be taken into account in the future:
Selecting a combination of technologies, particularly with the electrification of the steam supply, along with the use of carbon-free electricity generated by renewable energy.
Close cooperation with stakeholders to select the most promising decarbonization options.
Consideration of industry sectors coupling to explore the possibility of using waste heat and biofuel generated in nearby industries.


