Abstract
Conventional experimental methods for testing the performance of super-capacitors include the measurement of capacitance through charge and discharge, measurement of equivalent series resistance (ESR) and measurement of self-discharge and the equivalent circuit model (ECM) by electrochemical impedance spectroscopy (EIS). However, the methods are not suitable for the mass production line of supercapacitors since they require a long time for the test and several kinds of different instrument. EIS is an attractive method to evaluate the performance of supercapacitors except that it takes a long time for a single test. In this paper a fast EIS instrument suitable for quality assurance for the mass production of supercapacitors is proposed. In order to reduce the time for the test, a multi-sine sweeping method is used for the EIS test and the results are analyzed by extracting the parameters of the ECM to evaluate the performance of the supercapacitors. The proposed instrument is developed to have multi-channel to further decrease the time for the test with a supercapacitor. It is also presented as to how the extracted parameter values of the ECM can be used to evaluate the performance of the supercapacitor.
1. Introduction
A supercapacitor is also known as an electrochemical double-layer capacitor (EDLC). The EDLC super-capacitor differs from a traditional capacitor as its electrodes are composed of a porous conductor such as activated carbon, which has a huge surface area, and it accumulates and keeps the charges on the thin layer of the electrode/electrolyte interface via electrostatic force or non-faradic effect, so that it possesses a huge capacitance (>100 F/g), high power density and long cycle life of more than 100,000 cycles [1,2]. These characteristics make it suitable for new and renewable energy source applications requiring high power output such as wind power generation systems, photovoltaic power generation systems, electric vehicles, railways, and uninterruptable power supply (UPS) systems [3,4]. Typically, the systems require modules that are composed of multiple supercapacitor cells connected in series and parallel. When the cells with uneven performance are used in the supercapacitor module, the performance of the module cannot be maximized, and balancing problems may arise which can cause a failure at the time of application [5,6,7]. Therefore, the defective cells should be selectively removed at the time of production. The capacitance of the supercapacitor may vary depending on several factors such as the electrode and the electrolyte materials. The compatibility of the electrolyte with the electrode material plays a crucial role in the development of a supercapacitor because the electric double layer is established at the electrode/electrolyte interface. The voltage of a super-capacitor depends on the stability of the electrolyte [8,9]. Typical factors that determine the performance of a supercapacitor include capacitance, equivalent series resistance (ESR), and self-discharge rate [7,10,11]. According to several studies, little is known about why electrochemical mechanisms cause gradual loss of voltage in charged supercapacitors stored at open circuit for several months [12]. The root cause of self-discharge is believed to be different electrochemical reactions at different times and environmental effects [6]. Therefore, several kinds of test are required to evaluate the overall performance of the supercapacitors. However, it is impossible to apply it to all the cells to be mass-produced [10] since it is not feasible in terms of time and cost for the tests. The electrochemical impedance spectroscopy (EIS) method can be a good substitute for the performance evaluation of the supercapacitor that can provide clear and authentic information about the characteristics of supercapacitors. However, it is also very difficult to apply it to all the cells to be mass-produced since one single-cell test at a time takes a long time due to the multiple frequency points. The conventional EIS method is not suitable for the quality assurance (QA) process in the production line where the production capacity per month is over several hundreds of thousands. It is commonly verified in the literature that ESR can be properly determined using electrochemical impedance spectroscopy (EIS). The ESR value can be accurately determined at high frequencies 1 kHz and greater. This method is quite simple to apply since it does not rely on the use of a particular equivalent circuit model for the device [13].
In this paper a novel method to measure the impedances of multiple number of super-capacitors with a combined multi-frequency EIS technique is proposed which can replace the time-consuming DC tests such as charge/discharge and self-discharge tests. The proposed system is suitable to apply for mass production as it uses only seven frequency points to characterize the supercapacitor and the perturbation signals are combined to acquire the impedance spectrum of the supercapacitor in a short period of time. All the test frequency components are integral multiples of the lowest frequency component and the total time for the test is a reciprocal of the lowest test frequency. Also, the proposed instrument is a multichannel instrument that can characterize multiple supercapacitors cells at the same time with a single test. After the test the parameters of the supercapacitors can be extracted using a suitable equivalent circuit model and complex non-linear square (CNLS) method and the performance of the supercapacitors can be evaluated by comparing the parameter values.
2. Performance Evaluation of the Supercapacitor Using Electrochemical Impedance Spectroscopy (EIS) Tests
2.1. Electrochemical Impedance Spectroscopy
EIS is widely used as a tool for analyzing the characteristics of electrode reactions and composites in the field of electrochemistry. It is a process that generates alternating current (AC) perturbation to a device and acquires the AC response from it [14,15]. The AC signals swept over a wide range of frequencies to generate an impedance spectrum for the electrochemical cell under test. Analysis of the impedance spectrum provides comprehensive information about the nature and structure of the complex reactions taking place inside the electrochemical cell under test. EIS differs from direct current (DC) techniques in that it allows the study of capacitive, inductive, and diffusion processes taking place in the electrochemical cell [16]. In recent years, studies have been conducted to model and diagnose electrochemical power devices such as fuel cells, batteries, and supercapacitors by using such a method.
Since EIS requires measurement of impedance components at many frequencies, the time required for the test is calculated as the inverse sum of all the measured frequencies as Equation (1). To analyze the impedance spectrum of a supercapacitor through electrochemical impedance spectroscopy, it takes a long time because tests up to 0.01 Hz are required [17].
In order to reduce the time taken for the test the perturbation signals are combined and injected at once to the supercapacitor and the response are analyzed to calculate the impedance of the supercapacitor at each frequency. The time for the test can be further reduced by expanding the multi-channel structure (currently three channels) of the instrument. Therefore, the proposed method is suitable for a mass production of supercapacitors to evaluate the performance of each supercapacitor in a short period of time. The total time required for the proposed EIS method is the reciprocal of the lowest frequency as shown in Equation (2).
2.2. Equivalent Circuit Model of the Supercapacitor
The equivalent impedance model of the super-capacitor is composed of an equivalent series inductance LS, a series resistance RS and a pore impedance ZPORE as shown in Figure 1. Here, ZPORE represents the non-ideal porous electrode by a ladder circuit in which an electrolyte resistance Re connected in parallel with a constant phase element (CPE) are connected in parallel as expressed by Equation (3) [18,19]. Figure 2 shows the Nyquist impedance representation of the equivalent circuit model of the supercapacitor.
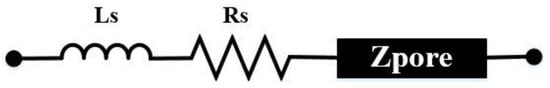
Figure 1.
Equivalent circuit model of supercapacitor.
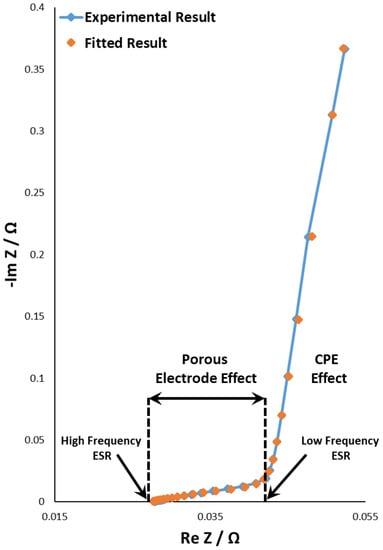
Figure 2.
Nyquist impedance plot of a supercapacitor (2.7 V, 10 F) at 0% SOC (state-of-charge) and the curve fitting result.
In this study supercapacitors (2.7 V 10 F) are tested by EIS at 0%, 60%, and 100% SOC (state-of-charge), respectively. The measured Nyquist impedance plots are shown in Figure 3a for a single sample. As the SOC of the supercapacitor increases, the real part of the impedance increases and the absolute value of the imaginary part decreases. The experimental results were obtained by using the system developed in the laboratory which will be presented in Section 3 and Section 4. Figure 3b shows the variation of extracted parameter values at each SOC obtained with the equivalent circuit model of the supercapacitor and the impedance spectrum at each SOC.
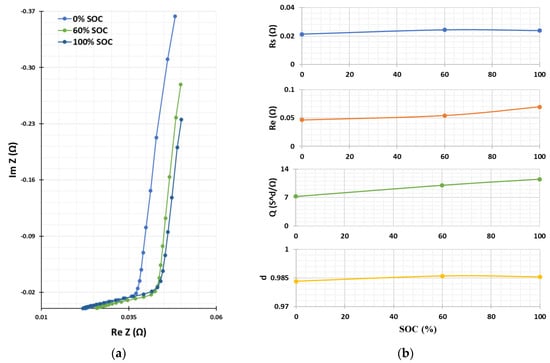
Figure 3.
(a) Nyquist impedance plots of a supercapacitor (2.7 V 10 F) at 0%, 60% and 100% SOC (b) Parameters variation at each SOC.
2.3. Power Loss by the Equivalent Series Resistance
Supercapacitors are made of porous electrodes, so they cannot be represented by equivalent series resistors and pure capacitors. Therefore, the magnitude of the real component varies depending on the frequency and can be classified into a high-frequency equivalent series resistance (HF ESR) at a high frequency and a low-frequency equivalent series resistance (LF ESR) at a low frequency [8]. Where HF ESR can be expressed as Rs and LF ESR can be expressed as RS + Re/3. Also, as the SOC increases, the equivalent series resistance in the low-frequency region increases. The loss due to the resistance component can be obtained by Equation (4) [11].
where ‘I’ is the current flowing through super-capacitor, Ie is the electrode current, Iw current flowing through the CPE component and Rw is the resistance component of CPE. Therefore, the higher the electrode resistance Re and CPE resistance component at HF ESR, the higher the power loss [19].
2.4. Evaluation of the Capacitance
In the AC test, the magnitude of the capacitance varies depending on the frequency of the perturbation current and the time to affect the porous electrode [17]. This becomes constant below 0.1 HZ as shown in Figure 4.
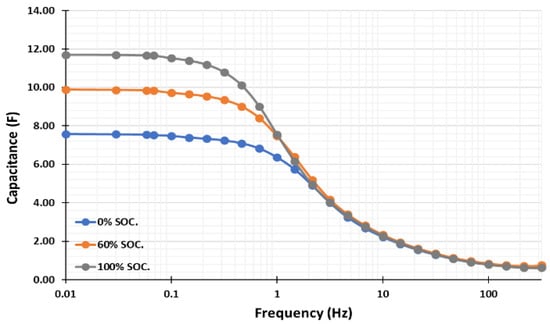
Figure 4.
Capacitance variation depending on the frequency at each SOC.
The imaginary part of the impedance obtained by the EIS at the lowest frequency contains the sum of the inductance L and the capacitance, Therefore, the capacitance can be calculated by Equation (5) and further simplified as Equation (6).
2.5. Evaluation of the Self-Discharge by Using ‘d’ Parameter of the Pore Impedance
The charges in supercapacitors move from the electrolyte to the electrode and vice versa during charge and discharge, respectively. After the charge/discharge a diffusion phenomenon occurs to the opposite direction due to the difference in charge density and the shape of adsorption, depending on the distance from the electrode [7]. The diffusion reaction appears in the form of a spontaneous self-discharge in a supercapacitor. Among the equivalent circuit parameters of the capacitor, the coefficient ‘d’ in Equation (3) is the most influential to the self-discharge. The self-discharge mainly caused by the diffusion in the porous electrode can be explained in detail by considering the CPE [10]. In order to show the relationship between the self-discharge and the coefficient d in the pore impedance MATLAB simulation was performed. The equivalent circuit used for the simulation given by Equation (7) in the frequency domain can be represented by Equation (8) in the time domain. The charge current in the simulation is a step function and Equation (9) is the final form of the equation used for the simulation, where Γ is the gamma function, IC the constant current and H the step function [10]. To investigate the self-discharge characteristics of the super-capacitor according to the change in ‘d’ value, the response of charge/self-discharge current of 100 mA is shown in Figure 5a.
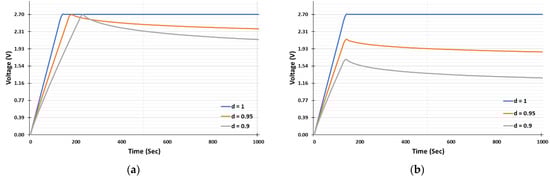
Figure 5.
(a) Simulation of self-discharge with different “d” parameter up to Vrated = 2.7 V (Ic = 100 mA, C = 10 F, equivalent series resistance (ESR) = 0.065 mΩ) (b) Simulation results of self-discharge with different ‘d’ parameters (Ic = 100 mA, C = 10 F, ESR = 0.065 mΩ).
At first, a constant current (IC) is applied to the supercapacitor and the current is cut off after 140 s. The voltage response of the supercapacitor is calculated by using the equivalent circuit model of the supercapacitor as shown in Equation (9) [10]. As shown in Figure 5b, the supercapacitor is charged up to its rated voltage 2.7 V when d = 1. However, it reaches 2.141 V and 1.693 V at 140 s when d = 0.95 and d = 0.9, respectively, which means that it takes more time to reach 2.7 V when d is less than 1. It is also observed that the self-discharge becomes severe with a smaller value of ‘d’. As ‘d’ approaches 1, it exhibits pure capacitor characteristics and results in less charge time and more self-discharge.
In this section it is described that the equivalent circuit parameters of the supercapacitor by the EIS can be used to evaluate the performance of the supercapacitor. Therefore, it can be applied to the mass production line of the supercapacitors for the quality assurance process if the time required for the test is reduced to a reasonable value.
3. Proposed Multi-Sine Multi-Channel EIS Instrument
The proposed instrument needs to be precise, robust and capable of acquiring the feedback signals for all channels simultaneously. The block diagram of the proposed system is presented in Figure 6 and it will be explained in this section thoroughly.
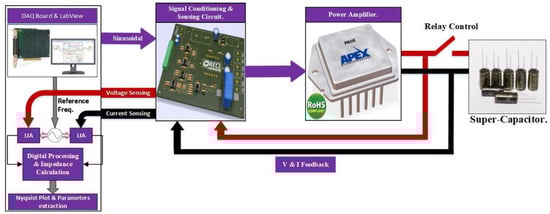
Figure 6.
Block diagram of the proposed system.
The graphical user interface (GUI) is developed using NI-LabView 2018. An NI-PCI-6154 DAQ data acquisition board is used, and a signal conditioning and sensing circuit is placed in between the data acquisition DAQ board and the device under test (DUT). A combined multi-sine waveform with desired amplitudes and frequencies is generated by DAQ and used to control the power amplifier which perturbs the supercapacitor.
Then the current and voltage signals by the perturbation are sensed and converted into digital data. The PCI-6154 is a simultaneous sampling multifunction input/output I/O device for PCI bus computers from National Instruments. It is an isolated PCI device featuring four isolated differential 16-bit analog inputs (AI), four isolated 16-bit analog outputs (AO), six digital input (DI) lines, four digital output (DO) lines, and two general-purpose 32-bit counter/timers. All analog to digital converter (ADC) converters and digital to analog converter (DAC) converters are capable of sampling the data at 250 KS/s for each channel. The 16-bit ADC makes the board capable of sampling the voltage and current waveforms simultaneously with a very high resolution of 305 μV/Bit. Only the desired frequency component of the waveform is extracted using a lock-in amplifier (LIA). Figure 7a shows the developed hardware. It is capable of testing three supercapacitor cells at the same time in a single test which can be increased as many as the number of channels in a DAQ board. Figure 7b represents the topology used for acquiring multi-cell voltage and current information.
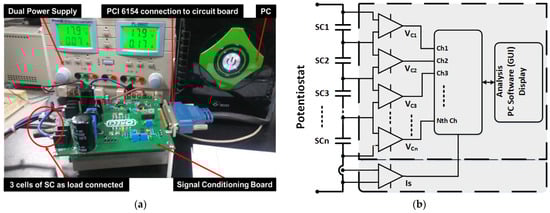
Figure 7.
(a) Picture of the developed multi-sine/multi-channel electrochemical impedance spectroscopy (EIS) system. (b) Multichannel differential data acquisition circuit.
3.1. Perturbation and Power Control
Figure 8 shows the power op-amp, APEX PA-05, used in the instrument that is capable of dissipating 250 watts. The multi-sine reference voltage generated by DAQ is fed to the power operational amplifier.
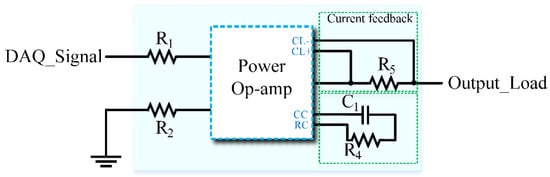
Figure 8.
Power op-amp (Apex PA-05) used to perturb the supercapacitor.
In a multi-sine combined signal, all the high-frequency components to be combined are the integral multiple of the lowest frequency of the perturbation. In this method, all the other frequency components are superimposed on the lowest frequency. It is used to control the power op-amp and it perturbs the supercapacitor. The voltage and current are sensed and processed through the LIA. Then the impedance at each frequency is calculated to draw the Nyquist impedance plot. The resulting impedance spectrum is then used to extract the equivalent circuit parameters by the curve fitting, and it is used to evaluate the performance of the supercapacitor. A multi-sine combined signal applied to the supercapacitors are shown in Figure 9.
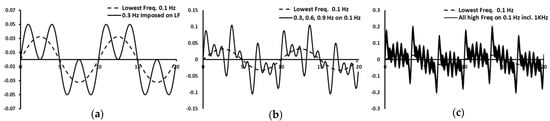
Figure 9.
Combined multi-sine method. (a) Lowest frequency 0.1 Hz and 0.3 Hz imposed on 0.1 Hz (b) 0.3 Hz, 0.6 Hz, 0.9 Hz super imposed on 0.1 Hz. (c) All the frequencies including high frequency components superimposed on 0.1 Hz.
3.2. Voltage Measurement and Acquisition
When the multi-sine combined sinusoidal waveform at the output of power op-amp is applied to the supercapacitor, the resulting voltages are acquired by the ADCs through the voltage feedback circuit as in Figure 10a. The voltage feedback circuit has three stages including a simple voltage follower to stabilize the signal, an active low pass filter that filters out all unwanted noises and a gain multiplier used to amplify the signal. The output of all these three stages is an AC feedback signal from the load which is acquired by the DAQ for the impedance calculation.
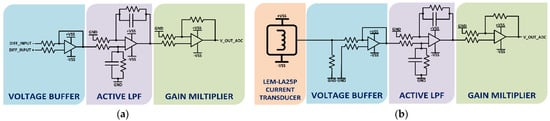
Figure 10.
(a) Voltage measurement circuit. (b) Current measurement circuit.
3.3. Current Measuremnet and Acquisition
The resulting current in response to the applied voltage perturbation is sensed through current transducer LEM LA-25P, which is a closed-loop current transducer using the Hall effect with a conversion ratio of 1:1000 and an accuracy of ±0.95%. Figure 10b presents the current feedback signal conditioning circuit. It has four stages including a current transducer, a voltage follower, an active low pass filter and a gain multiplier.
4. Software for the Proposed Instrument
The basic workflow of the developed software is presented in Figure 11. It is explained in detail in the following sections.
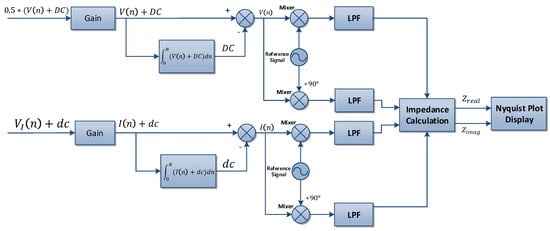
Figure 11.
Block diagram for workflow of developed software.
4.1. Graphical User Interface
The GUI for the developed system is simple yet powerful, and it is a complete software perturbing the device under test by multi-sine combined signal, acquiring the signals, analyzing, plotting the complex Nyquist impedance plot, and extracting the required parameters based on the selected model by the CNLS curve fitting technique. Figure 12 presents the front panel of the developed GUI consisting of the main impedance plot; at the right are the extracted parameters variables. There is a run button that starts testing the supercapacitors and plotting the impedance plot simultaneously at each frequency. There is a save to disk button to save the results to a text file or an Excel file depending on the user’s choice. There is an exit button to stop the software once the test is completed. The software was developed using NI LabView 2018 software provided by National Instruments.
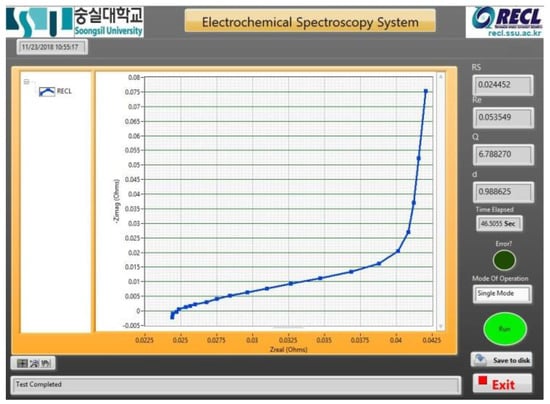
Figure 12.
Front panel of developed graphical user interface (GUI).
4.2. Implementing Lock-In Amplifier
Usually, LIA requires PLL (phase-locked loop) to generate its internal reference signal locked to the external reference. Therefore, LIA was used for the development of the proposed system. LIA can generate a pure sinusoidal waveform without an external VCO (voltage controlled oscillator) and a PLL and provide perfect synchronization between the generated signal and the acquired one. LIA is capable of calculating the in-phase and in-quadrature components only at the reference frequency from the resulting response signal by injecting the generated reference signal [20,21].
Thus, LIA allows higher accuracy for the measurement of small AC signals in the low-frequency range and acquires less computational time. LIA implemented in the proposed system extracts the Fourier components of the reference frequency from the acquired current and voltage measurements and the impedance at the reference frequency can be calculated from the results. The block diagram shown in Figure 13 has an input signal Vin measured from the system in response to the generated perturbation, two reference signals with 0 degree and 90-degree phase shift, respectively. The input signal is multiplied with the reference signal having a 0-degree phase shift and passed to low pass filter (LPF) to produce the X component or in-phase component. The same input signal is then multiplied to the 90-degree phase shifted reference and passed to the LPF to produce the Y component or quadrature-phase component. The principle of LIA is presented by Equations (10)–(12).
where, Vin is the input signal, is the peak amplitude of Vin, is the frequency in radian of Vin and is the phase of Vin. Equations (11) and (12) are the sine and cosine reference signals.
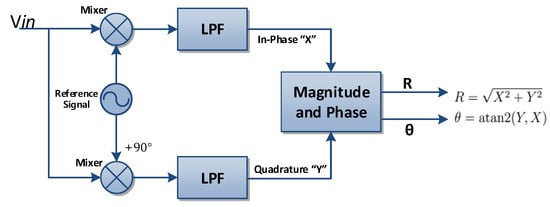
Figure 13.
Block diagram for developed digital lock-in amplifier DLIA.
By multiplying Equation (10) with Equations (11) and (12) we obtain OutX and OutY as in Equation (13) and Equation (14).
The signals in Equations (13) and (14) are passed through LPF to eliminate the high-frequency components and as a result we can obtain only in-phase and quadrature-phase components as X and Y in Equations (15) and (16).
The amplitude and phase of the signal of interest can be finally given by Equations (17) and (18).
The above process is applied to acquire amplitude and phase for both current and voltage measured signals acquired by DAQ.
4.3. Complex Non-Linear Least Square Curve Fitting
CNLS is used to fit the measured data with the given equivalent circuit and find the optimal parameters of the model. The CNLS method is the Levenberg–Marquardt least square method which can be applied to the complex numbers [22,23]. It is an iterative method for curve fitting, and during curve fitting the accuracy of the fitting is continuously evaluated by calculating the chi-square value which represents the sum of the least squared error between the measured data and the calculated fit data. For any circuit, its impedance can be shown as Equation (19).
where is the parameter present in the selected electrical equivalent circuit model. These parameters can be estimated by minimizing the function in Equation (20).
In order to minimize the condition shown in Equation (21) needs to be satisfied.
In general, since the value of in the function f () is not known, an initial estimate is used. Then, the Taylor series expansion of function f can be represented by Equation (22).
The equation to calculate can be formed by combining Equation (21) and Equation (22) as in Equation (23).
where:
and,
With the initial data set of θj, the value of Φ1 can be calculated, and then ∆θ is calculated. The updated θ is consequently used to calculate the new Φ. This calculation will be in iterative procedure until Φ converges to a certain limit, 10−6 in our case. Figure 14 presents the flow chart for the CNLS procedure.
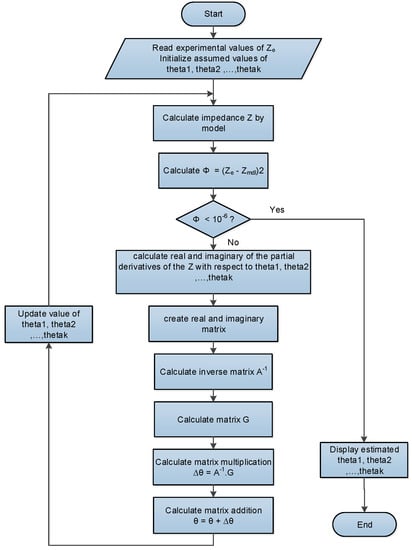
Figure 14.
Flow chart for the procedure of complex non-linear least square method.
5. Discussions and Experimental Results
This section presents the discussions on accuracy and precision of the system as compared to the commercially available instrument. To verify the validity and accuracy of the proposed system, the measured results were compared to those by the commercial EIS instrument known as WEIS500 manufactured by WonATech Co. Ltd. [24].
Three supercapacitors (C = 10 F, Vrated = 2.7 V) were used in the experiment. All three cells were first tested by the commercial instrument WEIS500 as a general EIS test, Then the Nyquist impedance plots were drawn, and these plots were curve fitted by CNLS to extract the parameters. The same cells were tested with the proposed instrument as well. The results were closely matched to the commercially available instrument.
Table 1 shows the extracted parameters of samples A, B and C by both WEIS500 and the proposed instrument. It can be observed that the results achieved by the proposed instrument are well matched with those obtained by WEIS500. Figure 15 shows the matched Nyquist plot of each cell by the proposed system are compared to those by WEIS500 instrument to verify the validity and the accuracy of the proposed system. It can be noticed from Table 1 and Figure 15 that both results have well matched with each other. The time can be more reduced by upgrading the proposed instrument to industrial level and increasing the number of channels to ≥40 will make this precise instrument suitable for the mass production of supercapacitors on a production line.

Table 1.
Comparisons of the parameters of samples A, B and C obtained by the proposed method and WEIS500 workstation.
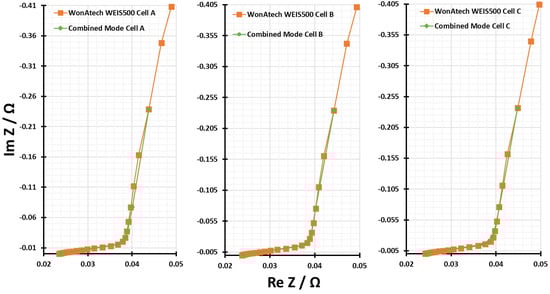
Figure 15.
Comparison of EIS results by WEIS500 and the developed instrument for three supercapacitors A, B, C (C = 10 F, Vrated = 2.7 V).
6. Conclusions
In this paper a robust, accurate and precise EIS system is proposed which is capable of testing multiple super-capacitor cells simultaneously in a short period of time so that it can be applied to a mass production line of supercapacitors for quality assurance. With the extracted parameters of the equivalent circuit of the supercapacitor, the performance of each supercapacitor can be evaluated and the one with low performance or failure can be filtered out on the production stage. With the help of the proposed method, supercapacitors with similar performance can be classified and this helps maximize the performance of the supercapacitor module and reduce the potential performance degradation or failure.
Author Contributions
Conceptualization, F.F. and W.C.; methodology, F.F. and W.C.; software, F.F. and A.K.; validation, F.F., A.K., S.J.L., M.M.N. and W.C.; formal analysis, F.F. and S.J.L.; investigation, F.F., M.M.N.; resources, F.F., A.K. and S.J.L.; data curation, F.F., A.K., S.J.L. and M.M.N.; writing—original draft preparation, F.F.; writing—review and editing, F.F. and W.C.; visualization, F.F., S.J.L. and W.C.; supervision, W.C.; project administration, F.F. All authors have read and agreed to the published version of the manuscript.
Funding
This research received no external funding.
Conflicts of Interest
The authors declare no conflict of interest.
References
- Lei, C.; Lekakou, C. Carbon-based nanocomposite EDLC supercapacitors. Nanotechnology 2010, 1, 176–179. [Google Scholar]
- Zhang, L.L.; Zhao, X.S. Carbon-based materials as supercapacitor electrodes. Chem. Soc. Rev. 2009, 38, 2520. [Google Scholar] [CrossRef] [PubMed]
- Yu, G.; Hu, L.; Vosgueritchian, M.; Wang, H.; Xie, X.; McDonough, J.R.; Cui, X.; Cui, Y.; Bao, Z. Solution-processed graphene/MnO2 nanostructured textiles for high-performance electrochemical capacitors. Nano Lett. 2011, 11, 2905–2911. [Google Scholar] [CrossRef] [PubMed]
- Yu, N.; Yin, H.; Zhang, W.; Liu, Y.; Tang, Z.; Zhu, M. High-Performance Fiber-Shaped All-Solid-State Asymmetric Supercapacitors Based on Ultrathin MnO2 Nanosheet/Carbon Fiber Cathodes for Wearable Electronics. Adv. Energy Mater. 2016, 6, 201501458. [Google Scholar] [CrossRef]
- Linzen, D.; Buller, S.; Karden, E.; de Doncker, R.W. Analysis and Evaluation of Charge Balancing Circuits on Performance, Reliability and Lifetime of Supercapacitor Systems. IEEE Trans. Ind. Appl. 2005, 41, 1135–1141. [Google Scholar] [CrossRef]
- Conway, B.E. Electrochemical Supercapacitors: Scientific Fundamentals and Technological Applications; Springer: New York, NY, USA, 1999; ISBN 0-306-45736-9. [Google Scholar]
- Burke, A. Ultracapacitors: Why, how, and where is the technology. J. Power Sources 2000, 91, 37–50. [Google Scholar] [CrossRef]
- Daraghmeh, A.; Hussain, S.; Saadeddin, I.; Servera, L.; Xuriguera, E.; Corne, A.; Cirera, A. A Study of Carbon Nanofibers and Active Carbon as Symmetric Supercapacitor in Aqueous Electrolyte: A Comparative Study. Nanoscale Res. Lett. 2017, 12, 1–10. [Google Scholar] [CrossRef]
- Gao, Q.; Demarconnay, L.; Raymundo-Pinero, E.; Beguin, F. Exploring the large voltage range of carbon/carbon supercapacitors in aqueous lithium sulfate electrolyte. Energy Environ. Sci. 2012, 5, 9611. [Google Scholar] [CrossRef]
- Kim, S.; Choi, W.; Lee, K.; Choi, S. Advanced Dynamic Simulation of Supercapacitors Considering Parameter Variation and Self-Discharge. IEEE Trans. Power Electron. 2011, 26, 3377–3385. [Google Scholar]
- Kim, S.; Choi, W. Selection Criteria for Supercapacitors Based on Performance Evaluations. J. Power Electron. 2012, 12, 223–231. [Google Scholar] [CrossRef][Green Version]
- Kurzweil, P.; Shamonin, M. State-of-charge monitoring by impedance spectroscopy during long-term self-discharge of supercapacitors and Lithium-Ion batteries. Batteries 2018, 4, 35. [Google Scholar] [CrossRef]
- Vicentini, R.; Da Silva, L.M.; Cecilio Junior, E.P.; Alves, T.A.; Nunes, W.G.; Zanin, H. How to measure and calculate equivalent series resistance of electric double-layer capacitors. Molecules 2019, 24, 1452. [Google Scholar] [CrossRef]
- Macdonald, J.R.; Barsoukov, E. Impedance Spectroscopy; Theory, Experiment, and Applications. History 2005, 1, 1–13. [Google Scholar]
- Basics of Electrochemical Impedance Spectroscopy. Available online: http://www.gamry.com/App_Notes/EIS_Primer/EIS_Primer_2007.pdf (accessed on 10 December 2020).
- Electrochemical Impedance Techniques Potentiostatic EIS. Available online: https://www.gamry.com/applicationnotes/EIS/potentiostatic-eis-tutorial/ (accessed on 10 December 2020).
- Rafik, F.; Gualous, H.; Gallay, R.; Crausaz, A.; Berthon, A. Frequency, thermal and voltage supercapacitor characterization and modeling. J. Power Sources 2007, 165, 928–934. [Google Scholar] [CrossRef]
- Bohlen, O.; Kowal, J.; Sauer, D.U. Ageing behavior of electrochemical double-layer capacitors Part I. Experimental study and aging model. J. Power Sources 2007, 172, 468–475. [Google Scholar] [CrossRef]
- Bohlen, O.; Kowal, J.; Sauer, D.U. Ageing behavior of electrochemical double-layer capacitors Part II. Lifetime simulation model for dynamic applications. J. Power Sources 2007, 173, 626–632. [Google Scholar] [CrossRef]
- Bhattacharyya, S.; Ahmed, R.N.; Purkayastha, B.B.; Bhattacharyya, K. Implementation of digital lock-in amplifier. In Journal of Physics: Conference Series; IOP Publishing: Bristol, UK, 2016; Volume 759, p. 012096. [Google Scholar]
- Khan, R.A.; Ashraf, M.N.; Choi, W. A Harmonic Compensation Method Using a Lock-In Amplifier under Non-Sinusoidal Grid Conditions for Single Phase Grid Connected Inverters. Energies 2021, 14, 597. [Google Scholar] [CrossRef]
- Marquardt, D.W. An algorithm for least-squares estimation of nonlinear parameters. J. Soc. Ind. Appl. Math. 1963, 11, 431–441. [Google Scholar] [CrossRef]
- Levenberg, K. A method for the solution of certain non-linear problems in least squares. Q. Appl. Math. 1994, 2, 164–168. [Google Scholar] [CrossRef]
- SIM4U Version 2 Beta 3. Available online: http://www.wonatech.com/public_html/index.php (accessed on 10 December 2020).
Publisher’s Note: MDPI stays neutral with regard to jurisdictional claims in published maps and institutional affiliations. |
© 2021 by the authors. Licensee MDPI, Basel, Switzerland. This article is an open access article distributed under the terms and conditions of the Creative Commons Attribution (CC BY) license (http://creativecommons.org/licenses/by/4.0/).