Investigations on the Performance of Various Horizontal Ground Electrodes


 ,
,
Abstract
1. Introduction
2. Experimental and Simulation Arrangement
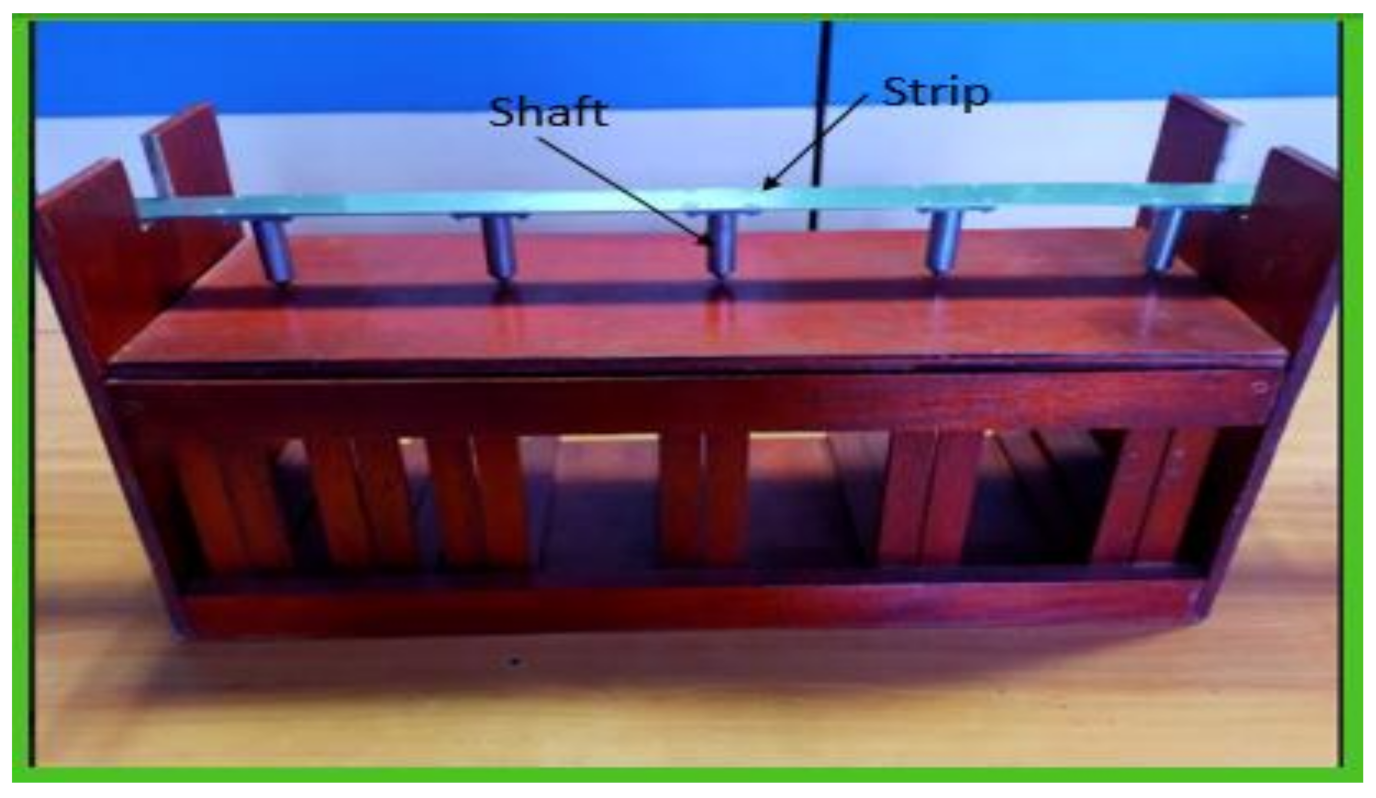
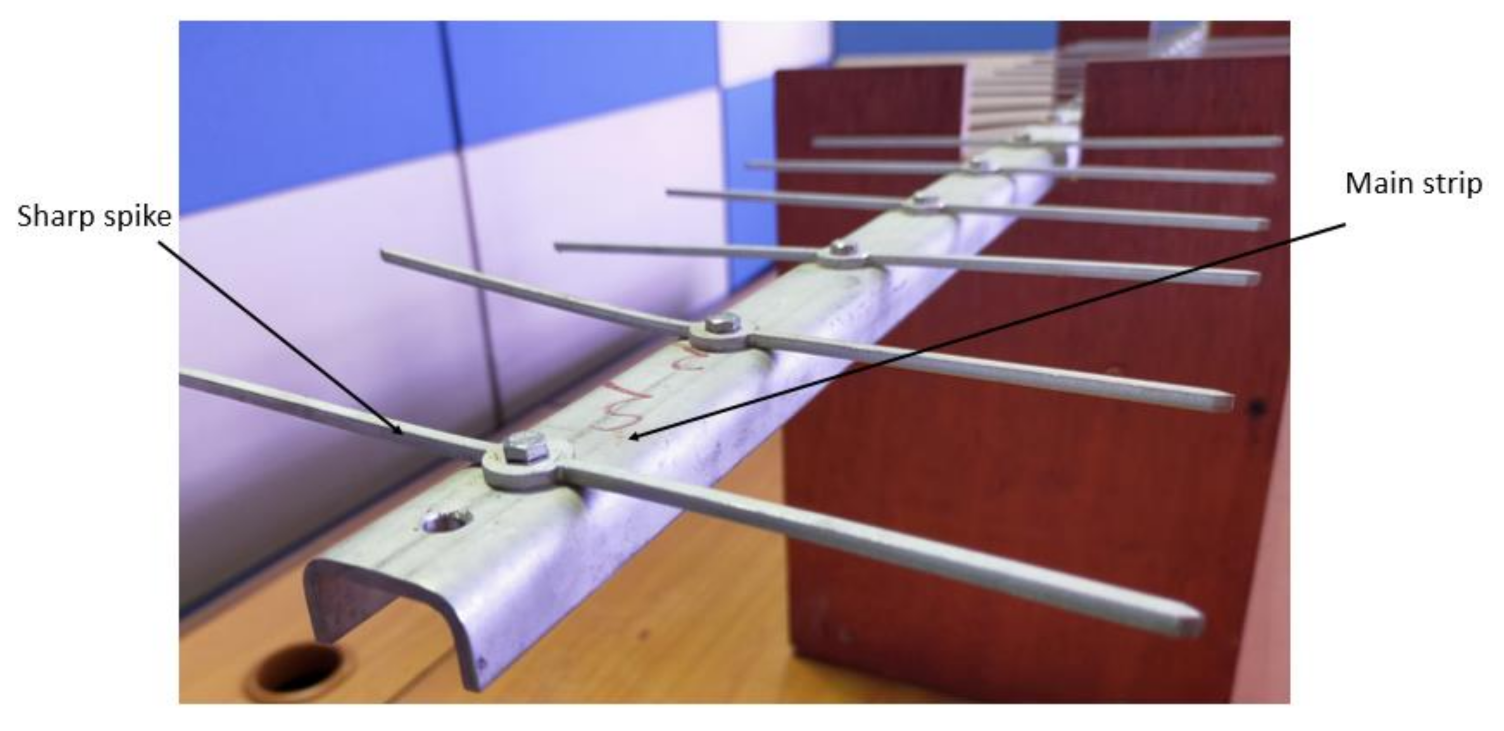
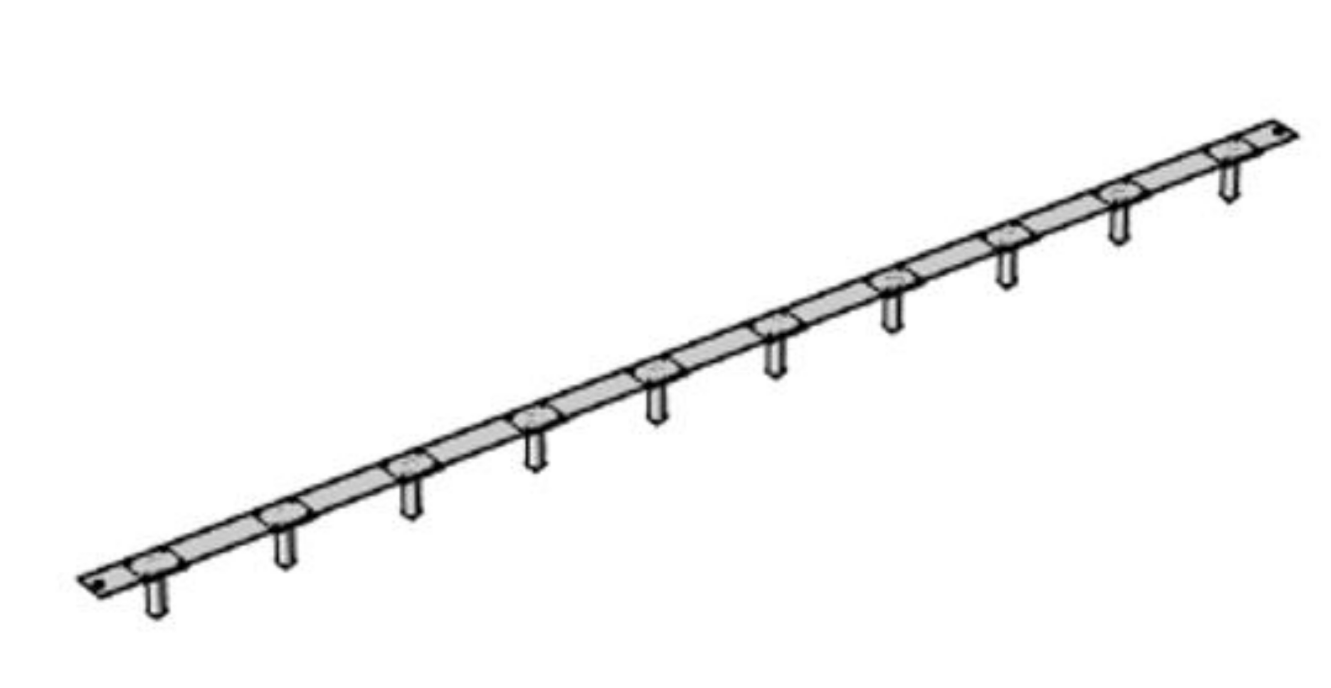
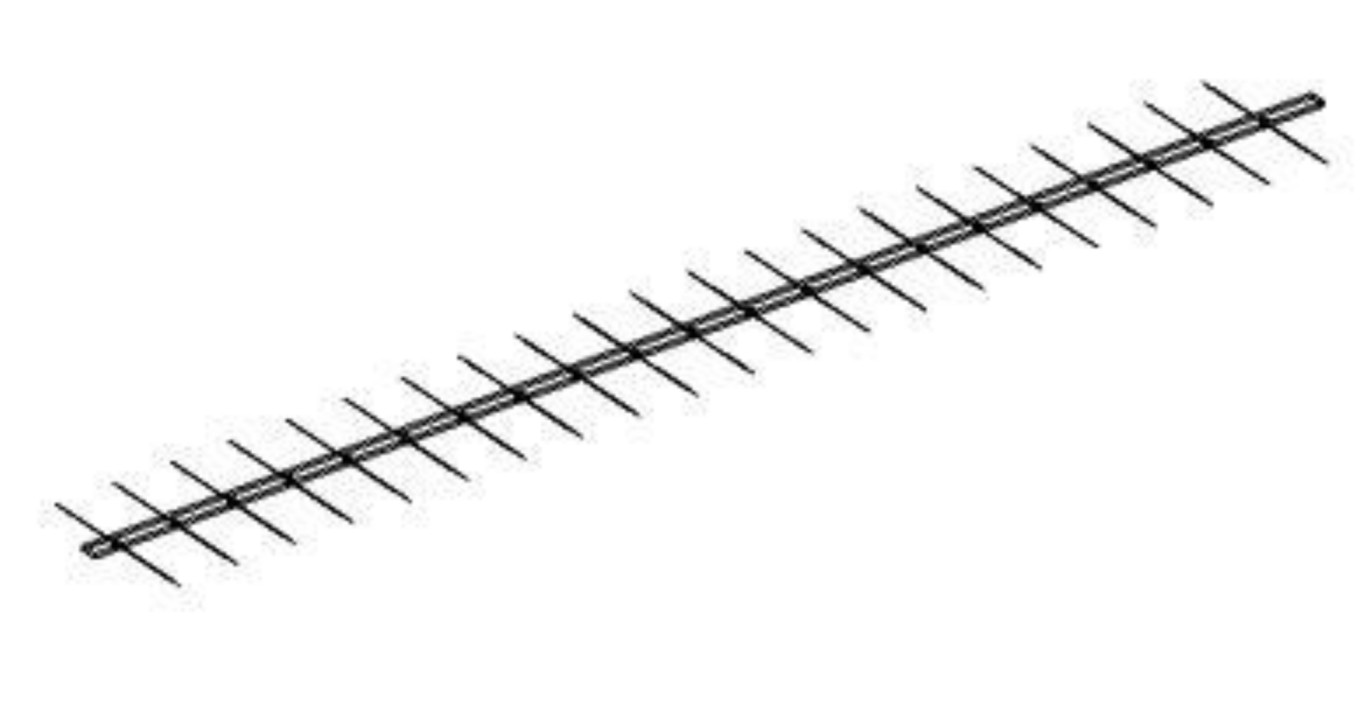
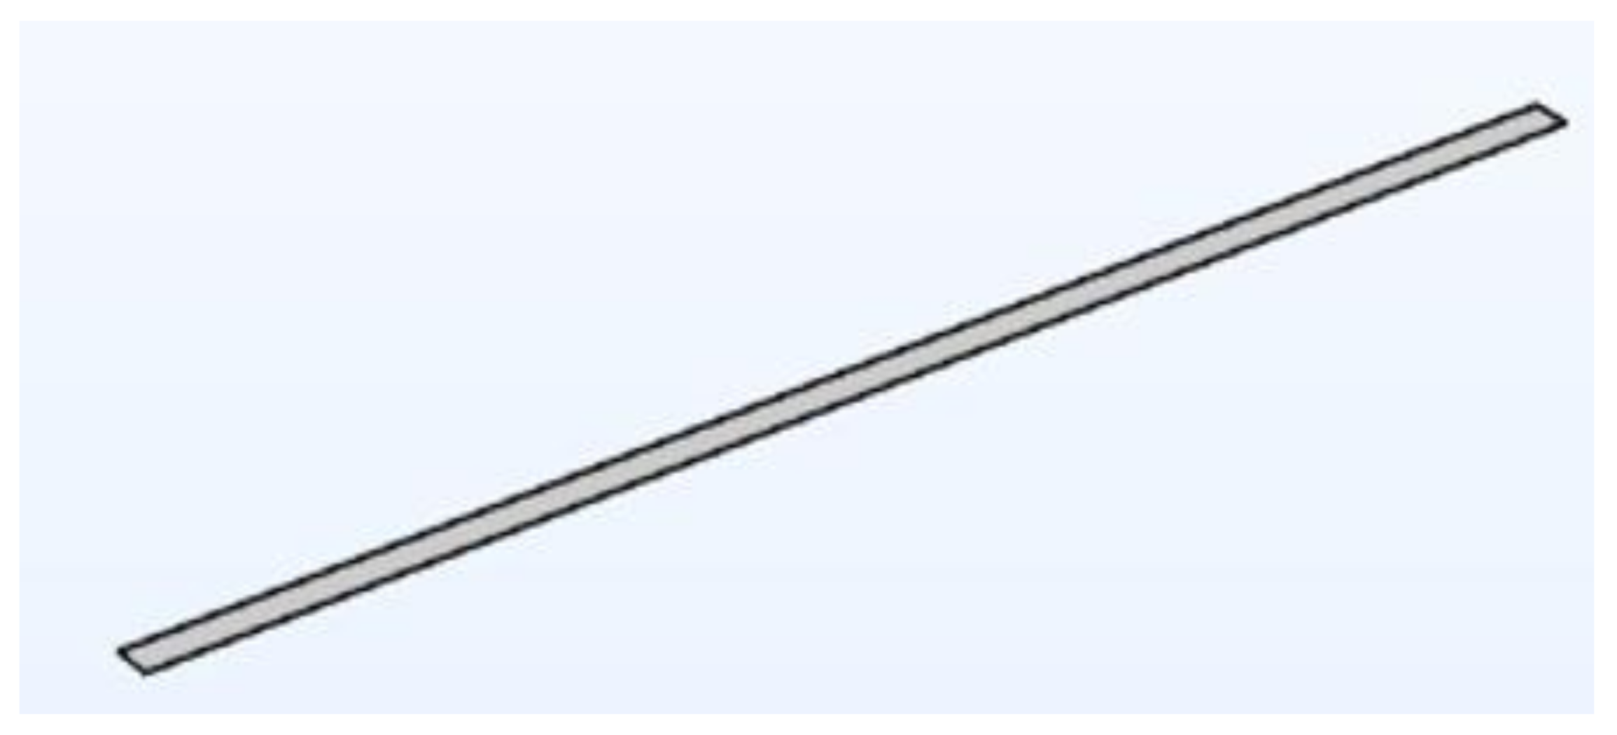
2.1. Tested Ground Electrodes and Remote Ground Electrodes
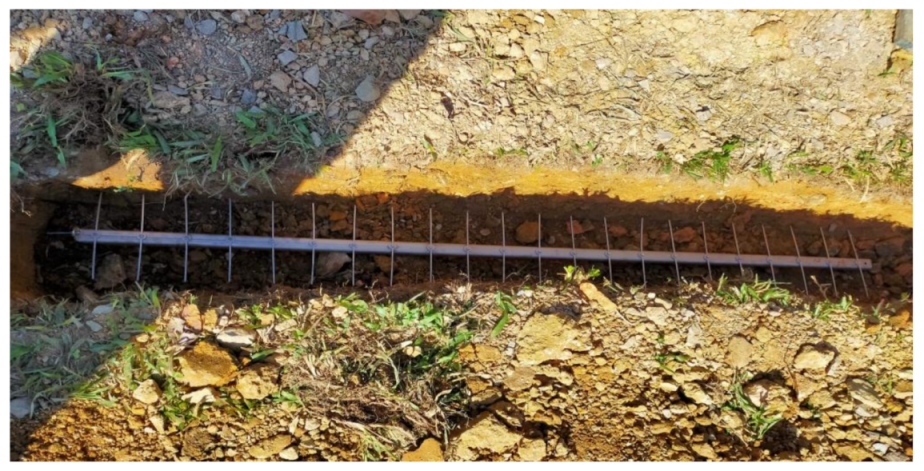
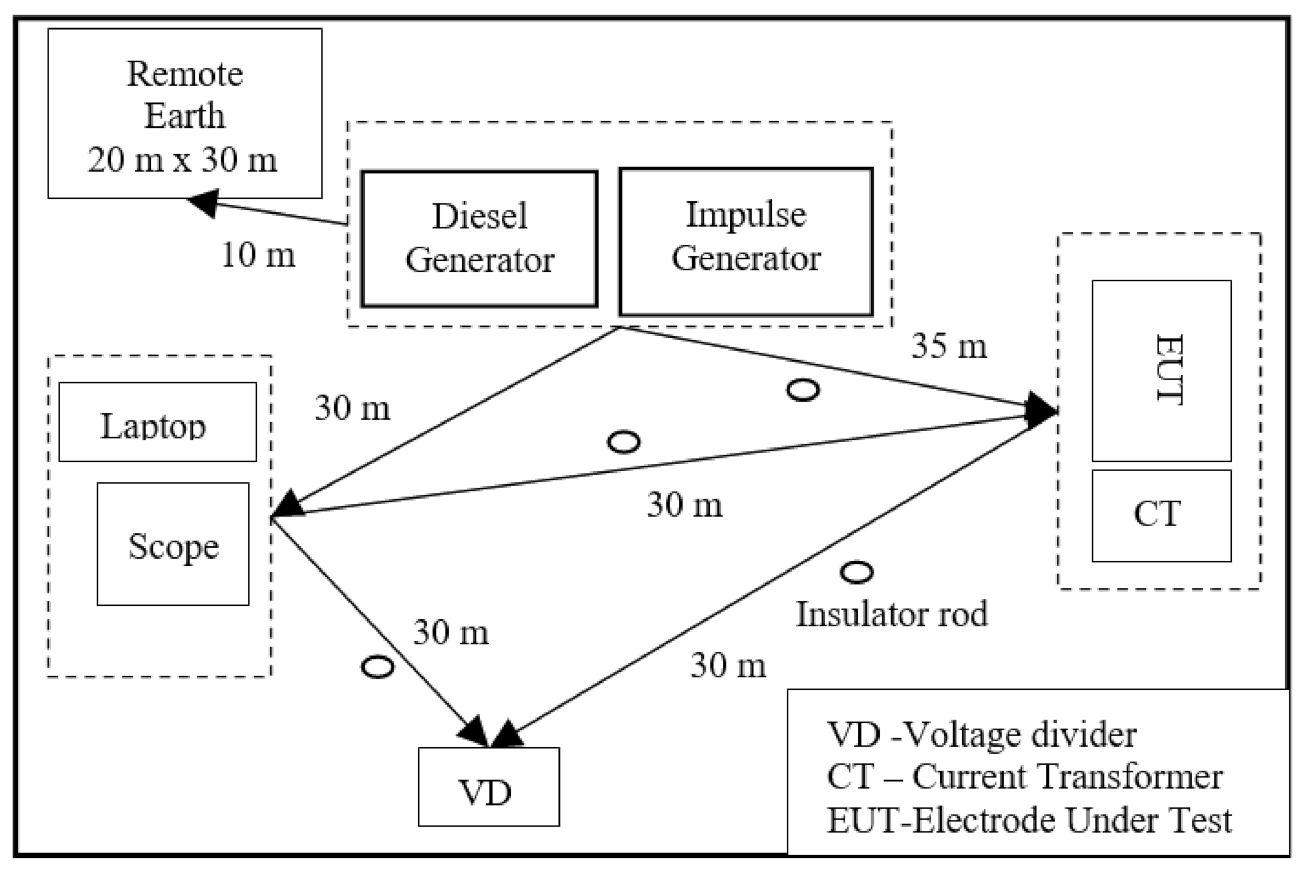
2.2. Testing Sites
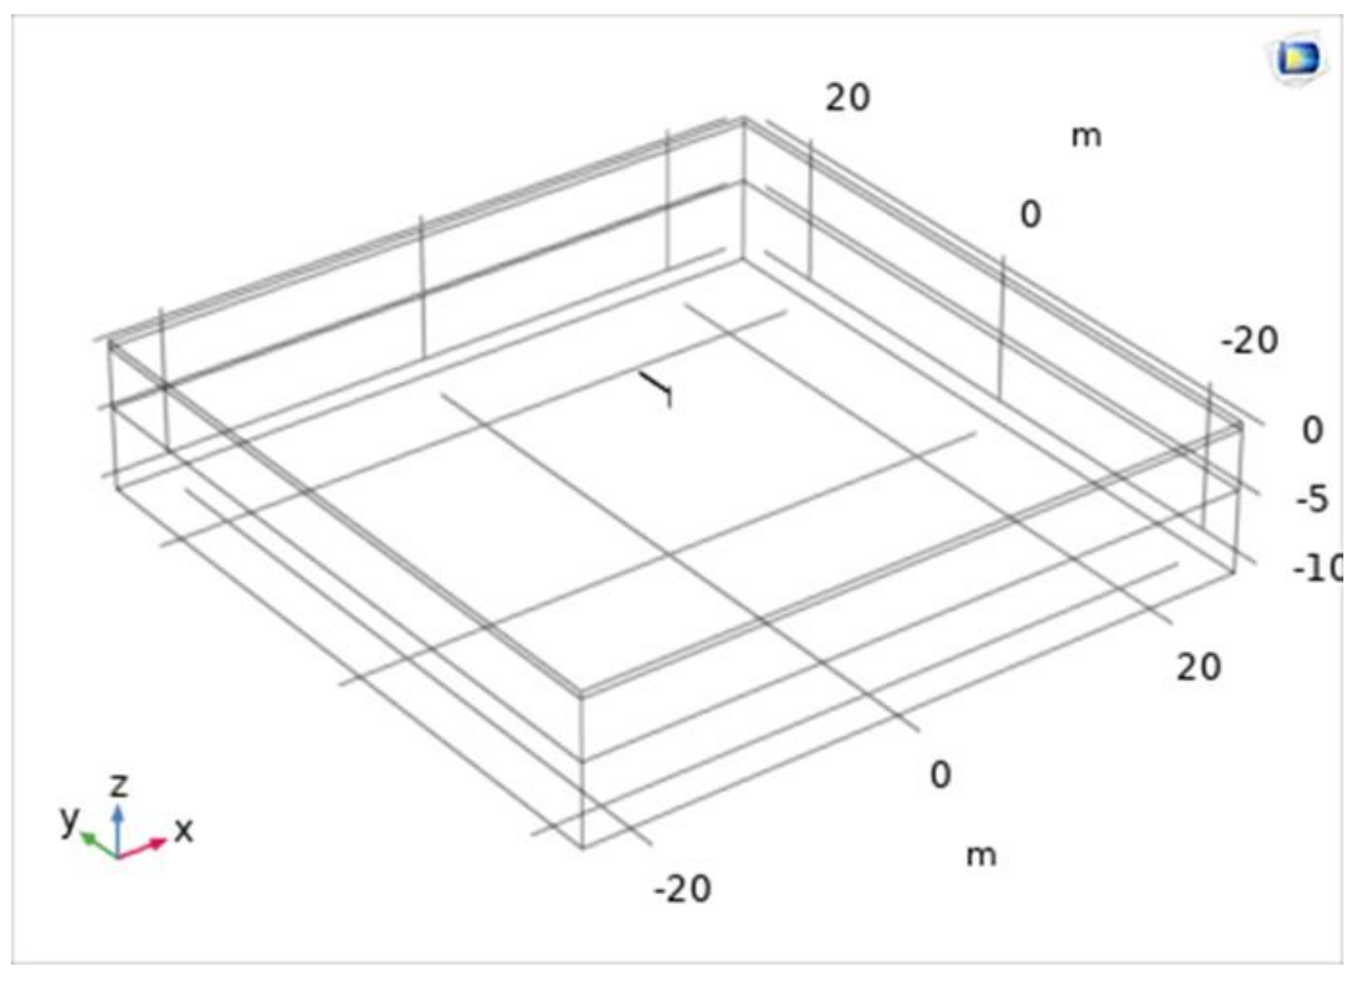
2.3. FEM Simulation
3. Experimental and Simulated Results
3.1. Experimental Test Results
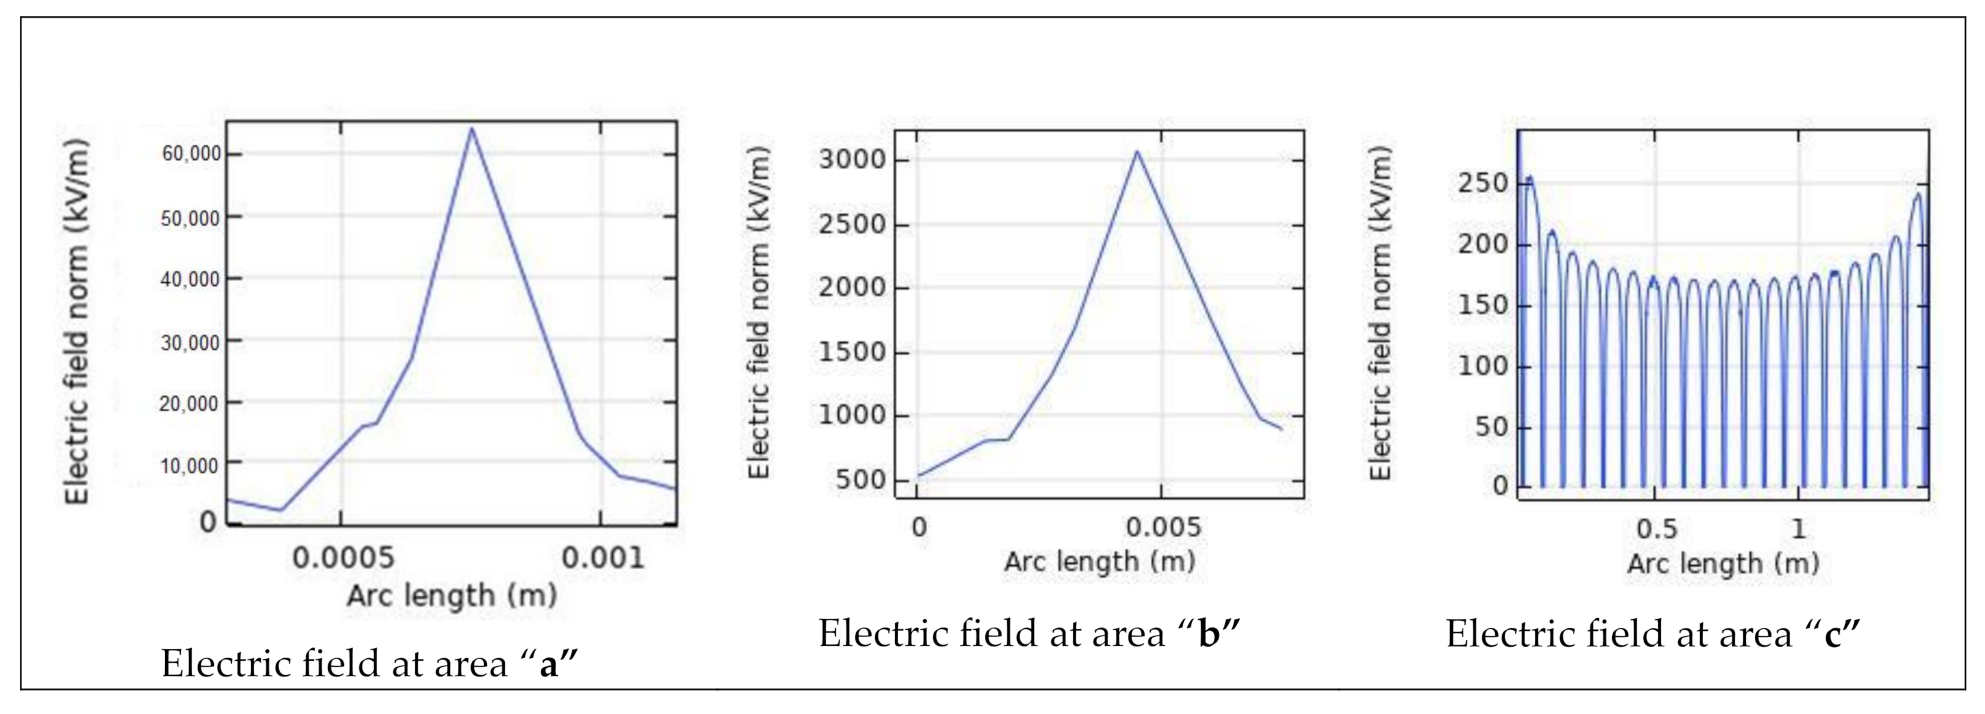
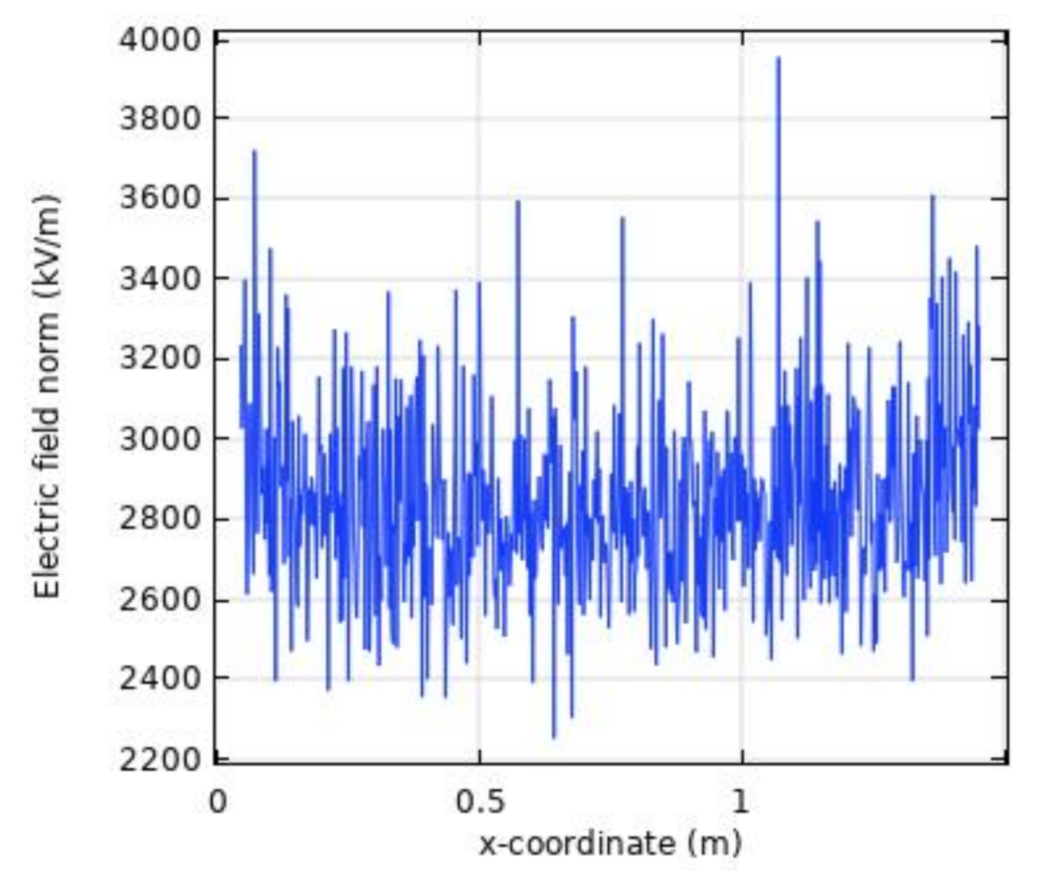
3.2. FEM Simulation Results
4. Conclusions
Author Contributions
Funding
Institutional Review Board Statement
Informed Consent Statement
Conflicts of Interest
References
- Bellaschi, L.P. Impulse and 60-Cycle Characteristics of Driven Grounds. Trans. Am. Inst. Electr. Eng. 1941, 60, 123–128. [Google Scholar] [CrossRef]
- Bellaschi, P.L.; Armington, R.E.; Snowden, A.E. Impulse and 60-Cycle Characteristics of Driven Grounds-II. Electr. Eng. 1942, 61, 349–363. [Google Scholar] [CrossRef]
- Petropoulos, G.M. The High-Voltage Characteristics of Earth Resistances. J. Inst. Electr. Eng. Part II Power Eng. 1948, 95, 172–174. [Google Scholar]
- Chisholm, W.A.; Janischewskyj, W. Lightning Surge Response of Ground Electrodes. IEEE Trans. Power Deliv. 1989, 4, 1329–1337. [Google Scholar] [CrossRef]
- Oettle, E.E. A New General Estimation Curve for Predicting the Impulse of Concentrated Earth Electrodes. IEEE Trans. Power Deliv. 1988, 3, 2020–2029. [Google Scholar] [CrossRef]
- Liew, A.C.; Darveniza, M. Dynamic Model of Impulse Characteristics of Concentrated Earths. Proc. IEE 1974, 121, 123–135. [Google Scholar] [CrossRef]
- Kuffel, E.; Zaengl, W.S.; Kuffel, J. High Voltage Engineering: Fundamentals; Butterworth-Heinemann: Oxford, UK, 2000. [Google Scholar]
- Meyer, H.K.; Mauseth, F.; Pedersen, A.; Ekeberg, J. Breakdown Mechanisms of Rod-Plane Air Gaps with a Dielectric Barrier Subject to Lightning Impulse Stress. IEEE Trans. Dielectr. Electr. Insul. 2018, 25, 1121–1127. [Google Scholar] [CrossRef]
- Telekom Malaysia Berhad and Multimedia University. Spiked Strip Ground Electrodes System. MALAYSIA—Patent Application No. Pl 2020003500, 6 July 2020.
- CIGRE 694: Ground Potential Rise at Overhead AC Transmission Line Structures during Power Frequency Faults, Working Grou, e-CIGRE.org, July 2017, B2.56.


| Ground Electrodes | Spiked Strip | Linear Array | Conventional |
|---|---|---|---|
| rx (m) | 0.75 | 0.75 | 0.75 |
| ry (m) | 0.02 | 0.1 | 0.01 |
| rz (m) | 0.35 | 0.3 | 0.3 |
| g (m) | 0.827 | 0.814 | 0.81 |
| Length of the trench (mm) | 1500 | 1500 | 1500 |
| Width of the trench (mm) | 200 | 200 | 200 |
| Area of the trench for main electrode (m2) | 0.942 | 0.942 | 0.942 |
| Area of the spiked strip/sharp spike, in contact with soil (m2) | 0.05 m depth × 1.5 m × 2 (for each side of the trench) = 0.15 | 0.2 m width × 1.5 m length larger than 0.942) = 0.283 and extra exposed area at both ends (0.5 m × 2 (two sides)) = 0.1 | - |
| Area of the trench, A (m2) | 1.09 | 1.33 | 0.942 |
| Thickness of the electrode (mm) | 20 | 20 | 20 |
| Length of the main strip (m) | 1.5 | 1.5 | 1.5 |
| Length of other electrodes/strips (m) | 0.45 | 4.2 | - |
| Total length of the conductor, L (m) | 1.95 | 5.7 | 1.5 |
| Cylindrical/shaft surface area (2 × π × r × l) (m2) | 0.057 | 0.0066 | - |
| Area of the main strip (m2) | 0.06 | 0.06 | 0.06 |
| Area of other strip (2 × thickness × length) (m2) | 0.0027 | - | - |
| Area of all the geometric conductor, Awire (m2) | 0.12 | 0.067 | 0.06 |
| Rc (Ω) | 19.79 | 10.3 | 34.2 |
| Rg (Ω) | 61.72 | 55.5 | 67.7 |
| Total calculated RDC (Ω) | 81.51 | 65.8 | 101.2 |
| Measured RDC (Ω) | 82.9 | 72.7 | 101.9 |
| Percentage difference between the measured and calculated RDC (%) | 1.68 | 9.5 | 0.69 |
| Boundary (m) | 5 | 10 | 15 | 20 | 50 |
|---|---|---|---|---|---|
| x-axis (kV) | 27.516 | 28.097 | 28.857 | 28.961 | 29.518 |
| y-axis (kV) | 27.514 | 28.097 | 28.858 | 28.961 | 29.518 |
| z-axis (kV) | 26.492 | 27.409 | 28.313 | 28.572 | 29.423 |
Publisher’s Note: MDPI stays neutral with regard to jurisdictional claims in published maps and institutional affiliations. |
© 2021 by the authors. Licensee MDPI, Basel, Switzerland. This article is an open access article distributed under the terms and conditions of the Creative Commons Attribution (CC BY) license (http://creativecommons.org/licenses/by/4.0/).
Share and Cite
Hizamul-Din, H.H.; Nor, N.M.; Ahmad, N.N.; Idris, N.F.; Mahmud, A. Investigations on the Performance of Various Horizontal Ground Electrodes. Energies 2021, 14, 1036. https://doi.org/10.3390/en14041036
Hizamul-Din HH, Nor NM, Ahmad NN, Idris NF, Mahmud A. Investigations on the Performance of Various Horizontal Ground Electrodes. Energies. 2021; 14(4):1036. https://doi.org/10.3390/en14041036
Chicago/Turabian StyleHizamul-Din, Hanis Hamizah, Normiza Mohamad Nor, Nurul Nadia Ahmad, Nur Farahi Idris, and Azwan Mahmud. 2021. "Investigations on the Performance of Various Horizontal Ground Electrodes" Energies 14, no. 4: 1036. https://doi.org/10.3390/en14041036
APA StyleHizamul-Din, H. H., Nor, N. M., Ahmad, N. N., Idris, N. F., & Mahmud, A. (2021). Investigations on the Performance of Various Horizontal Ground Electrodes. Energies, 14(4), 1036. https://doi.org/10.3390/en14041036