Abstract
This paper proposes a preliminary design tool for active power filters’ (APFs) solutions to be applied in offshore oil and gas platforms, where power quality indices are typically low, and reactive power compensation and current harmonic mitigation are often desired. The proposed approach considers that APF selection and rating is a trade-off between performance and size, and that both component and system aspects need to be optimized to achieve a well-tailored solution. As size and weight are critical constraints in offshore applications, possible benefits of using Silicon Carbide (SiC) switches for the APF implementation are investigated. Moreover, different compensation strategies are compared, varying the connection point of the APF between two different voltage levels and assigning the APFs different compensation goals. Improvements in power quality indices, as well as APFs rating, number of components, power losses, and filter size, have been considered for both SiC and Silicon-based solutions to identify the best trade-offs suitable for the considered, energy intensive industrial application.
1. Introduction
In spite of the development of the renewable energy sector, gas and oil are determined to remain the two head energy assets until 2050 and beyond. In the past few decades, offshore oil and gas exploration and drilling have increased significantly. Currently, offshore oil and gas (O&G) exploration accounts for 27% and 30%, respectively [1,2]. Still, fossil fuel combustion in power plants, oil refineries, and large industrial facilities [3] (including O&G platforms) is the main source of the anthropocentric CO emissions, and the environmental problem is concurrent with the technical challenge of O&G platforms powering, in indicating the need for more electric and more efficient platforms. In most cases, the high distance between the platform and the mainland, and the high-power needs of local processing equipment (5–200 MW) prevent the cable-connection to the land-based power system. In this case, electricity is generated locally by gas turbines or diesel generators, and the grid operates as an isolated power system, which is characterized by a weak grid.
Figure 1 represents a typical power system of an O&G platform. The main elements are gas turbines coupled with synchronous generators, power transformers, power converters, and loads. Although DC-based power distribution for O&G drilling applications has recently been under investigation [4], AC systems represent the only industrially applied solution. Nonetheless, the utilization of different loads with high power demand (e.g., pumps and compressors), and the developing use of electric drives, combined with generator impedances (12–25%) considerably higher than those of grid-connected power systems contribute to deteriorate the local power quality (PQ). A significant disadvantage of these AC power distribution systems is the inherent presence of reactive power (with measured power factors, PF, that in extreme cases can be as low as 0.36 [5]), which leads to increased current and losses. In addition, the connection of power electronic converters, typically for AC and DC drives, results in non-linear loads, and therefore harmonic pollution with reported Total Harmonic Voltage Distortion (THDv) and Total Harmonic Current Distortion (THDi) as high as 12% and 27%, respectively [5].
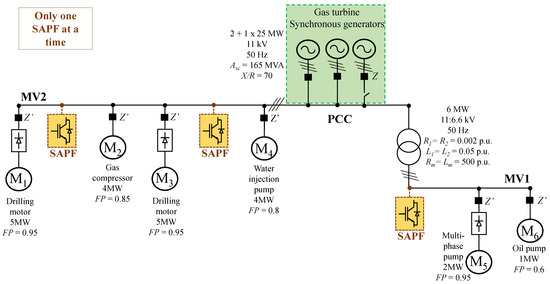
Figure 1.
Diagram of a typical power grid of an offshore oil and gas platform.
As space and weight are critical factors in offshore O&G platforms, the deployment of any additional equipment occupying deck-space is preferably avoided, or carefully weighed versus its added value, as proved by the recent trend to place more processing equipment sub-sea [4]. On the other hand, the cost of a single power-quality incident offshore can be up to 750,000 EUR per day [5]. In order to avoid such incidents and guarantee that the system and the equipment work correctly, it is necessary to comply with relevant standards.
That situation is not different from that of other offshore systems, such as maritime microgrids, for which specific standards are also available [6,7,8] and power quality issues have been more widely investigated [9].
Several methods have been proposed in the literature and also applied in practice to compensate reactive power and harmonic components generated by industrial [10,11] and maritime loads [9,12], but just a few contributions specifically targeted O&G drilling rigs [13,14,15]. In [13], an analysis for passive filters selection in O&G industry is proposed. The authors of [14] present the design and tuning of passive filters for offshore applications using genetic algorithm technique. The authors of [15] compare passive and active filters for oil rig power systems, and conclude that active filters are more suitable where space constrain is an issue. Additionally, due to the typical load cycle of the oil drilling rig, the source impedance seen by the filter varies and, in the passive filter, this will shift the resonant peak.
On the contrary, Shunt Active Power Filters (SAPFs) based on three-phase Voltage Source Converters (VSCs) are proper for this application, as they use the ability of the converter to generate reactive power without using bulky energy storage components, in addition to flexibly compensating reactive power, they can also compensate for multiple harmonics. Hence, they are faster, lighter, smaller, and with better performances at reduced voltages compared to other solutions. In [16], a chain circuit active power filter for high voltage and power applications is proposed, a prototype of 10 kV/1 MVA is built. However, although a preliminary analysis has been presented in [17], a holistic and detailed study bench-marking APF design and PQ performance for this specific application is not available in the literature.
Over the past decades, there has been a breakthrough in devices based on wide-bandgap materials, such as silicon-carbide (SiC). With the increasing demand for high efficiency, voltages, and switching frequencies, the traditional switches made of silicon (Si) may not be able to satisfy all the requirements. The emerging of silicon carbide (SiC) devices has brought new design possibilities for high-voltage high-power converters. In contrast to the Si technology, the SiC exhibits superior material properties. The higher thermal conductivity, dielectric breakdown field strength, and wide band-gap allow an increase in the operational switching frequency and voltage without increasing the losses [18]. The higher the switching frequency, the smaller are the passive filtering components, and then the cooling requirements can be reduced. Therefore, the overall system (converter and filter) volume, area and weight are decreased [19,20,21,22,23]. In [24], a dynamic voltage restorer based on SiC Mosfet is studied to mitigate voltage sag in the O&G industry. References [25,26] present the design, performance analysis, and experimental results of high-speed motor drives that are usually required in the O&G industries that use SiC Mosfet technology.
Based on these trends and needs of the O&G sector, the core contribution of the paper is to provide a SAPF pre-selection tool to orient the O&G platform designer. The tool encompasses both component and system-level analyses tailored to such industrial applications. More precisely, the paper considers: (1) the impact of using wide-band-gap semiconductors and reduced output filter in the SAPF, for equipment size and loss reduction; (2) the PQ performance achievable by connecting the SAPF to different buses/voltage levels, as well as assigning it different compensation targets; and (3) the suitability of two compensation strategies, i.e., sinusoidal current synthesis and resistive load synthesis, and respective control implementations, which are analyzed in detail both by theoretical investigations and dynamic simulations.
With respect to [17], this paper details the description of the SAPF control scheme, with a thoroughly analytical analysis of the advantages of each compensation strategy, supported by additional results. Finally, the paper concludes by presenting an integrated SAPF pre-selection tool that allows to compare the different alternatives to identify the most suitable one. It is worth noting that the proposed tool can have a wider validity than for the proposed O&G application, if decision criteria are properly adapted and weighted.
The paper is organized as follows: Section 2 describes the main industrial processes that take place on an O&G platform and the required electrical power components; Section 3 shows the theoretical and mathematical analysis of SAPFs; in Section 4 the case studies and results are presented and discussed. Finally, Section 5 concludes.
2. Processing of O&G on Offshore Platforms and Related Power Sources
On an O&G platform, the transformation process to convert the fluid extracted from the well into marketable products and clean the waste products, such as produced water, requires several stages and large equipment with high power consumption [27,28]. Each O&G platform has generally multiple wells, divided into injection and production wells. While the former is used for the production of O&G, the latter are drilled to inject gas or water into the reservoir to increase its pressure and push the fluid towards the production well in a process called “enhanced oil recovery”. This process needs large pumps or compressors with high power demand ranging from a few MW up to more than 25 MW [29]. Modern installations include also electrical submerged pumps, with power consumption of a few MW, into the well.
In addition, as the well-stream often consists of crude oil, gas, water, condensates, and contaminants, a separator is used to divide the different components. Owing to the low pressure of the gas flowing from the separators, it must be recompressed before transport. Several types of compressors can be used for this purpose, with the largest centrifugal compressors having a power in the 80 MW range [2]. The production cycle ends with the metering, storage, and export process, in addition to the treatment of chemicals and wastewater.
With a few exceptions, power generation on O&G platforms is usually supplied by local gas turbines (GTs) coupled to synchronous generators (SGs), as shown in Figure 1. Their capacity range is normally between a few MW and 40 MW per turbine [30]. The number of turbines is usually limited to three or four, with one used as a back-up for reliability purposes. SGs and GTs are connected to the highest voltage bus on the platform (i.e., Europe—11 kV, 50 Hz, USA—11 kV, 60 Hz, or South America—13.8 kV, 60 Hz).
For the platform power distribution system, two main AC voltage levels, i.e., 6.6 kV and 11 kV, hereafter specified as medium voltage 1 (MV1) and medium voltage 2 (MV2), respectively, are often used. Large drilling equipment, pumps, and compressors are the main loads powered by electric motors. They usually reflect 75–80% of the overall electric load on the platform and, as their individual power consumption is in the multi-MW range (up to several dozens MW), they are typically connected to the MV2 bus. A low-voltage bus (LV, i.e., 400 V) is also present to allow the interconnection of several small loads (e.g., lightning and living-quarter loads).
Due to the differences in load types and voltage levels, transformers and power electronic converters are needed. Power converters, particularly large 6- or 12-pulse rectifiers [31] coupled to fully controlled inverters, are increasingly connected to electric motors for drilling, pumping, etc., to allow variable speed operation for improved efficiency. This, however, leads to harmonic generation and power quality deterioration [31].
The considered electric power system of an O&G platform is shown in Figure 1, and further described in Section 4. Such an electric grid supplies different load types based on induction motors. The loads M1 to M4 are connected to the MV2 bus (11 kV), while loads M5 and M6 are connected to the MV1 bus (6 kV). The points where the SAPFs are connected are called Points of Connection (PoCs), and the Point of Common Coupling (PCC) is at the output of generators, as shown in Figure 1.
3. Theoretical and Mathematical Analysis of Shunt Active Power Filter
Herein, the SAPF has been adopted as a power quality conditioner for reactive power and harmonic pollution mitigation in an offshore O&G platform. The selected SAPF topology is the three-phase two-level VSC, as shown in Figure 2. It consists of three arms, each one comprising two half-bridge modules. Therefore, six sets of power switches are required. Each set of power switches can be implemented with multiple power semiconductor devices connected either in series or in parallel, depending on the voltage and current rating. There are several methods to optimize the switching device number [32], but this analysis is out of the scope of this work. To determine the number of power semiconductors, the method presented in Section 3.1 is used. In addition to the switching stage, the SAPF requires passive components: DC side capacitor and AC output filter. The following subsections detail the SAPF.
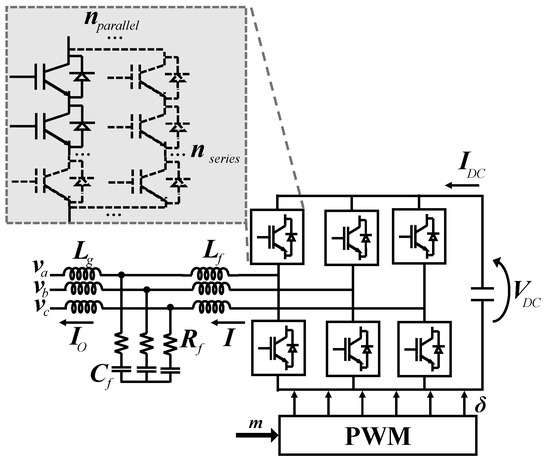
Figure 2.
Power electronics structure of the shunt active power filter—SAPF [17].
3.1. Power Semiconductor Devices
An combination of series and parallel switches is necessary to comply with the requirements of the circuit current and voltage [33]. The number of devices in parallel () and series () for two-level converters is calculated by (1) and (2), respectively. Where is the device datasheet direct current, is the datasheet blocking voltage, and is a voltage safety factor. The must be chosen according to typical values used and values reported in the datasheet. A thermal runaway can happen with too high a repetitive voltage peak, even if this value is below the avalanche break-down limit. Therefore, it is necessary to consider a for the voltage. More details about this procedure can be found on [34].
The converter losses calculation follows the methodology used in [22,35,36] that includes both conduction and switching losses. The MOSFET and IGBT average conduction losses are given in (3) and (4), respectively. is the collector-emitter voltage, is the slope resistance, and and are the average and root mean square currents, respectively.
The switching losses for a two-level converter are calculated by means of (5) where is the total number of devices, is the switching frequency, and and are the switching loss energy obtained from the datasheet and testing materials. Such calculation is generic for both devices. Since the datasheet switching loss energy is measured for a specific , it is necessary to correct the losses for the actual voltage across each device ().
3.2. Passive Components
The proper design of the output filter is of great importance for performance and size of SAPF [19,20]. Literature reports different methods for designing passive components. Herein the LCL filter configuration shown in Figure 2 has been considered. LCL is inductor-capacitor-inductor output filter at the converter’s output to reduce high frequency ripples on the current waveform caused by the pulse width modulation (PWM) technique. The LCL filter attenuates more the high order harmonics with lower cost and reduced overall weight and size compared to the L and LC filter [37]. The filter design follows the methodology of [37]; , , , and are calculated by (6)–(9), respectively.
where is the maximum current ripple at the inverter output, is the desired harmonic attenuation, is the base capacitance, and is the resonant frequency.
3.3. Control Scheme and Compensation Strategies
The block diagram of SAPF control scheme is shown in Figure 3. The control scheme consists of a fast inner loop to regulate the current, and a slow outer loop to control the DC-link voltage. is the DC-link voltage reference, is the AC current reference, and is the synthesis signal that can be the normalized voltage at the Point of Connection (PoC) or can come from a phase-locked loop (PLL) algorithm, depending on the compensation strategy adopted [38]. and are the controllers of voltage and current loops, respectively. The switches are controlled by PWM (Pulse Width Modulation) control where m is the reference signal, and is the control signal to the converter.
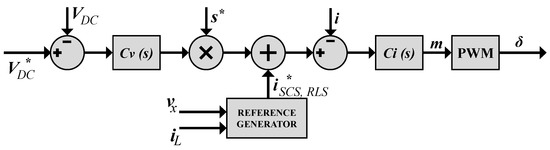
Figure 3.
Block diagram of control scheme applied to shunt active power filter with sinusoidal current synthesis (SCS) or resistive load synthesis (RLS).
Two compensation strategies can be implemented: (i) resistive load synthesis (RLS) and (ii) sinusoidal current synthesis (SCS) [39]. The reference generator block is responsible for synthesizing both compensation strategies and creating the current reference signal (). In short, is equal to the measured SAPF PoC voltage in each phase () for RLS, resulting in , whereas the SCS needs resulting in , where the subscript 1 stands for the fundamental value of the variable.
Figure 4 represents the equivalent model of the electric grid shown in Figure 1, in which the SAPF compensates three MV2 loads (M1, M2, and M3). Two assumptions can be made for the analysis: (i) the operating generators are represented as a single equivalent voltage source, and (ii) the circuit is represented in per-unit (p.u.); therefore, the transformer does not appear. Figure 5 shows the simplified model of Figure 4, where the current source represents the non-linear load, the constant impedances the linear loads, and the loads to be compensated (M1, M2, and M3) associated with SAPF. assumes different features depending on the control strategy (RLS or SCS) applied. The capacitor branch represents the typical shunt capacitor at the output terminals of SAPF.
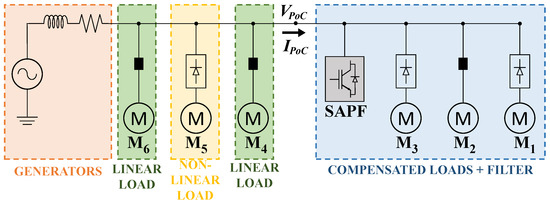
Figure 4.
Equivalent model of the electric grid of Figure 1.
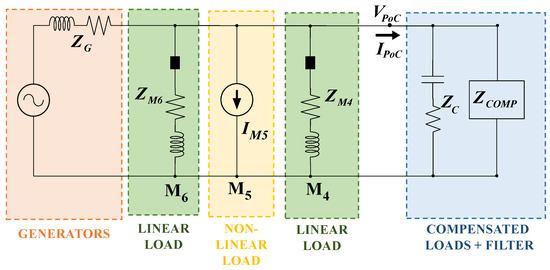
Figure 5.
Simplified model of the electric grid of Figure 4.
3.3.1. Resistive Load Synthesis (RLS) Strategy
This strategy aims at emulating a resistive load behavior; therefore, the line current, , has the same voltage waveform at the point of SAPF connection, . The current reference is calculated as:
where P is the total active power and and are the measured load current and SAPF PoC voltage in each phase (), respectively. is the collective value of the SAPF PoC voltage, . Note that the current reference signal is equivalent to the non-active current of the load ().
In this strategy, the set of compensated loads (M1, M2, and M3) associated with SAPF emulates a resistor behavior for every harmonic order within the SAPF bandwidth, as given in (11), and the is calculated by (12).
Such that k is a constant, and are the current and voltage at the SAPF PoC, as shown in Figure 5, and h is the harmonic order.
3.3.2. Sinusoidal Current Synthesis (SCS) Strategy
This strategy produces a sinusoidal line current, , whatever the waveform of the voltage at the SAPF PoC, , is. The current reference signal is calculated by (13), such that is the collective value of voltage considering only the fundamental components of each phase. Note that the current reference signal is equivalent to the non-active current of the load considering a sinusoidal voltage supply ().
The equivalent circuit model is the same as Figure 5. Differently from the RLS, for the SCS, the ratio of to varies with frequency. In terms of fundamental component, the current is proportional to the voltage waveform emulating a resistor; however, for the other harmonic orders, is equal to zero behavings like an open circuit, as expressed in (14). The is calculated then by (15).
3.3.3. Comparison between RLS and SCS
As shown in (12) and (15), both strategies have the same behavior at the fundamental frequency. However, for other harmonic orders, the RLS emulates a resistor, while the SCS emulates an open-circuit. Figure 6 represents the equivalent model for RLS and SCS strategies considering frequency components higher than the fundamental one. It is worth mentioning that the voltage source is short-circuited since the synchronous generators are considered as purely sinusoidal, while the non-linear load, represented by a current source, is still included because it generates harmonic currents.
Figure 6.
Equivalent circuit model for the frequency components superior to the fundamental one: (a) RLS and (b) SCS.
4. Simulation Results and Analysis
The power grid of Figure 1 was used as a test-case and was modeled for dynamic simulations in Matlab/Simulink. The Simulink block diagram for Case 3 is shown in Figure 7. It includes the gas turbines—synchronous generators (2 × 25 MVA), two 5 MW drilling motors controlled by 6-pulse rectifier-based variable speed drive (VSD)—non-linear loads, a 4 MW gas compressor, and a 4 MW water pump-induction motor (IM) directly connected to the MV1 bus. Another induction motor (1 MW) was connected to the MV1 bus, together with a multi-phase pump of 2 MW (non-linear load). Table 1 shows the parameters of the loads, Table 2 highlights the case studies that are addressed in this section, and Table 3 shows the simulation values to plot the Bode diagram of Figure 6. Cases 1, 2 and 3 were related to the position of the SAPF in Figure 1, while or sub-indices are related to the semiconductor technology, i.e., Si or SiC.
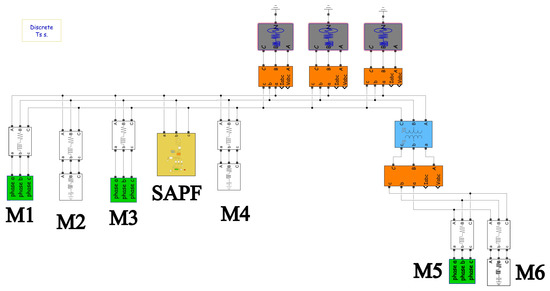
Figure 7.
Simulink block diagram for Case 3.

Table 1.
Parameters of the loads of Figure 1.
Table 2.
Details of the case studies considered.
Table 3.
Simulation values to plot the Bode diagram of Figure 8.
4.1. Bode Analysis of the Circuit
Figure 8 shows the Bode diagrams for both strategies using the values of Table 3. From Figure 8 one sees that the RLS strategy provided more damping effect for the harmonic currents than SCS, minimizing the voltage distortion [38]. The SCS strategy created non-linearity in the circuit, which may have amplified the value up to 10 times [39]. Therefore, the RLS showed better performance than the SCS.
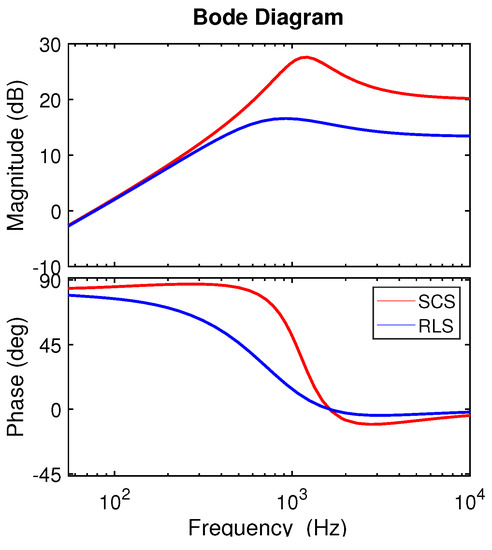
Figure 8.
Bode diagram of the .
4.2. Performance Analysis of Semiconductors
The first analysis carried out was the performance analysis of the semiconductor. Two variants were considered for each case:
(a) refers to the implementation of SAPFs using Si-based IGBTs, with two voltage ratings: 3.3 kV Si-IGBT 5SNA 1200E33100 [35] and 6.5 kV Si-IGBT 5SNA 0400J650100 [40] with rated current capacity of 1200 A and 400 A, and maximum blocking voltage of 3.3 kV and 6.5 kV, respectively;
(b) refers to the implementation of SAPFs using SiC-based MOSFETs (10 kV SiC MOSFET/SiC-JBS diode [41]) with a rated current capacity of 100 A, and a blocking voltage of 10 kV.
The first analysis was between the two Si-IGBT-based solutions. Following the method described in Section 3, the total losses and number of switching components were calculated, as shown in Table 4. The number of components needed was smaller for the 6.5 kV Si-IGBT, but the overall loss was higher than for the 3.3 kV Si-IGBT. The 3.3 kV Si-IGBT solution (a-cases) was then chosen to compare further with the SiC alternative (b-cases).
Table 4.
Comparison results for the Si-IGBT SAPF.
Table 5 shows the number of components, the losses and efficiency of the power electronics part, and the required LCL filter for the 3.3 kV Si-IGBT and the 10 kV SiC-MOSFET. Note that the high-power IGBT-based converter typically switched with lower frequency (e.g., 2 kHz) than the high-power SiC-MOSFET-based converter that switched at 10 kHz. The results show that the use of SiC considerably decreased the switching and conduction losses and was better applicable for low-current applications, where it provided a count of fewer switches than Si-counterparts. From the perspective of the size of the LCL filter, the most compact solutions were those based on SiC, which provided lighter weight and smaller volume than with Si-IGBT, as expected.
Table 5.
Results of the SAPF design.
4.3. Performance Analysis of Power Quality in O&G Platform
The following analyses correspond to PQ performance. In order to select the more suitable SAPF, several options considering different connection points (i.e., MV1 or MV2 and loads targeted) and compensation strategies (i.e., RLS or SCS) were analyzed.
4.3.1. Performance Comparison for RLS and SCS
Sinusoidal current is generated by the SCS technique independently of the voltage waveform, and it may cause other non-linearities in the system and increase the system harmonic content, as discussed in Section 3.3.3. The PCC voltage and current waveforms are shown in Figure 9 for RLS and SCS in case 3 (M1, M2, and M3 compensated by the SAPF). As expected, the harmonic content for RLS was lower than for SCS. For the latter, the was 4.39%, and was 2.26%, while for RLS, the was 2.07%, and was 1.73%. Given this, further analyses will focus on the RLS strategy, which is more appropriate to O&G applications than SCS strategy.
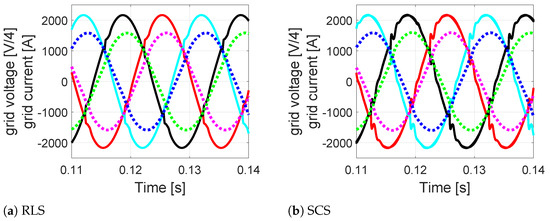
Figure 9.
Waveforms of (continuous line-x0.25) and (dashed line) for (a) RLS and (b) SCS.
4.3.2. Power Quality Indices for Different Points of SAPF Connection
Table 6 shows the power quality parameters for the three cases and without compensation. With no SAPF, the power factor (defined as the ratio between active and apparent power) measured at the PCC was 0.91 and = 12.57%. At t = 0.1 s, the SAPF was activated with the RLS mode to achieve a purely active current (i.e., unity power factor) at the chosen bus. The PQ output indices, regardless of the type of semiconductor used, were similar. Therefore, the main reason for the performance difference introduced by different locations of SAPFs was the power rating compensated by the SAPF. Large loads had the most significant impact on PCC’s PQ indices.
Table 6.
Analysis of the power quality performance.
Case 1 employed the SAPF connected to the MV1 bus and had the smallest power rating among the other case studies. Despite being successful in the local compensation task (it achieved PF at MV1 equal to 1), the improvement of the PQ indices at PCC was limited, as the power rating of the MV1 loads was negligible compared to the MV2 loads. The at PCC was reduced to below 6% with the SAPF connected at the MV2 bus compensation only one load (M1—Case 2). The PF at PCC was almost unchanged due to the presence of large uncompensated linear and non-linear loads at MV2 in both cases. Finally, in Case 3, the SAPF compensated all the MV2 loads except M4, and the was decreased to 1.73% and to 2.07%, with PF = 0.98. However, the goal was achieved at the expense of a significantly high power rating for the SAPF converter.
Figure 10 and Figure 11 show the waveforms corresponding to Case 3. Figure 10 shows the instantaneous (p) and the average active power (P), the instantaneous (q) and the average reactive power (Q), and the PF at PCC. As can be seen, the active power remained unchanged since the filter did not exchange active power with the grid; however, the reactive power at the PCC decreased when the SAPF operated (t = 0.1 s), increasing the PF. Figure 11 shows the grid current and voltage ( and ), and the SAPF current. As expected, when the SAPF operated, and became less distorted, which is quantified in Table 6.
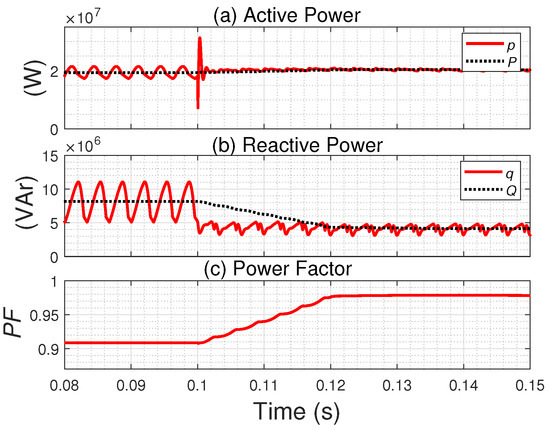
Figure 10.
Waveforms of power and PF at the MV2 bus (PCC) in Case 3: (a) Active power, (b) reactive power and (c) Power factor (FP).
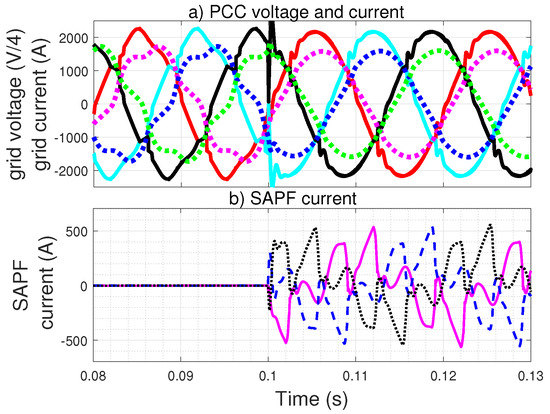
Figure 11.
Circuit waveforms corresponding to Case 3: (a) Point of Common Coupling (PCC) voltage and current, and (b) SAPF current.
The PQ indices should comply with the standards for electrical installations on offshore units. According to ABNT NBR IEC 61892-1:2016 [42] and NEK IEC 61892-1:2019 [43] that are based on IEC 61892-1:2015 and IEC 61892-1:2019 respectively; the voltage harmonic distortion acceptance limits are 3% for each harmonic component, and 5% for the THD (i.e., class 1). However, for certain electrical installations where it is not practical to comply with those requirements, higher values are accepted: no single harmonic shall exceed 6%, and the THD shall not exceed 8% (i.e., class 2). Therefore, this requirement was met only in Case 2 and Case 3.
4.4. Shunt Active Power Filter Pre-Selection Tool
The final choice of the SAPF to be applied to an O&G platform was a complicated decision that emerged as a trade-off between multiple factors, including the APF rating, design (e.g., output filter sizing, number, and type of semiconductor switches), overall PQ performance (i.e., THDv, THDi, and PF), and operation (e.g., losses).
Figure 12 shows a summary of the different aspects considered in this study, proposed as a preliminary selection method to orient the choice of the SAPF. The parameters were normalized over their maximum value. Assuming they were weighted similarly, the smaller area delimited by the line corresponded to the case that was considered indicative of the better SAPF alternative. Table 7 shows the areas of Figure 12 for each case, in which 100% was the largest area.
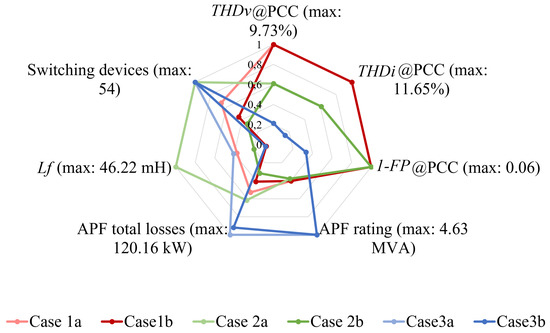
Figure 12.
Comparison of SAPFs solutions, using pre-selection tool.
Table 7.
Plot areas of each case in Figure 12.
It is worth highlighting that this was not the final tool to select the SAPF’s best choice. A complete analysis involving several factors e.g., reliability, cost, user choice, and physical size, must be provided to determine the final selection. Although, the technique presented in this paper is useful as a pre-selection tool to orient the designer in the first analyses and immediately disregard options clearly resulting in poor performances.
It can be seen, for example, that Case 2.b (SiC-based SAPF connected to MV2 and only compensating the local load M1) offered the best compromise between the parameters, with intermediate PQ performance, but low total losses, semiconductor count and APF rating. As a comparison, the corresponding Si-solution (Case 2.a), despite providing equivalent PQ performance was penalized in terms of SAPF design (number of switches and filter size), and higher losses, therefore, should be disregarded. When the Si and SiC solutions were compared for each case, the latter options presented better or equal performance in all parameters.
5. Conclusions
The electrical power system of an offshore oil and gas installation is characterized by high energy consumption but with constrained physical space and weight. Most offshore platforms operate in isolated-mode, i.e., without connection to the onshore electrical system. The grid comprises generators, transformers, several loads, and different voltage levels, and must maintain the power quality within the requirements of the standards.
This paper analyzed the use of shunt active power filter (SAPF) in this scenario. Several aspects were addressed: semiconductor analysis, including the number of components and technology (Si and SiC), converter losses (conduction and switching), the design of passive components, and control strategies (resistive load synthesis (RLS) and sinusoidal current synthesis (SCS)). Overall, this paper has shown that SAPF can be a viable solution for isolated power grids, such as oil and gas platforms, where deteriorated power quality requires reactive and harmonic compensation. A SAPF pre-selection tool was designed based on several characteristics, e.g., SAPF connection point, losses, passive components, power quality, and semiconductor type. Moreover, the advantage of a SiC-based implementation of such SAPF has been presented and quantified. Finally, the RLS strategy is suggested for oil and gas applications, because it provides more damping to the system than the SCS strategy.
Author Contributions
Conceptualization, D.B. and E.T.; formal analysis, L.A.V., D.B. and E.T.; funding acquisition, E.T.; investigation, L.A.V., D.B. and E.T.; methodology, L.A.V., D.B. and E.T.; project administration, D.B. and E.T.; resources, D.B. and E.T.; software, L.A.V., D.B. and E.T.; supervision, D.B. and E.T.; validation, L.A.V., D.B. and E.T.; visualization, L.A.V., D.B. and E.T.; writing—original draft, L.A.V., D.B. and E.T.; writing—review and editing, L.A.V., D.B. and E.T. All authors have read and agreed to the published version of the manuscript.
Funding
This research was partly funded under the program PETROMAKS2 of the Research Council of Norway, within the project “Smart Platform” (grant number 308735).
Data Availability Statement
Not applicable.
Conflicts of Interest
The authors declare no conflict of interest.
References
- Durham, R.A.; Brinner, T.R. Oilfield electric power distribution. In Proceedings of the 2014 IEEE Petroleum and Chemical Industry Technical Conference (PCIC), San Francisco, CA, USA, 8–10 September 2014; pp. 429–442. [Google Scholar]
- Rajashekara, K.; Krishnamoorthy, H.S.; Naik, B.S. Electrification of subsea systems: Requirements and challenges in power distribution and conversion. CPSS Trans. Power Electr. Appl. 2017, 2, 259–266. [Google Scholar] [CrossRef]
- Sadik-Zada, E.R.; Loewenstein, W. Drivers of CO2-Emissions in Fossil Fuel Abundant Settings: (Pooled) Mean Group and Nonparametric Panel Analyses. Energies 2020, 13, 3956. [Google Scholar] [CrossRef]
- Grainger, B.M.; Reed, G.F.; McDermott, T.E.; Mao, Z.; Kounev, V.; Tipper, D. Analysis of an offshore medium voltage DC microgrid environment—Part I: Power sharing controller design. In Proceedings of the 2014 IEEE PES T D Conference and Exposition, Chicago, IL, USA, 14–17 April 2014; pp. 1–5. [Google Scholar]
- Schipman, K.; Delincé, F. The importance of good power quality. ABB Power Qual. Prod. 2010, 1–20. Available online: https://electricalswitchboards.com.au/the-importance-of-good-power-quality/ (accessed on 2 February 2021).
- ISO/IEC/IEEE 80005-1:2012 Utility Connections in Port—Part 1: High Voltage Shore Connection (HVSC) Systems—General Requirements. 2012. Available online: https://www.iso.org/standard/53588.html (accessed on 2 February 2021).
- 45.1-2017—IEEE Recommended Practice for Electrical Installations on Shipboard–Design. Available online: https://ieeexplore.ieee.org/document/8007394 (accessed on 2 February 2021).
- IEC. IEC 61892-1—Mobile and Fixed Offshore Units. 2019. Available online: https://shop.bsigroup.com/ProductDetail?pid=000000000030350336 (accessed on 2 February 2021).
- Kumar, D.; Zare, F. A Comprehensive Review of Maritime Microgrids: System Architectures, Energy Efficiency, Power Quality, and Regulations. IEEE Access 2019, 7, 67249–67277. [Google Scholar] [CrossRef]
- Kale, M.; Özdemir, E. Harmonic and reactive power compensation with shunt active power filter under non-ideal mains voltage. Electr. Power Syst. Res. 2005, 74, 363–370. [Google Scholar] [CrossRef]
- Shankar, V.A.; Kumar, N.S. Implementation of Shunt Active Filter for Harmonic Compensation in a 3 Phase 3 Wire Distribution Network. Energy Procedia 2017, 117, 172–179. [Google Scholar] [CrossRef]
- Su, C.; Hong, C. Design of passive harmonic filters to enhance power quality and energy efficiency in ship power systems. In Proceedings of the 49th IEEE/IAS Industrial Commercial Power Systems Technical Conference, Stone Mountain, GA, USA, 30 April–3 May 2013; pp. 1–8. [Google Scholar]
- Jaafari, K.A.A.; Poshtan, M.; Beig, A.R. Passive wide spectrum filter for variable speed drives in oil and gas industry. In Proceedings of the 11th International Conference on Electrical Power Quality and Utilisation, Lisbon, Portugal, 17–19 October 2011; pp. 1–6. [Google Scholar]
- Verma, V.; Singh, B. Genetic-Algorithm-Based Design of Passive Filters for Offshore Applications. IEEE Trans. Ind. Appl. 2010, 46, 1295–1303. [Google Scholar] [CrossRef]
- Dekka, A.R.; Beig, A.R.; Poshtan, M. Comparison of passive and active power filters in oil drilling rigs. In Proceedings of the 11th International Conference on Electrical Power Quality and Utilisation, Lisbon, Portugal, 17–19 October 2011; pp. 1–6. [Google Scholar]
- Chen, J.; Yuan, X. Chain circuit active power filter for high voltage high power applications. In Proceedings of the 2014 17th International Conference on Electrical Machines and Systems (ICEMS), Hangzhou, China, 22–25 October 2014; pp. 2422–2425. [Google Scholar] [CrossRef]
- Vitoi, L.A.; Brandao, D.I.; Tedeschi, E. Power quality enhancement by SiC Active Power Filters in Oil and Gas Platforms. In Proceedings of the 2019 IEEE Energy Conversion Congress and Exposition (ECCE), Baltimore, MD, USA, 29 September–3 October 2019; pp. 4299–4304. [Google Scholar]
- Acosta-Cambranis, F.; Zaragoza, J.; Romeral, L.; Berbel, N. Comparative Analysis of SVM Techniques for a Five-Phase VSI Based on SiC Devices. Energies 2020, 13, 6581. [Google Scholar] [CrossRef]
- Acharya, S.; She, X.; Todorovic, M.H.; Datta, R.; Mandrusiak, G. Thermal Performance Evaluation of a 1.7-kV, 450-A SiC-MOSFET Based Modular Three-Phase Power Block With Wide Fundamental Frequency Operations. IEEE Trans. Ind. Appl. 2019, 55, 1795–1806. [Google Scholar] [CrossRef]
- Zhang, L.; Yuan, X.; Wu, X.; Shi, C.; Zhang, J.; Zhang, Y. Performance Evaluation of High-Power SiC MOSFET Modules in Comparison to Si IGBT Modules. IEEE Trans. Power Electr. 2019, 34, 1181–1196. [Google Scholar] [CrossRef]
- Madhusoodhanan, S.; Mainali, K.; Tripathi, A.K.; Kadavelugu, A.; Patel, D.; Bhattacharya, S. Power Loss Analysis of Medium-Voltage Three-Phase Converters Using 15-kV/40-A SiC N-IGBT. IEEE J. Emerg. Select. Top. Power Electr. 2016, 4, 902–917. [Google Scholar] [CrossRef]
- Hennig, T.; Mende, D.; Hofmann, L. Efficiency evaluation of offshore power systems with power electronics based on SiC technology. In Proceedings of the 2016 IEEE PES Asia-Pacific Power and Energy Engineering Conference (APPEEC), Xi’an, China, 25–28 October 2016; pp. 634–639. [Google Scholar]
- Hu, B.; Lyu, X.; Xing, D.; Ma, D.; Brothers, J.; Na, R.; Wang, J. A Survey on Recent Advances of Medium Voltage Silicon Carbide Power Devices. In Proceedings of the 2018 IEEE Energy Conversion Congress and Exposition (ECCE), Portland, OR, USA, 23–27 September 2018; pp. 2420–2427. [Google Scholar]
- Messiha, M.; Baraket, C.; Massoud, A.; Iqbal, A.; Soliman, R. Dynamic voltage restorer for voltage sag mitigation in oil gas industry. In Proceedings of the 2015 First Workshop on Smart Grid and Renewable Energy (SGRE), Doha, Qatar, 22–23 March 2015; pp. 1–6. [Google Scholar]
- Madhusoodhanan, S.; Mainali, K.; Tripathi, A.; Vechalapu, K.; Bhattacharya, S. Medium voltage (≥2.3 kV) high frequency three-phase two-level converter design and demonstration using 10 kV SiC MOSFETs for high speed motor drive applications. In Proceedings of the 2016 IEEE Applied Power Electronics Conference and Exposition (APEC), Long Beach, CA, USA, 20–24 March 2016; pp. 1497–1504. [Google Scholar]
- Vechalapu, K.; Hazra, S.; Raheja, U.; Negi, A.; Bhattacharya, S. High-speed medium voltage (MV) drive applications enabled by series connection of 1.7 kV SiC MOSFET devices. In Proceedings of the 2017 IEEE Energy Conversion Congress and Exposition (ECCE), Cincinnati, OH, USA, 1–5 October 2017; pp. 808–815. [Google Scholar]
- Alves, E.; Sanchez, S.; Brandao, D.; Tedeschi, E. Smart Load Management with Energy Storage for Power Quality Enhancement in Wind-Powered Oil and Gas Applications. Energies 2019, 12, 2985. [Google Scholar] [CrossRef]
- Grassian, D.; Olsen, D. Detailed Energy Accounting of Electrical Submersible Pumping Systems. Energies 2020, 13, 302. [Google Scholar] [CrossRef]
- Waterfield, T.; Germaine, B. The World Largest Injection Pumps. Sulzer Technical Review. 2003, Volume 4. Available online: https://www.researchgate.net/publication/291370966_The_World%27s_Largest_Injection_Pumps (accessed on 2 February 2021).
- Devold, H. Oil and Gas Production Handbook. ABB ATPA Oil and Gas. 2006. Available online: https://www.amazon.com/Oil-Gas-Production-Handbook-Petrochemical/dp/132978345X (accessed on 2 February 2021).
- Evans, I.C.; Solutions, H.; Uk, C.; Richards, M.J.; Corporation, A. The Price of Poor Power Quality. In Proceedings of the AADE National Technical Conference, Houston, TX, USA, 12–14 April 2011; p. 12. [Google Scholar]
- Ma, D.; Chen, W.; Ruan, X. A Review of Voltage/Current Sharing Techniques for Series–Parallel-Connected Modular Power Conversion Systems. IEEE Trans. Power Electr. 2020, 35, 12383–12400. [Google Scholar] [CrossRef]
- Wang, G.; Konstantinou, G.; Townsend, C.D.; Pou, J.; Vazquez, S.; Demetriades, G.D.; Agelidis, V.G. A Review of Power Electronics for Grid Connection of Utility-Scale Battery Energy Storage Systems. IEEE Trans. Sustain. Energy 2016, 7, 1778–1790. [Google Scholar] [CrossRef]
- ABB. Voltage ratings of high power semiconductors—Application Note 5SYA 2051. Available online: https://docplayer.net/21285209-Voltage-ratings-of-high-power-semiconductors.html (accessed on 2 February 2021).
- ABB. Applying IGBTs—Application Note 5SYA 2053-04 Applying. Available online: https://library.e.abb.com/public/ab119704d4797bc283257cd3002ac5e0/Applying%20IGBTs_5SYA%202053-04.pdf (accessed on 5 February 2021).
- Duong, T.H.; Ortiz-Rodriguez, J.M.; Raju, R.N.; Hefner, A.R. Electro-thermal simulation of a 100 A, 10 kV half-bridge SiC MOSFET/JBS power module. In Proceedings of the 2008 IEEE Power Electronics Specialists Conference, Rhodes, Greece, 15–19 June 2008; pp. 1592–1597. [Google Scholar]
- Reznik, A.; Simões, M.G.; Al-Durra, A.; Muyeen, S.M. LCL Filter Design and Performance Analysis for Grid-Interconnected Systems. IEEE Trans. Ind. Appl. 2014, 50, 1225–1232. [Google Scholar] [CrossRef]
- Marafão, F.P.; Brandão, D.I.; Costabeber, A.; Paredes, H.K.M. Multi-task control strategy for grid-tied inverters based on conservative power theory. IET Renew. Power Gener. 2015, 9, 154–165. [Google Scholar] [CrossRef]
- Nunez-Zuniga, T.E.; Pomilio, J.A. Shunt active power filter synthesizing resistive loads. IEEE Trans. Power Electr. 2002, 17, 273–278. [Google Scholar] [CrossRef]
- ABB. IGBT Module Datasheet-5SNA 0400J650100; ABB: Zurich, Switzerland, 2016; Available online: https://library.e.abb.com/public/1eda3a30244c484fa0adc56d1d24af5c/5SNA%200400J650100_5SYA%201592-04%2005-2016.pdf (accessed on 5 February 2021).
- Johannesson, D.; Nawaz, M.; Ilves, K. Assessment of 10 kV, 100 A Silicon Carbide mosfet Power Modules. IEEE Trans. Power Electr. 2018, 33, 5215–5225. [Google Scholar] [CrossRef]
- ABNT. ABNT NBR IEC 61892-1 Unidades Marítimas Fixas e Móveis, 2016. Available online: https://www.normas.com.br/visualizar/abnt-nbr-nm/25069/abnt-nbriec61892-1-unidades-maritimas-fixas-e-moveis-instalacoes-eletricas-parte-1-requisitos-e-condicoes-gerais (accessed on 2 February 2021).
- NEK. NEK IEC 61892-1—Mobile and Fixed Offshore Units. 2019. Available online: https://standard.no/no/Nettbutikk/produktkatalogen/Produktpresentasjon/?ProductID=1031986 (accessed on 2 February 2021).


Publisher’s Note: MDPI stays neutral with regard to jurisdictional claims in published maps and institutional affiliations. |
© 2021 by the authors. Licensee MDPI, Basel, Switzerland. This article is an open access article distributed under the terms and conditions of the Creative Commons Attribution (CC BY) license (http://creativecommons.org/licenses/by/4.0/).