
Experimental Study of a Coil Type Steam Boiler Operated on an Oil Field in the Subarctic Continental Climate


Abstract
1. Introduction
1.1. Operating Conditions of the Installation
1.2. Review of Works on the Research Topic
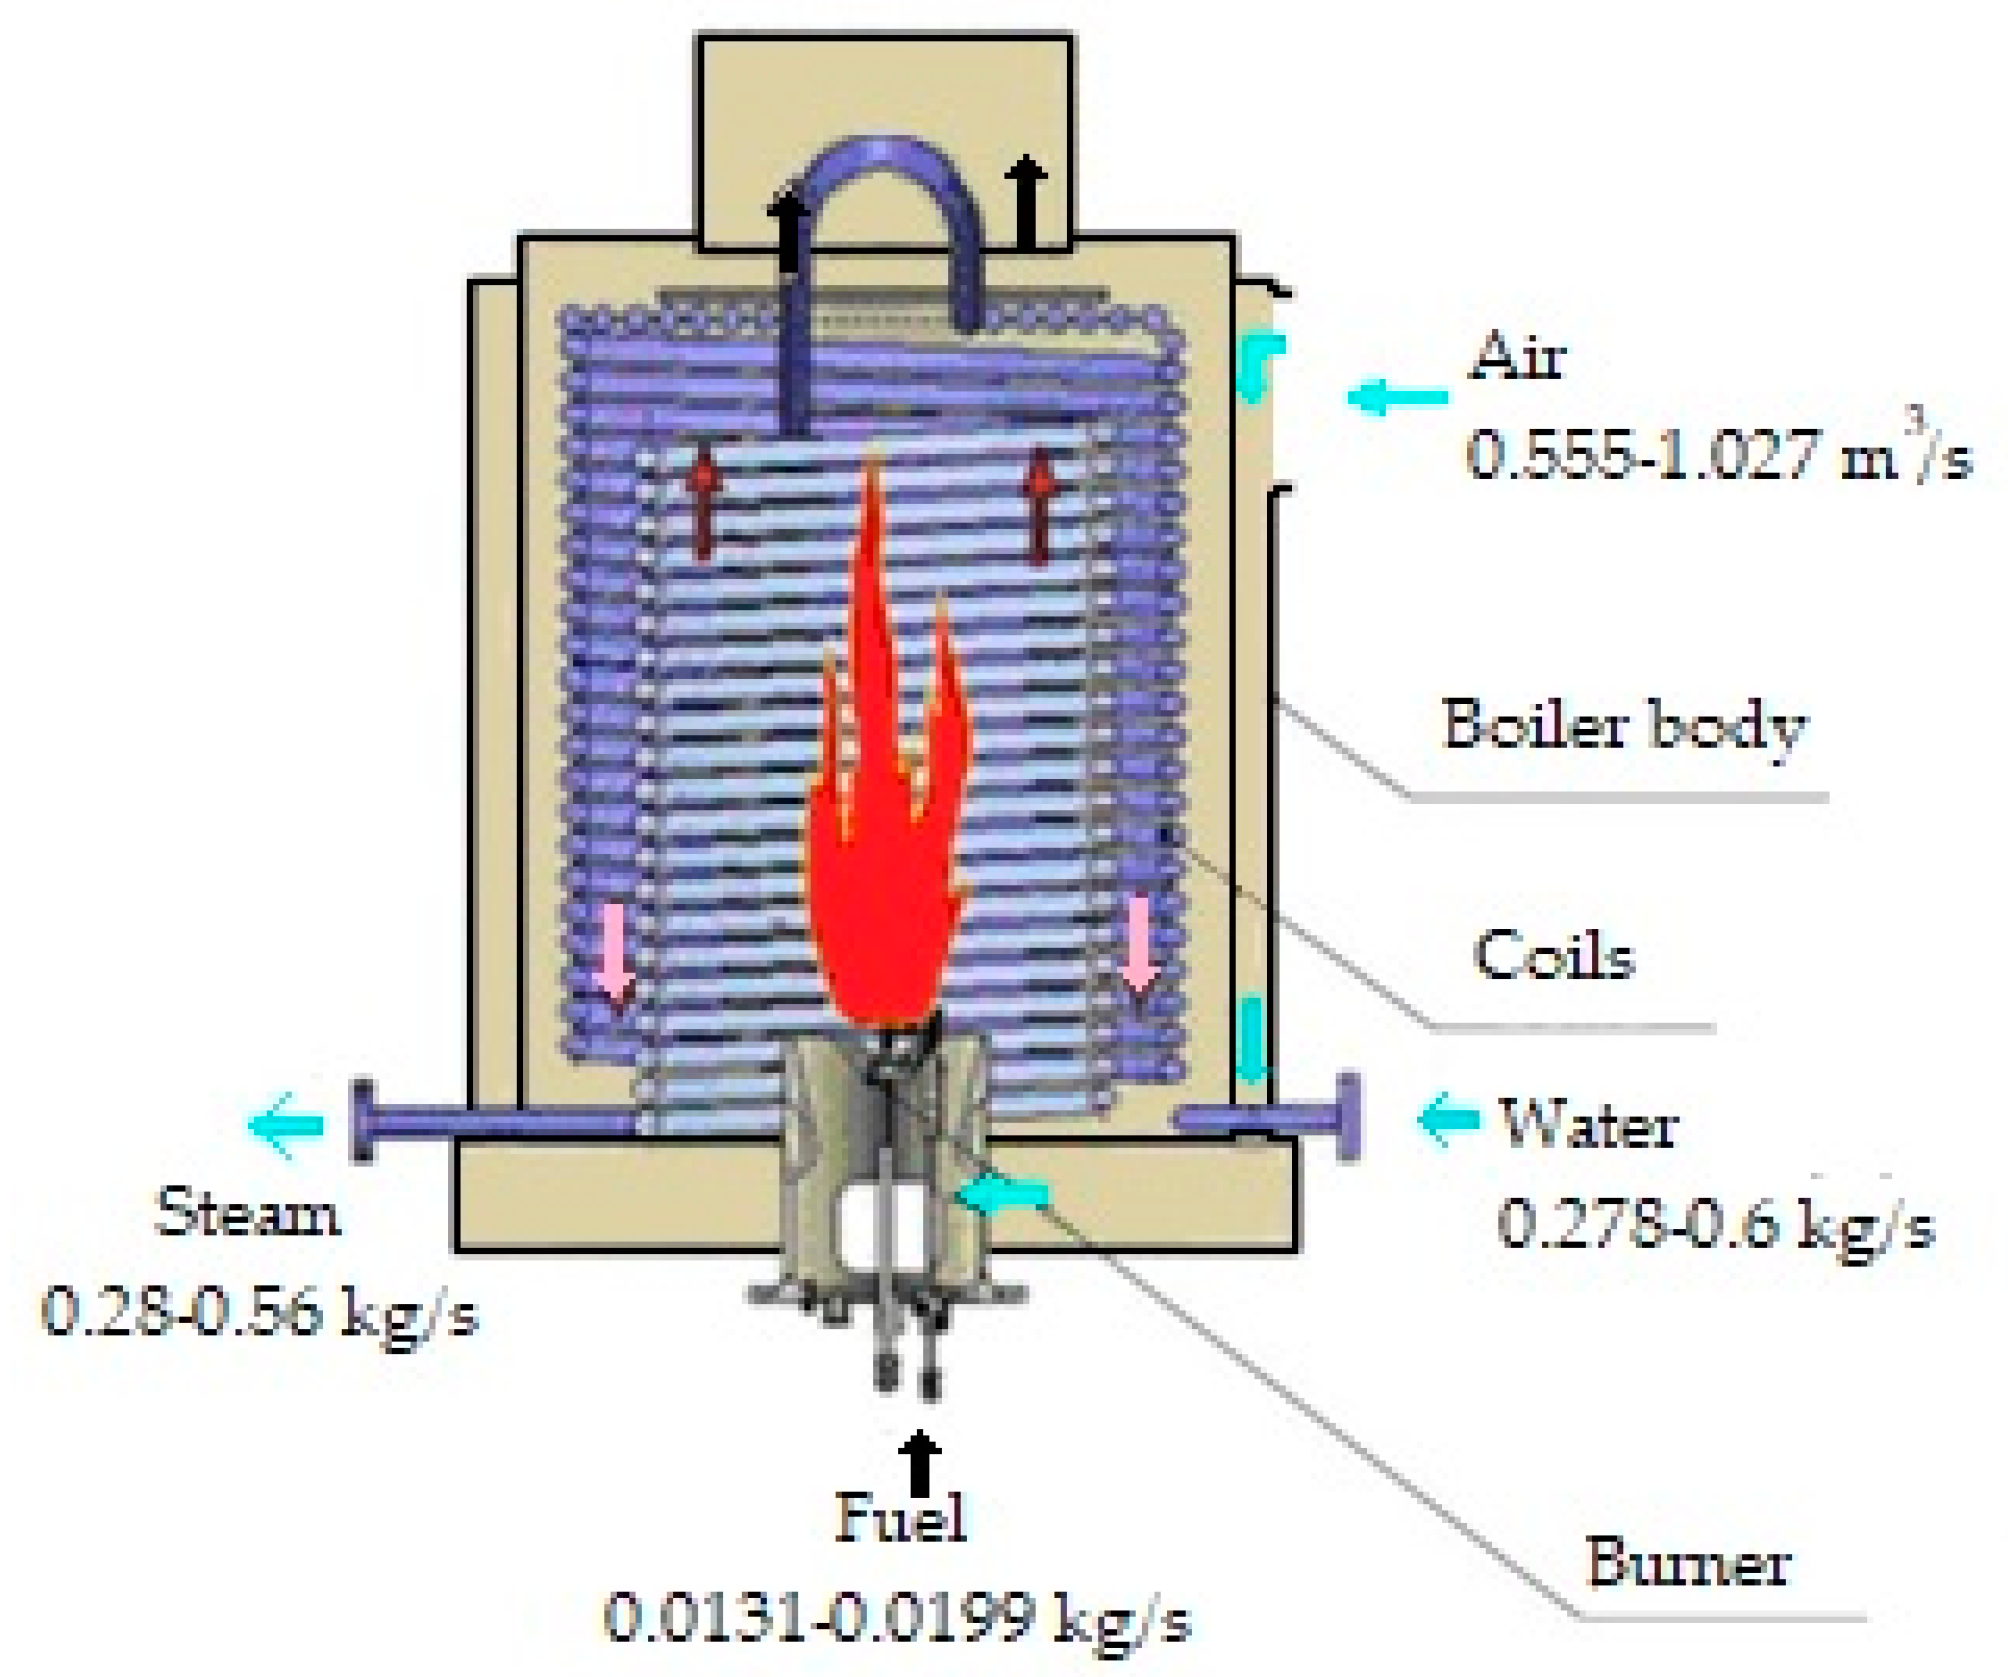
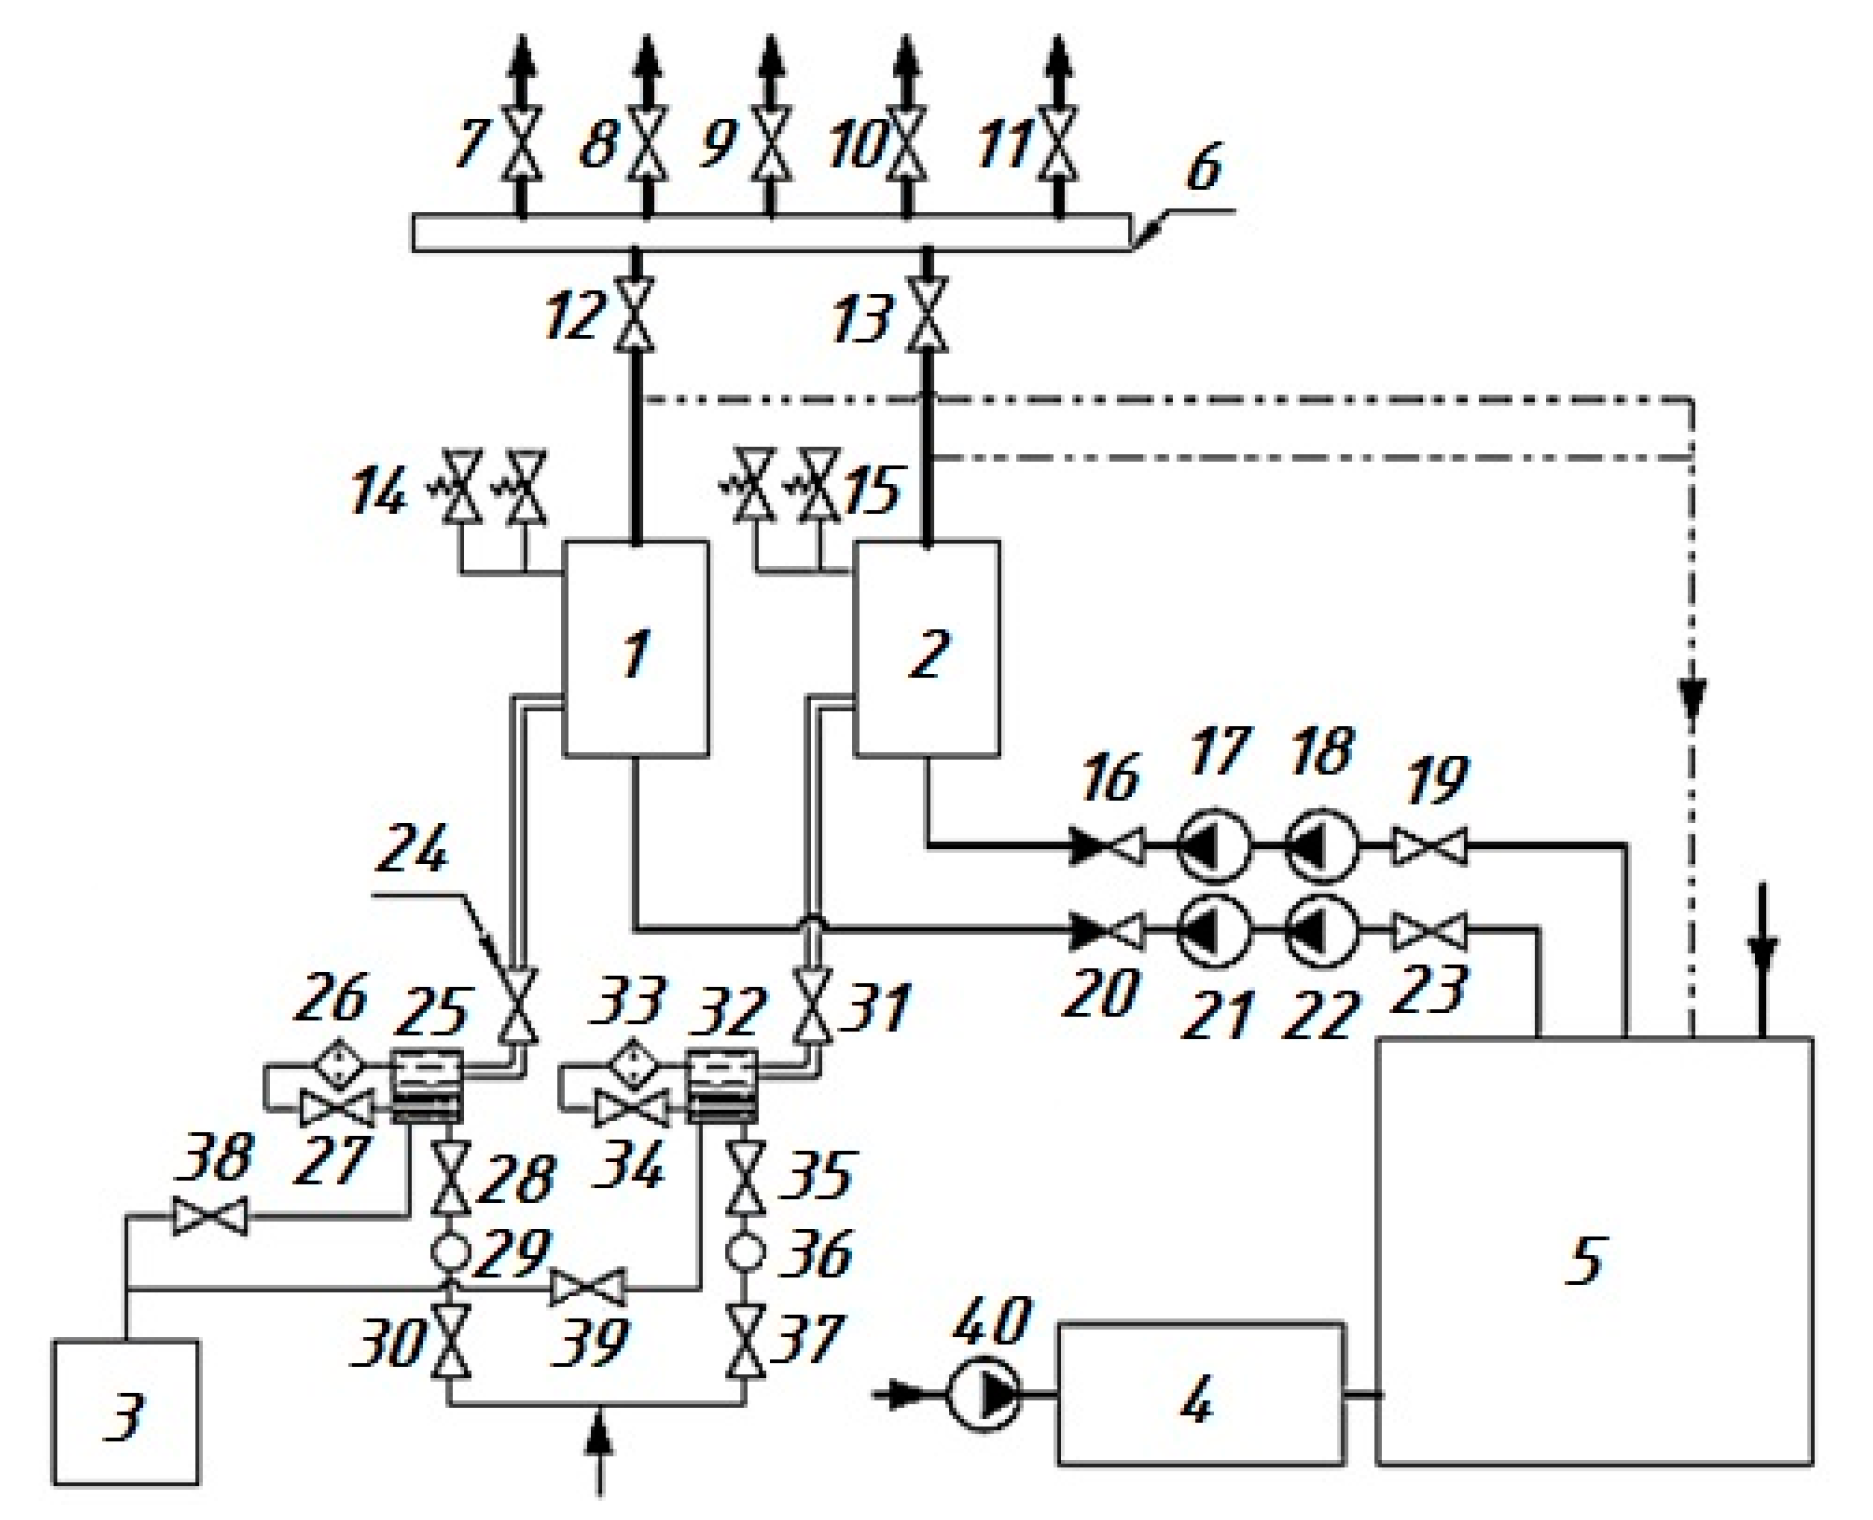
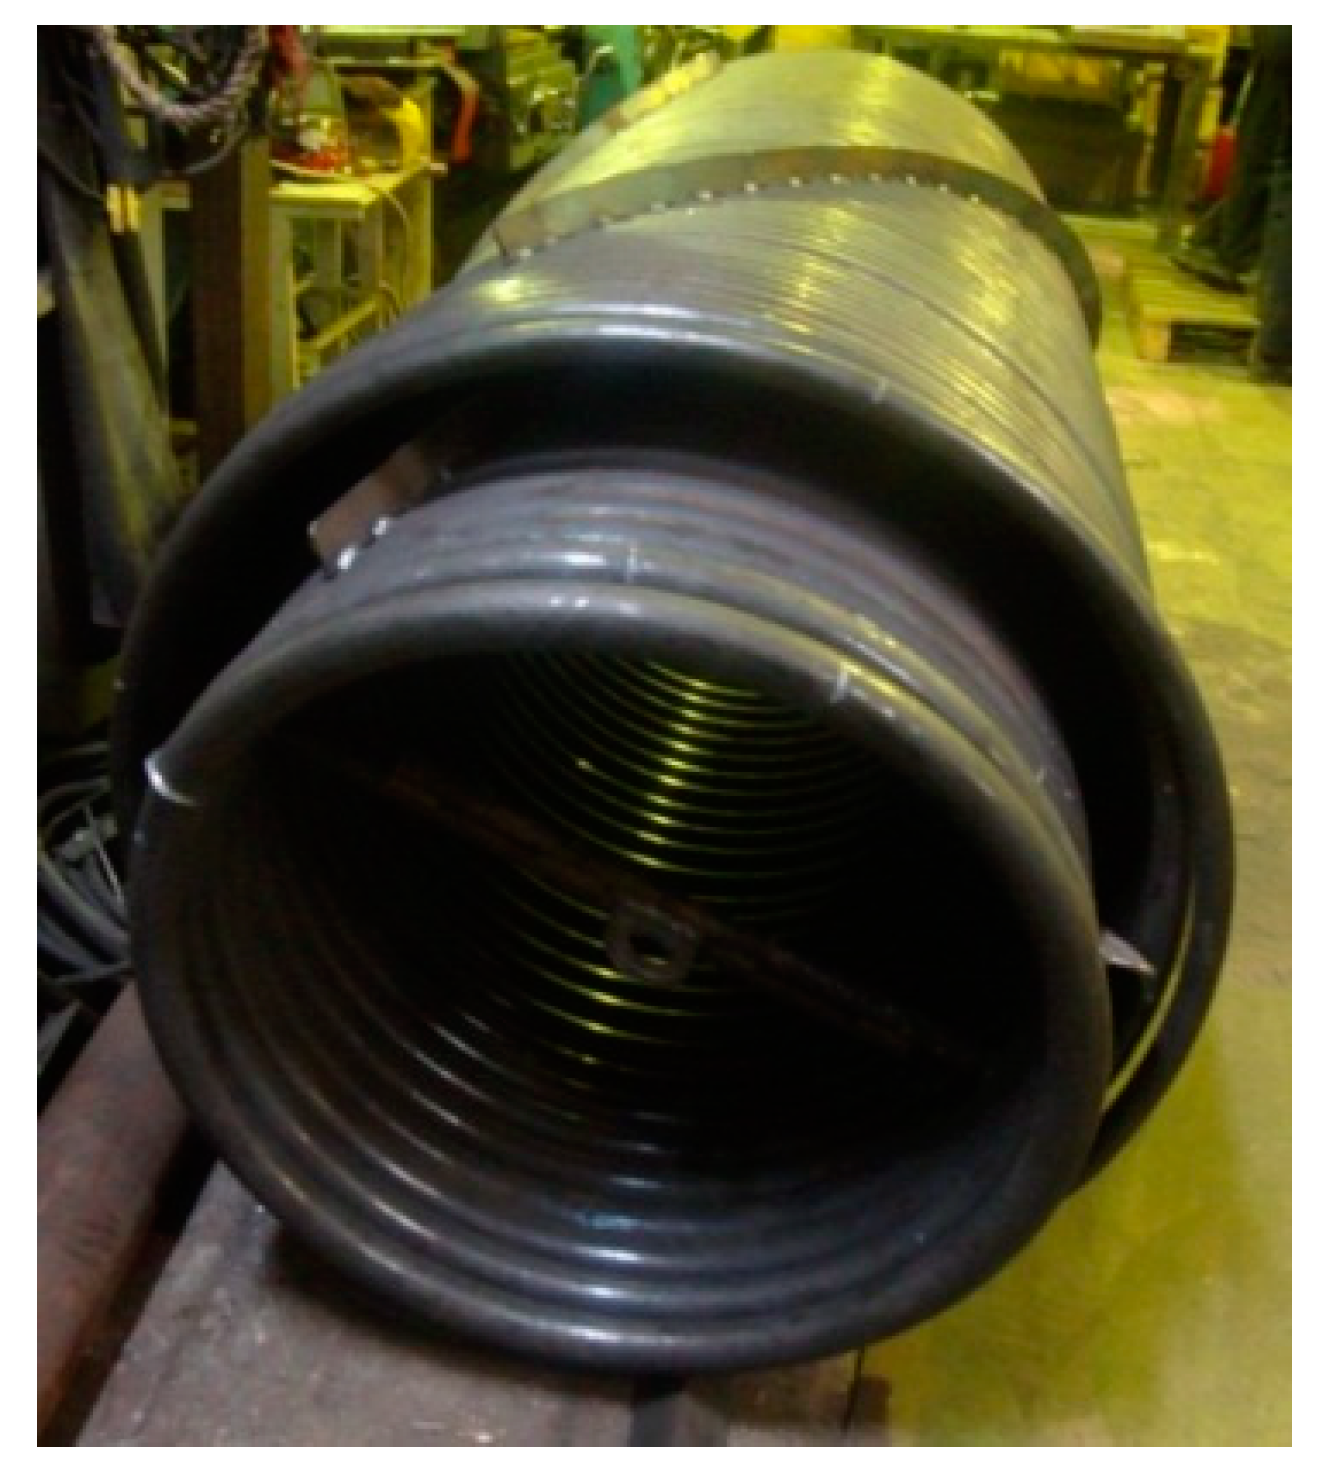
1.3. The Design of the Steam Generator under Consideration
2. Materials and Methods
- (1)
- Random component of the thermometer reading Ti, caused by a random change in all possible effects affecting the measurement result.
- (2)
- Inaccuracy of the method for estimating the correction introduced to account for the effect of the heat sink effect on the thermometer body.
- (3)
- The probabilistic nature of the estimation of the error of the thermometer. Total standard uncertainty of temperature measurement can be described by the following relation:where —estimation of the random component of the total uncertainty of the temperature measurement result, estimated by type A; —estimation of the uncertainty component of the temperature measurement result due to the uncertainty of the correction introduced to account for the heat sink effect on the thermometer body; —estimation of the uncertainty component of the temperature measurement result due to the uncertainty of the thermometer error estimation.
- (1)
- The random component of the pressure gauge readings caused by a random change in all possible effects affecting the measurement result.
- (2)
- The probabilistic nature of the estimation of the error of the pressure gauge. Total standard uncertainty of temperature measurement can be described by the following relation:where —estimation of the random component of the total uncertainty of the pressure measurement result, estimated by type A; —estimation of the uncertainty component of the pressure measurement result due to the uncertainty of the type B thermometer error estimation.
3. Mathematical and Computer Modeling of a Direct-Flow Steam Generator of the Coil Type
3.1. Mathematical Description and Boundary Conditions
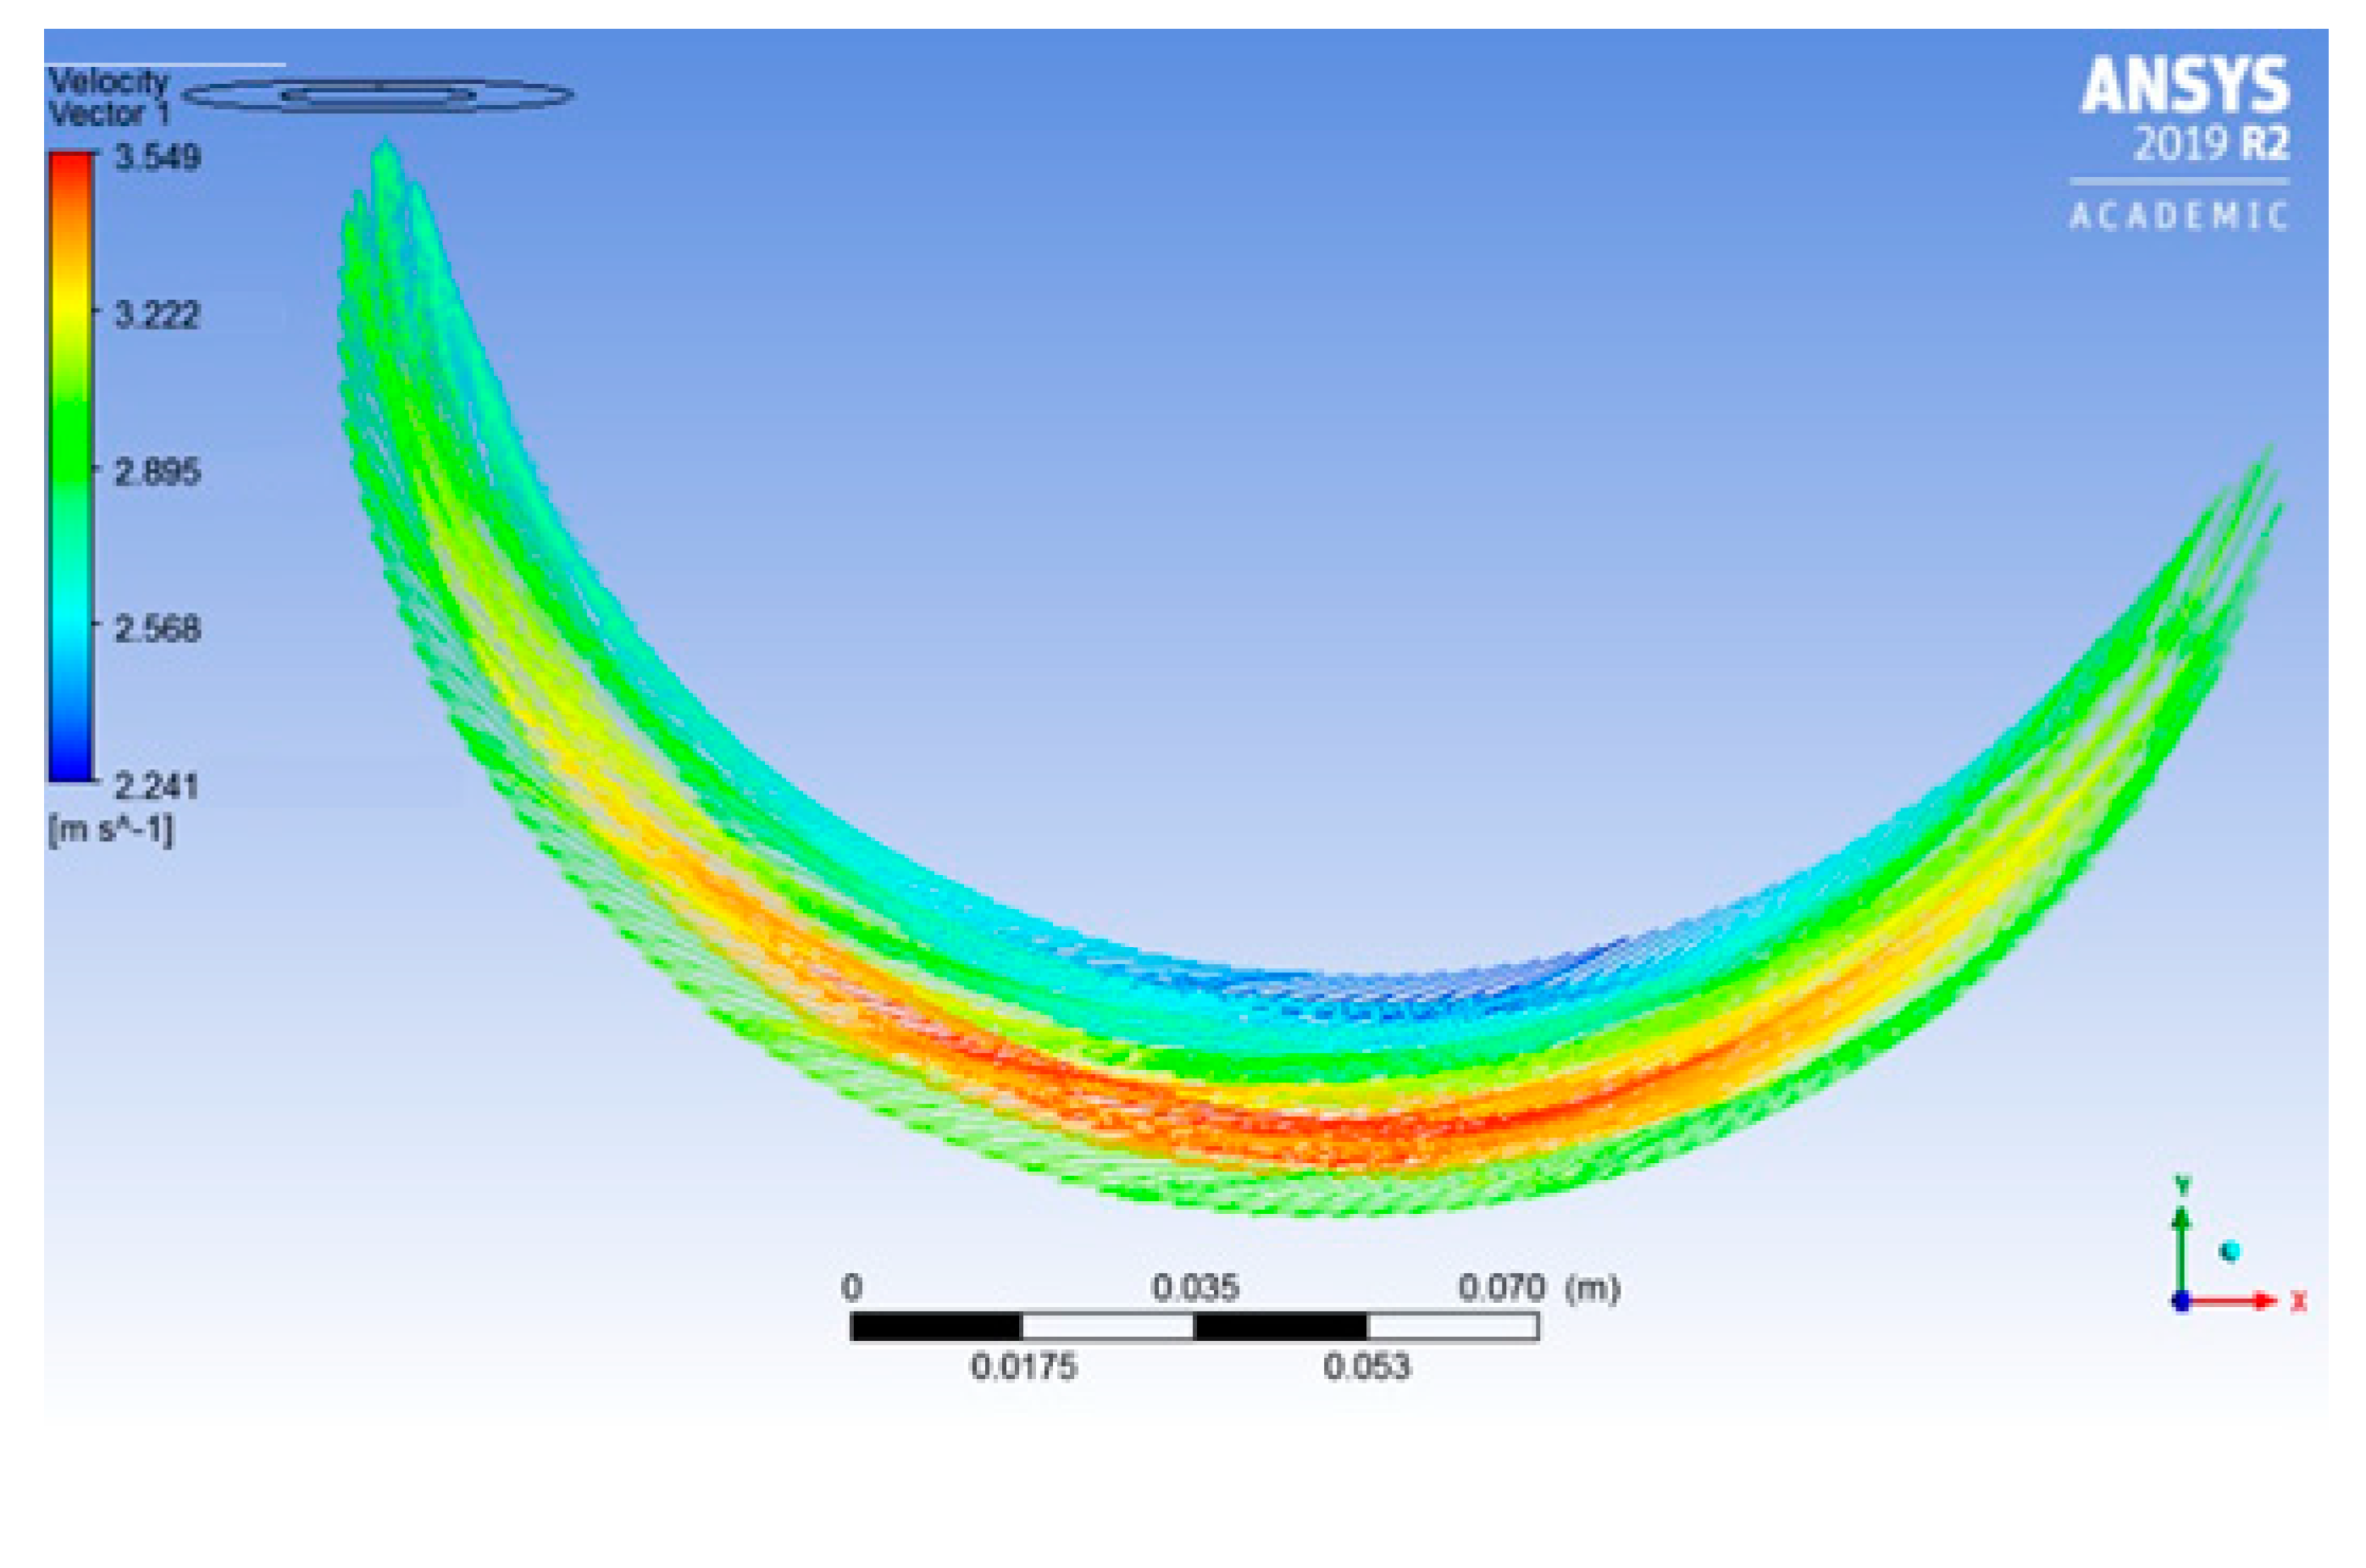
3.2. Visualization of Simulation Results
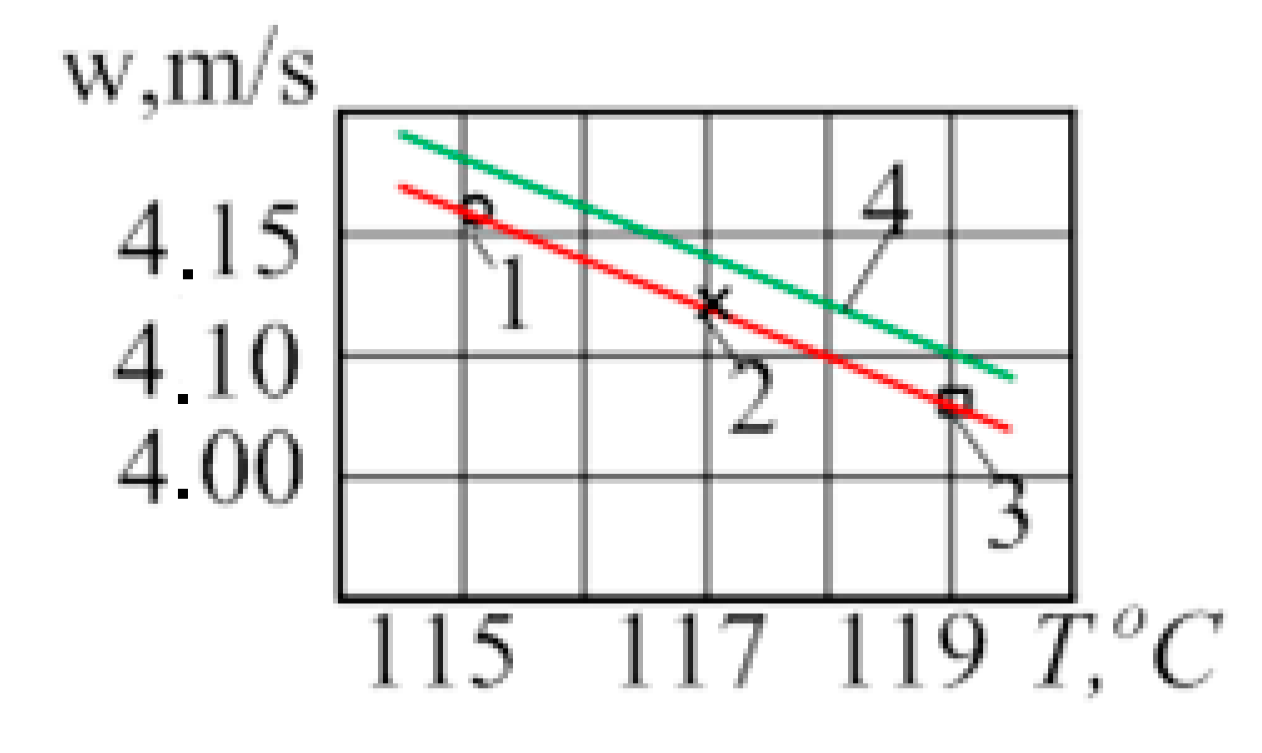
3.3. Recommendations for Calculating the Speed of the Steam-Water Mixture in Coils
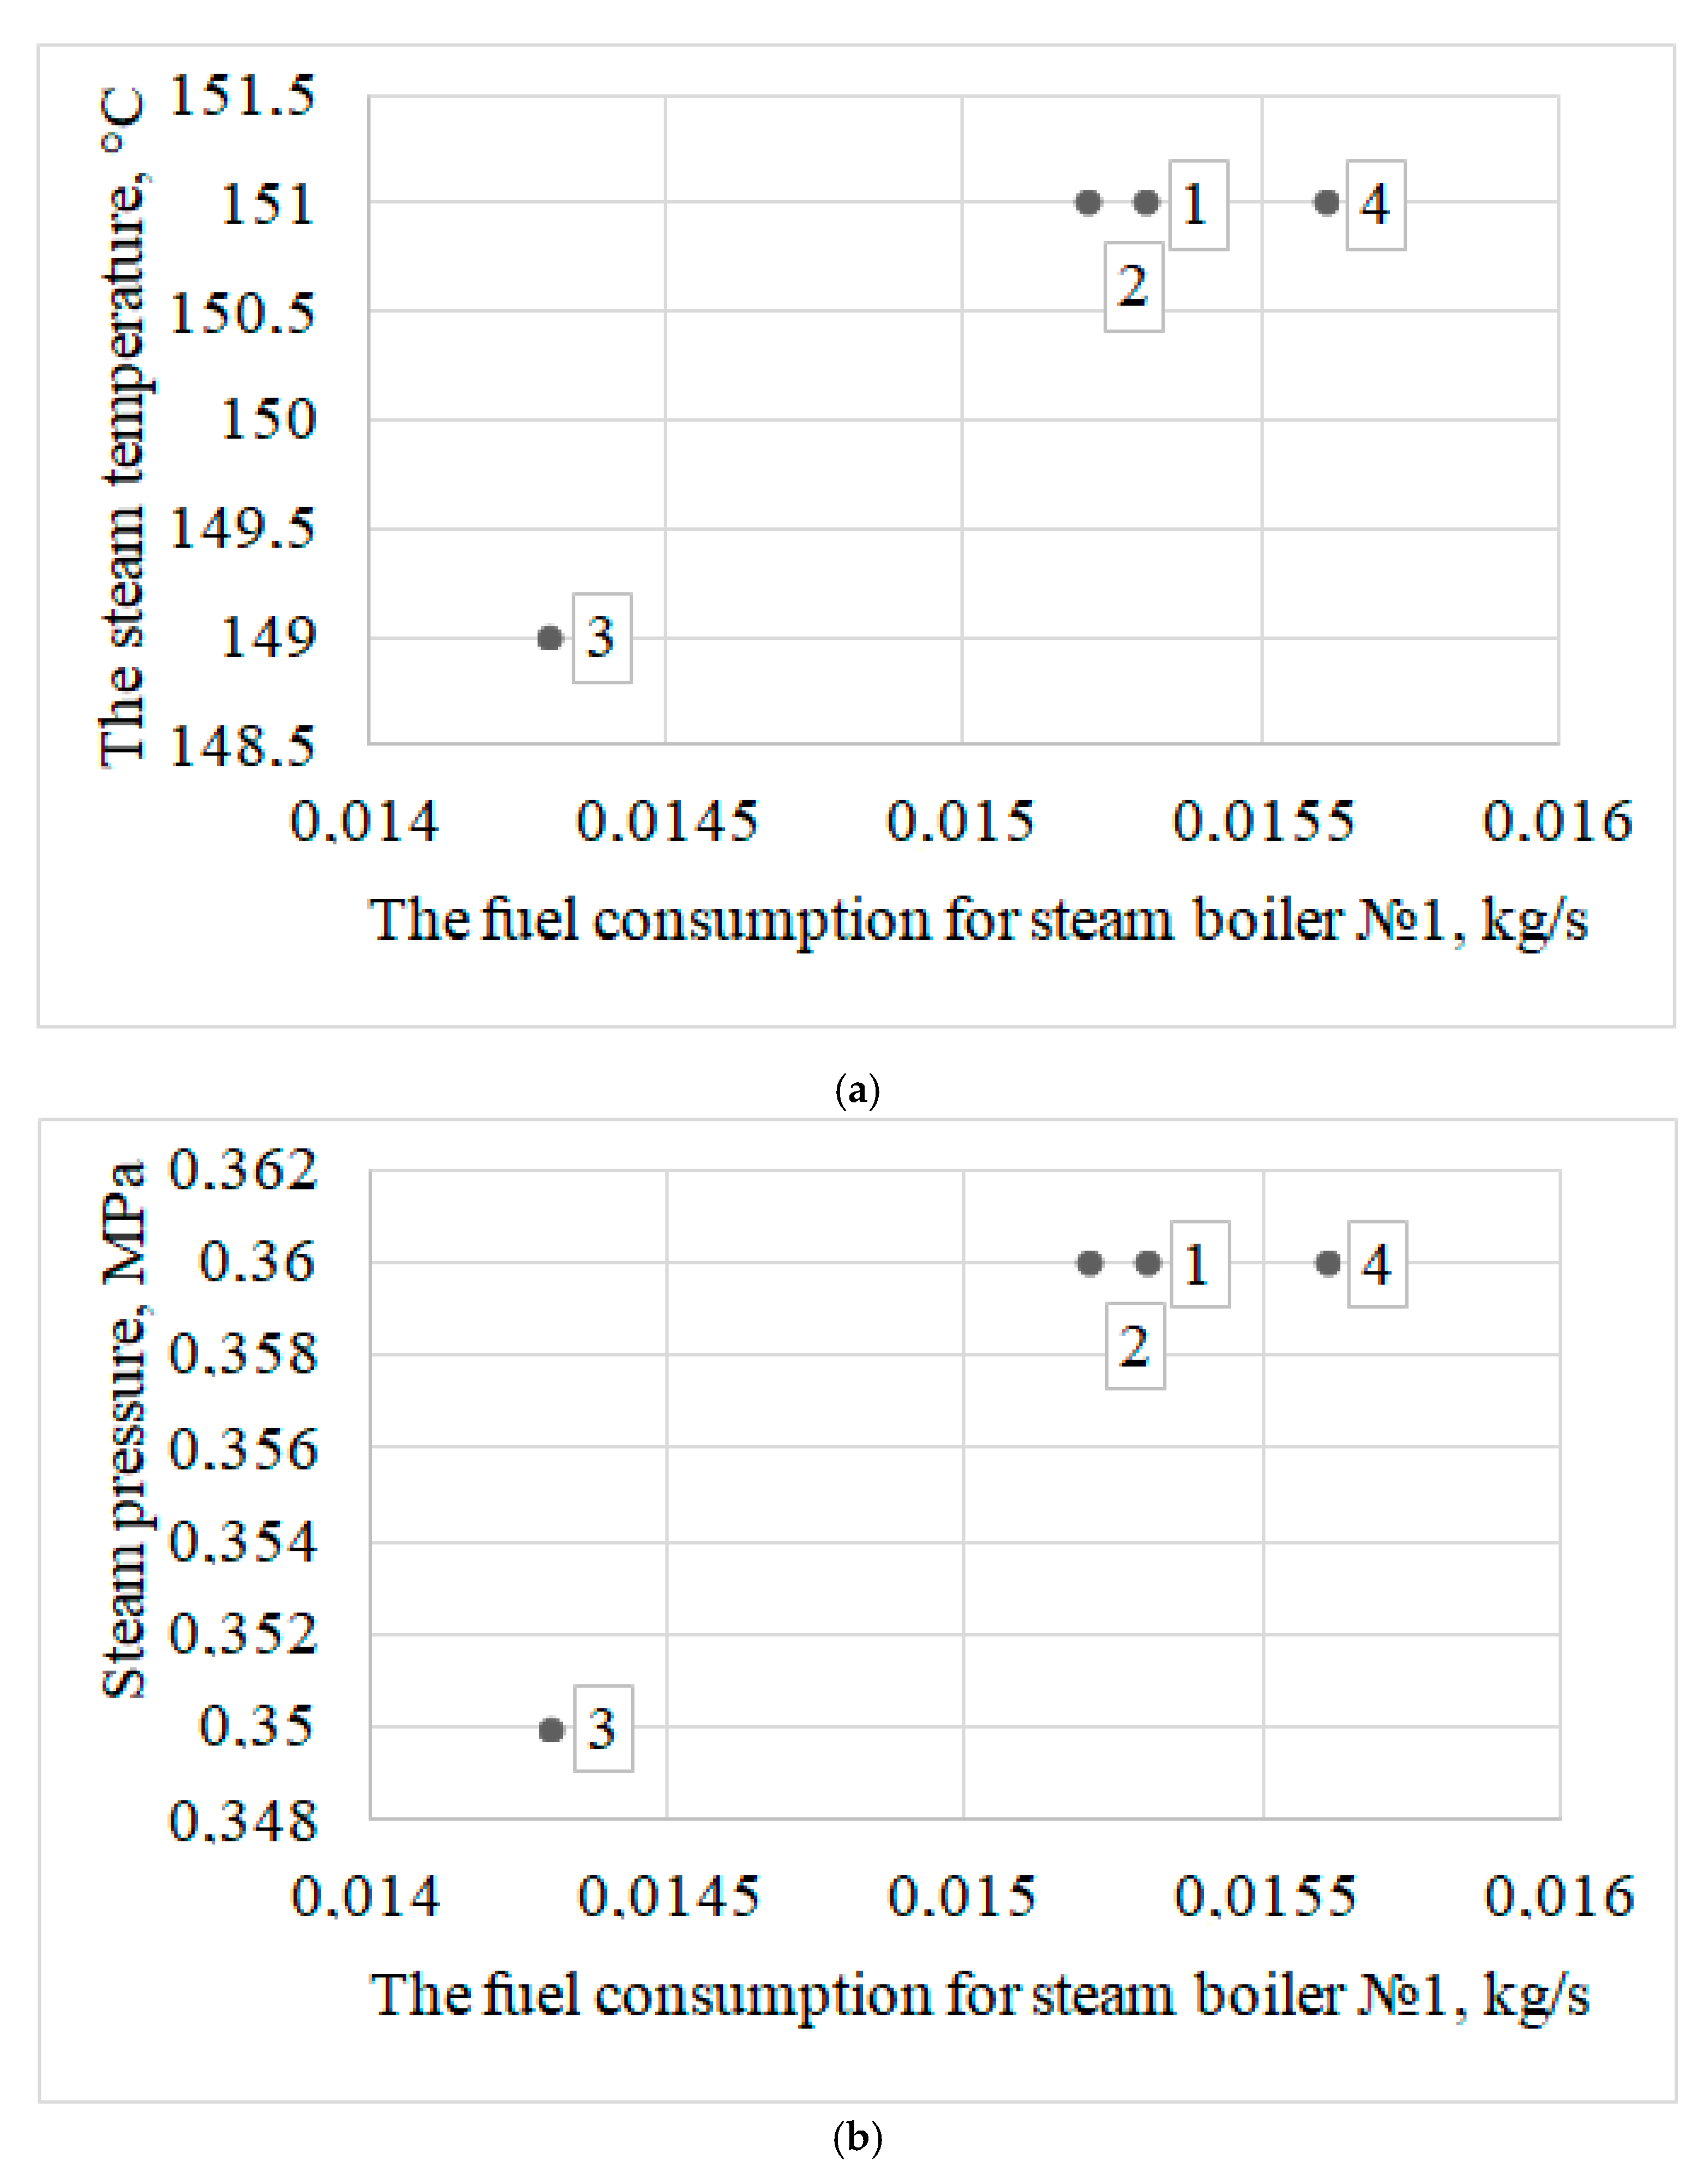
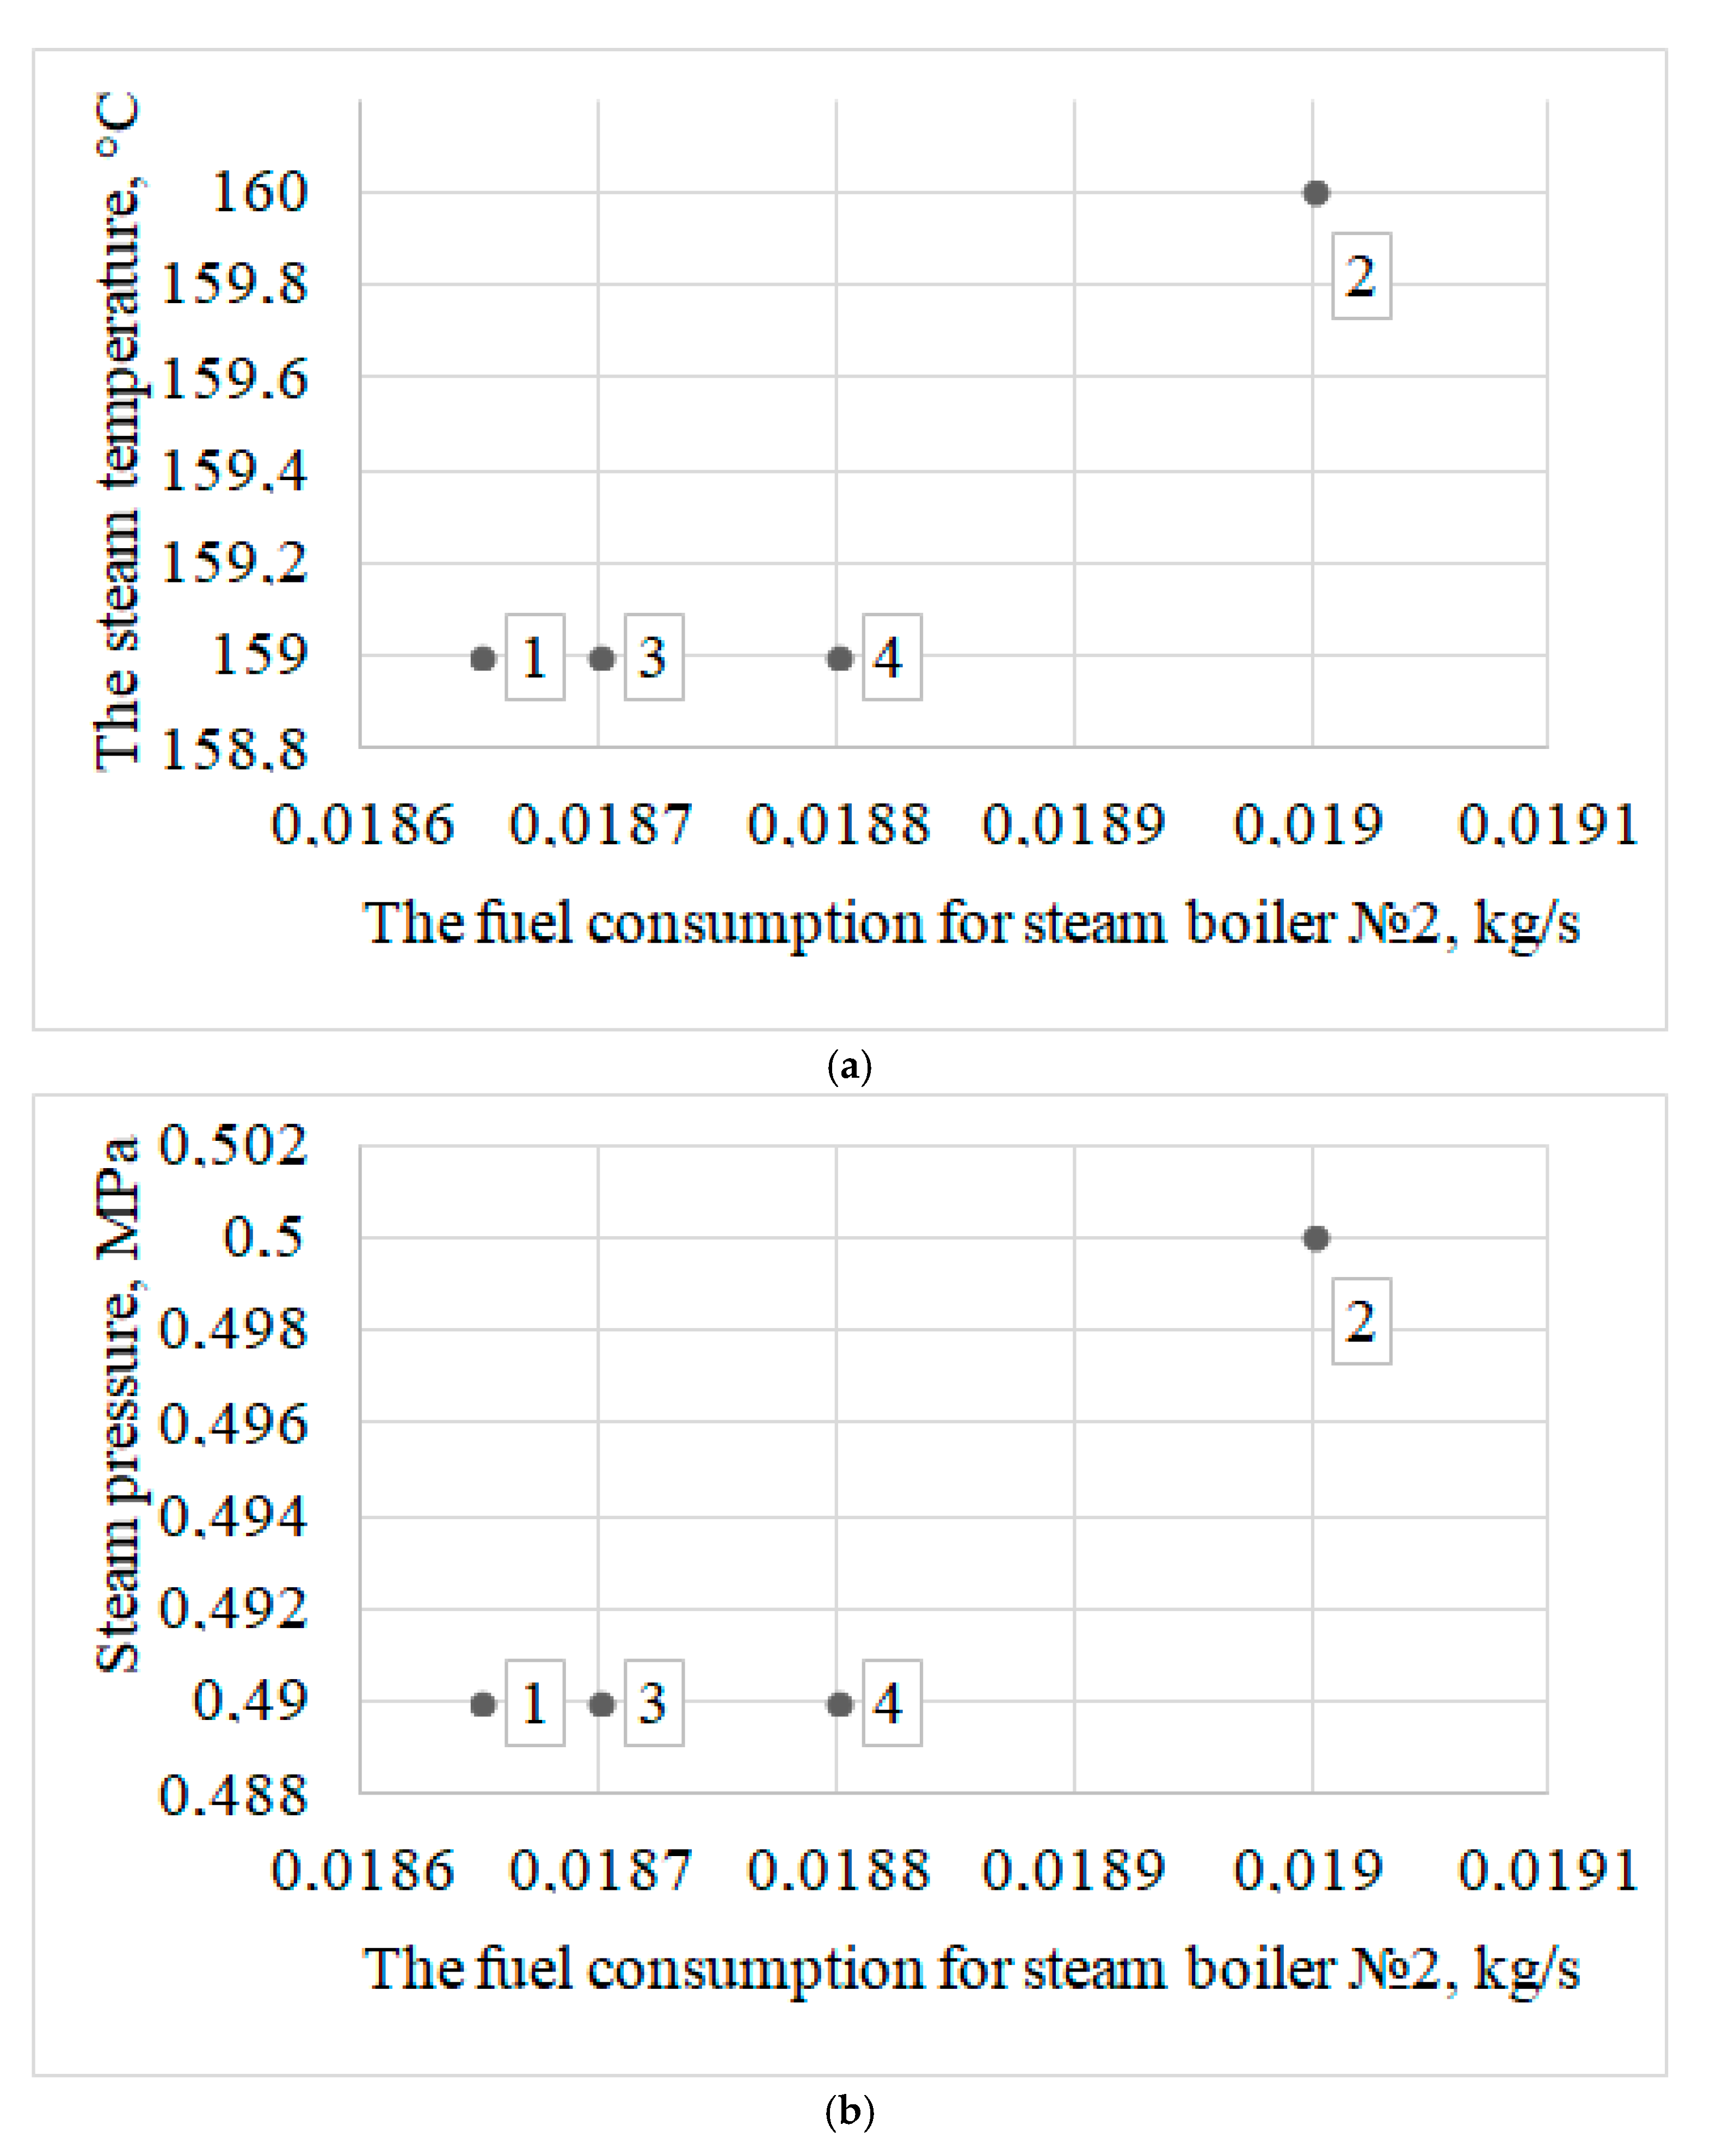
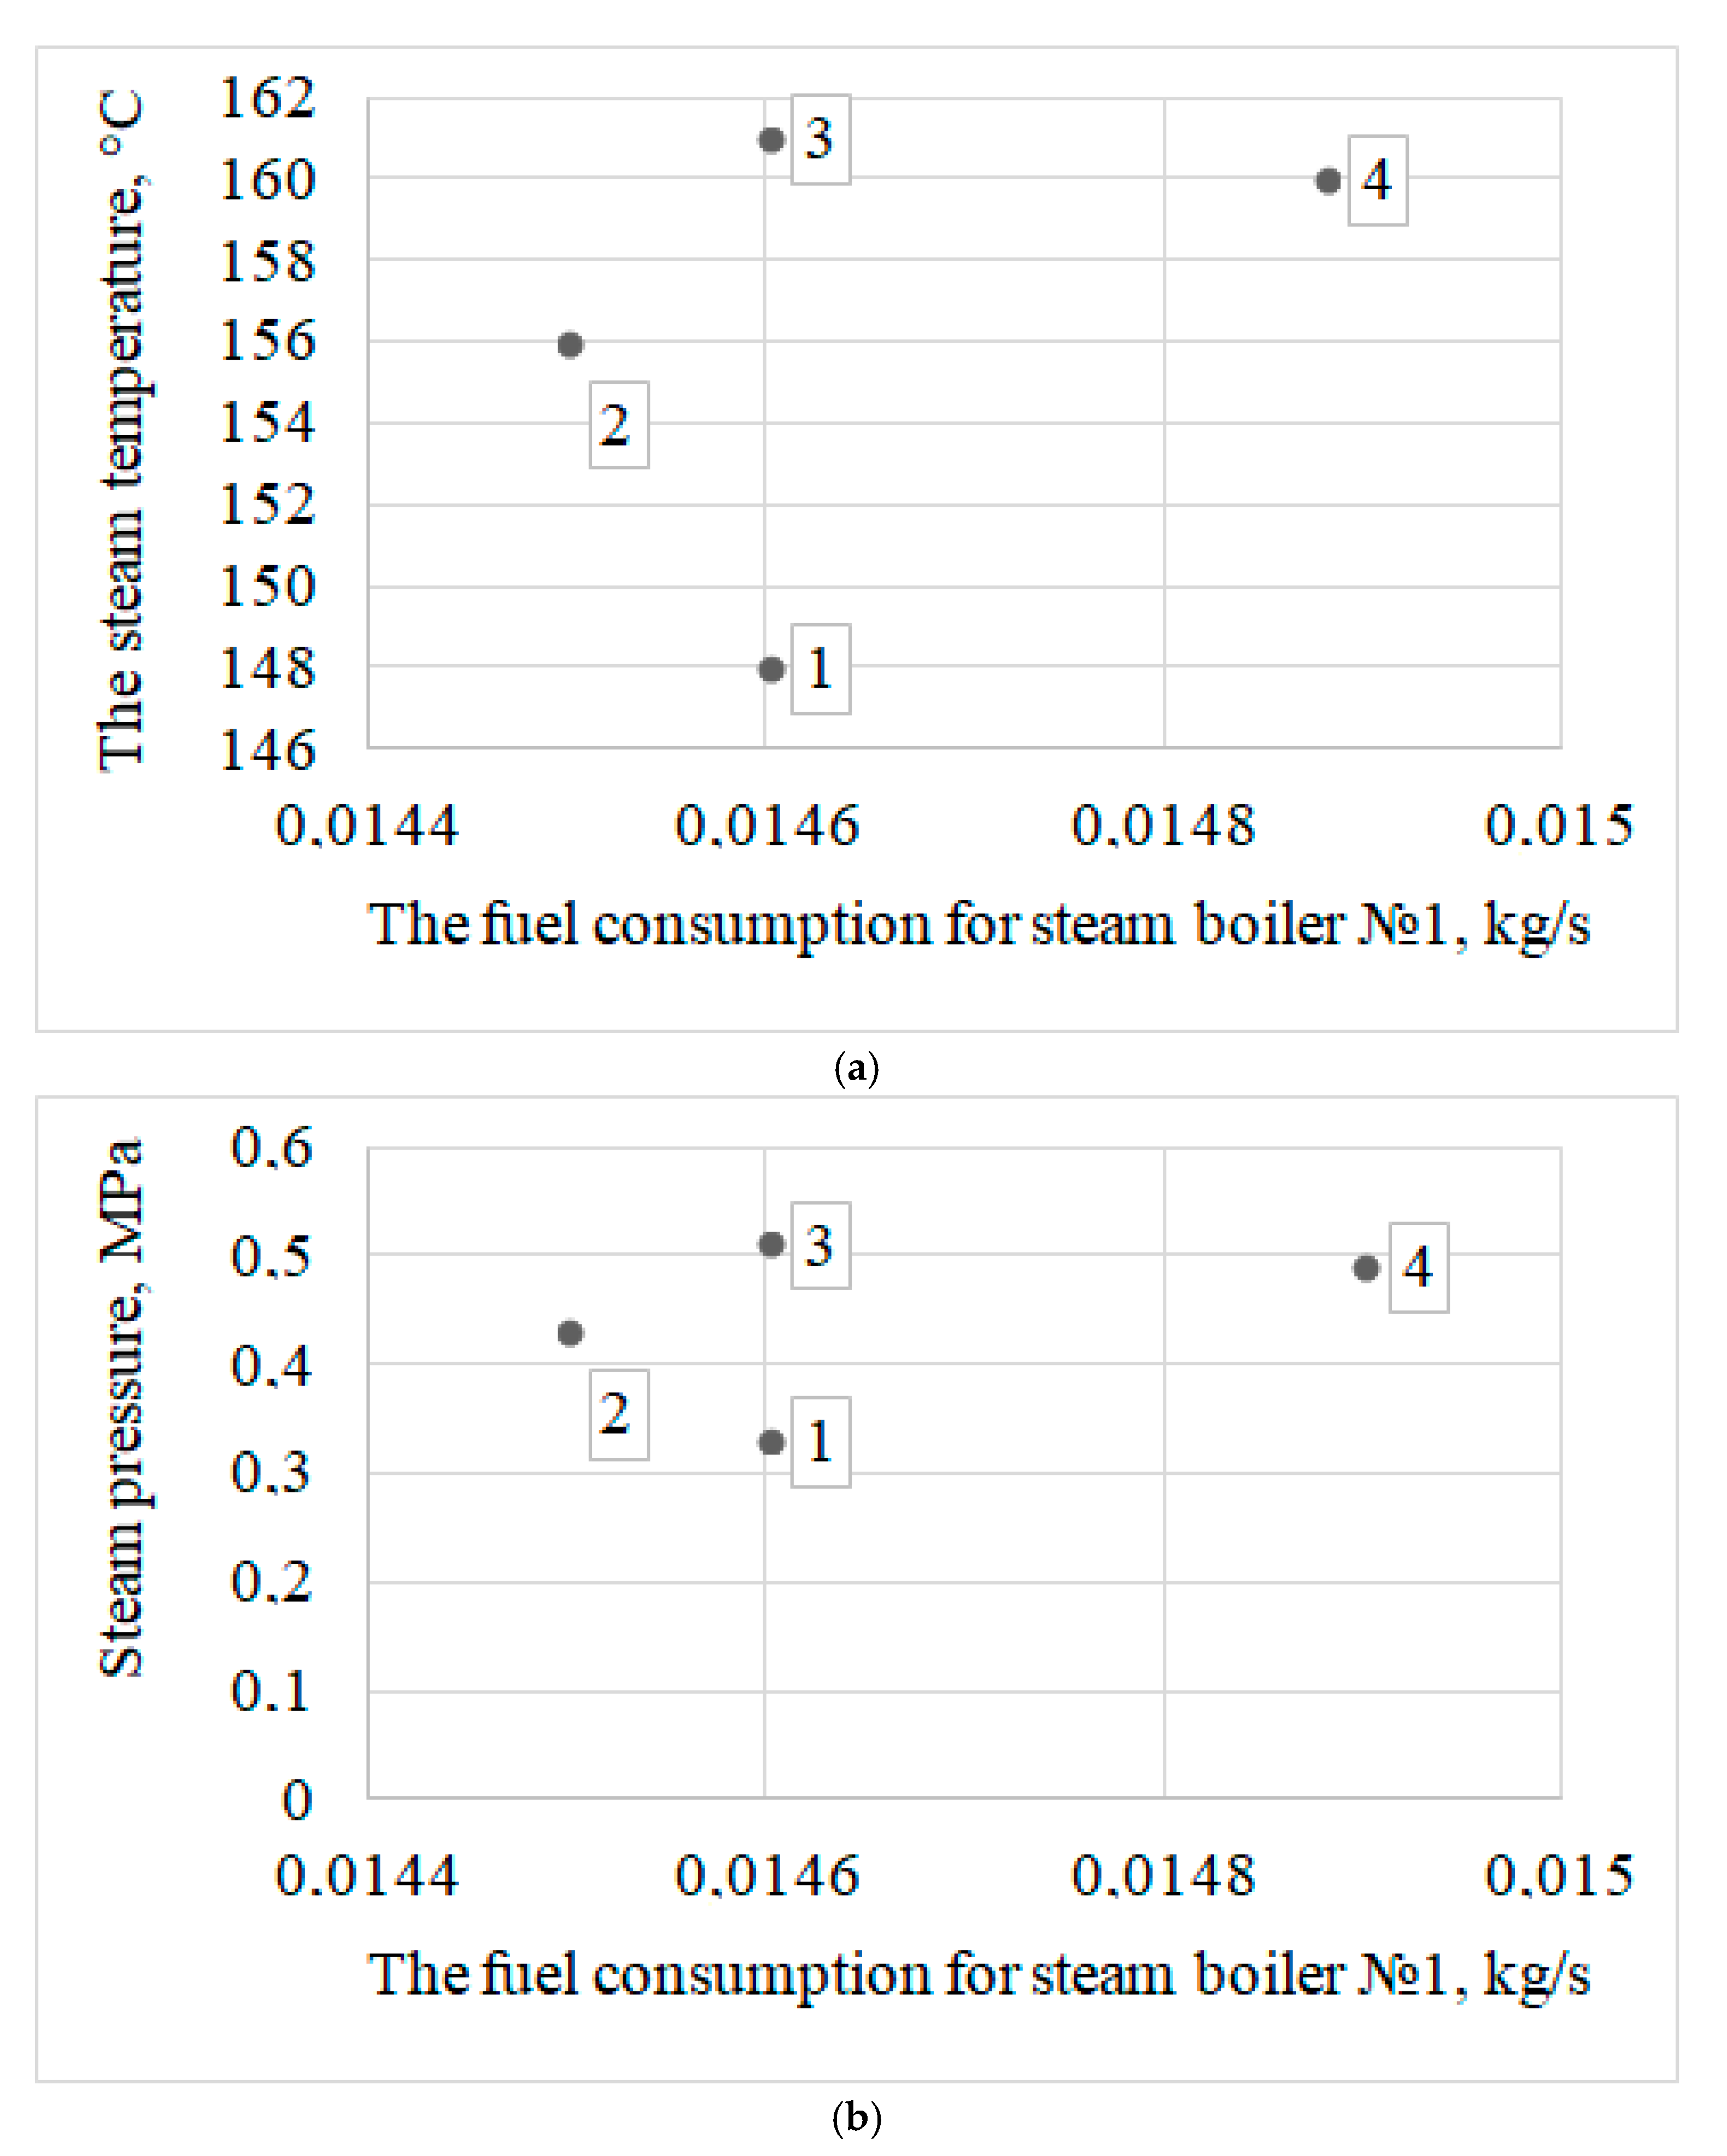
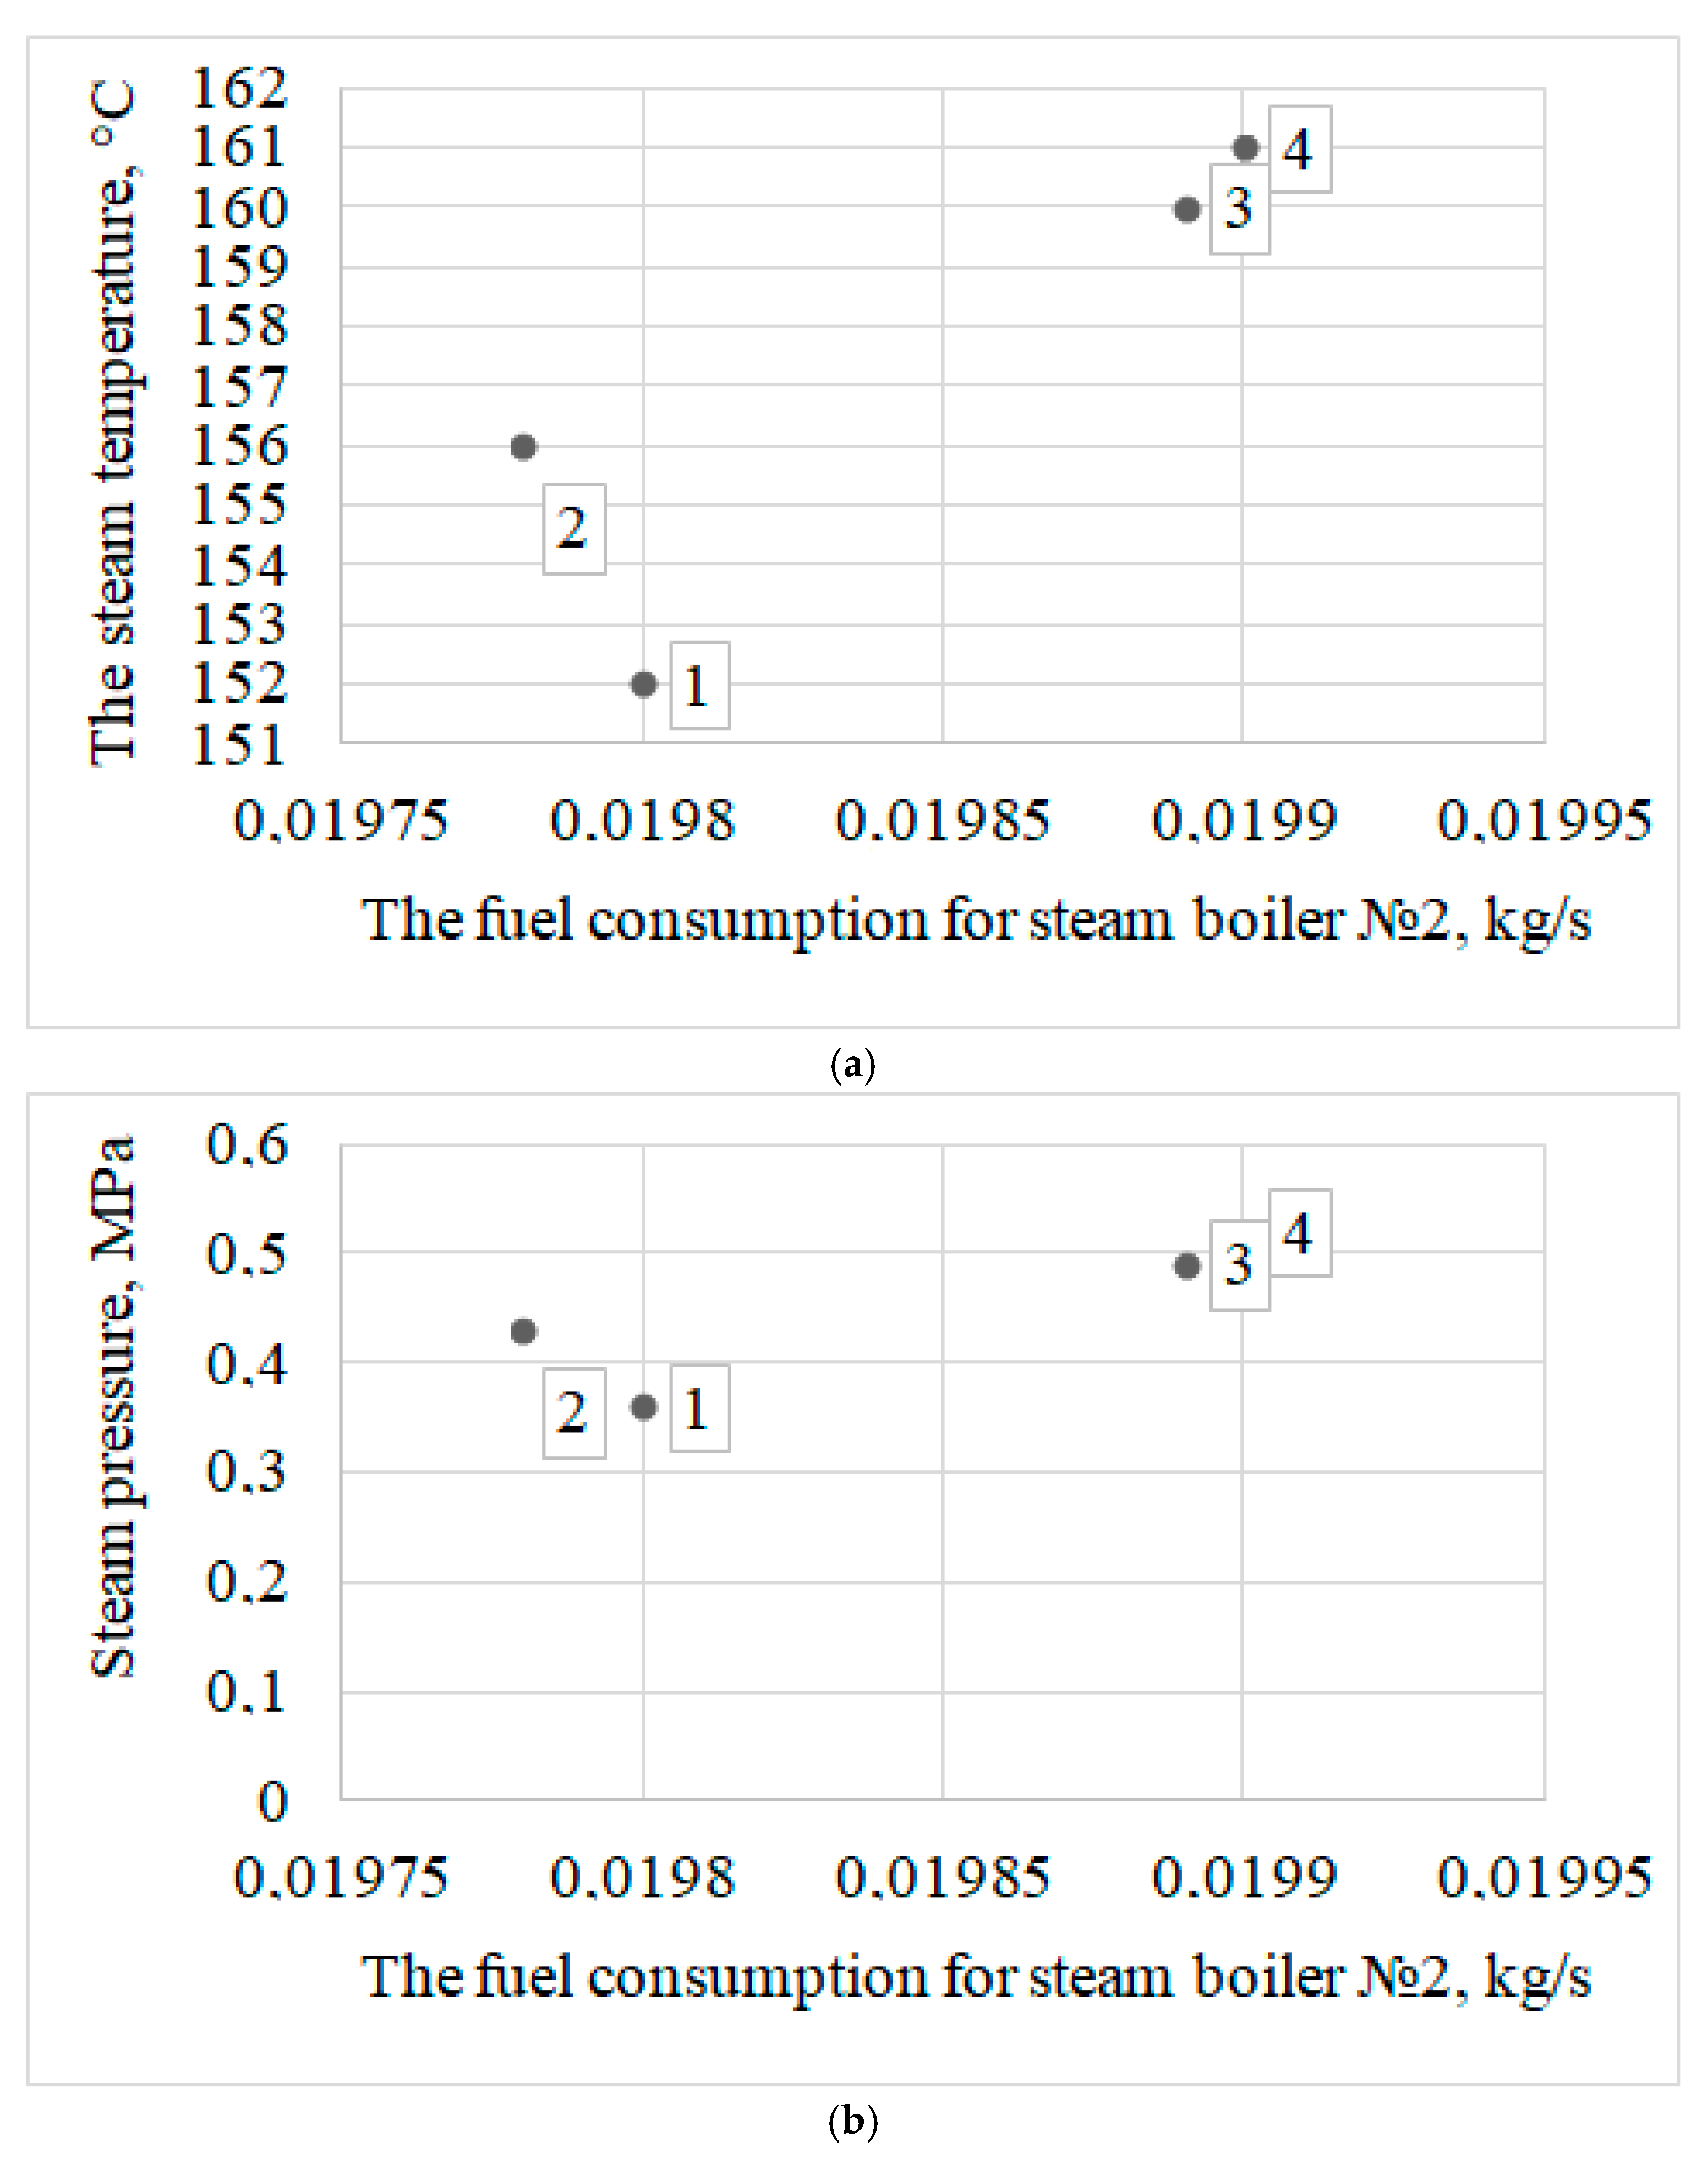
4. Experimental Data
5. Empirical Coefficients Obtained from the Results of Experiments
6. Results and Discussion
7. Conclusions
- (1)
- We introduce correction factors for the equation of the convective component of radiant-convective heat transfer in the gas ducts. With these correction factors, is close to the real value, taking into account the design features of the boiler. The results of the dependence of the correction factor on the temperature of the outside and heated air are presented. During experimental operation, the advantages of the compact design of the boilers were proven.
- (2)
- Testing the boiler plant showed that a stable fuel temperature provided the required viscosity and good fuel atomization. Along with the change in the consumption of feed water and fuel, there was a significant change in temperature and steam pressure due to the low storage capacity of the once-through boilers. Losses with underburning and outgoing heat have decreased.
- (3)
- A methodological basis for analytical and experimental studies of radiation and convective heat transfer in a direct-flow steam generator of the coil type has been developed.
- (4)
- For the first time, experimental coefficients have been obtained that can be used for direct-flow steam generators of the coil type, which will increase the efficiency of these heat exchange devices.
- (5)
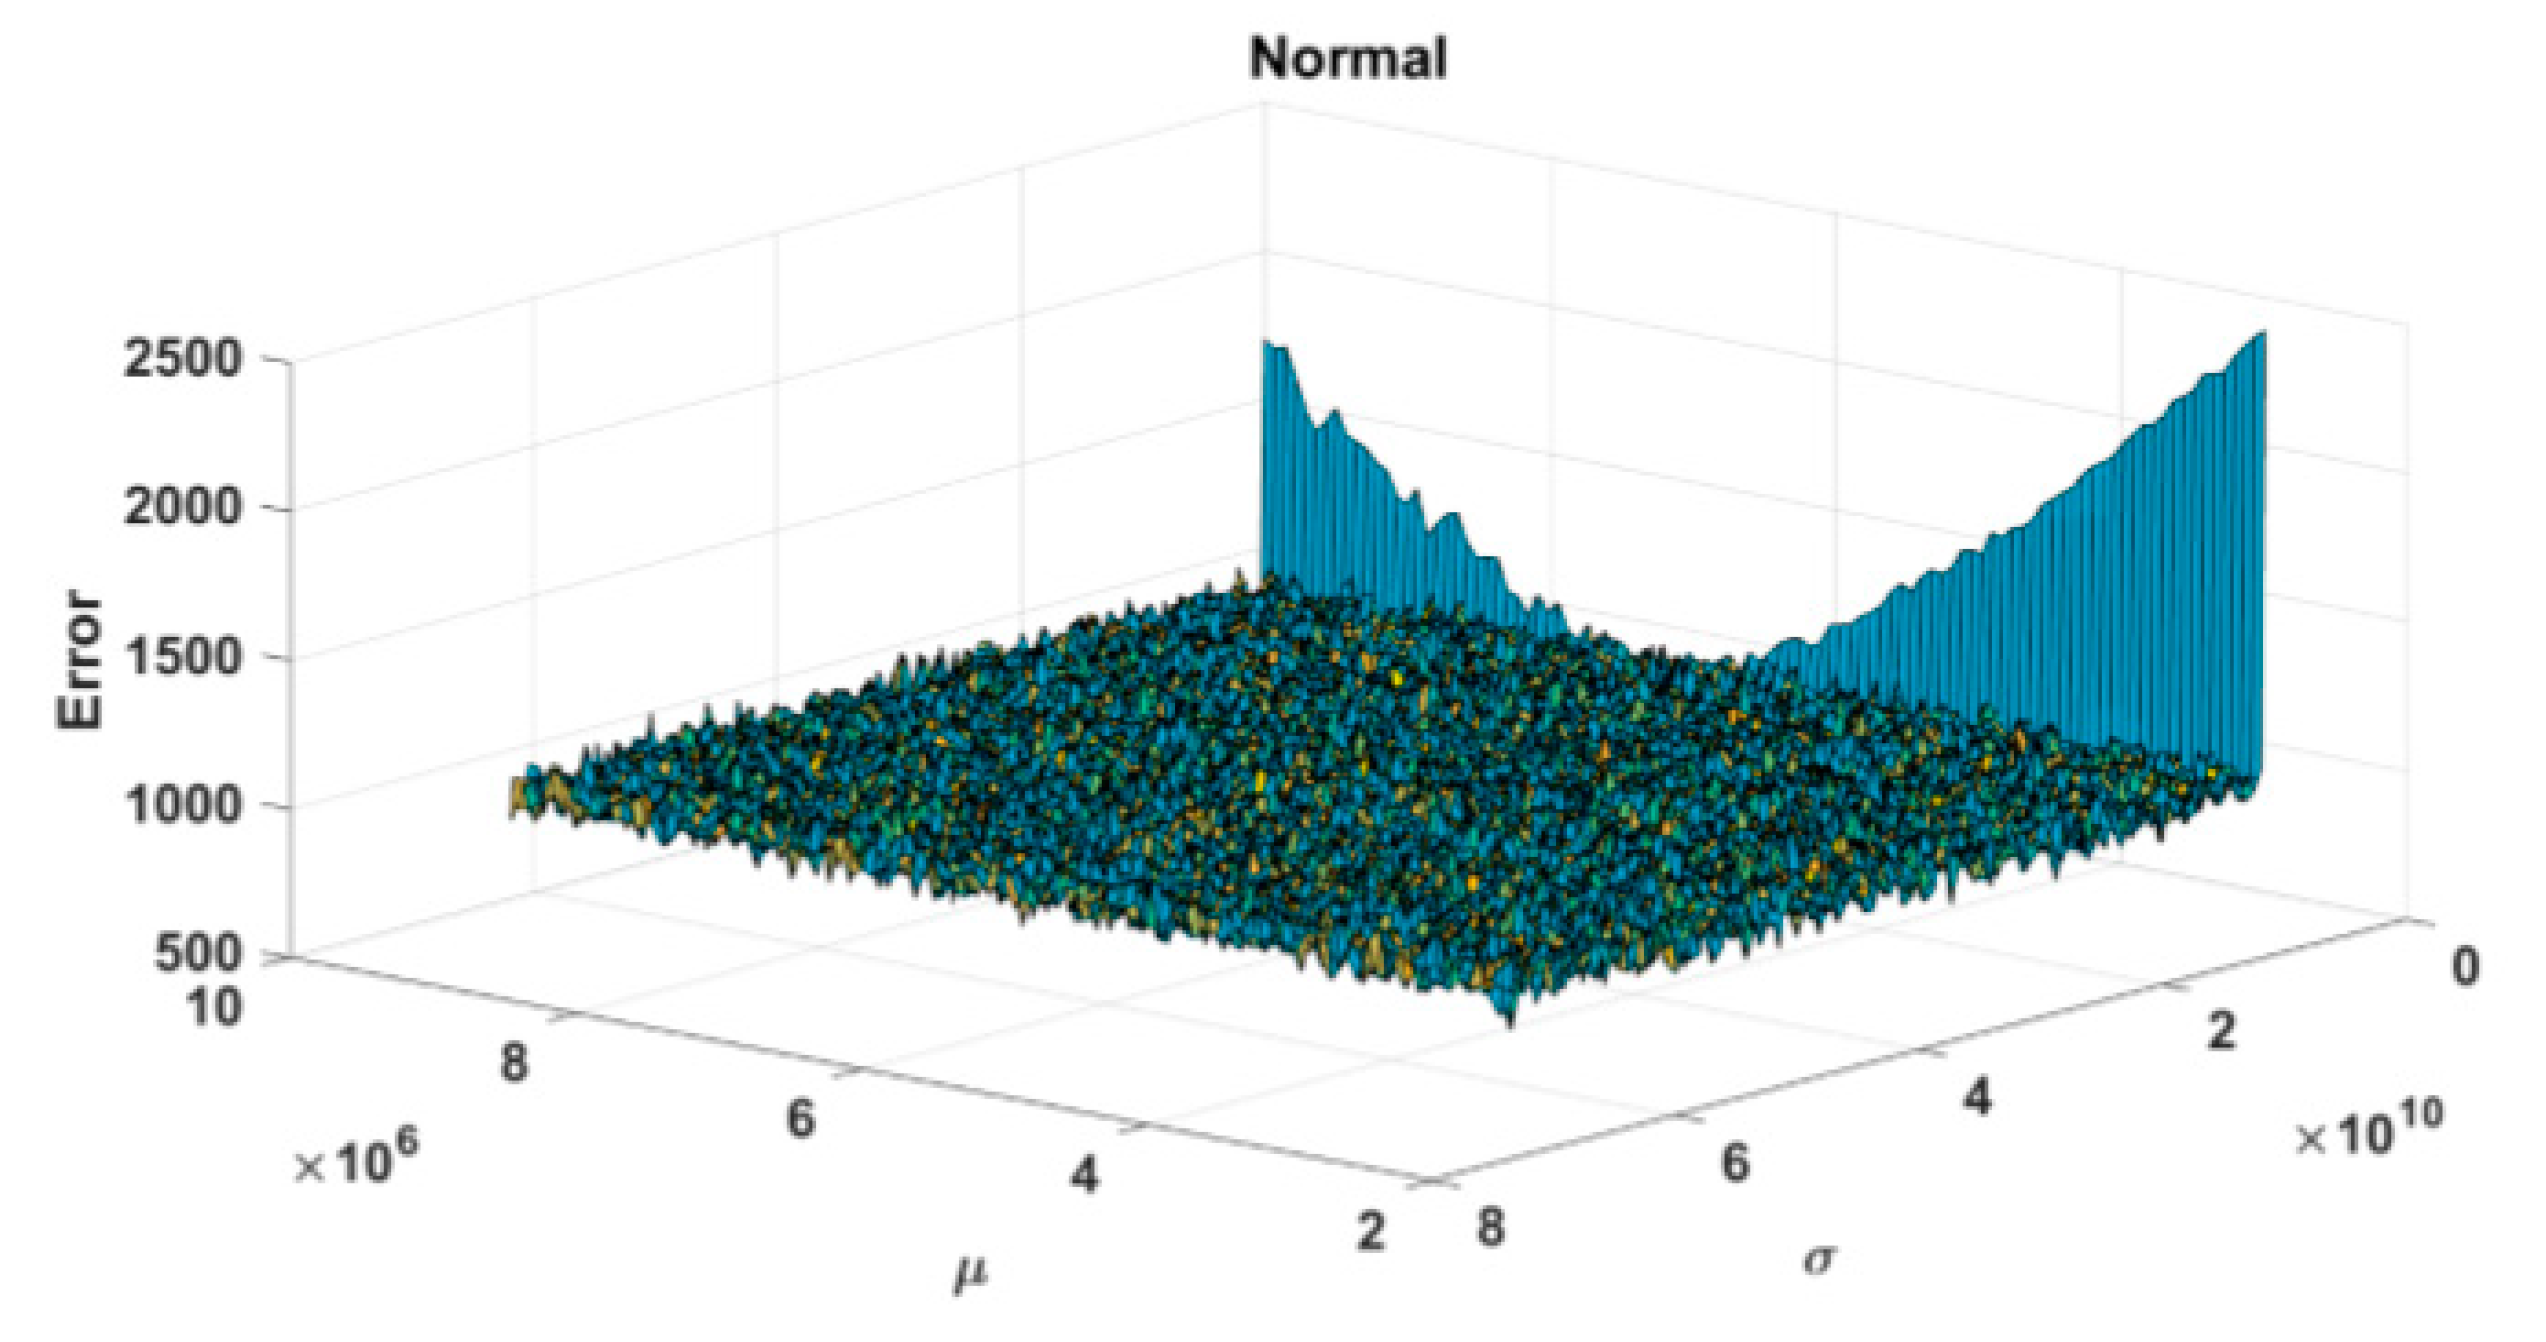
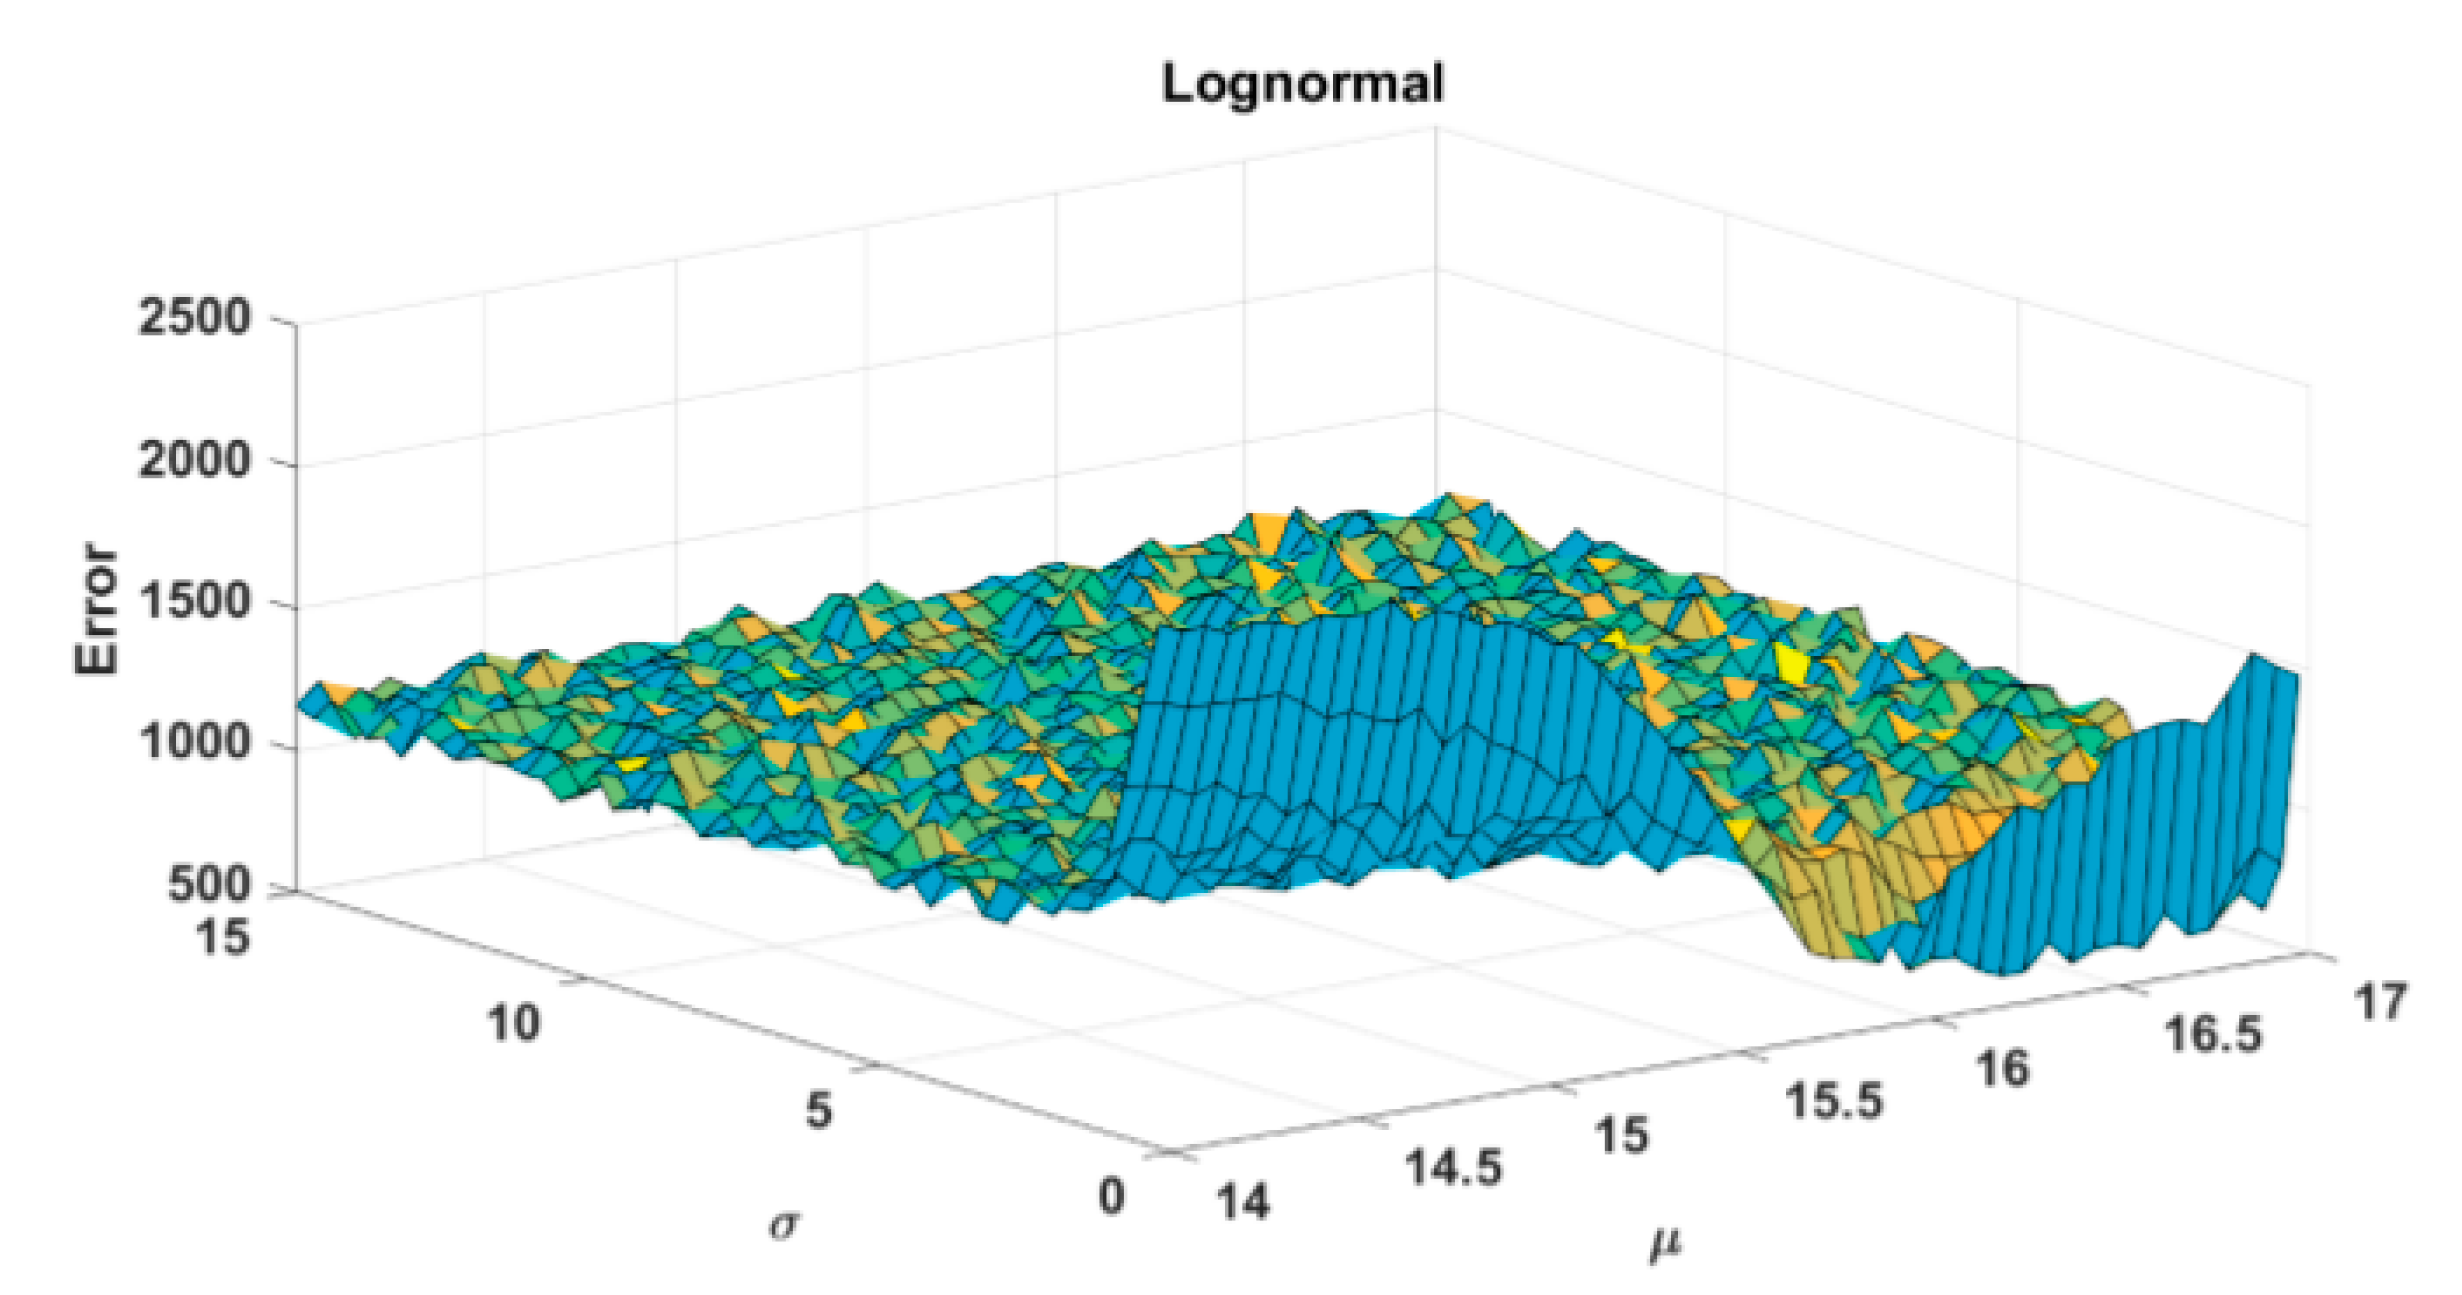
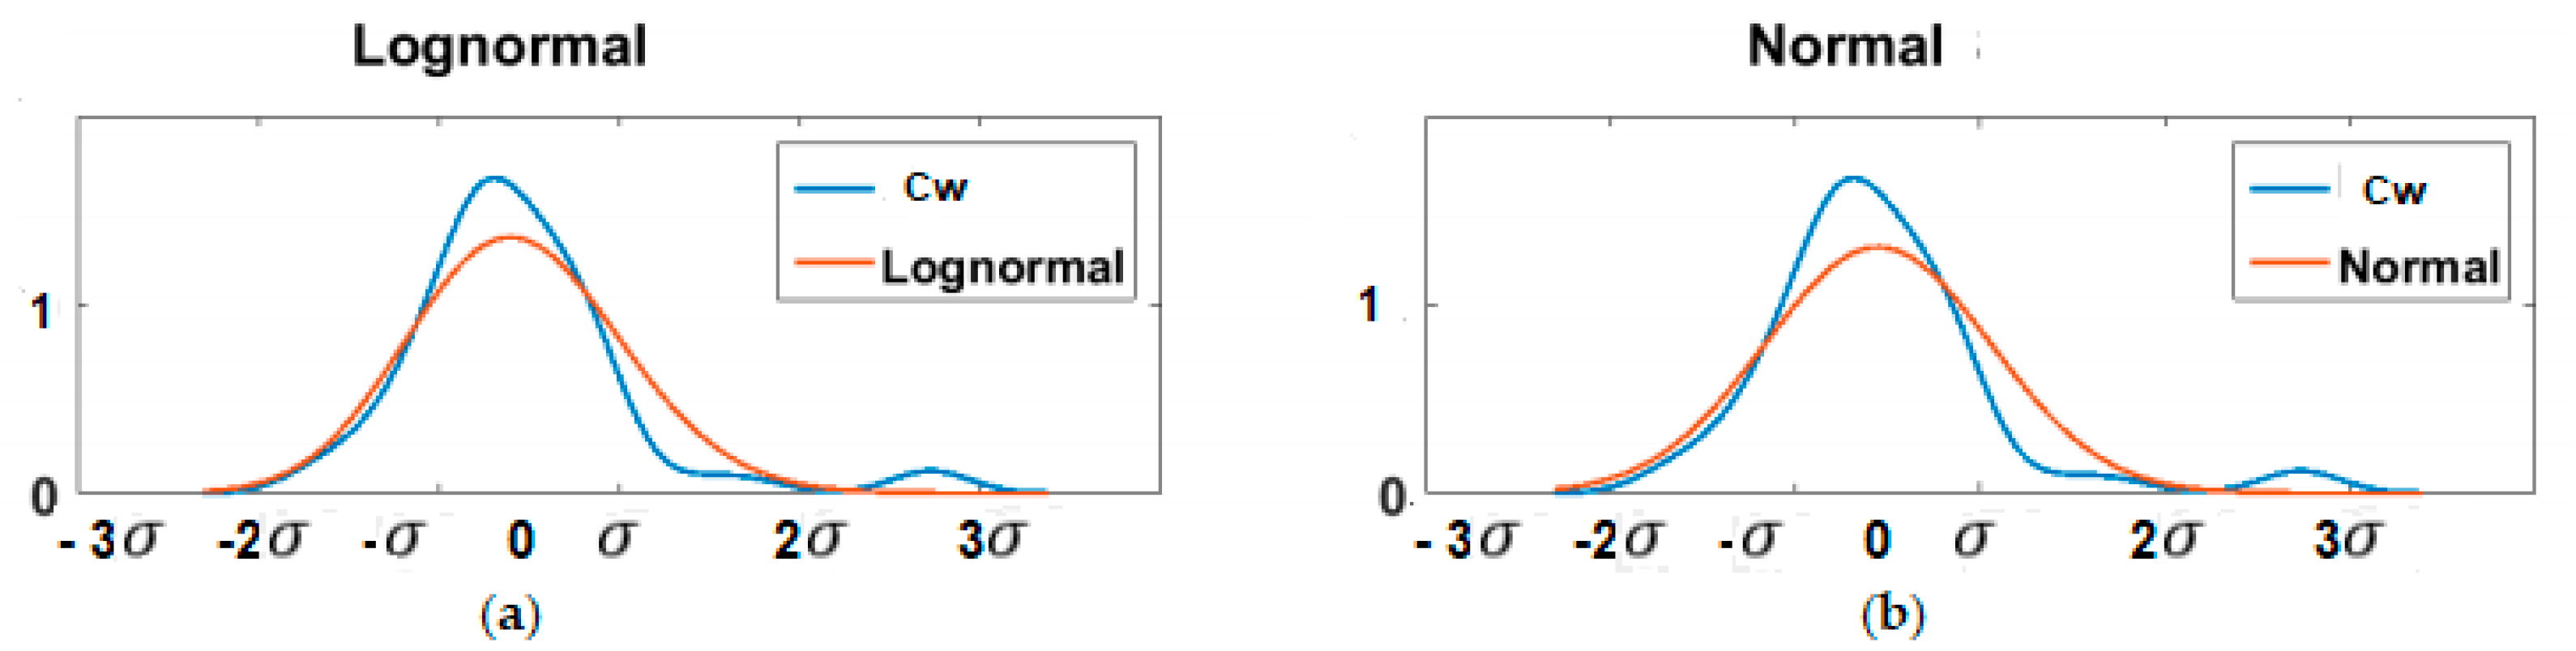
- The experimental data underwent sensitivity analysis, including an uncertainty band, and the methodology was validated. Data from experiments and simulations are compared with the results of other authors.
Author Contributions
Funding
Institutional Review Board Statement
Informed Consent Statement
Data Availability Statement
Conflicts of Interest
Nomenclature
| HF is the height of the furnace HF, m; |
| D1 and D2 are the diameters of the coaxial cylinders of the coils, m; |
| k is the heat transfer coefficient, W/(m2·K); |
| is the beam thermal efficiency coefficient; |
| and are the heat transfer coefficients by convection and radiation, W/(m2·K); |
| Tc.a. and Th.a. are the temperature of cold and hot air, K; |
| is fuel consumption, kg/s; |
| is steam capacity, kg/s; |
| is the enthalpy of steam and feed water, MJ/kg; |
| is net calorific value of fuel, MJ; |
| is boiler efficiency, %; |
| is the temperature difference, ; |
| is characteristic temperature of the gas-air flow, ; |
| is the average temperature of the furnace wall, . |
| is the internal surface area of the furnace, m2. |
| is the air temperature, ; |
| is the temperature correction; |
| is the gas temperature, . |
| is the heat loss with exhaust gases, %; |
| is the correction for deviation of cold air temperature; |
| is the change in values when heating air in the air heater by ; |
| is the sum of the products of the correction factors for the deviation of the initial parameter by ∆m, nominal or calculated. |
| is the cold air temperature, calculated, °C; |
| is the cold air temperature, experimental value, °C; |
| is the flue gas temperature, °C; |
| is the air temperature after the air heater, calculated, °C; |
| is the air temperature after the air heater, experimental value, °C. |
| is the correction factor; |
| is the temperature correction, which summarizes the correction factors used in deviations for the cold air temperature and after the air heater; |
| is the heat flux, which increases the convective component of radiant-convective heat exchange in gas ducts, W. |
References
- Arnfield, A.J. Köppen Climate Classification; Encyclopædia Britannica, Inc.: Chicago, IL, USA, 2020; Available online: https://www.britannica.com/science/Koppen-climateclassification (accessed on 11 December 2020).
- Chen, D.; Chen, H.W. Using the Köppen classification to quantify climate variation and change: An example for 1901–2010. Environ. Dev. 2013, 6, 69–79. [Google Scholar] [CrossRef]
- Mazzeo, D.; Matera, N.; De Luca, P.; Baglivo, C.; Congedo, P.M.; Oliveti, G. Worldwide geographical mapping and optimization of stand-alone and grid-connected hybrid renewable system techno-economic performance across Köppen-Geiger climates. Appl. Energy 2020, 276, 115507. [Google Scholar] [CrossRef]
- Bennett, G.J. The Secret Life of Boilers: Dynamic Performance of Residential Gas Boiler Heating Systems—A Modelling and Empirical Study. In Proceedings of the CIBSE Technical Symposium, Sheffield, UK, 25–26 April 2019; pp. 25–26. [Google Scholar]
- Bennett, G.; Elwell, C.; Oreszczyn, T. Space heating operation of combination boilers in the UK: The case for addressing real-world boiler performance. Build. Serv. Eng. Res. Technol. 2019, 40, 75–92. [Google Scholar] [CrossRef]
- Sweetnam, T.; Spataru, C.; Barrett, M.; Carter, E. Domestic demand-side response on district heating networks. Build. Res. Inf. 2018, 47, 330–343. [Google Scholar] [CrossRef]
- Hernández Corona, J.L.; Vázquez, E.M.; Sánchez Lima, H.V.; Fragoso Parra, G.A.; Espinoza Peralta, J.A. Steam Generator for External Resistances. J. Sci. Res. Publ. 2020, 10, 463–469. [Google Scholar] [CrossRef]
- Guidez, J.; Prele, G. The Steam Generators. In Superphenix; Atlantis Press: Paris, France, 2017; p. 130. [Google Scholar]
- Sharma, A.; Sharma, M.; Shukla, A.K.; Negi, N. Evaluation of Heat Recovery Steam Generator for Gas/Steam Combined Cycle Power Plants. In Advances in Fluid and Thermal Engineering; Lecture Notes in Mechanical Engineering; Saha, P., Subbarao, P., Sikarwar, B., Eds.; Springer: Singapore, 2019. [Google Scholar] [CrossRef]
- Astorga-Zaragoza, C.-M.; Osorio-Gordillo, G.-L.; Reyes-Martínez, J.; Madrigal-Espinosa, G.; Chadli, M. Takagi—Sugeno Observers as an Alternative to Nonlinear Observers for Analytical Redundancy. Application to a Steam Generator of a Thermal Power Plant. Int. J. Fuzzy Syst. 2018, 20, 1756–1766. [Google Scholar] [CrossRef]
- Silva, P.R.S.; Leiroz, A.J.K.; Cruz, M.E.C. Evaluation of the efficiency of a heat recovery steam generator via computational simulations of off-design operation. J. Braz. Soc. Mech. Sci. Eng. 2020, 42, 1–18. [Google Scholar] [CrossRef]
- Cheridi, A.L.D.; Loubar, A.; Dadda, A.; Bouam, A. Modeling and simulation of a natural circulation water-tube steam boiler. SN Appl. Sci. 2019, 1, 1405. [Google Scholar] [CrossRef]
- Moghari, M.; Hosseini, S.; Shokouhmand, H.; Sharifi, H.; Izadpanah, S. A numerical study on thermal behavior of a D-type water-cooled steam boiler. Appl. Therm. Eng. 2012, 37, 360–372. [Google Scholar] [CrossRef]
- Sunil, P.U.; Barve, J.; Nataraj, P.S.V. Mathematical modeling, simulation and validation of a boiler drum: Some investigations. Energy 2017, 126, 312–325. [Google Scholar] [CrossRef]
- Hag, E.E.; Rahman, T.U.; Ahad, A.; Ali, F.; Ijaz, M. Modeling and simulation of an industrial steam boiler. Int. J. Comput. Eng. Inf. Technol. 2016, 8, 7–10. [Google Scholar]
- Backi, C.J. Nonlinear modeling and control for an evaporator unit. Control Eng. Pract. 2018, 78, 24–34. [Google Scholar] [CrossRef]
- Bruce-Konuah, A.; Jones, R.V.; Fuertes, A.; De Wilde, P. Central heating settings in low energy social housing in the United Kingdom. Energy Procedia 2019, 158, 3399–3404. [Google Scholar] [CrossRef]
- Dixon, D.; Nguyen, A. An Empirical Oil, Steam, and Produced-Water Forecasting Model for Steam-Assisted Gravity Drainage with Linear Steam-Chamber Geometry. SPE Reserv. Evaluation Eng. 2019, 22, 1615–1629. [Google Scholar] [CrossRef]
- Kusumastuti, I.; Erfando, T.; Hidayat, F. Effects of Various Steam Flooding Injection Patterns and Steam Quality to Recovery Factor. J. Earth Energy Eng. 2019, 8, 33–39. [Google Scholar] [CrossRef]
- Badur, J.; Bryk, M. Accelerated start-up of the steam turbine by means of controlled cooling steam injection. Energy 2019, 173, 1242–1255. [Google Scholar] [CrossRef]
- Duarte, C.A.; Espejo, E.; Martinez, J.C. Failure analysis of the wall tubes of a water-tube boiler. Eng. Fail. Anal. 2017, 79, 704–713. [Google Scholar] [CrossRef]
- Chauhan, S.S.; Khanam, S. Energy integration in boiler section of thermal power plant. J. Clean. Prod. 2018, 202, 601–615. [Google Scholar] [CrossRef]
- Shi, Y.; Wang, J. Ash fouling monitoring and key variables analysis for coal fired power plant boiler. Therm. Sci. 2015, 19, 253–265. [Google Scholar] [CrossRef]
- Kuznetsov, N.V. Direct-flow two-stage steam generator: Pat. RU89623U1. Ros. Federation No. 2009130968/22. In Thermal Calculation of Boiler Units: Standard Method; Kuznetsov, N.V., Mitor, V.V., Dubrovsky, I.E., Eds.; EKOLIT: Moscow, Russia, 2011; 296p. (In Russian) [Google Scholar]
- Lummi, A.P. Calculation of a Hot Water Boiler; Lummi, A.P., Munts, V.A., Eds.; GOU VPO USTU-UPI: Yekaterinburg, Russia, 2009; 41p. (In Russian) [Google Scholar]
- Sidelkovsky, L.N. Boiler Plants for Industrial Enterprises. Textbook for Universities in the Specialty "Industrial Heat Power", 4th ed.; Sidelkovsky, L.N., Yurenev, V.N., Eds.; Moscow Bastet: Moscow, Russia, 2009; 526p. (In Russian) [Google Scholar]
- Trembovlya, V.I. Heat Engineering Tests of Boiler Plants, 2nd ed.; Trembovlya, V.I., Finger, E.D., Avdeeva, A.A., Eds.; Energoatomizdat: Moscow, Russia, 1991; 416p. (In Russian) [Google Scholar]
- Zykov, A.K. Steam and Hot Water Boilers: Reference Book, 2nd ed.; Zykov, A.K., Ed.; NPOOBT: Moscow, Russia, 1995; 119p. (In Russian) [Google Scholar]
- Lipov, Y.M. Layout and Thermal Calculation of a Steam Boiler: Textbook for Universities; Lipov, Y.M., Samoilov, Y.F., Vilensky, T.V., Eds.; Energoatomizdat: Moscow, Russia, 1988; 208p. (In Russian) [Google Scholar]
- Pustylnik, E.I. Statistical Methods of Analysis and Processing of Observations; Nauka: Moscow, Russia, 1968; 288p. [Google Scholar]
- Osintsev, K.V.; Osintsev, V.V.; Bogatkin, V.I.; Toropov, E.V.; Kuskarbekova, S.I. Liquid Electric Heater. Patent 2694890, 18 July 2019. [Google Scholar]
- Toropov, E.V.; Osintsev, K.V.; Aliukov, S.V. Analysis of the calculated and experimental dependencies of the combustion of coal dust on the basis of a new methodological base of theoretical studies of heat exchange processes. Int. J. Heat Technol. 2018, 36, 1240–1248. [Google Scholar] [CrossRef]
- Toropov, E.; Osintsev, K.; Aliukov, S. New Theoretical and Methodological Approaches to the Study of Heat Transfer in Coal Dust Combustion. Energies 2019, 12, 136. [Google Scholar] [CrossRef]
- Alabugin, A.; Aliukov, S.; Osintsev, K. Combined Approach to Analysis and Regulation of Thermodynamic Processes in the Energy Technology Complex. Process 2021, 9, 204. [Google Scholar] [CrossRef]
- Osintsev, K.; Aliukov, S.; Prikhodko, Y. New Methods for Control System Signal Sampling in Neural Networks of Power Facilities. IEEE Access 2020, 8, 1. [Google Scholar] [CrossRef]
- Mikhaylenko, E.V. How to improve the characteristics of mobile generators. Chief Power Eng. 2015, 5–6, 65–71. (In Russian) [Google Scholar]
- Hameed, V.; Fatima, J.H. Investigation study of vertical helical coil heat exchanger. In Proceedings of the 2nd International Conference on Materials Engineering & Science, Baghdad, Iraq, 25–26 September 2020; Volume 2213. [Google Scholar]
- Boje, E. Dry-out point estimation in once through boilers. IFAC Proc. Vol. 2009, 42, 723–728. [Google Scholar] [CrossRef]
- Trojan, M. Modeling of a steam boiler operation using the boiler nonlinear mathematical model. Energy 2019, 175, 1194–1208. [Google Scholar]
- Orlov, K.A. Program complex “WaterSteamPro” for calculating the thermophysical properties of water and water vapor. In Proceedings of the X Russian Conference on Thermophysical Properties of Substances: Abstracts of Reports, Moscow, Russia, 15–19 October 2018; Orlov, K.A., Alexandrov, A.A., Ochkov, V.F., Ochkov, A.V., Eds.; Publishing House “Butlerov Communications”: Kazan, Russia, 2002; pp. 187–188. (In Russian). [Google Scholar]


| Parameter | 0.70·Dnom | 0.85 Dnom | 1.00 Dnom |
|---|---|---|---|
| Lf, meters | 1.32 | 1.78 | 2.33 |
| T, Kelvins | 1648 | 1693 | 1721 |
| № | Temperature, °C | Speed (Experiment), m/s | Speed (Model), m/s |
|---|---|---|---|
| 1 | 115 | 4.16 | 4.17 |
| 2 | 117 | 4.13 | 4.14 |
| 3 | 119 | 4.08 | 4.10 |
| Experiment | Measurements | Water Consumption | Water Temperature | Fuel Consumption | Steam Temperature after the Boiler | Steam Pressure after the Boiler |
|---|---|---|---|---|---|---|
| No. | No. | kg/s | °C | kg/s | °C | MPa |
| 1 | 1 | 0.30944 | 44 | 0.01526 | 151 | 0.36 |
| 2 | 0.33167 | 44 | 0.01517 | 151 | 0.36 | |
| 3 | 0.33361 | 44 | 0.01431 | 149 | 0.35 | |
| 4 | 0.34917 | 46 | 0.01558 | 151 | 0.36 |
| Experiment | Measurements | Water Consumption | Water Temperature | Fuel Consumption | Steam Temperature after the Boiler | Steam Pressure after the Boiler |
|---|---|---|---|---|---|---|
| No. | No. | kg/s | °C | kg/s | °C | MPa |
| 2 | 1 | 0.37444 | 31 | 0.01866 | 159 | 0.49 |
| 2 | 0.42389 | 26 | 0.01900 | 160 | 0.50 | |
| 3 | 0.43167 | 32 | 0.01873 | 159 | 0.49 | |
| 4 | 0.45750 | 32 | 0.01883 | 159 | 0.49 |
| Experiment | Measurements | Water Consumption | Water Temperature | Fuel Consumption | Steam Temperature after the Boiler | Steam Pressure after the Boiler |
|---|---|---|---|---|---|---|
| No. | No. | kg/s | °C | kg/s | °C | MPa |
| 1 | 1 | 0.34278 | 45 | 0.01461 | 148 | 0.33 |
| 2 | 0.34028 | 45 | 0.01449 | 156 | 0.43 | |
| 3 | 0.40194 | 53 | 0.01455 | 161 | 0.51 | |
| 4 | 0.35167 | 55 | 0.01487 | 160 | 0.49 | |
| 2 | 1 | 0.38083 | 45 | 0.01983 | 152 | 0.36 |
| 2 | 0.37167 | 45 | 0.01978 | 156 | 0.43 | |
| 3 | 0.33417 | 53 | 0.01988 | 160 | 0.49 | |
| 4 | 0.35611 | 55 | 0.01990 | 161 | 0.52 |
| With the Coldest Five Days, °C | At the Average Temperature of the Coldest Month, °C | At the Air Temperature t = +8 °C | |
|---|---|---|---|
| , C | −40 | −25 | +8 |
| , C | +27 | +58 | +65 |
| 1.029 | 1.026 | 1.032 |
| Parameter | Speed (Experiment), m/s | Speed (Model), m/s | Speed (Experiment), m/s [40] | Speed (Model), m/s [40] |
|---|---|---|---|---|
| temperature of 120 °C | 4.06 | 4.08 | 4.07 | 4.06 |
Publisher’s Note: MDPI stays neutral with regard to jurisdictional claims in published maps and institutional affiliations. |
© 2021 by the authors. Licensee MDPI, Basel, Switzerland. This article is an open access article distributed under the terms and conditions of the Creative Commons Attribution (CC BY) license (http://creativecommons.org/licenses/by/4.0/).
Share and Cite
Osintsev, K.; Aliukov, S.; Kuskarbekova, S. Experimental Study of a Coil Type Steam Boiler Operated on an Oil Field in the Subarctic Continental Climate. Energies 2021, 14, 1004. https://doi.org/10.3390/en14041004
Osintsev K, Aliukov S, Kuskarbekova S. Experimental Study of a Coil Type Steam Boiler Operated on an Oil Field in the Subarctic Continental Climate. Energies. 2021; 14(4):1004. https://doi.org/10.3390/en14041004
Chicago/Turabian StyleOsintsev, Konstantin, Sergei Aliukov, and Sulpan Kuskarbekova. 2021. "Experimental Study of a Coil Type Steam Boiler Operated on an Oil Field in the Subarctic Continental Climate" Energies 14, no. 4: 1004. https://doi.org/10.3390/en14041004
APA StyleOsintsev, K., Aliukov, S., & Kuskarbekova, S. (2021). Experimental Study of a Coil Type Steam Boiler Operated on an Oil Field in the Subarctic Continental Climate. Energies, 14(4), 1004. https://doi.org/10.3390/en14041004