Article

A Simplified Method for Modeling of Pressure Losses and Heat Transfer in Fixed-Bed Reactors with Low Tube-to-Particle Diameter Ratio

by
Tymoteusz Świeboda
1,
Renata Krzyżyńska
1,*,
Anna Bryszewska-Mazurek
1,
Wojciech Mazurek
1 and
Alicja Wysocka
2
1
Faculty of Environmental Engineering, Wroclaw University of Science and Technology, 50-370 Wroclaw, Poland
2
Nobo Solutions S.A., 8a Stargardzka St., 54-156 Wroclaw, Poland
*
Author to whom correspondence should be addressed.
Energies 2021, 14(3), 784; https://doi.org/10.3390/en14030784
Submission received: 18 January 2021 / Revised: 27 January 2021 / Accepted: 28 January 2021 / Published: 2 February 2021
(This article belongs to the Special Issue Turbulence and Fluid Mechanics)

Abstract

:
This manuscript presents a simplified method of modeling fixed-bed reactors based on the porous medium. The proposed method primarily allows the necessity of precisely mapping the internal structure of the bed—which usually is done using real object imaging techniques (like X-ray tomography) or numerical methods (like discrete element method (DEM))—to be avoided. As a result, problems with generating a good quality numerical mesh at the particles’ contact points using special techniques, such as by flattening spheres or the caps method, are also eliminated. The simplified method presented in the manuscript is based on the porous medium method. Preliminary research has shown that the porous medium method needs modifications. This is because of channeling, wall effects, and local backflows, which are substantial factors in reactors with small values of tube-to-particle-diameter ratio. The anisotropic thermal conductivity coefficient was introduced to properly reproduce heat transfer in the direction perpendicular to the general fluid flow. Since the commonly used fixed-bed reactor models validation method based on comparing the velocity and temperature profiles in the selected bed cross-section is not justified in the case of the porous medium method, an alternative method was proposed. The validation method used in this work is based on the mass-weighted average temperature increase and area-weighted average pressure drop between two control cross-section of the reactor. Thanks to the use of the described method, it is possible to obtain satisfactorily accurate results of the fixed-bed reactor model with no cumbersome mesh preparation and long-term calculations.

1. Introduction

For many years, phenomena occurring in fixed-bed reactors have been the subject of unabated interest. They are used in a wide range of technological processes, such as separation, purification, and chemical reactions. Among them, a special place is occupied by the devices with a low tube-to-particle diameter ratio (N < 10). It should be noted that in actual reactors of this type, slight particle displacements may occur during the fluid flow, but the models do not take them into account nor the phenomena that may be caused by these displacements.
With the development of computational techniques and numerical simulation methods, the approach to the modeling of phenomena occurring in such reactors has been changing [1,2]. An approach comprising of several stages has been used in several studies and seems to set the working standard.
The first stage is the determination of an appropriate three-dimensional structure of bed geometry. It can be done experimentally, using non-invasive real object imaging techniques like magnetic resonance or X-ray computer tomography [3]. Alternatively, a numerical method can be applied, with the most common being Monte-Carlo [4,5] and the discrete element method (DEM) [6]. Both should mimic the reactor volume randomly filled with particles of a certain diameter. Numerically generated geometry has an advantage over the experimental method because it allows the precise determination of the number and location of particle-particle and particle-wall contact points, which may be relevant in the following stage.
The second stage involves the creation of a computational mesh, which means dividing the volume of the fluid and each individual bed element into small control volumes. Because of the complicated shape of the computational domain, non-structural meshes are commonly used (in most cases based on tetrahedrons, e.g., [7,8], and sometimes polyhedrons). In a few cases [9,10] where the bed consists of a small number of elements, prism layers are introduced at the interface between the solid and the fluid.
The main issue with the creation of a computational mesh is the treatment of regions near contact points. There, the surfaces of spheres force the creation of cells with very small angles and high skewness. Low-quality mesh elements make it difficult to achieve convergence and reduce the accuracy of the results.
There are several methods that have been developed as an attempt to solve this issue [8,11]. The first method is to scale each individual particle while preserving the coordinates of its center. Scaling may be done with a factor below unity (usually about 99% of the particle’s original size) [9,12] or greater than unity [13,14]. In the first case, the gaps are introduced between contacting surfaces; in the second case, contacting spheres are joined, and inconvenient regions are eliminated by overlapping themselves. Both variants have the same disadvantages: they impact fluid pressure drop and heat exchange between particles. Additionally, magnification of particles, apart from closing original contact points, may cause the occurrence of new ones within the computational domain.
There are similar methods that modify the geometry not in the entire volume, but only locally—at the points of contact of particles. The caps method consists of flattening the surfaces of adjacent spheres at the point of contact [10,15]. In this case, the influence on the flow resistance is smaller, however, the heat transfer between the particles is still disturbed. The solution is to introduce bridges—additional material formed as a cylinder and placed coaxially with the line joining adjacent spheres [16,17]. This makes it possible to simulate the heat flow with a minimally disturbed fluid flow.
A detailed comparative analysis of the various methods of improving the quality of the numerical grid [11] showed that each of the aforementioned methods has significant drawbacks. In general, methods in which the diameter of the bed particles is modified globally generate relatively large errors in the calculation of pressure losses and heat transfer. The authors gave a rough estimate that when changing the diameter of the spheres, changing the fluid volume by 1% causes an error in the calculated pressure drop of about 3%. As a result, the final errors in determining the pressure drop are in the range of 12–15% [11].
In the case of the local methods, these estimates look more promising. The caps method changes the fluid volume in the reactor by less than 0.05%, which results in negligible errors in the calculated pressure drop. The bridge method, with the radius of the bridges being about one-tenth of the diameter of the spheres, reduces the volume of the fluid by about 0.3%, which entails the pressure drop error at an acceptable level of 1% [11]. However, the local methods cause the use of very fine computational meshes and due to high computational costs are impractical to use for reactors consisting of many spheres or for practical routine design of fixed-bed reactors.
Often, when modeling fixed-bed reactors, detailed modeling of the bed using the recommended methods is not possible. For example, if non-invasive imaging techniques were supposed to be used to create geometry, that would make it difficult or even impossible to modify the computational mesh using the caps or the bridges method. Likewise, when a reactor bed contains too many spheres, modifying the computational mesh across the entire volume may become uneconomic.
In such cases, one should find a less cumbersome or more economical way to create a numerical model. The obvious solution seems to be the use of the porous medium method. However, while pressure drop modeling should not be difficult, the exact mapping of heat transfer may prove challenging, especially in the case of reactors with small values of the tube-to-particle-diameter ratio (N). If there is a small number of spheres in the cross-section of the reactor, the flow becomes heterogeneous and asymmetrical. Channeling, wall effects, local backflows, and significant axial and radial gradients become dominant. In the latter part of the paper, a method of selecting the parameters of a porous medium will be proposed, which allows for the modeling of fixed-bed reactors and a procedure for its verification. In particular, it allows for increased accuracy of heat transfer calculations in models of such reactors.

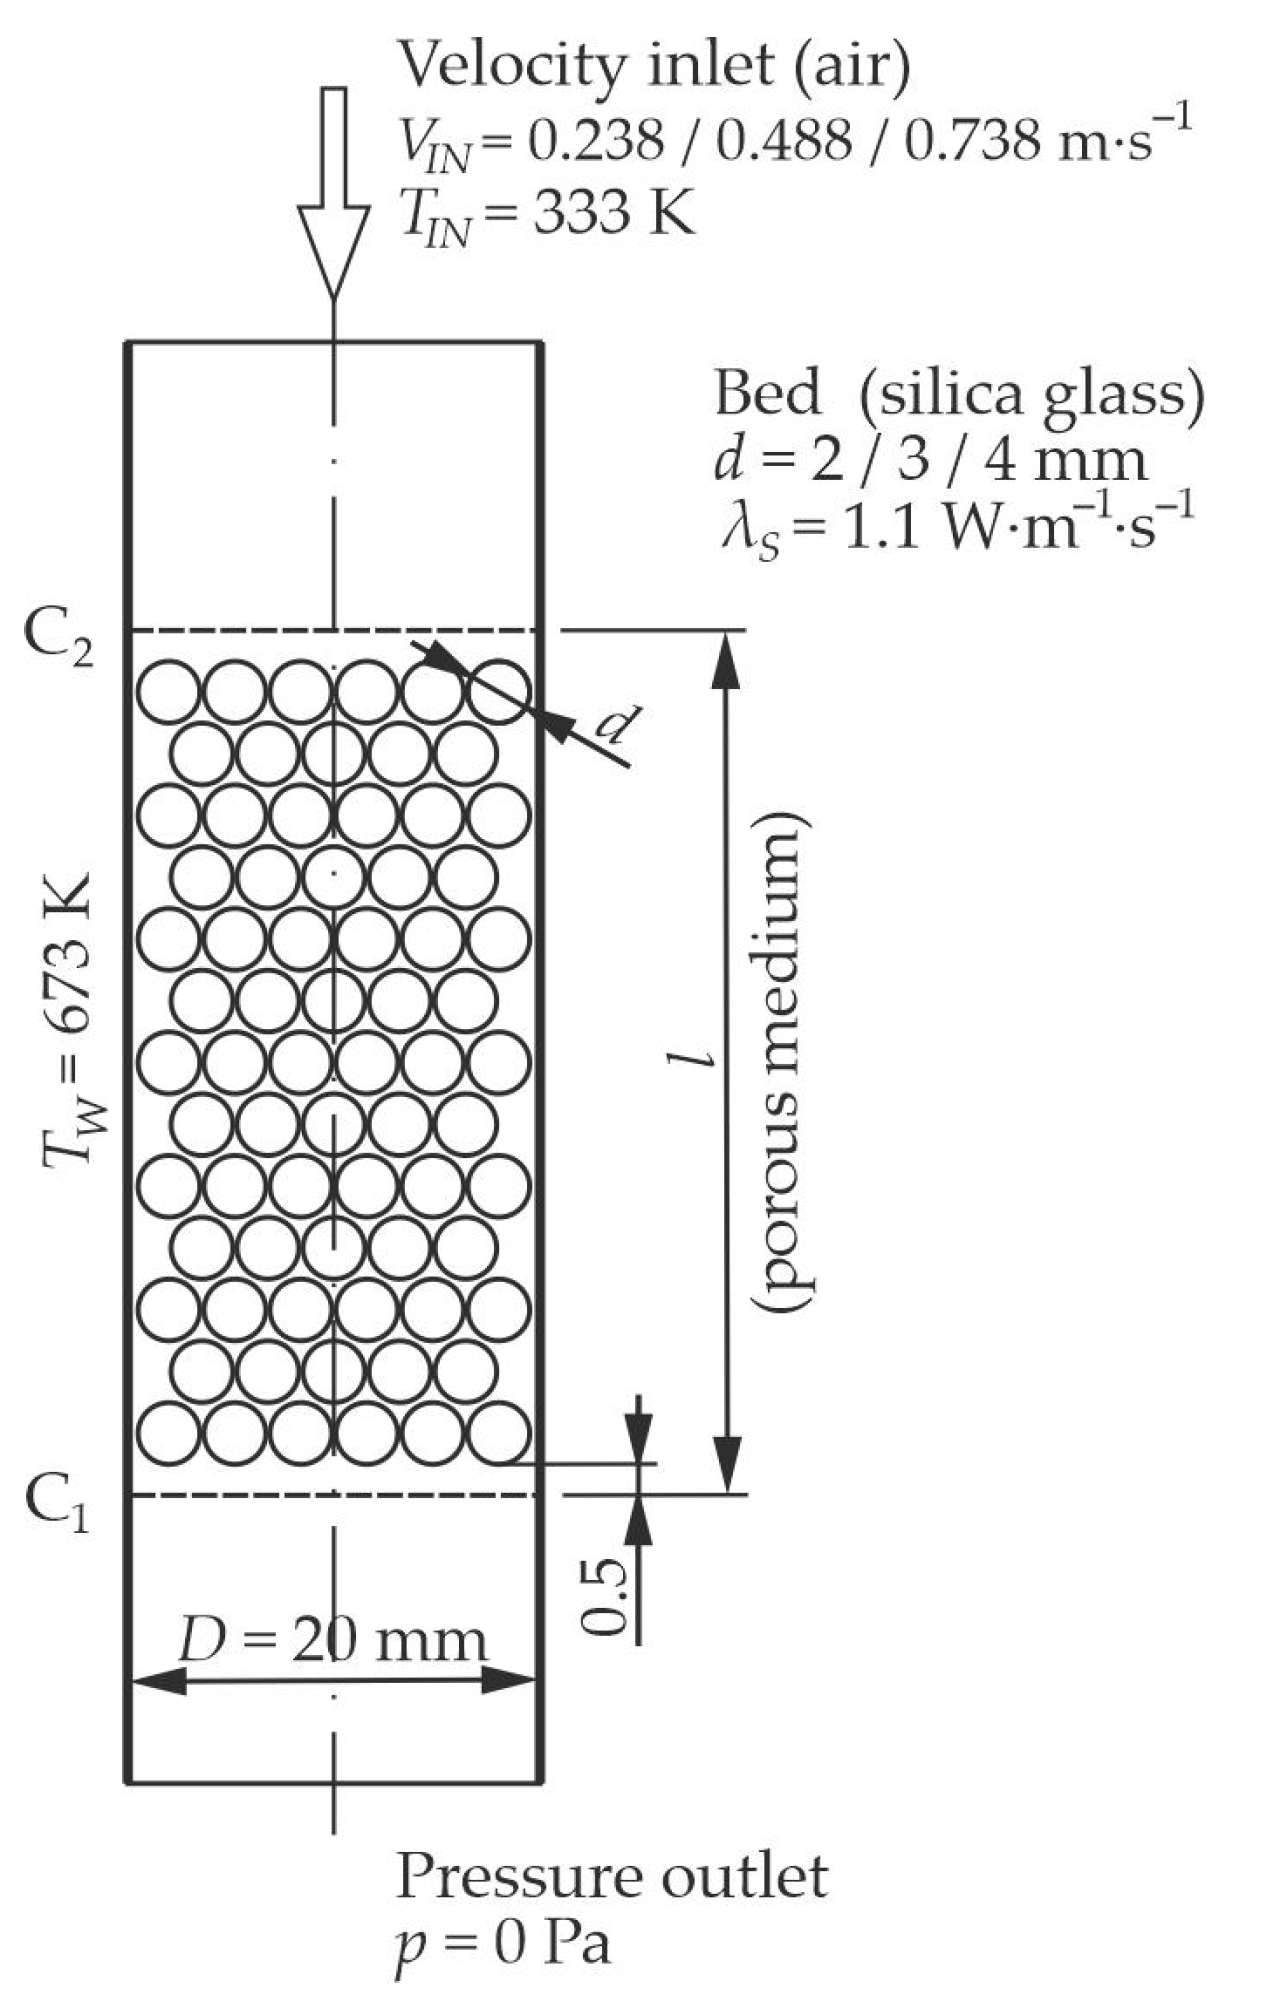
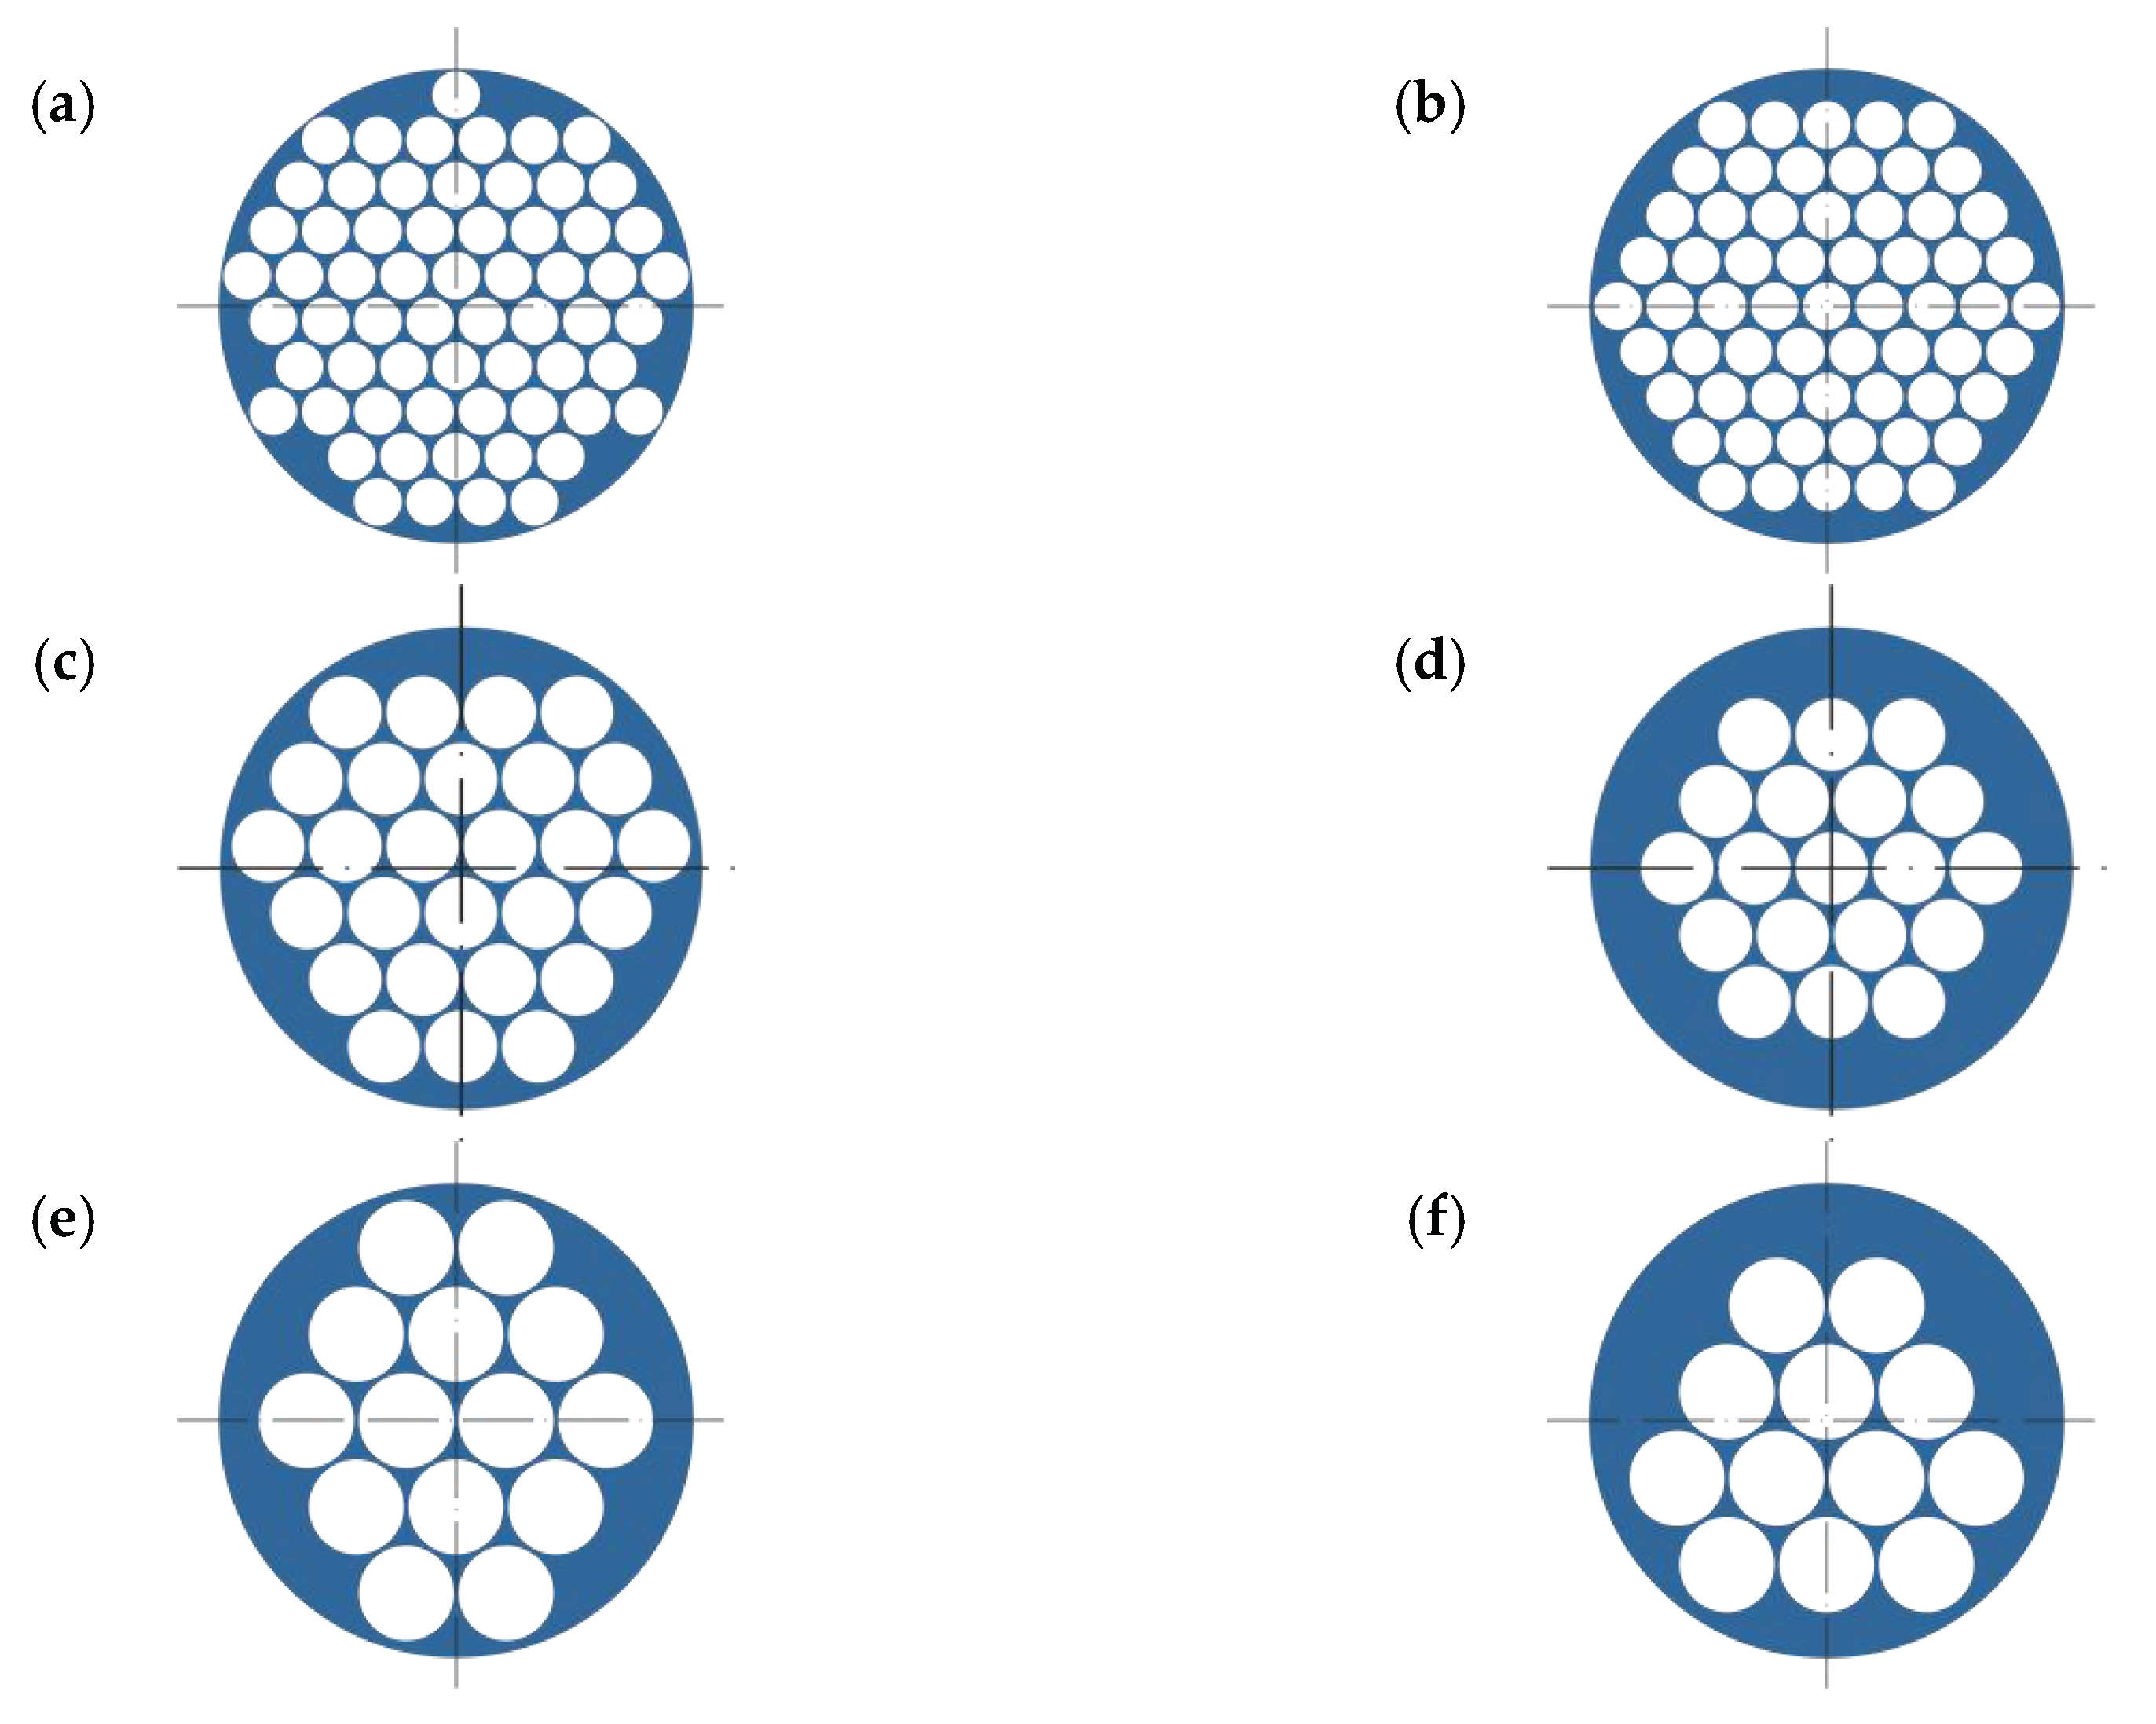
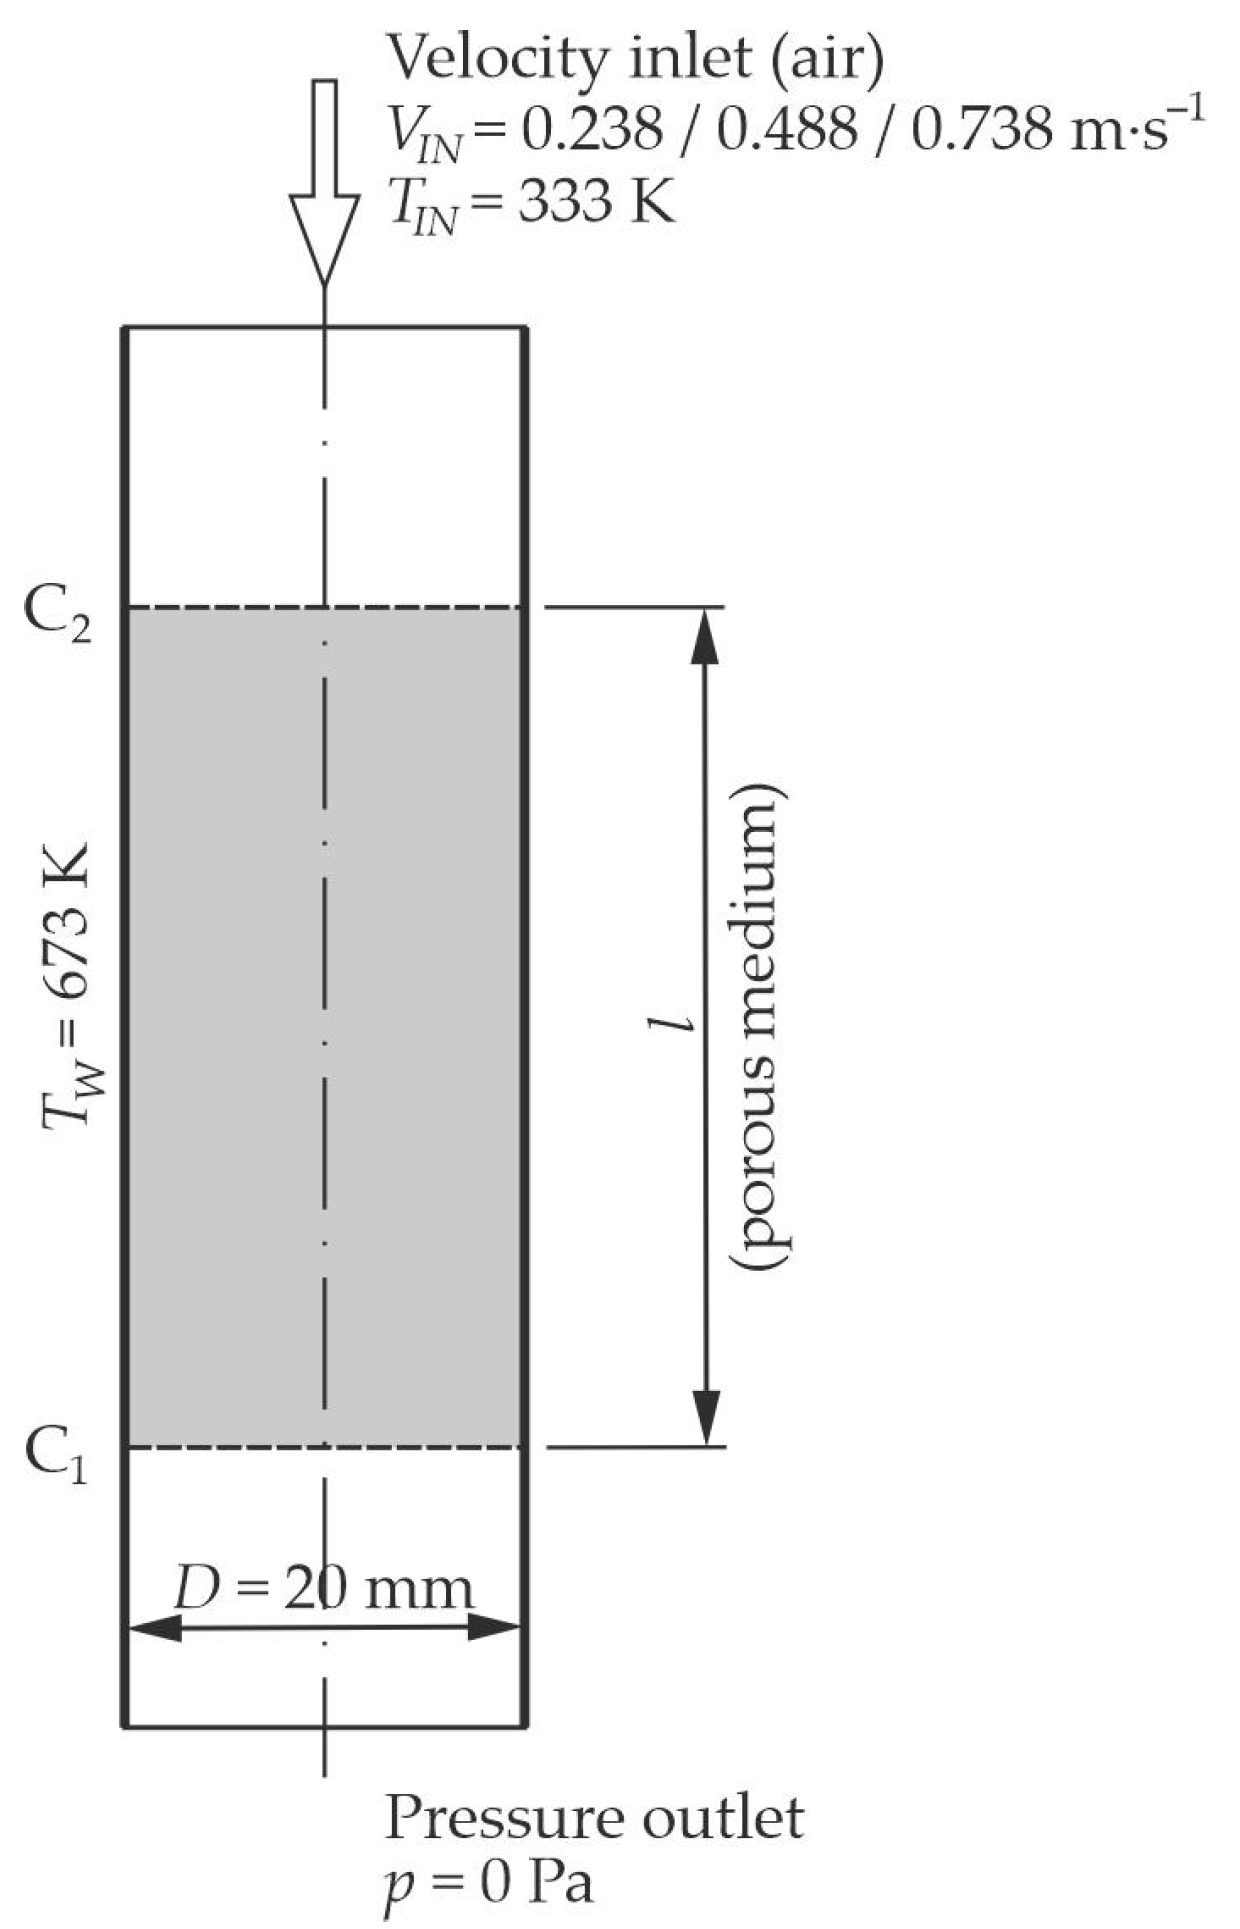
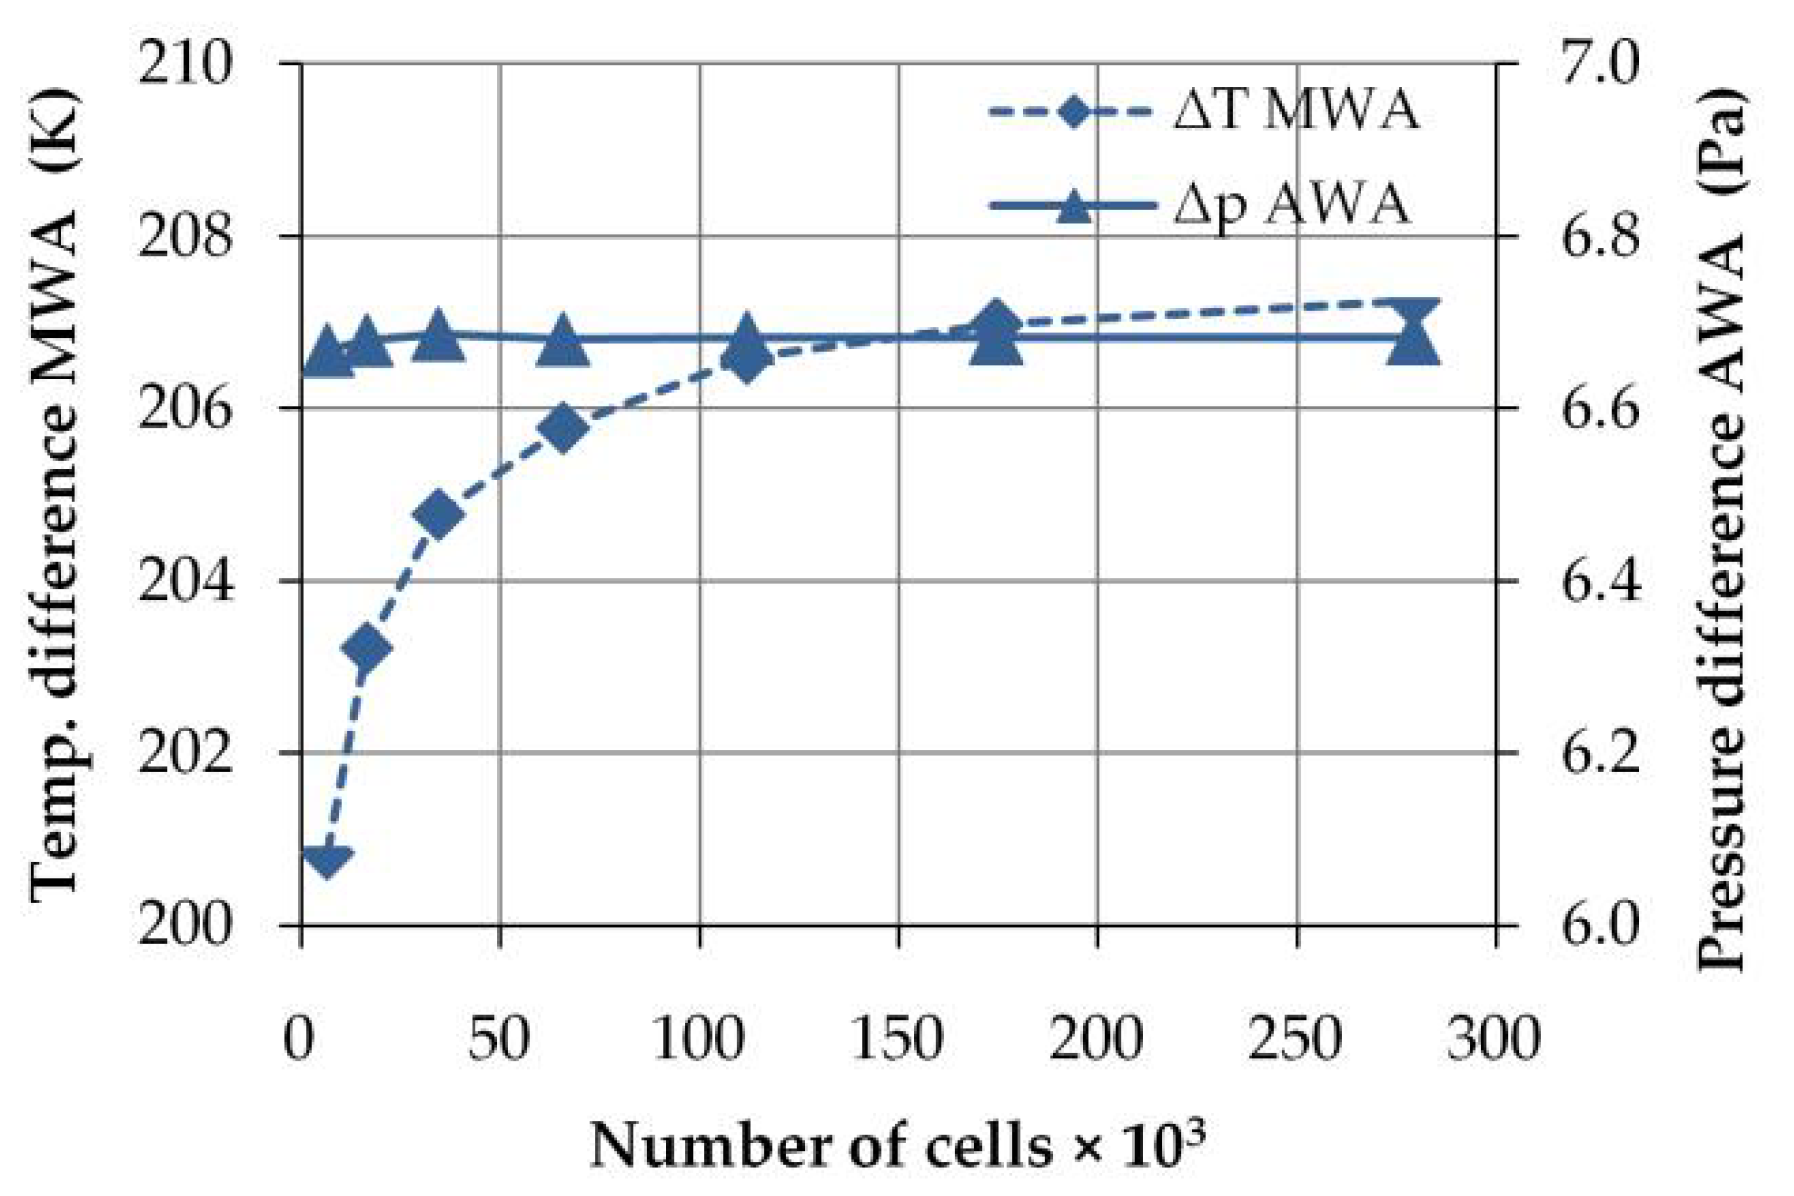
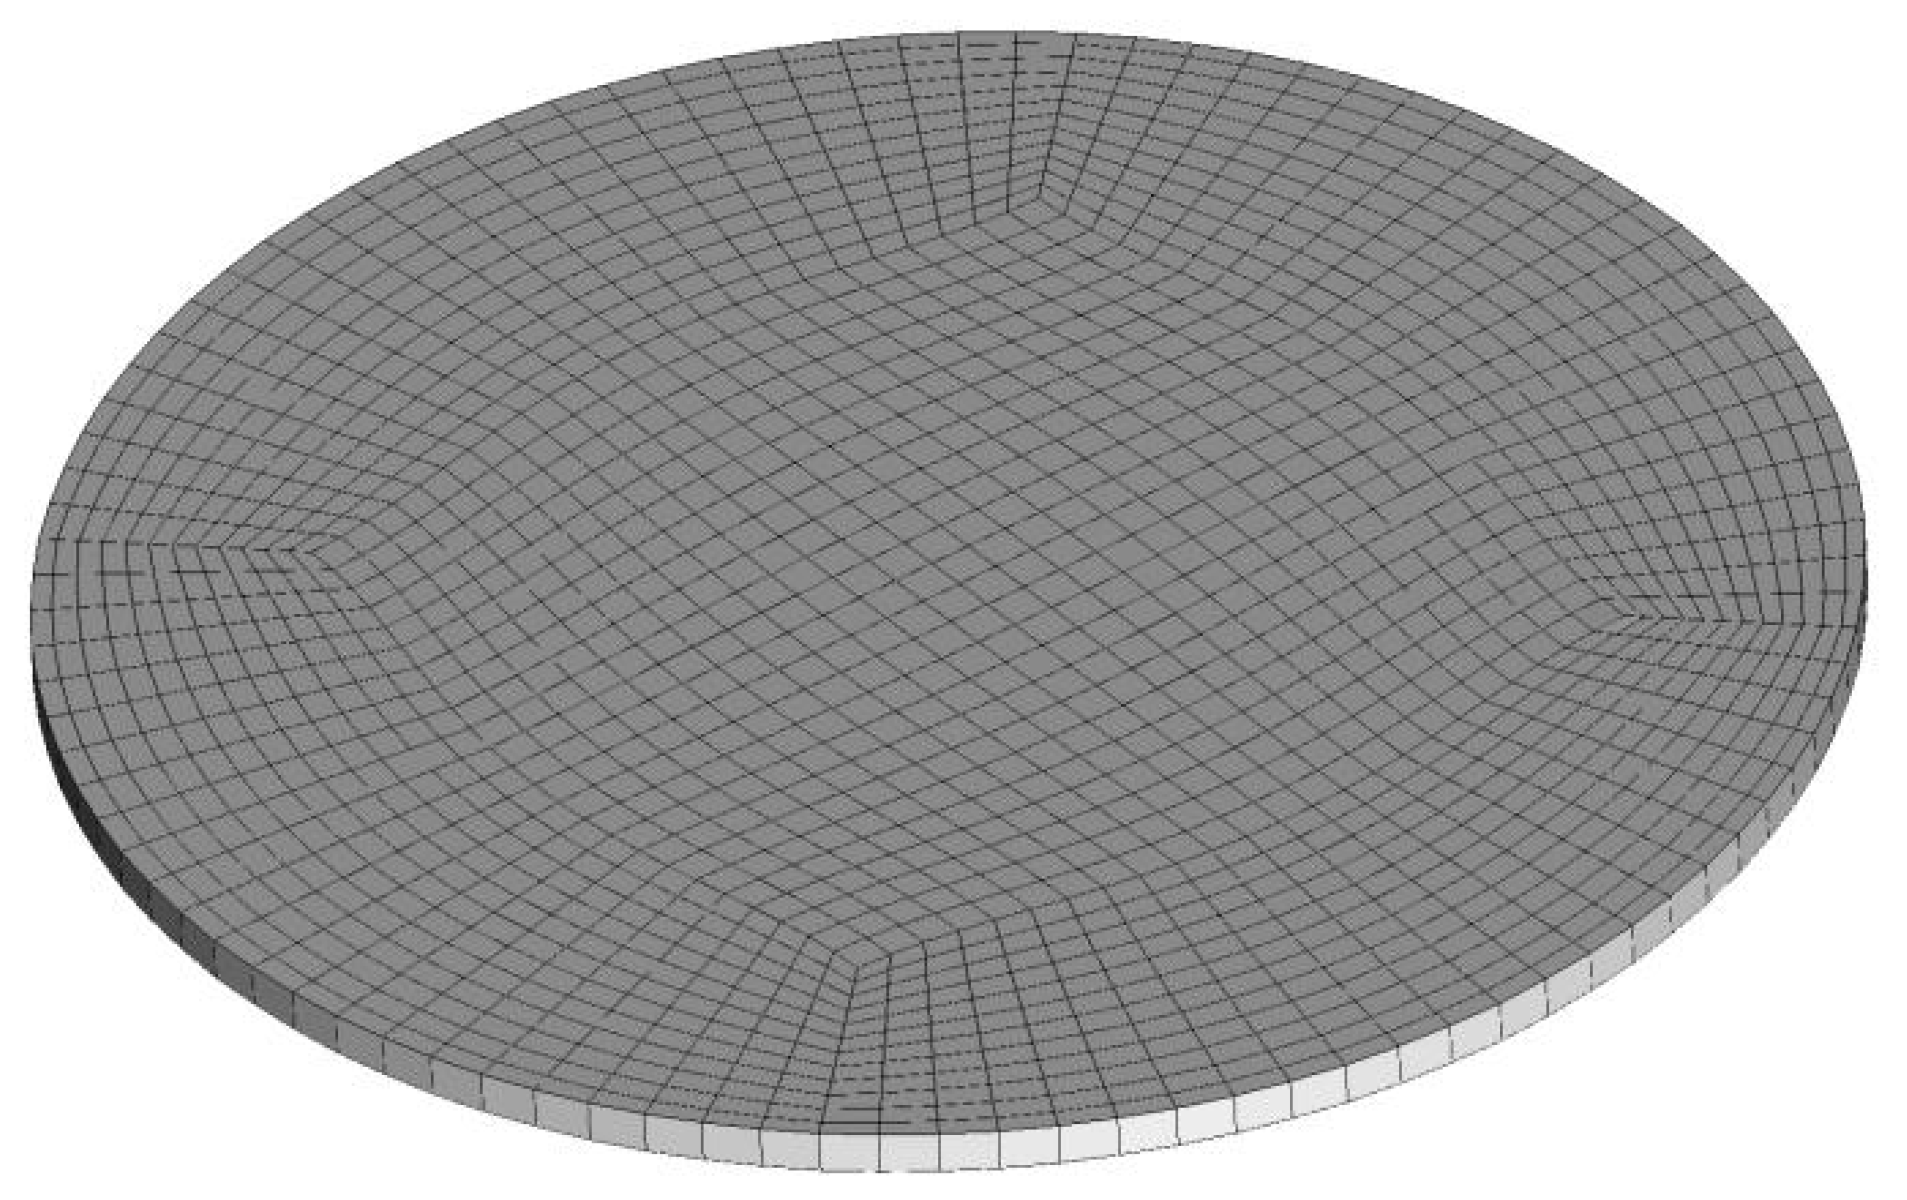
2. Research Object and Methods

The basis for the further procedure was the reactor described in [18], in the shape of a cylinder with a diameter of 20 mm with heated walls at 400 °C and fed from the top with air at 60 °C (the schematic is shown in Figure 1). Glass spheres with a thermal conductivity coefficient of λ = 1.1W·K−1·m−1 were used as the bed filling. Three bed variants consisting of spheres with diameters of 2, 3, and 4 mm were modeled.
In order to emphasize the influence of the phenomena occurring near the reactor walls and the tunneling effect, the spheres in the bed were not arranged randomly, but in a specific order. In the core of the reactor, the spheres were placed on the tops of the tetrahedron, while the vicinity of the reactor walls remained unfilled, with the width of these slots resulting from the total number of balls in the row. To ensure the high quality of the mesh elements, the balls were moved apart by a constant value of 0.2 mm. This way, for each of the three diameters of spheres, three variants of geometry consisting of 5, 9, and 13 layers were built (see Figure 2).
To analyze the results, a comparative criterion had to be defined. Because of the purpose of the research commonly used (e.g., [19]), analysis of the velocity and temperature profiles at chosen sections of a reactor does not seem to be justified. Instead, the area-weighted average (AWA)pressure and the mass-weighted average (MWA) temperature of the fluid across selected cross-sections were chosen as comparison parameters.
A W A ϕ = 1 A ϕ d A = 1 A i = 1 n ϕ i A i
M W A ϕ = ϕ ϱ v · d A ϱ v · d A = i = 1 n ϕ i ϱ i v i · A i i = 1 n ϱ i v i · A i
The cross-sections of the computational domain, which are located 0.5mm in front of the top of the first layer and 0.5 mm behind the bottom of the last layer of spheres in each of the reactors, were accepted as representative (see Figure 1). The pressure drops and air temperature increases calculated in this way were later used to determine the parameters of the porous medium.
For each geometry variant, an unstructured computational mesh (tetra type) was generated and a mesh independence test was performed. In cases where full independence was not achieved, a reasonable cell size/number of mesh elements was chosen (see Figure 3).
The selected basic cell size was the same for the geometry with each sphere size (2, 3, and 4mm) and was 0.5mm. Also, a constant maximum cell size of 0.17mm was set on the surface of spheres—which is less than the minimal distance between adjacent spheres. Areas with a densified computational grid are visible in an exemplary computational domain cross-section in Figure 4.
During the computational process, a set of governing equations is being solved [20]. The continuity equation is as follows:
ρ t + · ρ v = S m
The momentum conservation equation is as follows:
t ϱ v + · ϱ v · v = p + · τ = + ρ g + F
The energy conservation equation is as follows:
t ρ E + · v ρ E + p = · λ eff T j h j J j + τ = eff · v + S h
In the next stage, simplified models based on the porous medium were prepared. The porous medium method is based on the possibility of assigning particular properties to some part of the computational domain, for example, in terms of flow resistance or heat transfer. This allows for the simplification of models in which the complicated geometry of the computational domain makes it difficult to get convergent results. An example is heat exchanger models with a complex heat transfer surface (a large number of tubes).
Using the porous medium method causes changes in the governing equations [20]. First, the momentum conservation equation is expanded by the source term described by Equation (6).
S i = μ α v i + C 2 1 2 ϱ v v i
It is derived from the Forchheimer equation, and its input parameters are 1/α and C2. Their values can be determined by various methods, inter alia, modeling can be based on experimental values of pressure drop against fluid velocity across the porous zone. In such a case, parameters are calculated using coefficients of the trend line quadric equation Δp = f(v).
Further, in the energy conservation equation, the effective thermal conductivity coefficient is calculated as a weighted average of the fluid and solid conductivity coefficients (Equation (7)) [20].
λ eff = γ λ f + 1 γ λ s
A set of geometries of simplified reactor models was created, in which a porous medium was used instead of the complex structure of the fixed bed. In simplified geometries, the length of the bed was assumed to be equal to the distance between the control sections in the original reactor for a given diameter of beads and number of layers, whereas the diameter remained constant for each variant. Details are shown in Figure 5.
In the simplified model case, an O-type structured mesh was used. A satisfactory level of mesh independence of the results was obtained, with the number of elements slightly below 175 × 103 (in the case of the reactor model containing nine layers of 3-mm diameter balls–see Figure 6). In this case, the linear dimension of the cells was approximately 0.5mm. The same cross-sectional mesh density was used for all variants of the porous medium model (see Figure 7).
All simulations (including the mesh independence tests) were performed using the commercial ANSYS Fluent 18 software (ANSYS Inc., Canonsburg, PA, USA). The realizable k turbulence model was selected, and the boundary conditions were set as shown in Figure 1 and Figure 5.

3. Results and Discussion

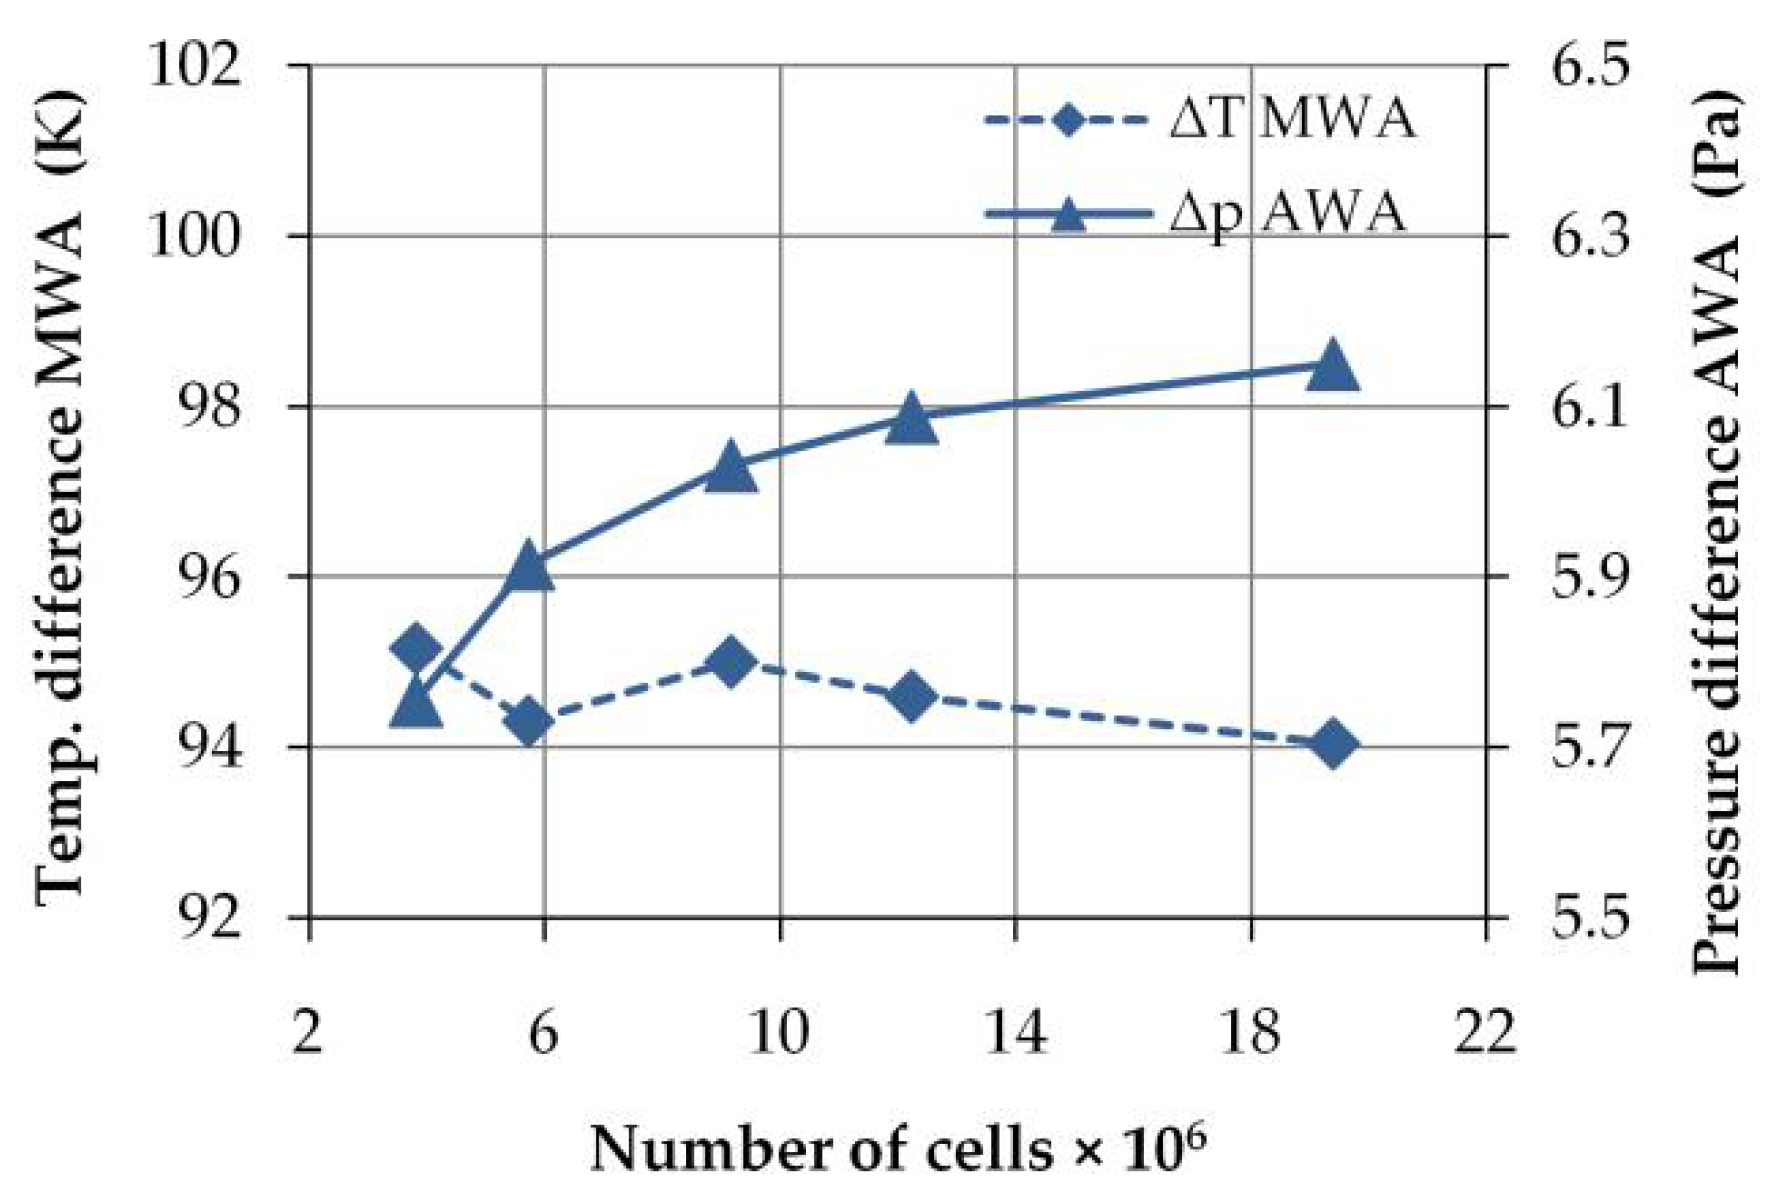
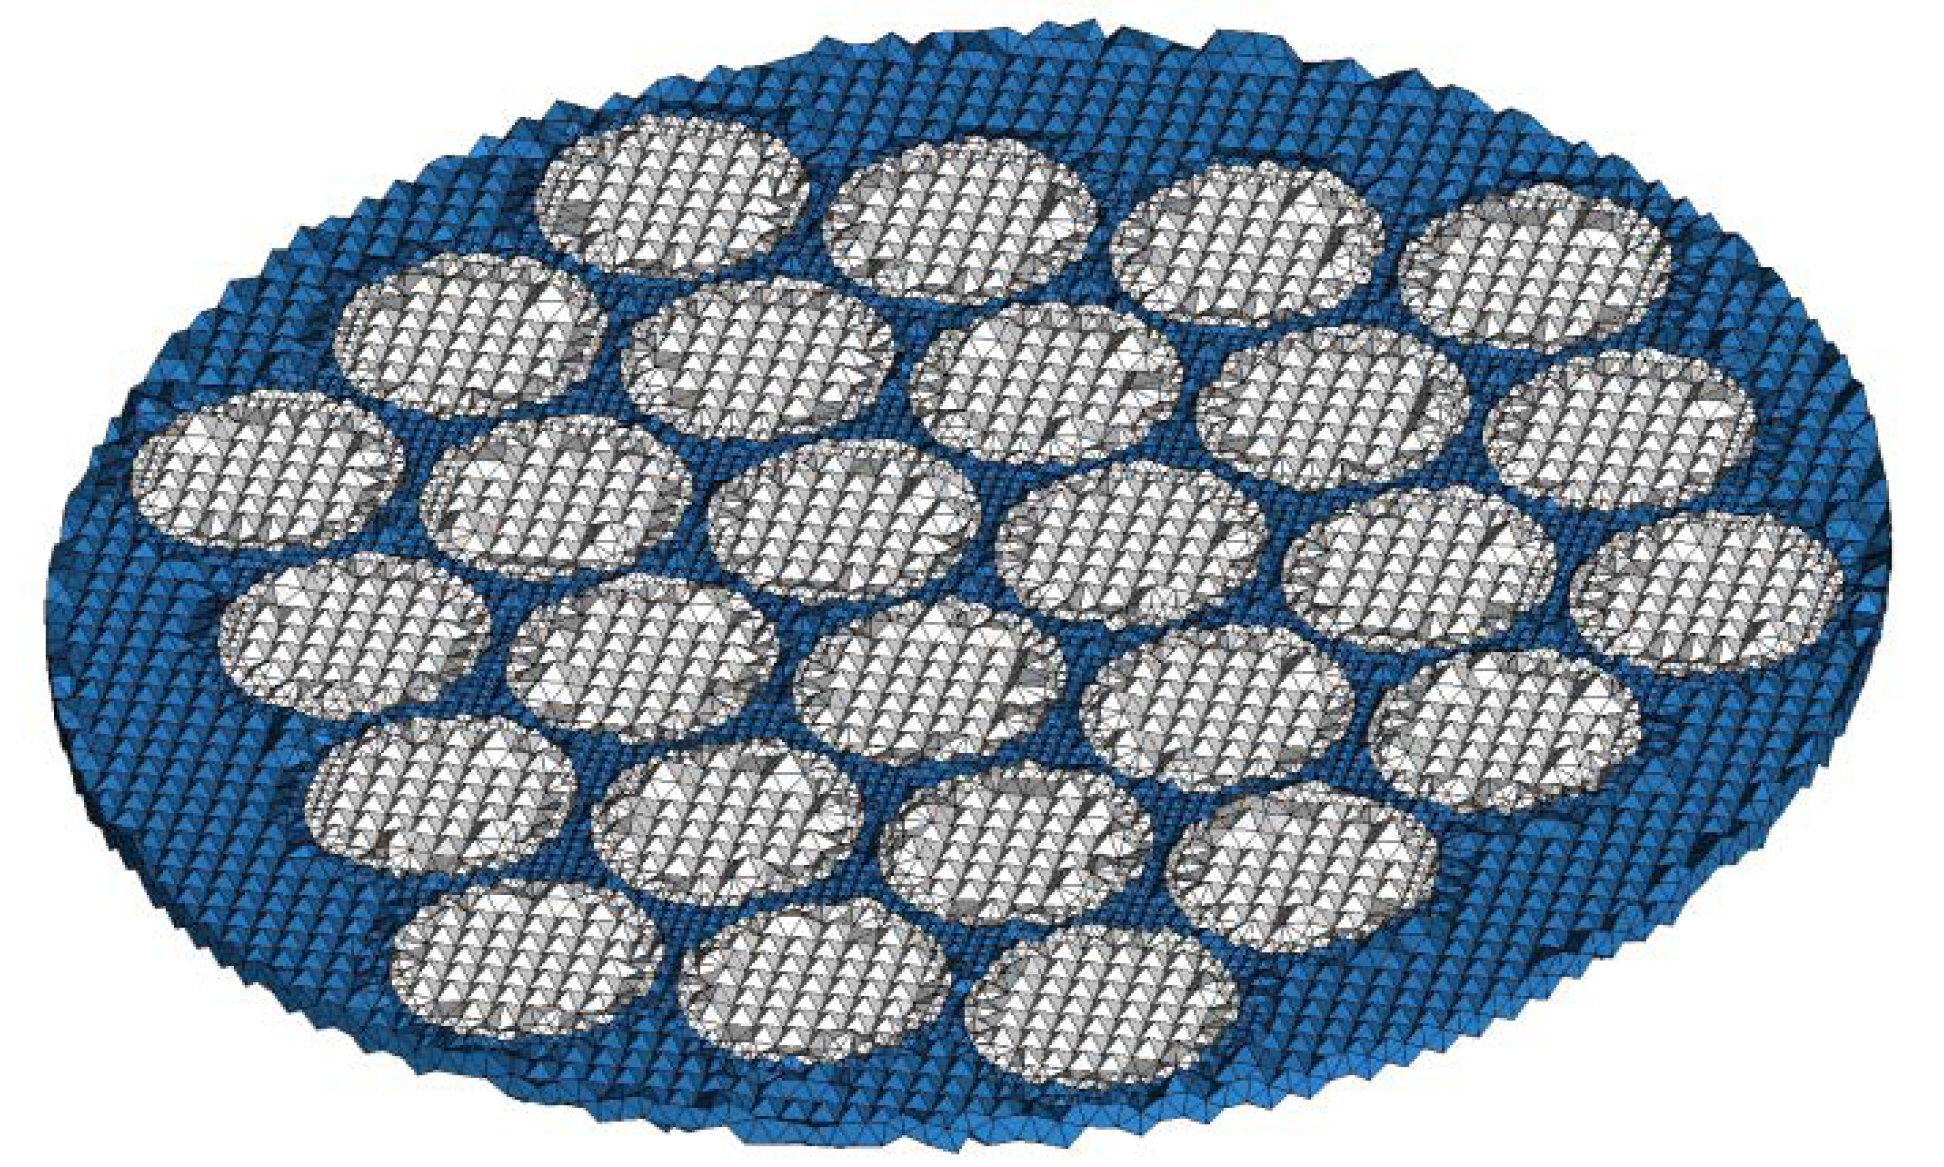
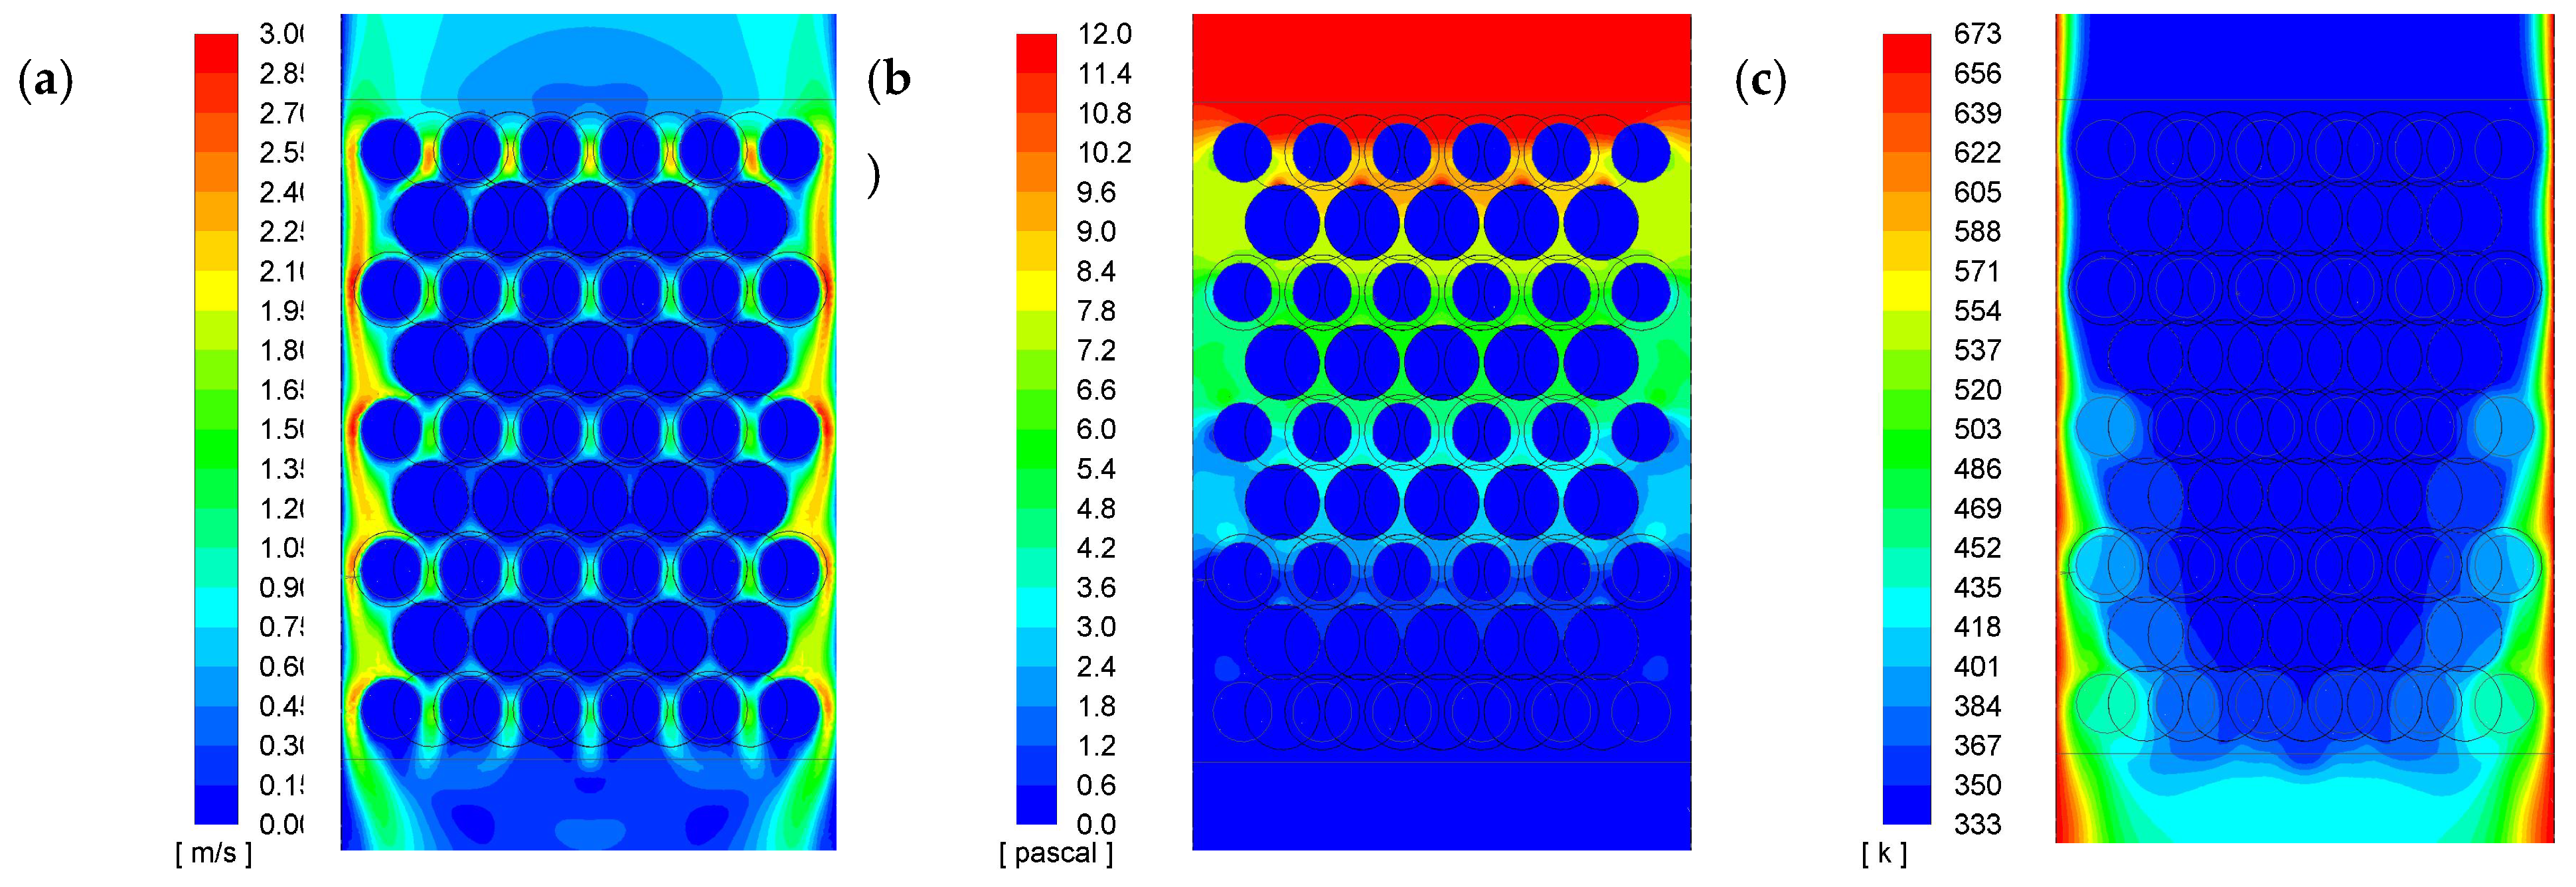
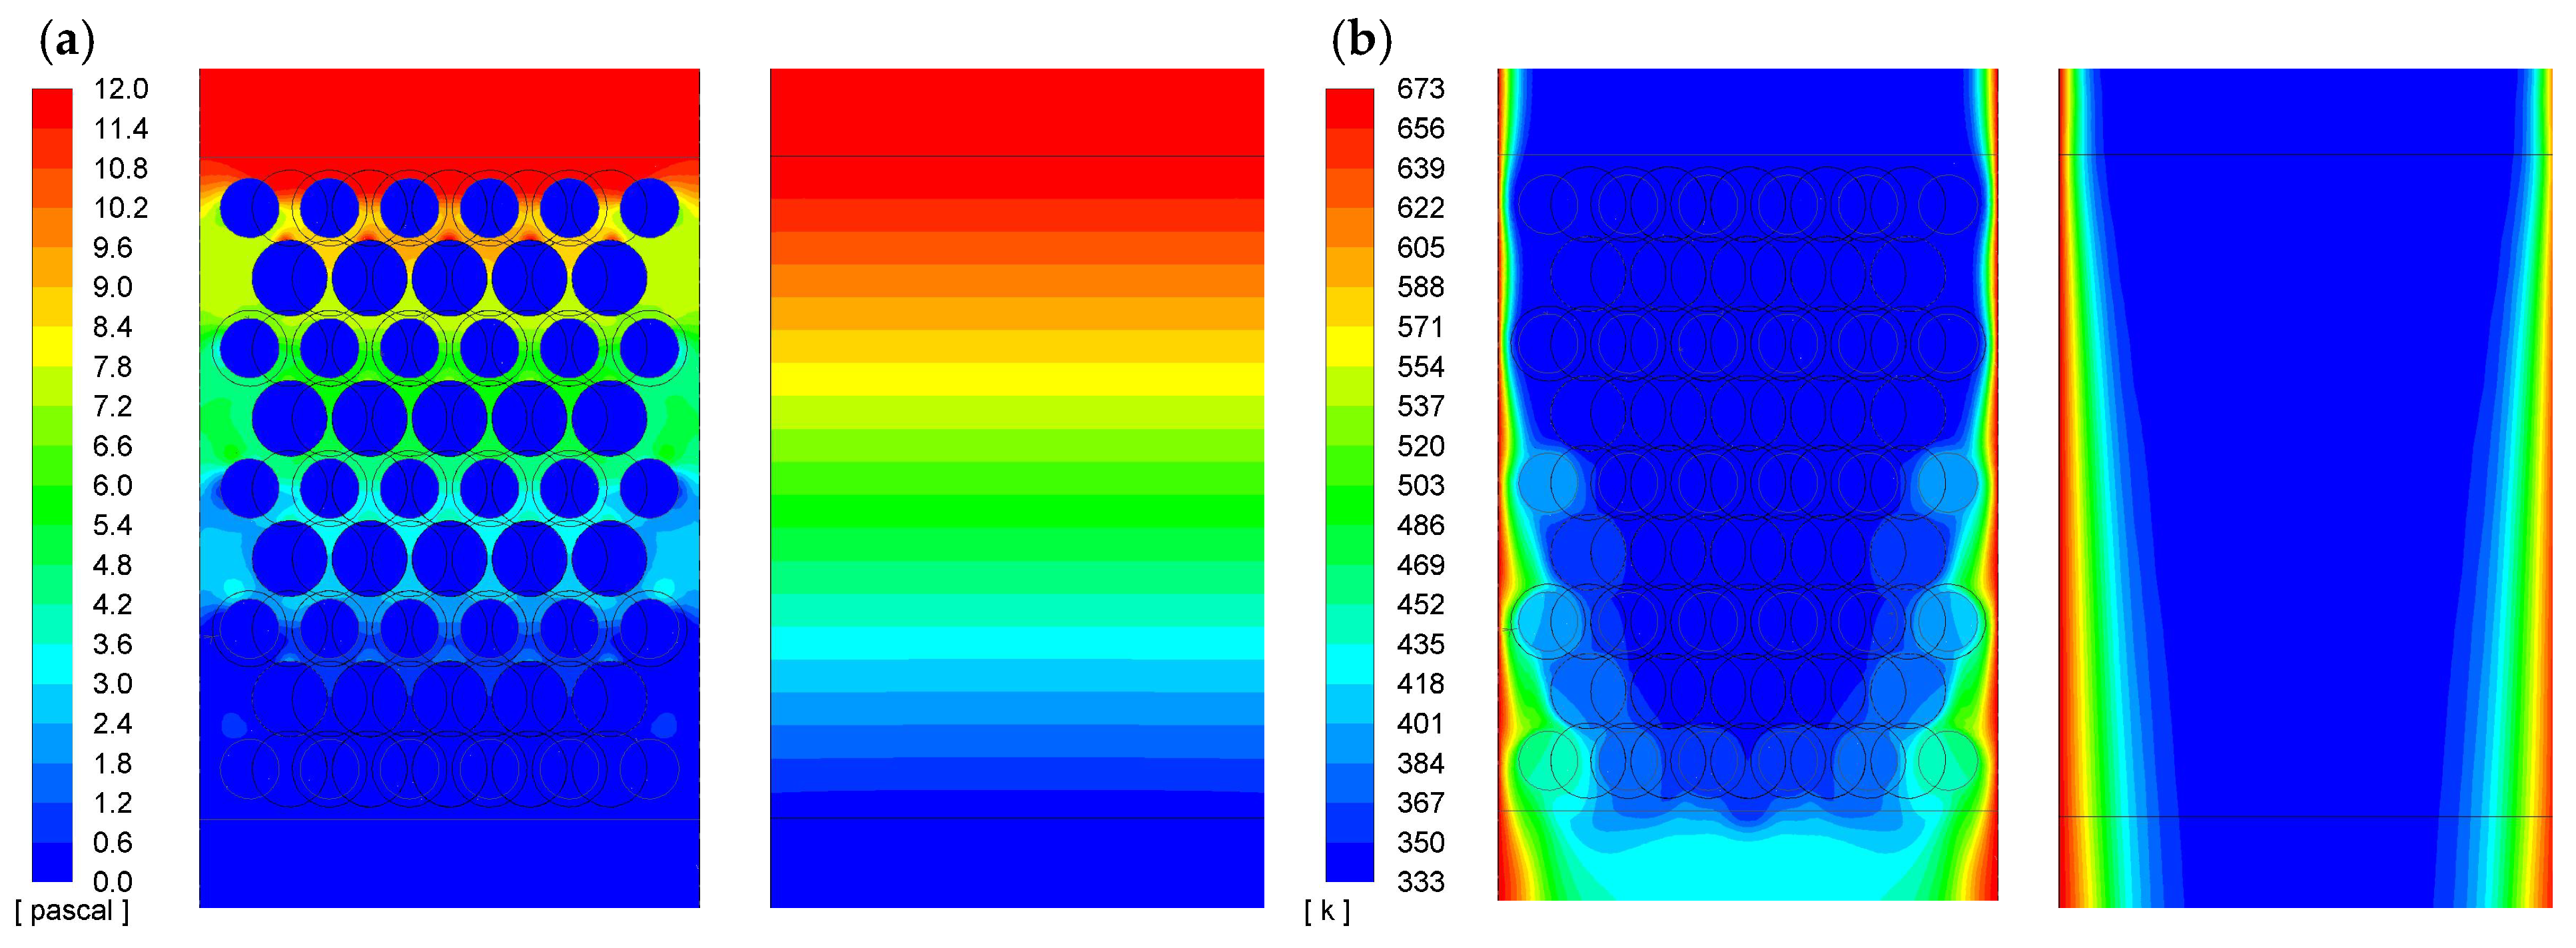
3.1. Detailed Geometry Model Results

A series of simulations were performed in order to get the output values of pressure drops and heat exchanges within the bed. For each geometry variant, three simulations were carried out at different inlet air velocities (0.238, 0.488, and 0.738m/s). An example of the results is shown in Figure 8.

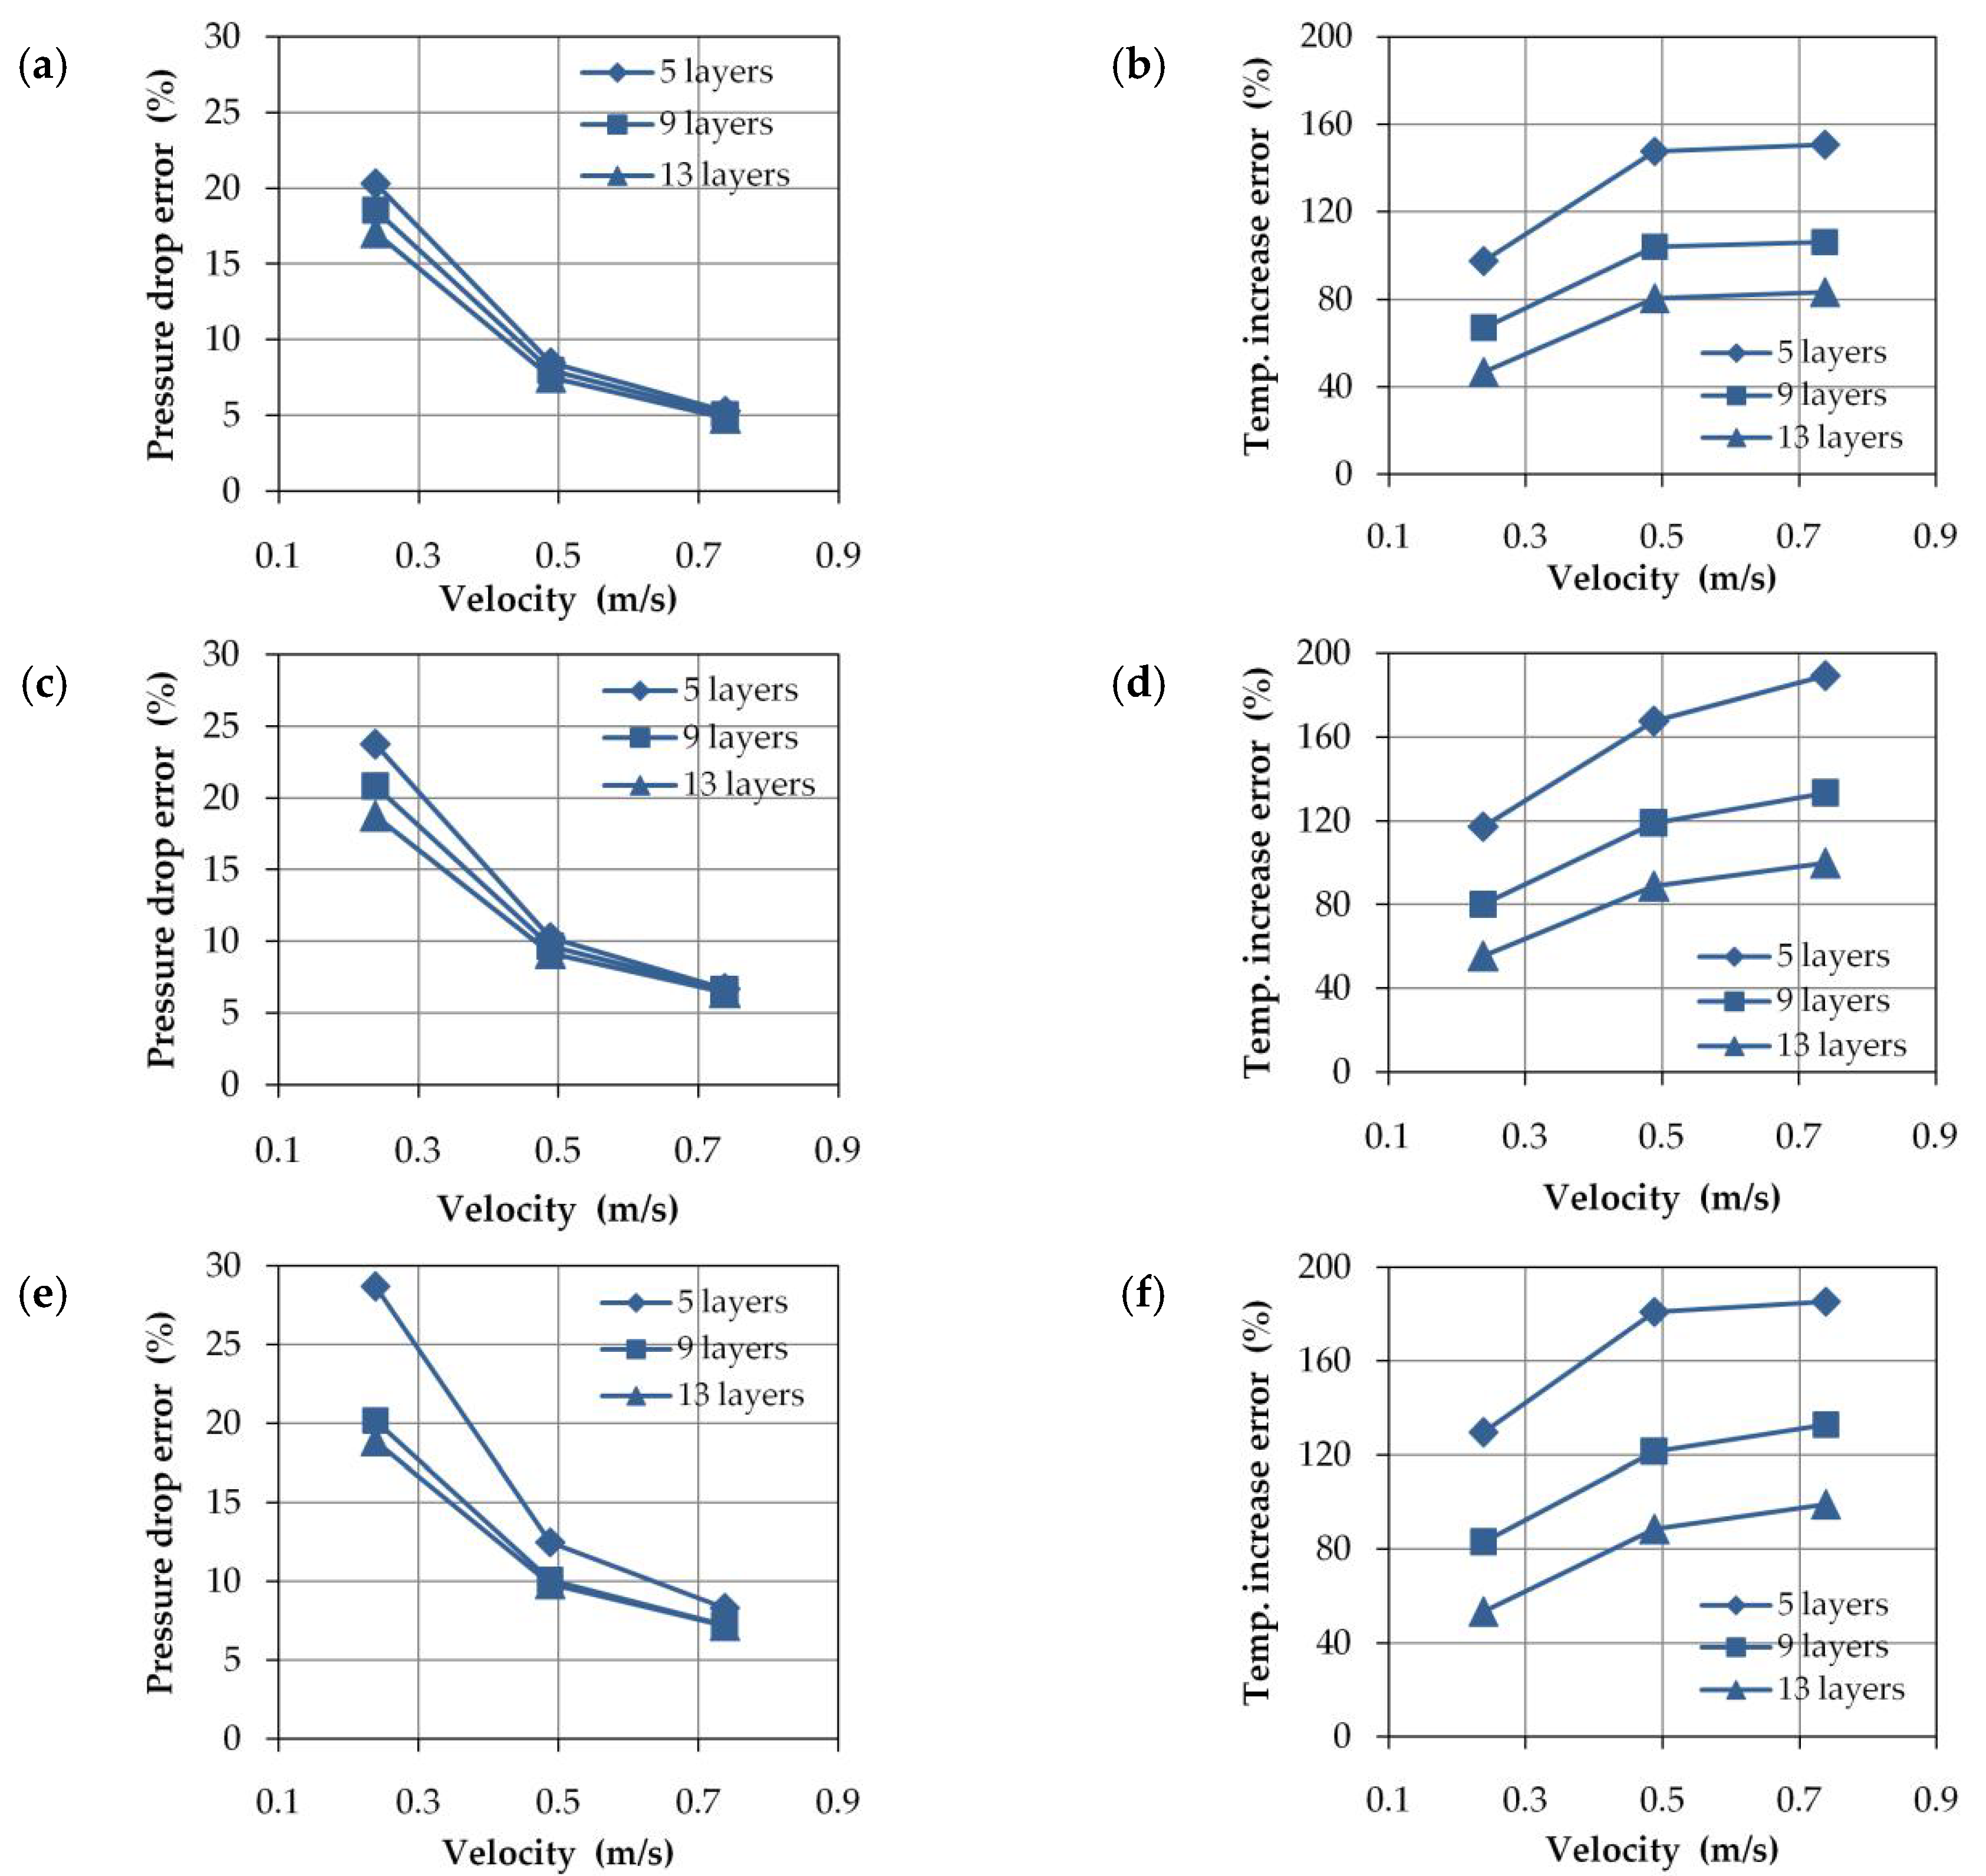
3.2. Simplified Model Results

Based on the results obtained in the detailed model, a set of parameters defining the properties of the porous medium was calculated: internal resistance, viscous resistance, and porosity. The first two (a and b) were calculated using the coefficients of the quadratic equation (y = ax2 + bx + c) approximating the flow resistance through the bed (see Figure 9).
V C = b μ l   ; 1 m 2
I C = 2 a ϱ l   ; 1 m
A set of simulations of simplified reactor models with the use of a porous medium method were done, obtaining pressure and temperature distributions within the computational domain (an example of the results is shown in Figure 10). Then, the computation procedure was performed, the same as previously performed with full models, and AWA pressures and MWA temperatures were determined in the control cross-sections. In the case of simplified models, the control sections had been set out by the planes enclosing the zone of the domain with the porous medium (preserving the same geometrical distance between them as was in the full model case). The read values were compared with those obtained from the full models, and relative deviations are presented in Figure 11a–f.
Except for the simulation with the lowest flow rate, the deviations in determining the pressure drop in the simplified model do not exceed 13%. According to the cited publications, errors of the same magnitude can also be expected in full reactor models, therefore the use of the porous medium method seems to be appropriate in many cases.
On the other hand, the errors in determining the average temperature increase within the bed reach 200%, which disqualifies the use of the discussed method even for approximate calculations. Within the porous medium, the issue of heat transfer is treated in a simplified manner, and it is difficult to expect that it would be possible to model the effects caused by anomalies such as channeling, wall effects, and local backflows in such a way.

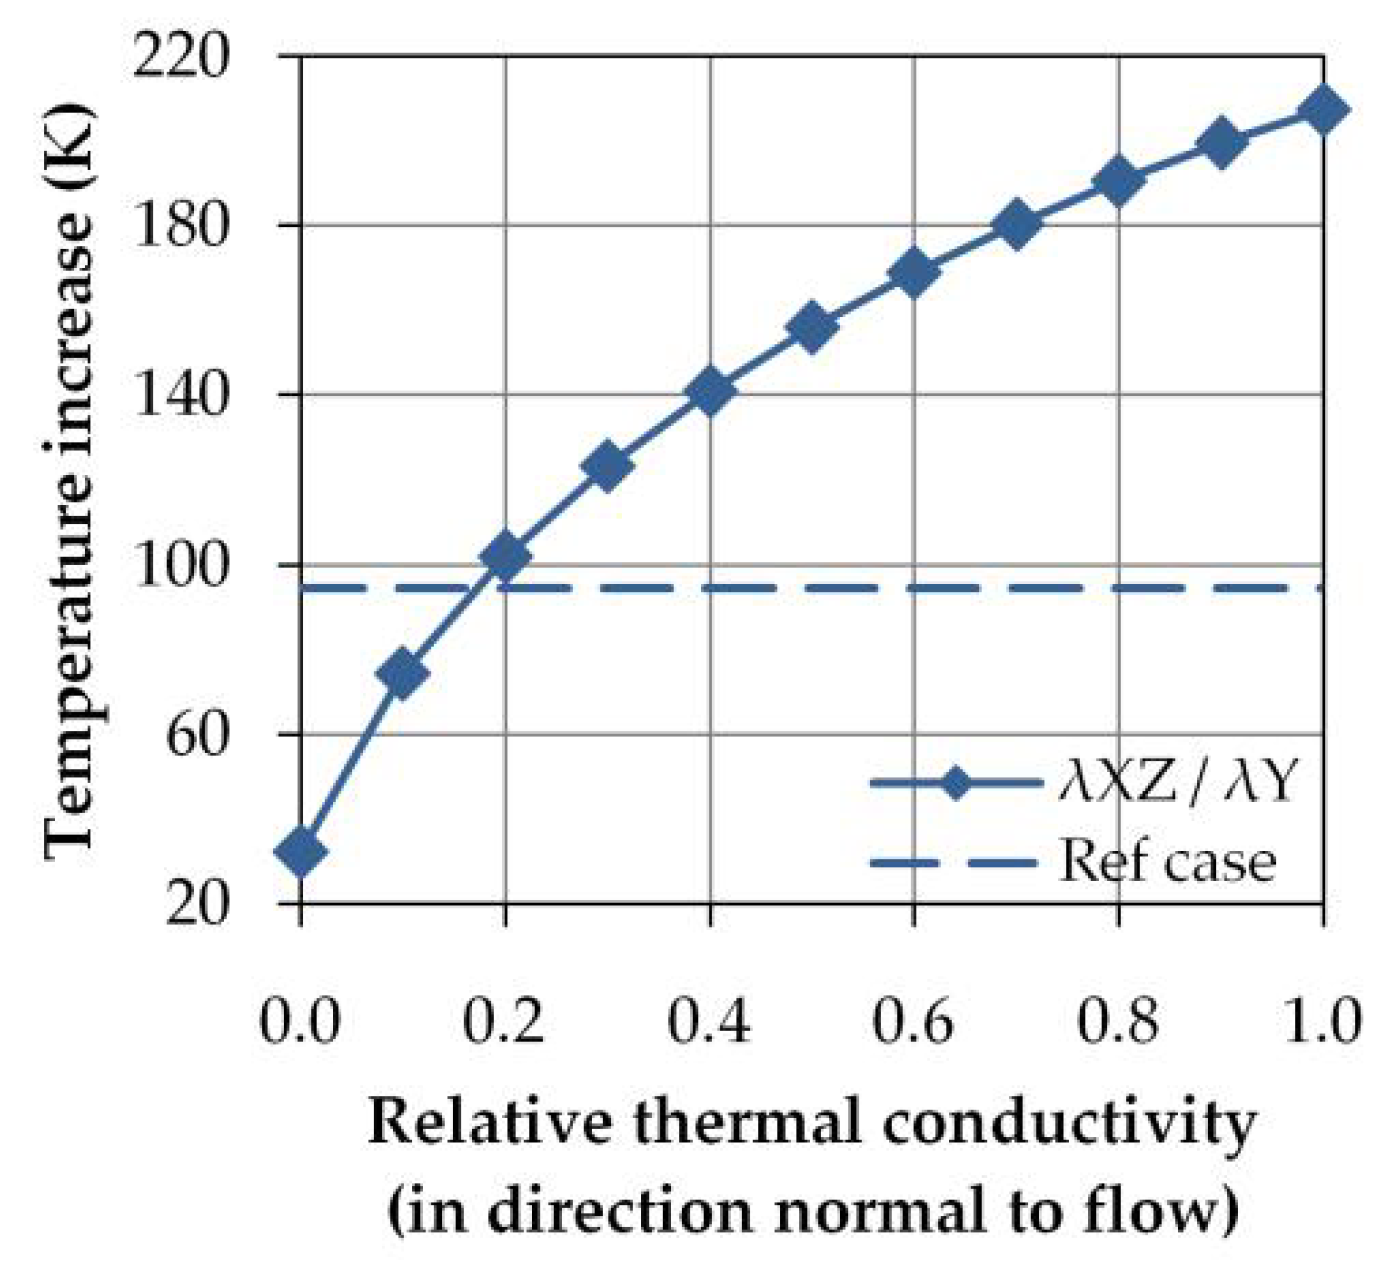
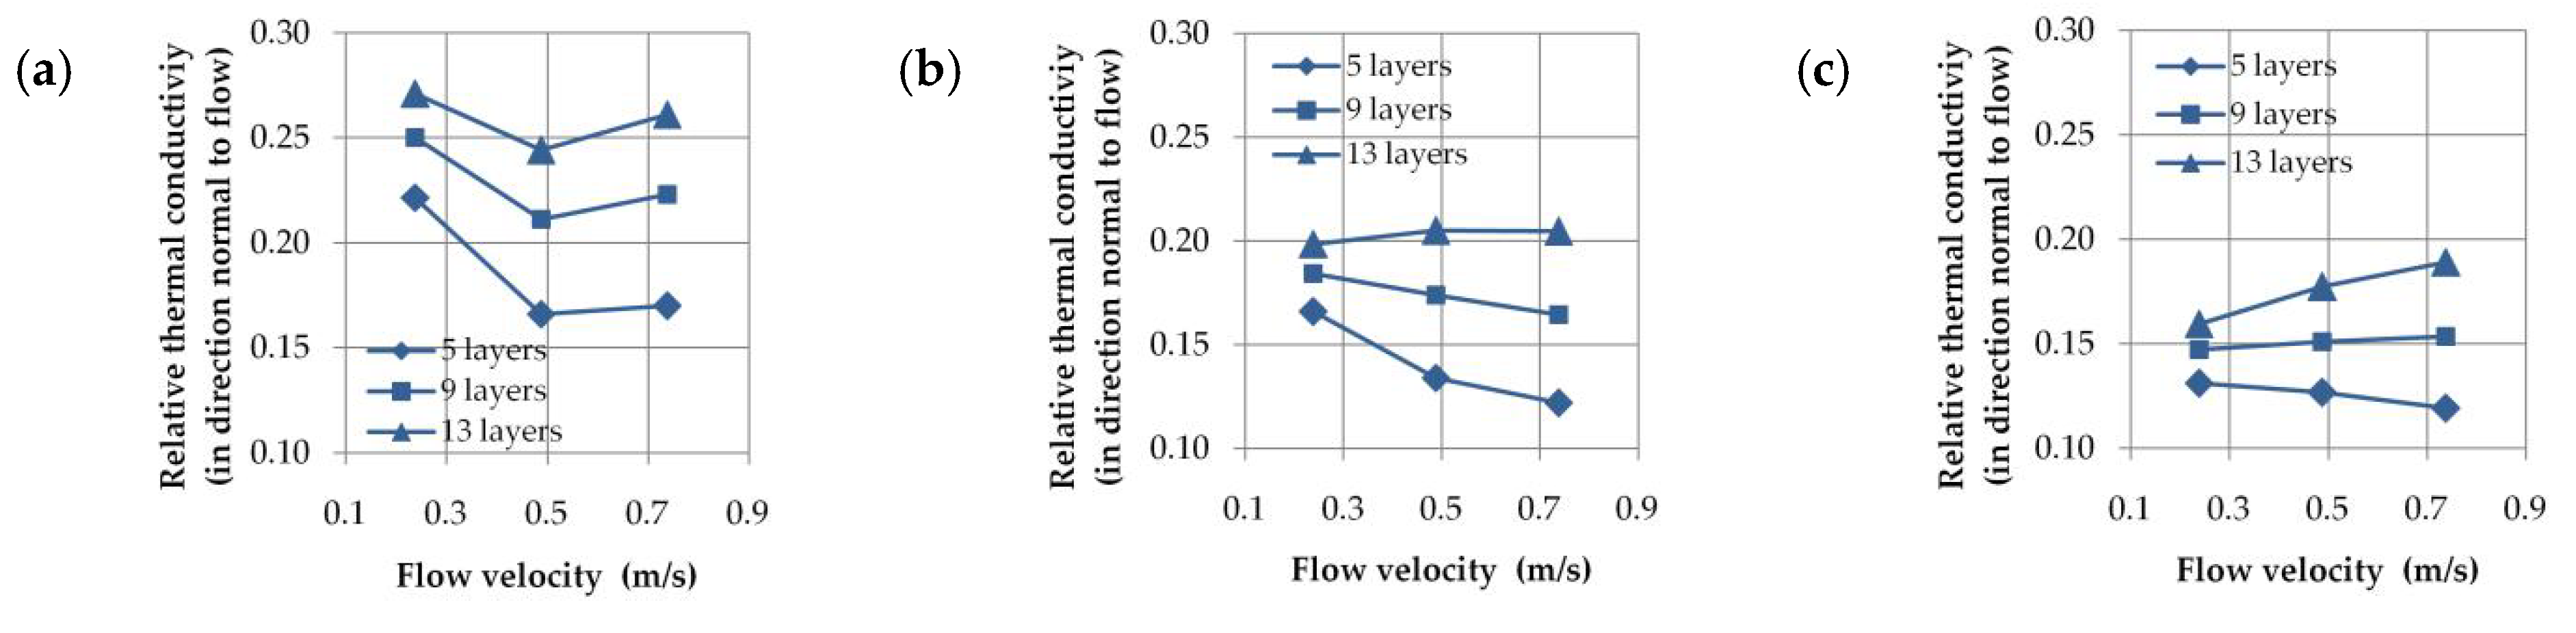
3.3. Anisotropic Thermal Conductivity Coefficient

Considering the nature of anomalies arising in reactors with a low tube-to-particle diameter ratio, it can be assumed that the errors in modeling heat transfer by the porous medium method result from the incorrect mapping of the heat transfer in the direction perpendicular to the general fluid flow direction. Therefore, it was proposed that an anisotropic thermal conductivity coefficient would be introduced into the porous medium. Its component parallel to the flow direction (YY) has a nominal value for a given type of bed material (in the described case silica glass λs = 1.1W·K−1·m−1), but both perpendicular components (XX and ZZ) are modified.
λ s i j = λ s e ^ i j = λ s X X 0 0 0 1 0 0 0 Z Z
For all considered reactor variants (considering the diameter of the spheres and the number of layers) and for the three airflow velocities, a procedure was carried out in which the MWA temperature increase in the full reactor model was compared with the MWA temperature increase in the simplified model (with the porous medium) (an example is shown in Figure 12) as a function of the perpendicular component of the relative thermal conductivity coefficient. The relative thermal conductivity coefficient means the ratio of thermal conductivity in directions perpendicular to thermal conductivity in a direction parallel to the direction of fluid flow through the bed.
For each analyzed case, the value of relative thermal conductivity was determined, for which the values of MWA temperature increase within the porous medium were equal to the temperature increase within the full model. These values are in the range 0.12–0.28. The detailed results are shown in Figure 13 and Figure 14.

4. Conclusions

The preliminary models revealed that models of fixed-bed reactors based on the basic porous medium method allow satisfactory consistency of results to be obtained only concerning pressure losses, while errors in the calculation of average outlet temperature were found to be unacceptable. This may be due to the channeling, wall effects, local backflows, and severe axial and radial gradients that always occur in real reactors. A significant improvement in accuracy can be obtained by using the anisotropic thermal conductivity method proposed in this paper. It can be achieved by diminution of the thermal conductivity coefficient value in the directions perpendicular to the flow down to 0.12–0.28 of nominal value—set as a component parallel to the flow direction. Thanks to this method, the resultant mean outlet temperature error can be reduced to just a few percent, which is sufficient for engineering calculations. The described method, when properly tuned, enables one to achieve full compliance with the average temperature of the medium at the reactor outlet.
For model validation, the area-weighted average pressure and mass-weighted average temperature were chosen as comparison parameters. This approach eliminates the necessity to determine temperature and velocity profiles within selected cross-sections of the modeled reactor.

Author Contributions

T.Ś. contributed with CFD writing the original draft. R.K. contributed with supervision, writing—review and editing. A.B.-M. contributed with conceptualization and methodology. W.M. contributed with investigation and validation. A.W. contributed with conceptualization. All authors have read and agreed to the published version of the manuscript.

Funding

This work was financed from project WND-POWR.03.02.00-00-I003/16-01 InterDok–Interdisciplinary Doctoral Studies Programs at the Wroclaw University of Science and Technology.

Institutional Review Board Statement

Not Applicable.

Informed Consent Statement

Not Applicable.

Data Availability Statement

Not Applicable.

Conflicts of Interest

The authors declare no conflict of interest.

Abbreviations

AWAarea-weighted average
DEMdiscrete element method
MWAmass-weighted average

Symbols and Units

a, b, ccoefficients of the quadratic equation
Afacet area (m2)
dspheres diameter (m)
Dreactor diameter (m)
Eenergy (J)
Fbody force (N)
gstandard acceleration due to gravity (m⋅s−2)
henthalpy (J⋅kg−1)
Jdiffusion flux
lreactor length (m)
Nthe tube-to-particle-diameter ratio
ppressure (Pa)
Ssource term
Ttemperature (K)
ttime (s)
vvelocity (m·s−1)
γporosity
λthermal conductivity (W⋅K−1⋅m−1)
μdynamic viscosity (kg⋅m−1⋅s−1)
ρdensity (kg·m−3)
τstress tensor (N⋅m−2)

Indexes

ffluid
hsolid
mmass
ssolid

References

  1. Kilkovský, B. Review of design and modeling of regenerative heat exchangers. Energies 2020, 13, 759. [Google Scholar] [CrossRef] [Green Version]
  2. Kharmanda, G.; Sayegh, M.A. Reliability-based design optimization for heat flux analysis of composite modular walls using inverse reliability assessment method. Int. J. Thermoflu. 2020, 1–2, 100008. [Google Scholar] [CrossRef]
  3. Baker, M.J.; Young, P.G.; Tabor, G.R. Image based meshing of packed beds of cylinders at low aspect ratios using 3d MRI coupled with computational fluid dynamics. Comput. Chem. Eng. 2011, 35, 1969–1977. [Google Scholar] [CrossRef]
  4. Soppe, W. Computer simulation of random packings of hard spheres. Powder Technol. 1990, 62, 189–197. [Google Scholar] [CrossRef]
  5. Freund, H.; Bauer, J.; Zeiser, T.; Emig, G. Detailed simulation of transport processes in fixed-beds. Ind. Eng. Chem. Res. 2005, 44, 6423–6434. [Google Scholar] [CrossRef]
  6. Cundall, P.A.; Strack, O.D.L. A discrete numerical model for granular assemblies. Géotechnique 1979, 29, 47–65. [Google Scholar] [CrossRef]
  7. Nijemeisland, M.; Dixon, A.G. Comparison of CFD simulations to experiment for convective heat transfer in a gas-solid fixed bed. Chem. Eng. J. 2001, 82, 231–246. [Google Scholar] [CrossRef]
  8. Rebughini, S.; Cuoci, A.; Maestri, M. Handling contact points in reactive CFD simulations of heterogeneous catalytic fixed bed reactors. Chem. Eng. Sci. 2016, 141, 240–249. [Google Scholar] [CrossRef]
  9. Calis, H.; Nijenhuis, J.; Paikert, B.; Dautzenberg, F.; van den Bleek, C. CFD modelling and experimental validation of pressure drop and flow profile in a novel structured catalytic reactor packing. Chem. Eng. Sci. 2001, 56, 1713–1720. [Google Scholar] [CrossRef]
  10. Wehinger, G.D.; Eppinger, T.; Kraume, M. Detailed numerical simulations of catalytic fixed-bed reactors: Heterogeneous dry reforming of methane. Chem. Eng. Sci. 2015, 122, 197–209. [Google Scholar] [CrossRef]
  11. Dixon, A.G.; Nijemeisland, M.; Stitt, E.H. Systematic mesh development for 3d CFD simulation of fixed beds: Contact points study. Comput. Chem. Eng. 2013, 48, 135–153. [Google Scholar] [CrossRef]
  12. Dixon, A.G.; Nijemeisland, M. CFD as a design tool for fixed-bed reactors. Ind. Eng.Chem. Res. 2001, 40, 5246–5254. [Google Scholar] [CrossRef]
  13. Guardo, A.; Coussirat, M.; Larrayoz, M.A.; Recasens, F.; Egusquiza, E. CFD flow and heat transfer in nonregular packings for fixed bed equipment design. Ind. Eng. Chem. Res. 2004, 43, 7049. [Google Scholar] [CrossRef]
  14. Guardo, A.; Coussirat, M.; Recasens, F.; Larrayoz, M.A.; Escaler, X. CFD study on particle-to-fluid heat transfer in fixed bed reactors: Convective heat transfer at low and high pressure. Chem. Eng. Sci. 2006, 61, 4341–4353. [Google Scholar] [CrossRef]
  15. Eppinger, T.; Seidler, K.; Kraume, M. DEM–CFD simulations of fixed bed reactors with small tube to particle diameter ratios. Chem. Eng. J. 2011, 166, 324–331. [Google Scholar] [CrossRef]
  16. Kuroki, M.; Ookawara, S.; Street, D.; Ogawa, K. High-fidelity CFD modeling of particle-to-fluid heat transfer in packed bed reactors. In Proceedings of the European Congress of Chemical Engineering (ECCE-6), Copenhagen, Denmark, 16–20 September 2007. Paper No. 1102, Corpus ID: 16325382. [Google Scholar]
  17. Ookawara, S.; Kuroki, M.; Street, D.; Ogawa, K. High-fidelity DEM-CFD modeling of packed bed reactors for process intensification. In Proceedings of the European Congress of Chemical Engineering (ECCE-6), Copenhagen, Denmark, 16–20 September 2007. Paper No. 1105, Corpus ID: 10898373. [Google Scholar]
  18. Dong, Y.; Sosna, B.; Kroup, O.; Rosowski, F.; Horn, R. Investigation of radial heat transfer in a fixed-bed reactor: CFD simulations and profile measurements. Chem. Eng. J. 2017, 317, 204–214. [Google Scholar] [CrossRef]
  19. de Klerk, A. Voidage variation in packed beds at small column to particle diameter ratio. AIChE J. 2003, 49, 2022–2029. [Google Scholar] [CrossRef]
  20. Ansys Fluent Theory Guide & User’s Guide; Ansys Inc.: Canonsburg, PA, USA, 2011; Release 14.
Figure 1. Schematic of modeled fixed-bed reactor.
Energies 14 00784 g001
Figure 2. Pattern of spheres distribution in odd and even layers of beds consisting of spheres with a diameter of:(a,b) 2 mm; (c,d) 3 mm; (e,f) 4 mm.
Energies 14 00784 g002
Figure 3. Mesh independence test for a nine-layer reactor with 3-mm spheres (the chosen mesh contains 12.2 × 10⁶ cells with a size of 0.5/0.17 mm). MWA: mass-weighted average; AWA: area-weighted average.
Energies 14 00784 g003
Figure 4. Cross-section of a computational mesh of a model with detailed geometry.
Energies 14 00784 g004
Figure 5. The geometry of the simplified fixed-bed reactor model.
Energies 14 00784 g005
Figure 6. Mesh independence test for a porous media model of a nine-layer reactor with 3-mm spheres (the chosen mesh contains 175 × 103 cells).
Energies 14 00784 g006
Figure 7. Cross-section of the computational mesh in the porous medium zone.
Energies 14 00784 g007
Figure 8. Example of simulation results for the reactor with 13 layers of spheres with a diameter of 3 mm, showing distributions of: (a) velocity, (b) pressure, (c) and temperature.
Energies 14 00784 g008
Figure 9. Examples of hydraulic characteristics of a fixed-bed with 3-mm spheres filling.
Energies 14 00784 g009
Figure 10. Comparison of the pressure (a) and temperature (b) distribution within the bed for the full and simplified model (an example of a 13-layer bed with 3-mm diameter spheres).
Energies 14 00784 g010
Figure 11. Relative deviations of pressure drop and temperature increase within the reactor bed between full and simplified model: (a,b) 2-mm spheres, (c,d) 3-mm spheres, (e,f) 4-mm spheres.
Energies 14 00784 g011
Figure 12. Example of a comparison of MWA temperature increase within the full model (nine layers of 3-mm spheres) with temperature increase within porous medium as a function of relative thermal conductivity (fluid flow direction parallel to Y axis).
Energies 14 00784 g012
Figure 13. Relative transverse thermal conductivity of porous medium as a function of air flow velocity for a bed containing balls with a diameter of (a) 2 mm, (b) 3 mm, (c) 4 mm.
Energies 14 00784 g013
Figure 14. Relative transverse thermal conductivity of porous medium as a function of the number of layers in a bedcontaining balls with a diameter of (a) 2 mm, (b) 3 mm, (c) 4 mm.
Energies 14 00784 g014
Publisher’s Note: MDPI stays neutral with regard to jurisdictional claims in published maps and institutional affiliations.

