Article

Increasing Efficiency of a Finned Heat Sink Using Orthogonal Analysis

1
Institute of Thermal Science and Technology, Shandong University, Jinan 250061, China
2
Shandong Institute of Advanced Technology, Jinan 250100, China
*
Author to whom correspondence should be addressed.
Energies 2021, 14(3), 782; https://doi.org/10.3390/en14030782
Submission received: 9 November 2020 / Revised: 21 January 2021 / Accepted: 27 January 2021 / Published: 2 February 2021

Abstract

:
As the heat flux of electronic components is increasing rapidly, the traditional air-cooling technique is gradually not meeting the requirements of thermal management. The immersion liquid-cooling technique shows great potential, and has attracted increasing attention due to its excellent performance in recent years. The finned heat sink is common and essential for cooling electric components. To analyze the influences of its structural parameters on heat dissipation and improve its efficiency while using a dielectric coolant, this study used the orthogonal analysis method to obtain the optimal structure via the numerical simulation method. The maximum temperature of the heat sink was selected as the evaluation criteria. The results showed that the parameters that affect the maximum temperature, in order of importance, are fin thickness, the number of fins, the height of the fins, and substrate thickness. Finally, taking the maximum temperature and mass as indexes obtained the optimal structure of the heat sink. The mass was reduced by 19%, while the temperature only increased by 4.5% when considering the mass index.

1. Introduction

With the rapid development of information technology, the power density of high-performance servers is increasing. The maximum power consumption of high-performance microprocessors is expected to reach 300 W. If the heat dissipation problem is not dealt with effectively, it may hamper chip performance and shorten its lifetime [1]. Approximately 55% of damages in electronic equipment are caused by inadequate thermal management [2]. Thus, the effective removal of heat is paramount in order to ensure a reliable working temperature for electronic equipment. Many methods are available for cooling electronic components, such as heat pipes, microchannels, and microfluidics [3,4,5,6,7]. Conventionally, a heat sink is superior in terms of cost, convenience, and reliability.
Fins are usually used for extending surfaces in the heat dissipation of electronic components in what is known as the heat sink. Heat sinks are widely used in heat-exchange equipment, and many efforts have been made to optimize the fins to improve heat-transfer performance, and various types of finned heat sinks have been designed. Zhang et al. [8] proposed a W-type finned heat sink and found that the maximum temperature dropped by 4.6 °C because the W-type finned heat sink increased the air input in the direction perpendicular to the substrate, and the thermal boundary layer was thinned. Naserian et al. [9] investigated different shapes of a 90-degree V-type fin, as well as the gap between them in different cases. By scrutinizing the results, they obtained an optimum fin shape. Altun et al. [10] found that sinusoidal wavy fins increased heat transfer more than rectangular fins; however, with the increase of fin wave amplitude, the effect of enhanced heat transfer was weakened. Nilpueng et al. [11] investigated sinusoidal wavy plate fins with phase shift of 0°, 90°, and 180°, and found that the phase shift had a great influence on thermal performance. Ghandouri et al. [12] designed a new rippling fin, and the natural convection heat transfer was enhanced by 78%, and it had a mass reduction of 47.83% compared to rectangular fins. Shyu et al. [13] tested the thermal performance of plate-fin heat sinks with different types of winglets, and the results showed that heat transfer was enhanced compared to plain plate-fin heat sinks.
In some studies, the purpose of the work was to enhance the turbulence of flow between the fins to improve heat-transfer performance further. Shaeri and Yaghoubi [14] found that increasing the number of perforations could significantly improve the performance of perforated ribs. In the study by Huang et al. [15], the natural convection heat transfer of a horizontal rectangular fin array was enhanced by drilling holes in the fin base. Maji et al. [16] investigated the heat-transfer enhancement of heat sinks using perforated pin fins with different perforation geometries, and the results indicated that heat-dissipation rate of perforated fins was always higher than the solid ones. The perforation of fins increases the heat-dissipation rate, and at the same time, decreases the usage of materials. Tariq et al. [17] proposed four novel fins with rectangular and circular perforations and slots, and the results showed that the heat-transfer coefficient was increased by 41.1%, while the mass and pressure drop were reduced by 38% and 41.1%, respectively.
The fins of non-uniform structures have also attracted more attention. Yang and Peng [18] found that a non-uniform fin height design could enhance the heat-transfer performance, and increasing the height of fin near the center of heat sink could reduce the temperature junction. Yang et al. [19] evaluated the possibility of improving a heat sink’s thermal performance by utilizing a non-uniform width, and found that it could increase the Nusselt number. Huang [20] and Chen [21] used the Levenberg–Marquardt method to optimize the width and height of a heat-sink module. The results showed that the heat-sink module with an optimal fin width and a non-uniform height had the best thermal performance when the volume of the fin was fixed. Moreover, the thermal resistance of the optimal radiator was reduced by 4.81% compared with [19].
In some studies, a finned heat sink filled with phase-change materials (PCMs) greatly improved the heat-transfer efficiency because it had a great influence on the uniform heat distribution in the heat sink [22]. A numerical study on heat sink thermal performance using PCMs and a vapor chamber was carried out by Ghanbarpour et al. [23], and they found that PCMs could reduce the heat source temperature by 33.1% compared to a conventional heat sink. The number and height of the fins contributed more to the reduction of temperature of electronic components. Kalbasi et al. [24] pointed out that the optimal number of fins was affected by the height and width of heat sink, fin thickness, heat flux, and fin spacing, and also gave a correlation to estimate the optimum fin number in a PCM-based heat sink. Yazici et al. [25] studied the inclination angle on the thermal performance of PCM-based heat sinks, and the results showed the best performance when the inclination angle was 60°.
According to the literature review above, most of the studies on heat sinks analyzed a single structural parameter instead of integrating multiple parameters. Orthogonal analysis is a statistical method to study the multiple factors and their levels in a group of cases that has been successfully applied in many fields [26,27,28,29]. In this paper, the integrated influences of multiple parameters on the heat transfer of heat sinks is studied using the orthogonal analysis and numerical simulation methods. Additionally, considering the maximum temperature and material usage obtained the optimal structure of heat sink.

2. Numerical Simulation of the Heat Sink Model

2.1. Computational Model

Figure 1a gives the computational model of the domain, which was 600 mm × 160 mm × 60 mm. The fluid flows from the bottom to the top of the domain. The heat sink is located in the center of the domain. Figure 1b gives the details of the heat sink, which is made of aluminum. The length L1 is 75 mm and the width L2 is 65 mm. The substrate thickness is B and the number of fins is N. The thickness of fin is W and the height is H. The 300 W heat source for the model is located at a 55 mm × 55 mm area at the bottom-center of the heat sink. In particular, the coolant is a kind of dielectric fluid named FC-40. The related physical properties of FC-40 are shown in Table 1.

2.2. Governing Equations

The simulations were conducted using the commercial ANSYS Fluent software. The flow was treated as a three-dimensional steady flow, and the fluid properties of coolant were constant except for density, and buoyancy effects were considered. The heat transfer of the model satisfied the continuity equation, the momentum-conservation equations, and the energy-conservation equations, which are shown as the following:
Continuity equation:
( ρ u ) x + ( ρ v ) y + ( ρ w ) z = 0
where u, v, and w are the velocities at the direction of x, y, and z directions, and ρ is fluid density.
Momentum-conservation equations:
In x-direction:
( ρ u u ) x + ( ρ u v ) y + ( ρ u w ) z = p x + μ ( 2 u x 2 + 2 u y 2 + 2 u z 2 )
In y-direction:
( ρ v u ) x + ( ρ v v ) y + ( ρ v w ) z = p y + μ ( 2 v x 2 + 2 v y 2 + 2 v z 2 )
In z-direction:
( ρ w u ) x + ( ρ w v ) y + ( ρ w w ) z = p z + μ ( 2 w x 2 + 2 w y 2 + 2 w z 2 ) ρ g
where μ is the dynamic viscosity, p is fluid static pressure, and g is the acceleration of gravity.
Energy-conservation equations:
For the fluid:
ρ C p ( u T f x + v T f y + w T f z ) = λ ( 2 T f x 2 + 2 T f y 2 + 2 T f z 2 )
where Tf is the fluid temperature, λ is the fluid thermal conductivity, and Cp is the fluid-specific heat capacity.
For the solid:
k ( 2 T s x 2 + 2 T s y 2 + 2 T s z 2 ) = 0
where k and Ts are the thermal conductivity and temperature of the solid, respectively.

2.3. Boundary Conditions and Algorithm

The inlet was set as the velocity boundary condition, which was 0.05 m/s at a temperature of 27 °C. The outlet was set as the pressure outlet boundary condition. The heat flux of the model was 99,173 W/m2. An adiabatic boundary condition was applied to the other lateral surfaces of the domain. At the fluid–solid interface, a no-slip condition was used.
The turbulence model used the Realizable k-ε model. The solution algorithm applied the SIMPLE algorithm. The PRESTO scheme was adopted in the pressure-correction equation. The spatial discretization method adopted second order upwind for the momentum, turbulent kinetic energy, turbulent dissipation energy, and energy equations. The residual value used for convergence indicator was 10−4. The convergence criterion was deemed as sufficient when the monitored maximum temperature remained stable.

2.4. Validation of Grid Independence

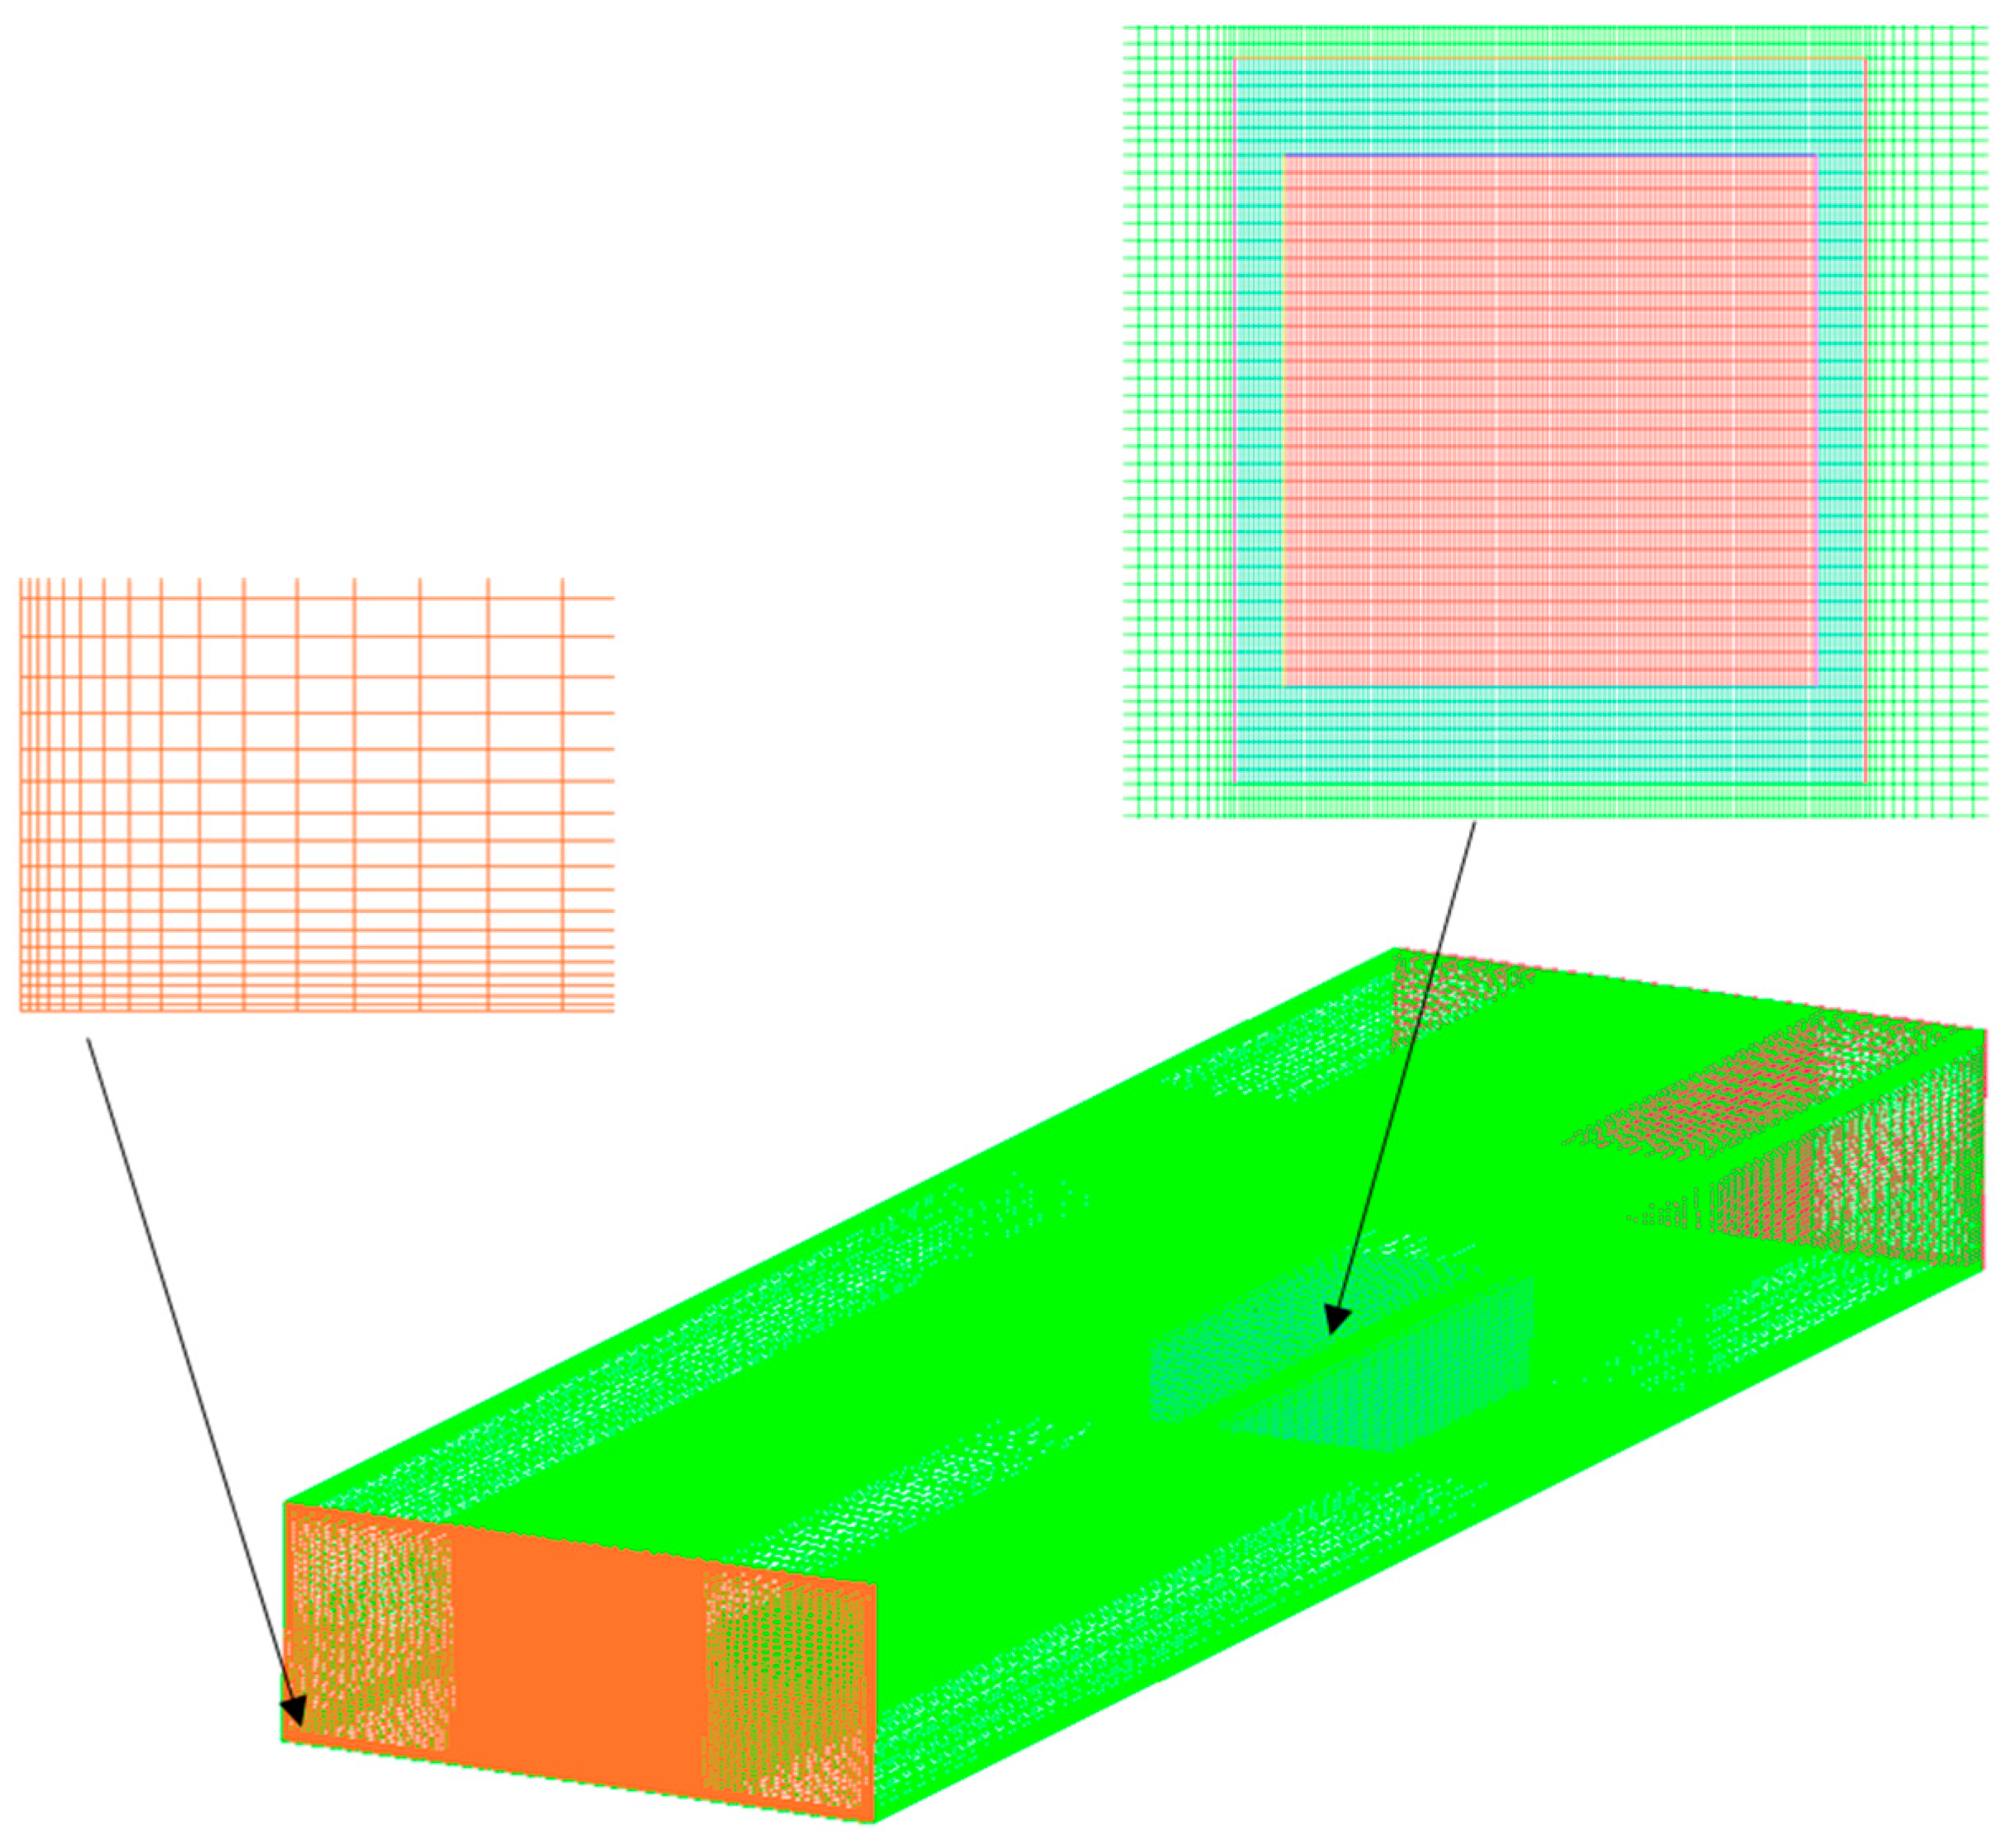
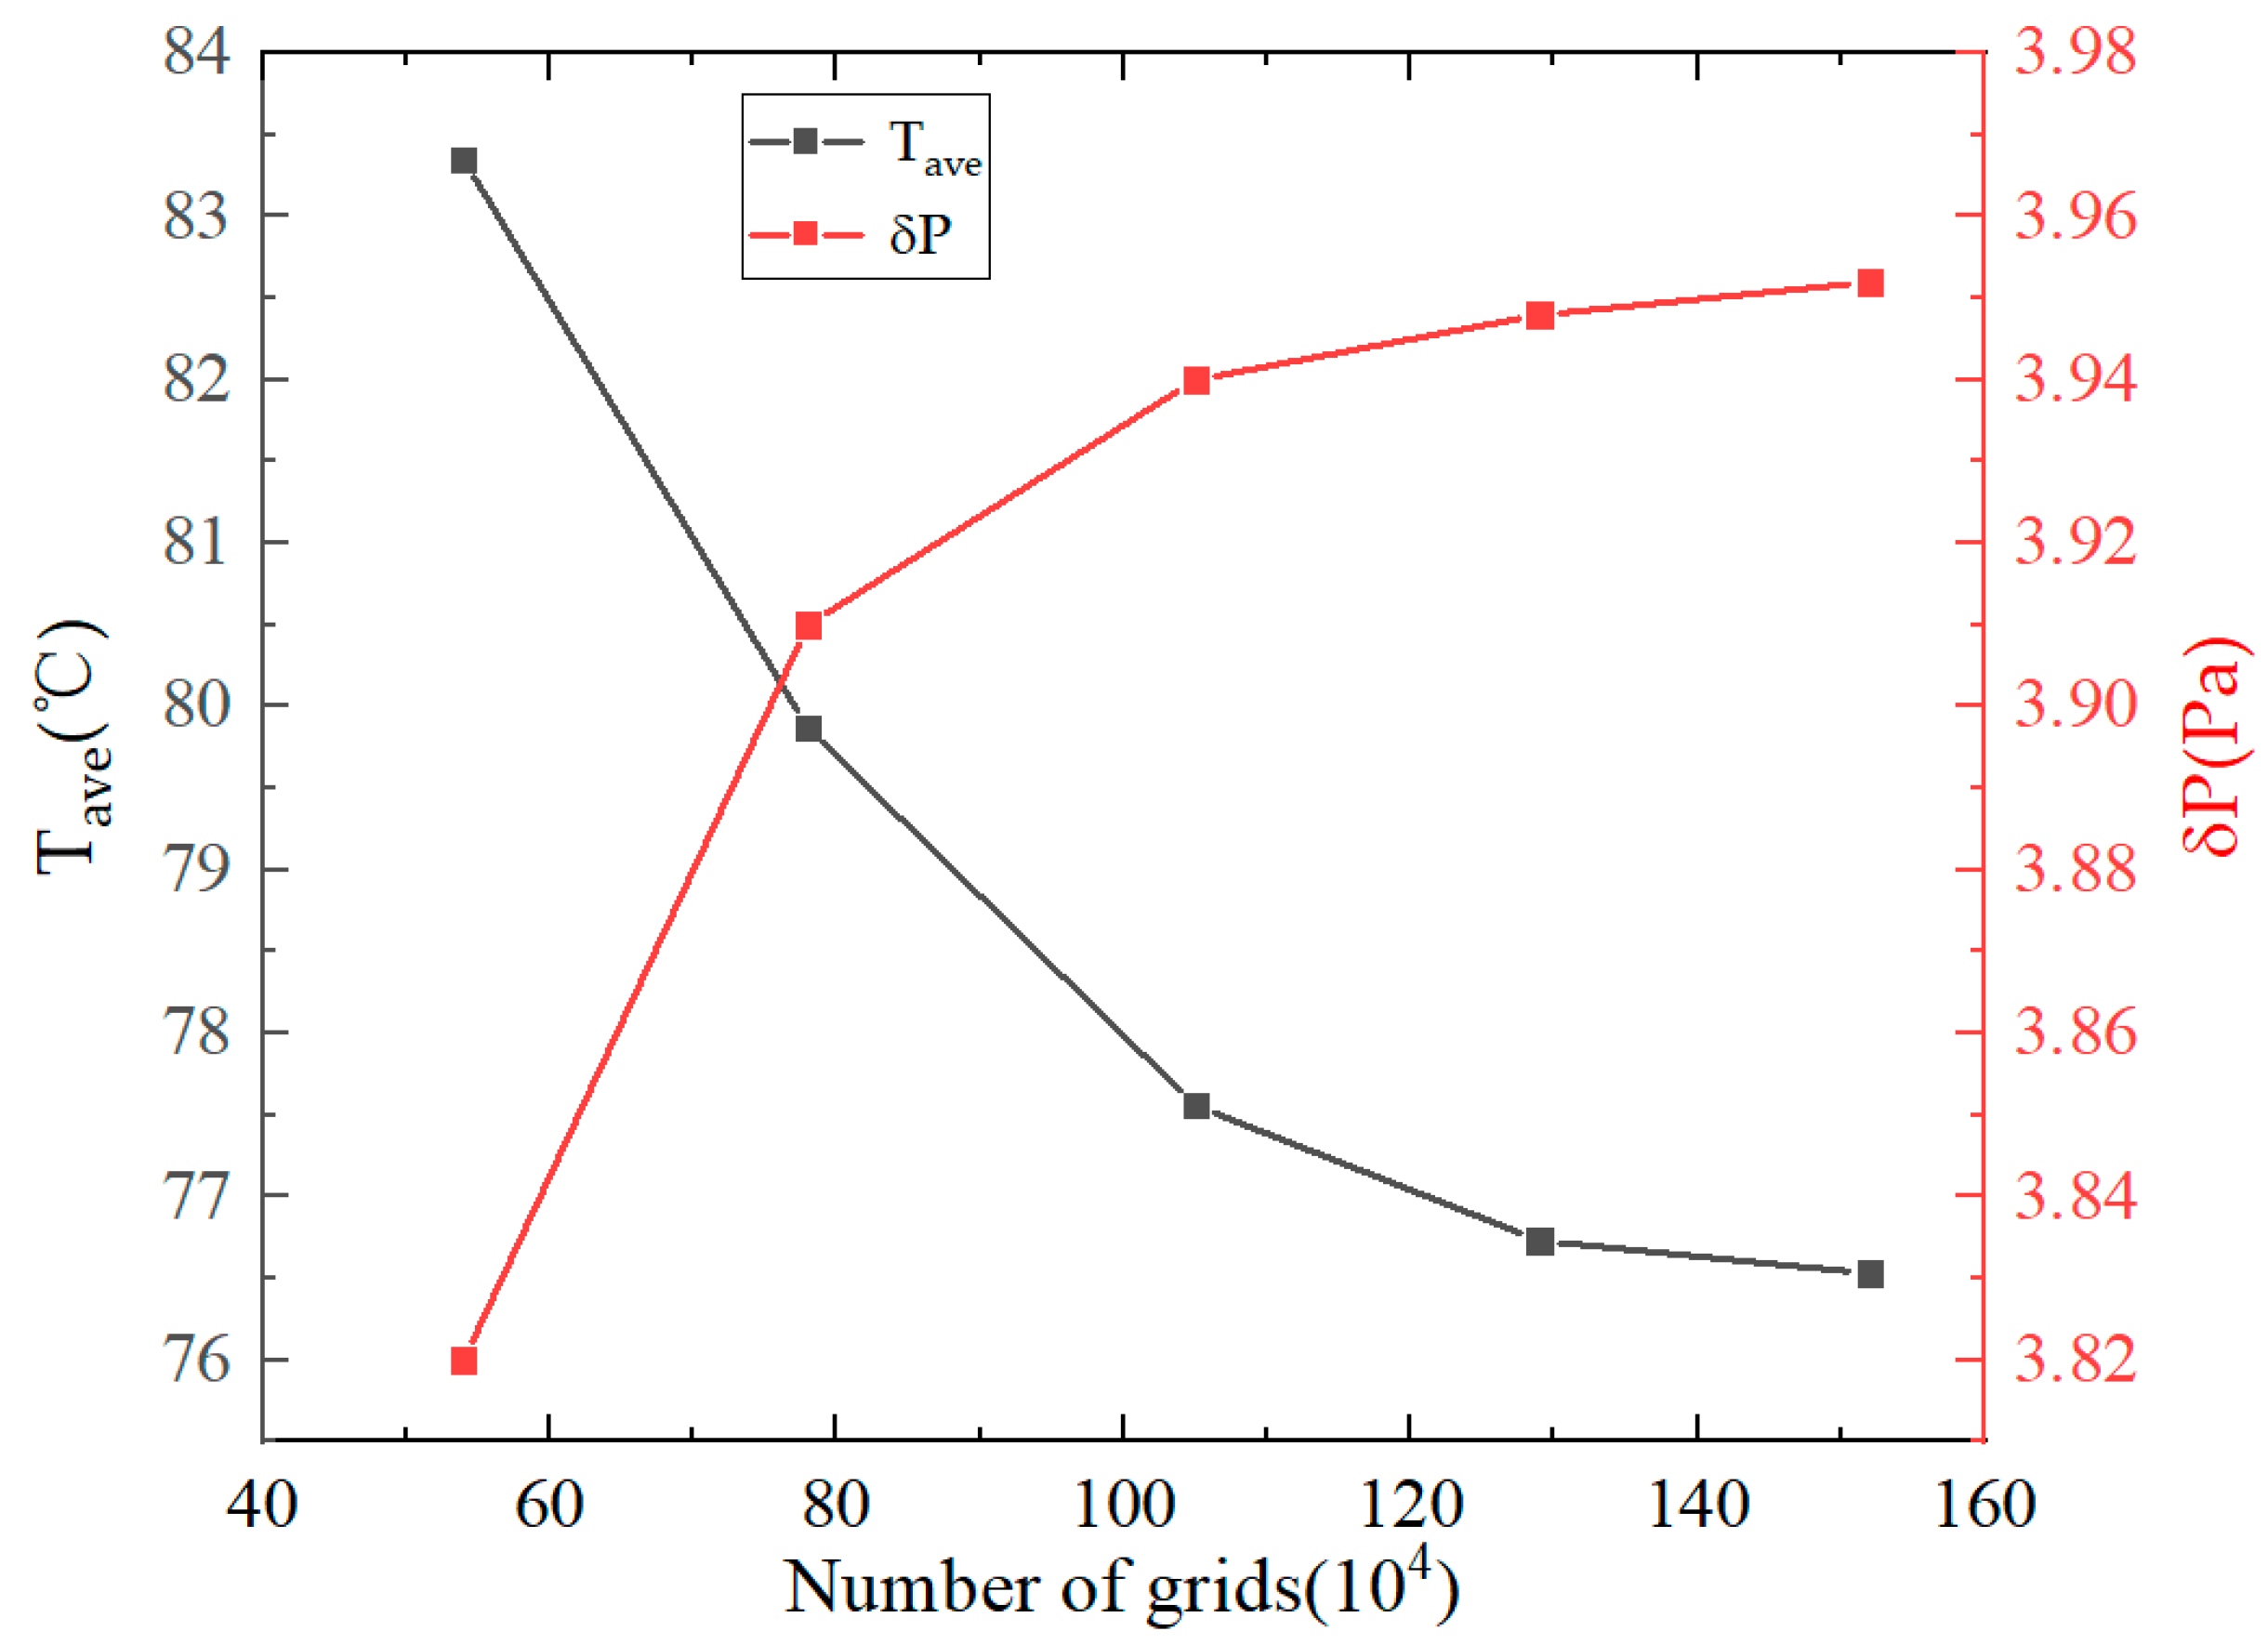
As shown in Figure 2, the computational domain was discretized with fully structured hexahedral grids. The boundary layer grid was generated at the wall. To ensure the accuracy of the numerical solution, a grid independence test was needed. The average temperature of heat source Tave and pressure loss δP were used as the evaluation criteria. Figure 3 gives the variation of Tave and δP with the quantity of grid. When the grid number increased to 1,056,720, the evaluation criteria varied little, which indicates that the solution had little relationship with the grid.

2.5. Validation of the Model

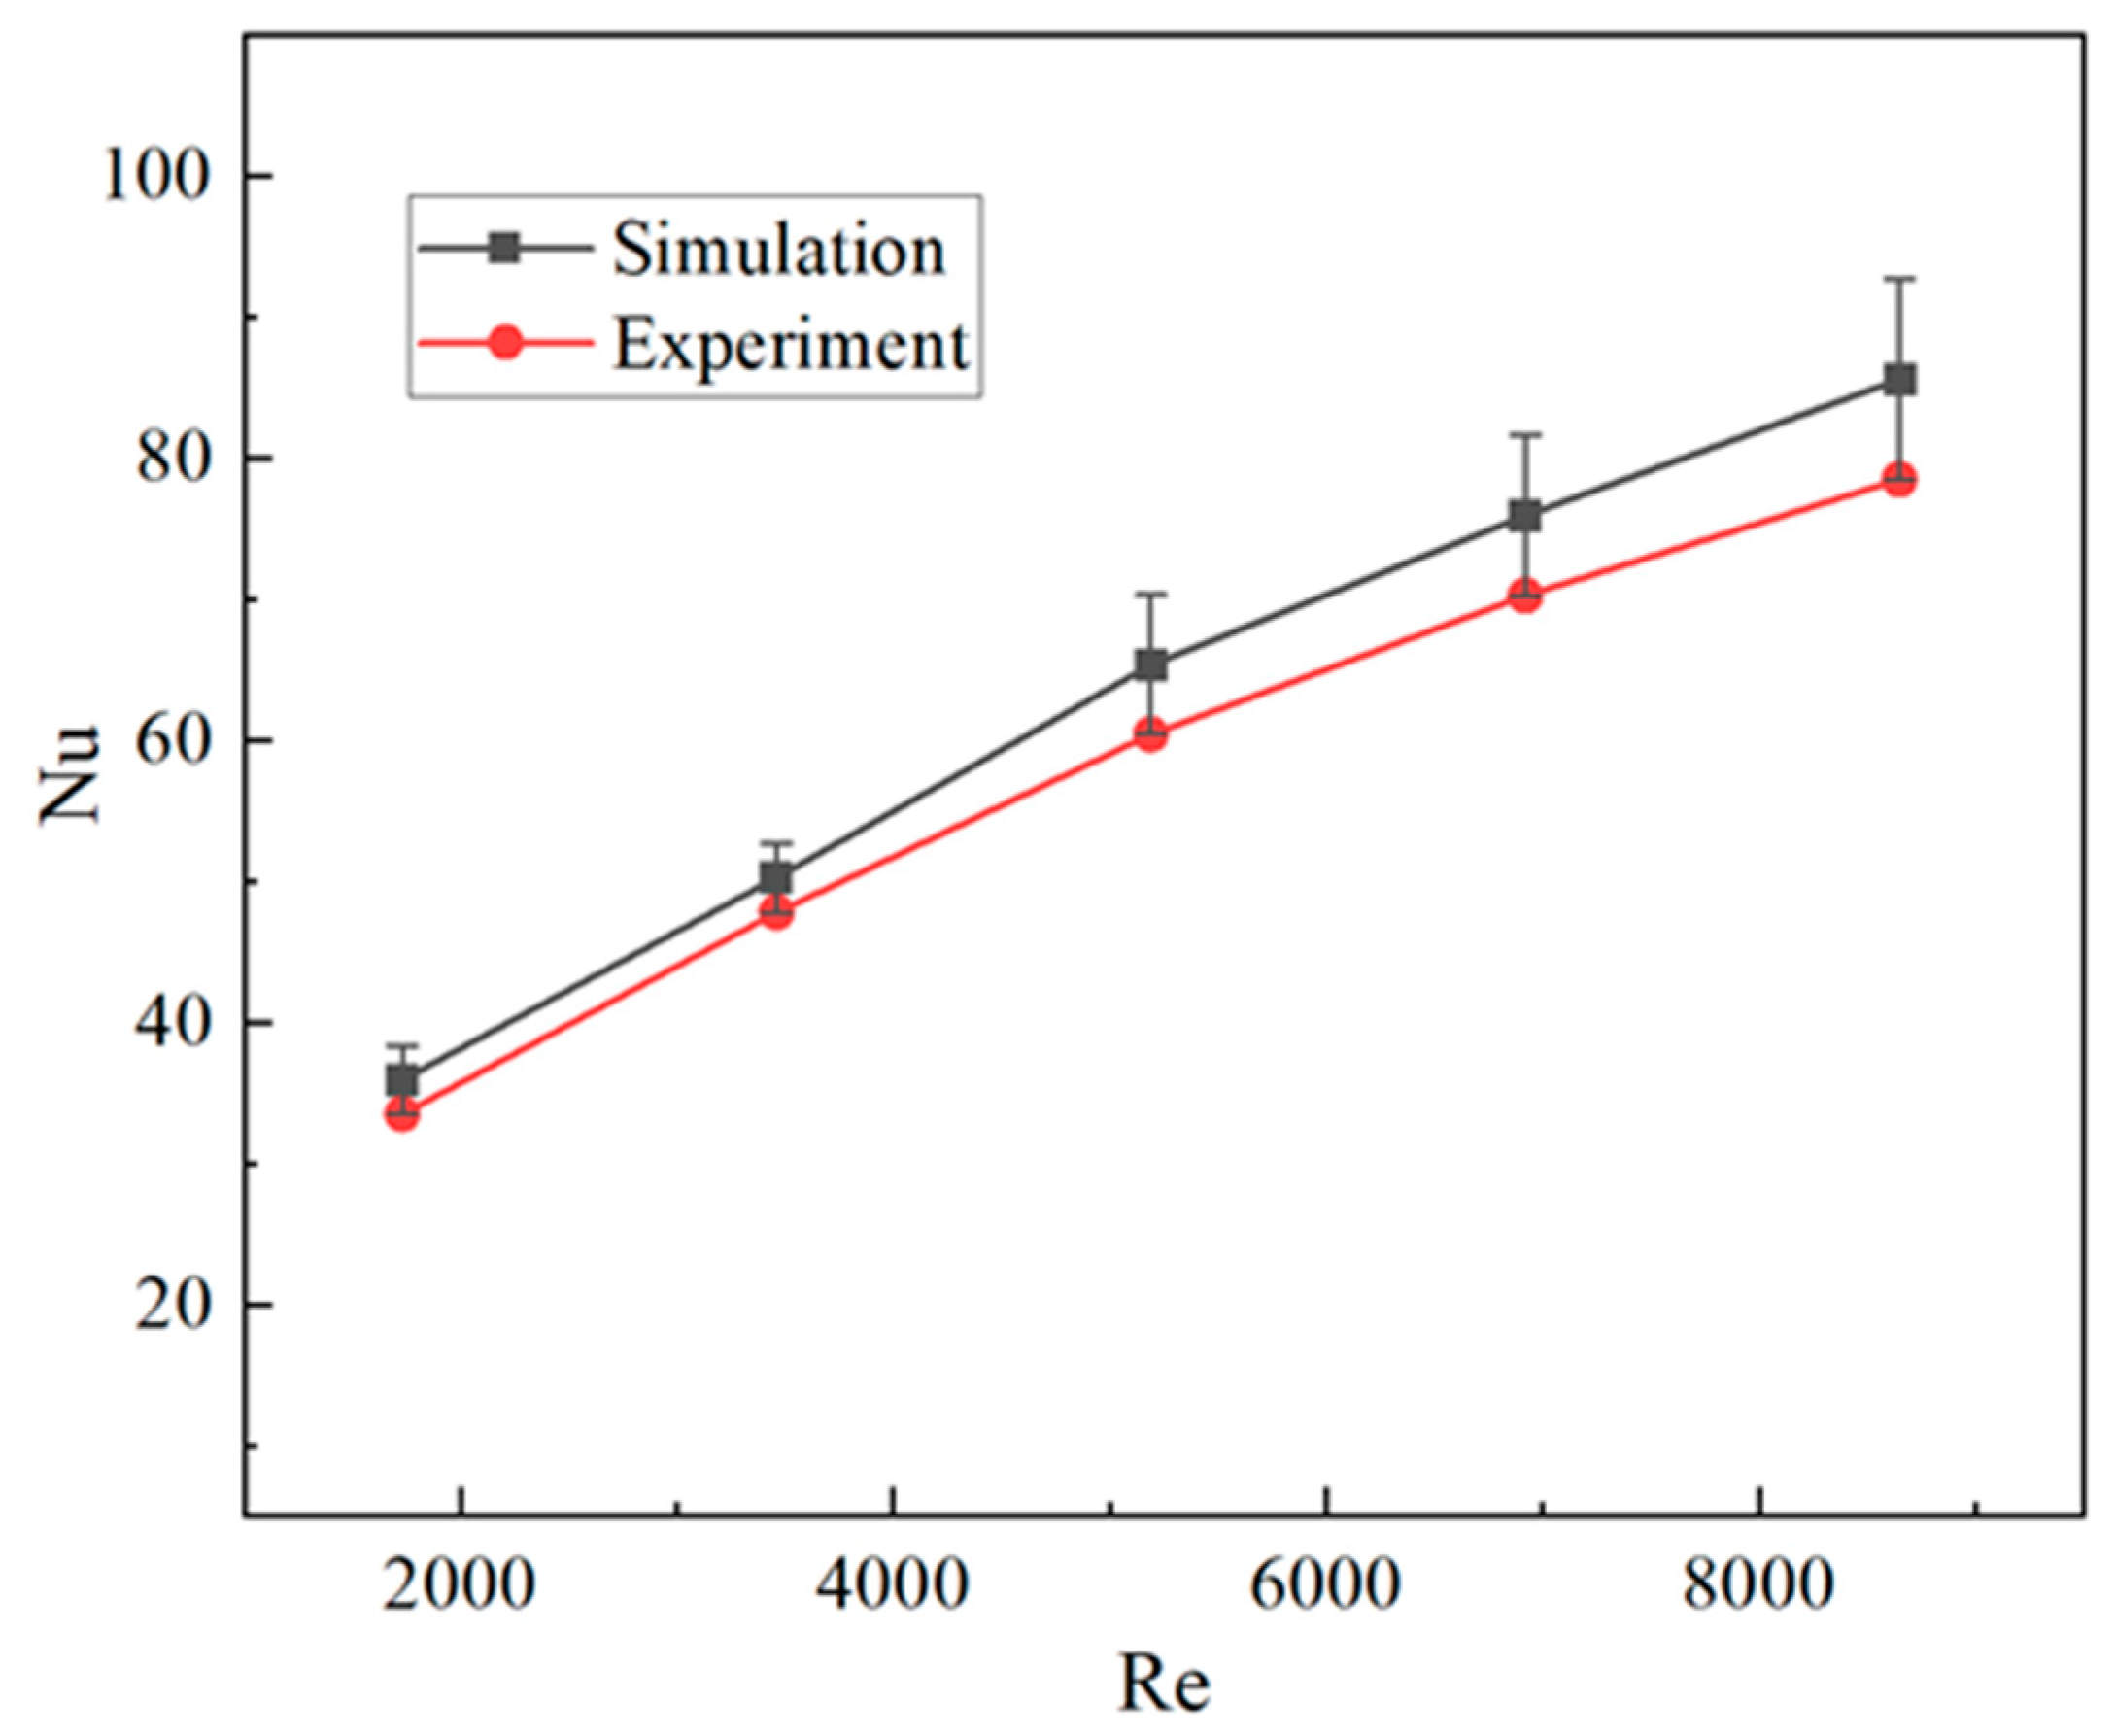
To validate the numerical model, the numerical methods in this work were applied to simulate the experimental case in [30]. The model contained 10 fins on a square base of 45 mm × 45 mm, and the fin thickness was 1 mm. Uncertainties in the reported experimental values of the heat-transfer coefficients and pressure drops were estimated using the method suggested by Moffat [31]. The uncertainties ranged from 3.3 to 7.2% for h, and 2.6–11.2% for ΔP. Figure 4 shows the comparison between the Nusselt number (Nu) and experimental data. The maximum deviation was 9.04%, which validated the model.

3. Numerical Simulation and Orthogonal Analysis

3.1. The Factors and Levels of the Orthogonal Analysis

The orthogonal analysis method can be used in multi-factor and multi-level analyses to improve the calculation efficiency without affecting the results. The orthogonal analysis includes several steps: (a) determine the purpose of analysis; (b) select the evaluation index; (c) select factors and levels; (d) choose the appropriate orthogonal array table; (e) list the analysis plan and related results, (f) discuss results with range analysis; (g) find the optimal combination of factors and levels [26].
This paper aims to study the influence of four structural factors (substrate thickness B, number of fins N, thickness of fin W, and height of fin H) on the effects of heat dissipation. The maximum temperature of the heat sink was used as the evaluation index.
Level is the value of variables investigated within the scope of the analysis. Four levels indicate that four variables were selected for this factor. The factor levels of the orthogonal analysis are illustrated in Table 2.

3.2. Orthogonal Array

The core of an orthogonal analysis is to design an orthogonal array composed of the factors and levels. Four free parameters were investigated, and each parameter has four levels in this paper. Accordingly, a standard L16(45) orthogonal array was selected. Table 3 shows the orthogonal array, which consisted of 16 cases.
In L16(45), L refers to the orthogonal array. The number 16 represents that the main part of the table has 16 rows, which indicates that the orthogonal array requires 16 cases. The number 4 represents that each factor investigated has four levels. Moreover, the number 5 indicates that the table has five columns; that is, there can be up to five factors in the orthogonal design. Considering that the investigation only involves four factors, the sixth column is chosen as blank column for error evaluation. The error factor is added into the mathematical description to account for possible interactions of the original four factors, as well as other possible sources of errors and uncertainties [32]. Each row in the table corresponds to one case, in which the numbers ‘‘1, 2, 3, 4” respectively represent different levels of each factor. It can be seen from the orthogonal array that for any column, all four levels ‘‘1, 2, 3, 4” have the same frequency. The cases of the orthogonal analysis are more representative, and can be uniformly distributed in the research area.

3.3. Range Analysis

Range analysis can provide guidance for evaluating the main effects and performance expected at the optimum condition. Kij is the sum of the maximum temperature for level i (i = 1, 2, 3, 4) under factor j (j = B, N, W, H), kij is the mean value of Kij and is used to determine the optimal level and the optimal combination of factors.
Take factor N as an example, as shown in Equation (7). Other j values of the factors can be determined by the same calculation steps:
K 1 N = T 1 + T 5 + T 9 + T 13 ; k 1 N = K 1 N / 4 ; K 2 N = T 2 + T 6 + T 10 + T 14 ; k 2 N = K 2 N / 4 ; K 3 N = T 3 + T 7 + T 11 + T 15 ; k 3 N = K 3 N / 4 ; K 4 N = T 4 + T 8 + T 12 + T 16 ; k 4 N = K 4 N / 4 ;
where KiN is the K value of the i level of the factor N.
Rj represents the range, which is the difference between the maximum and minimum values of kij. It reflects the order of importance of the factors. A large range indicates that the change of this factor had a greater impact on the results.
R j = max ( k 1 j , k 2 j , k 3 j , k 4 j ) min ( k 1 j , k 2 j , k 3 j , k 4 j )
where j = B, N, W, H.

4. Results and Discussion

4.1. Solutions of the Cases

For the numerical simulation method in Section 2, Table 4 gives the maximum temperature of the model. For the 16 cases, the maximum temperature of each case is expressed as Ti (i = 1, 2, …, 16).
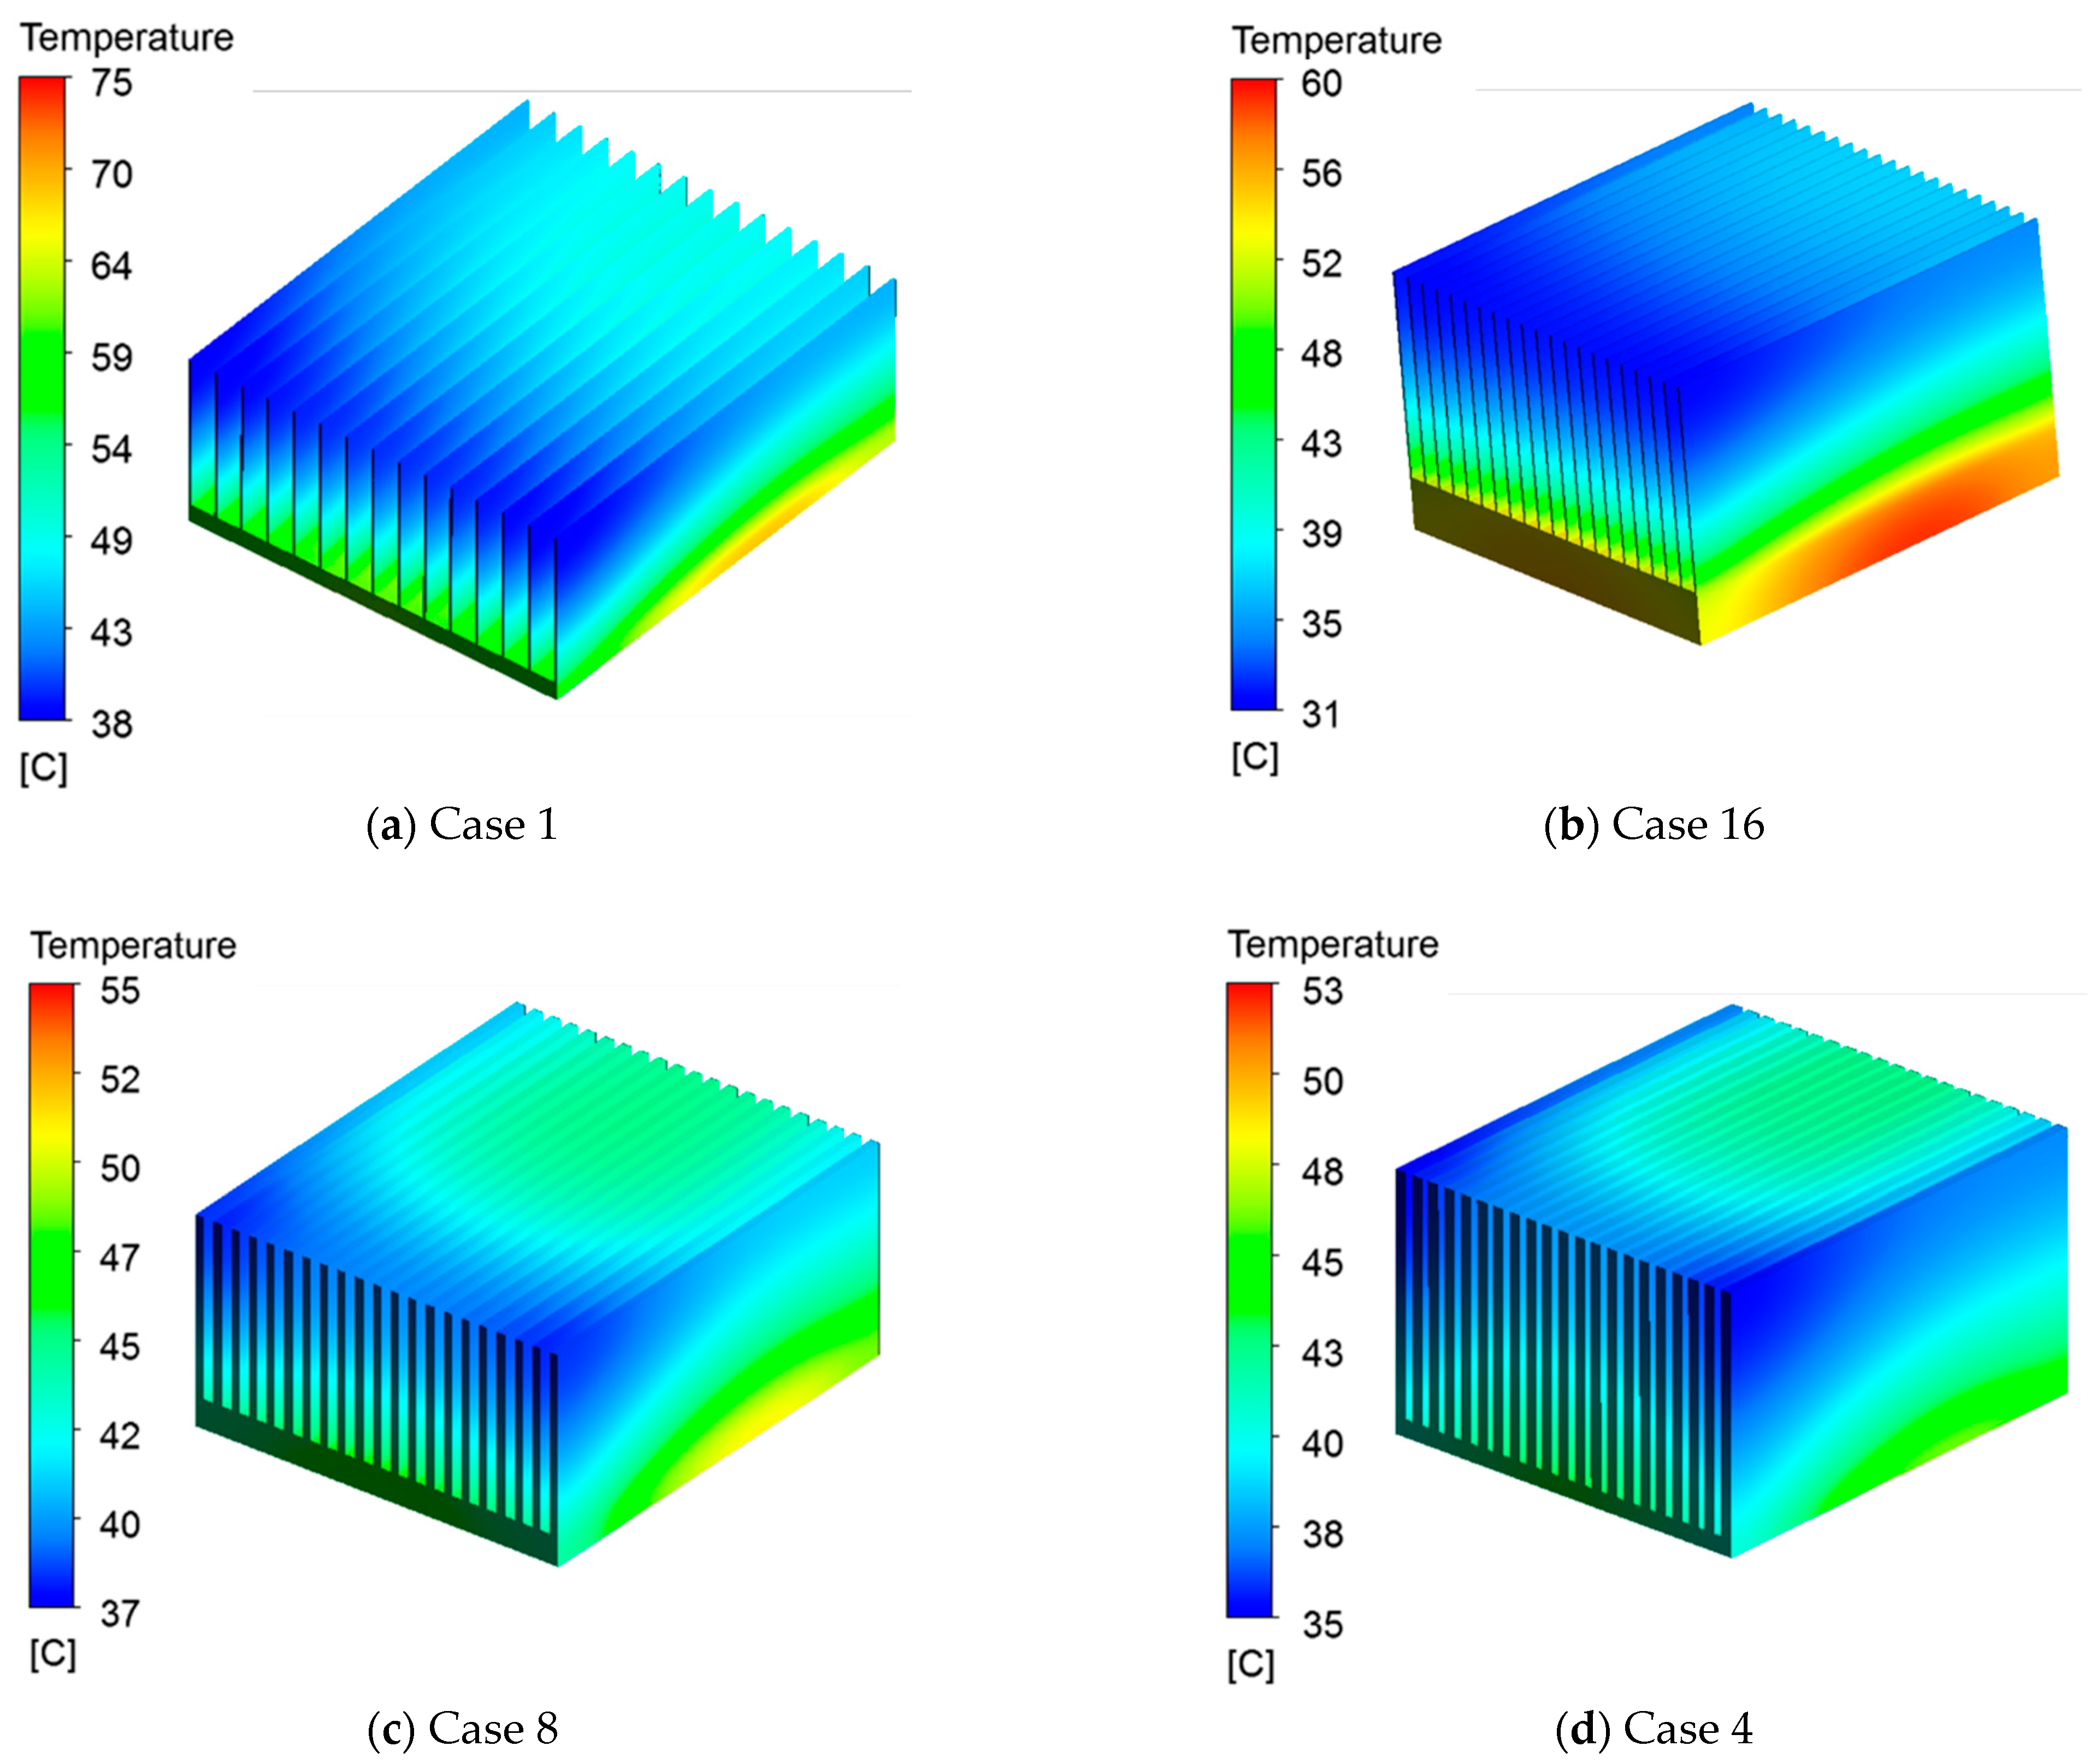
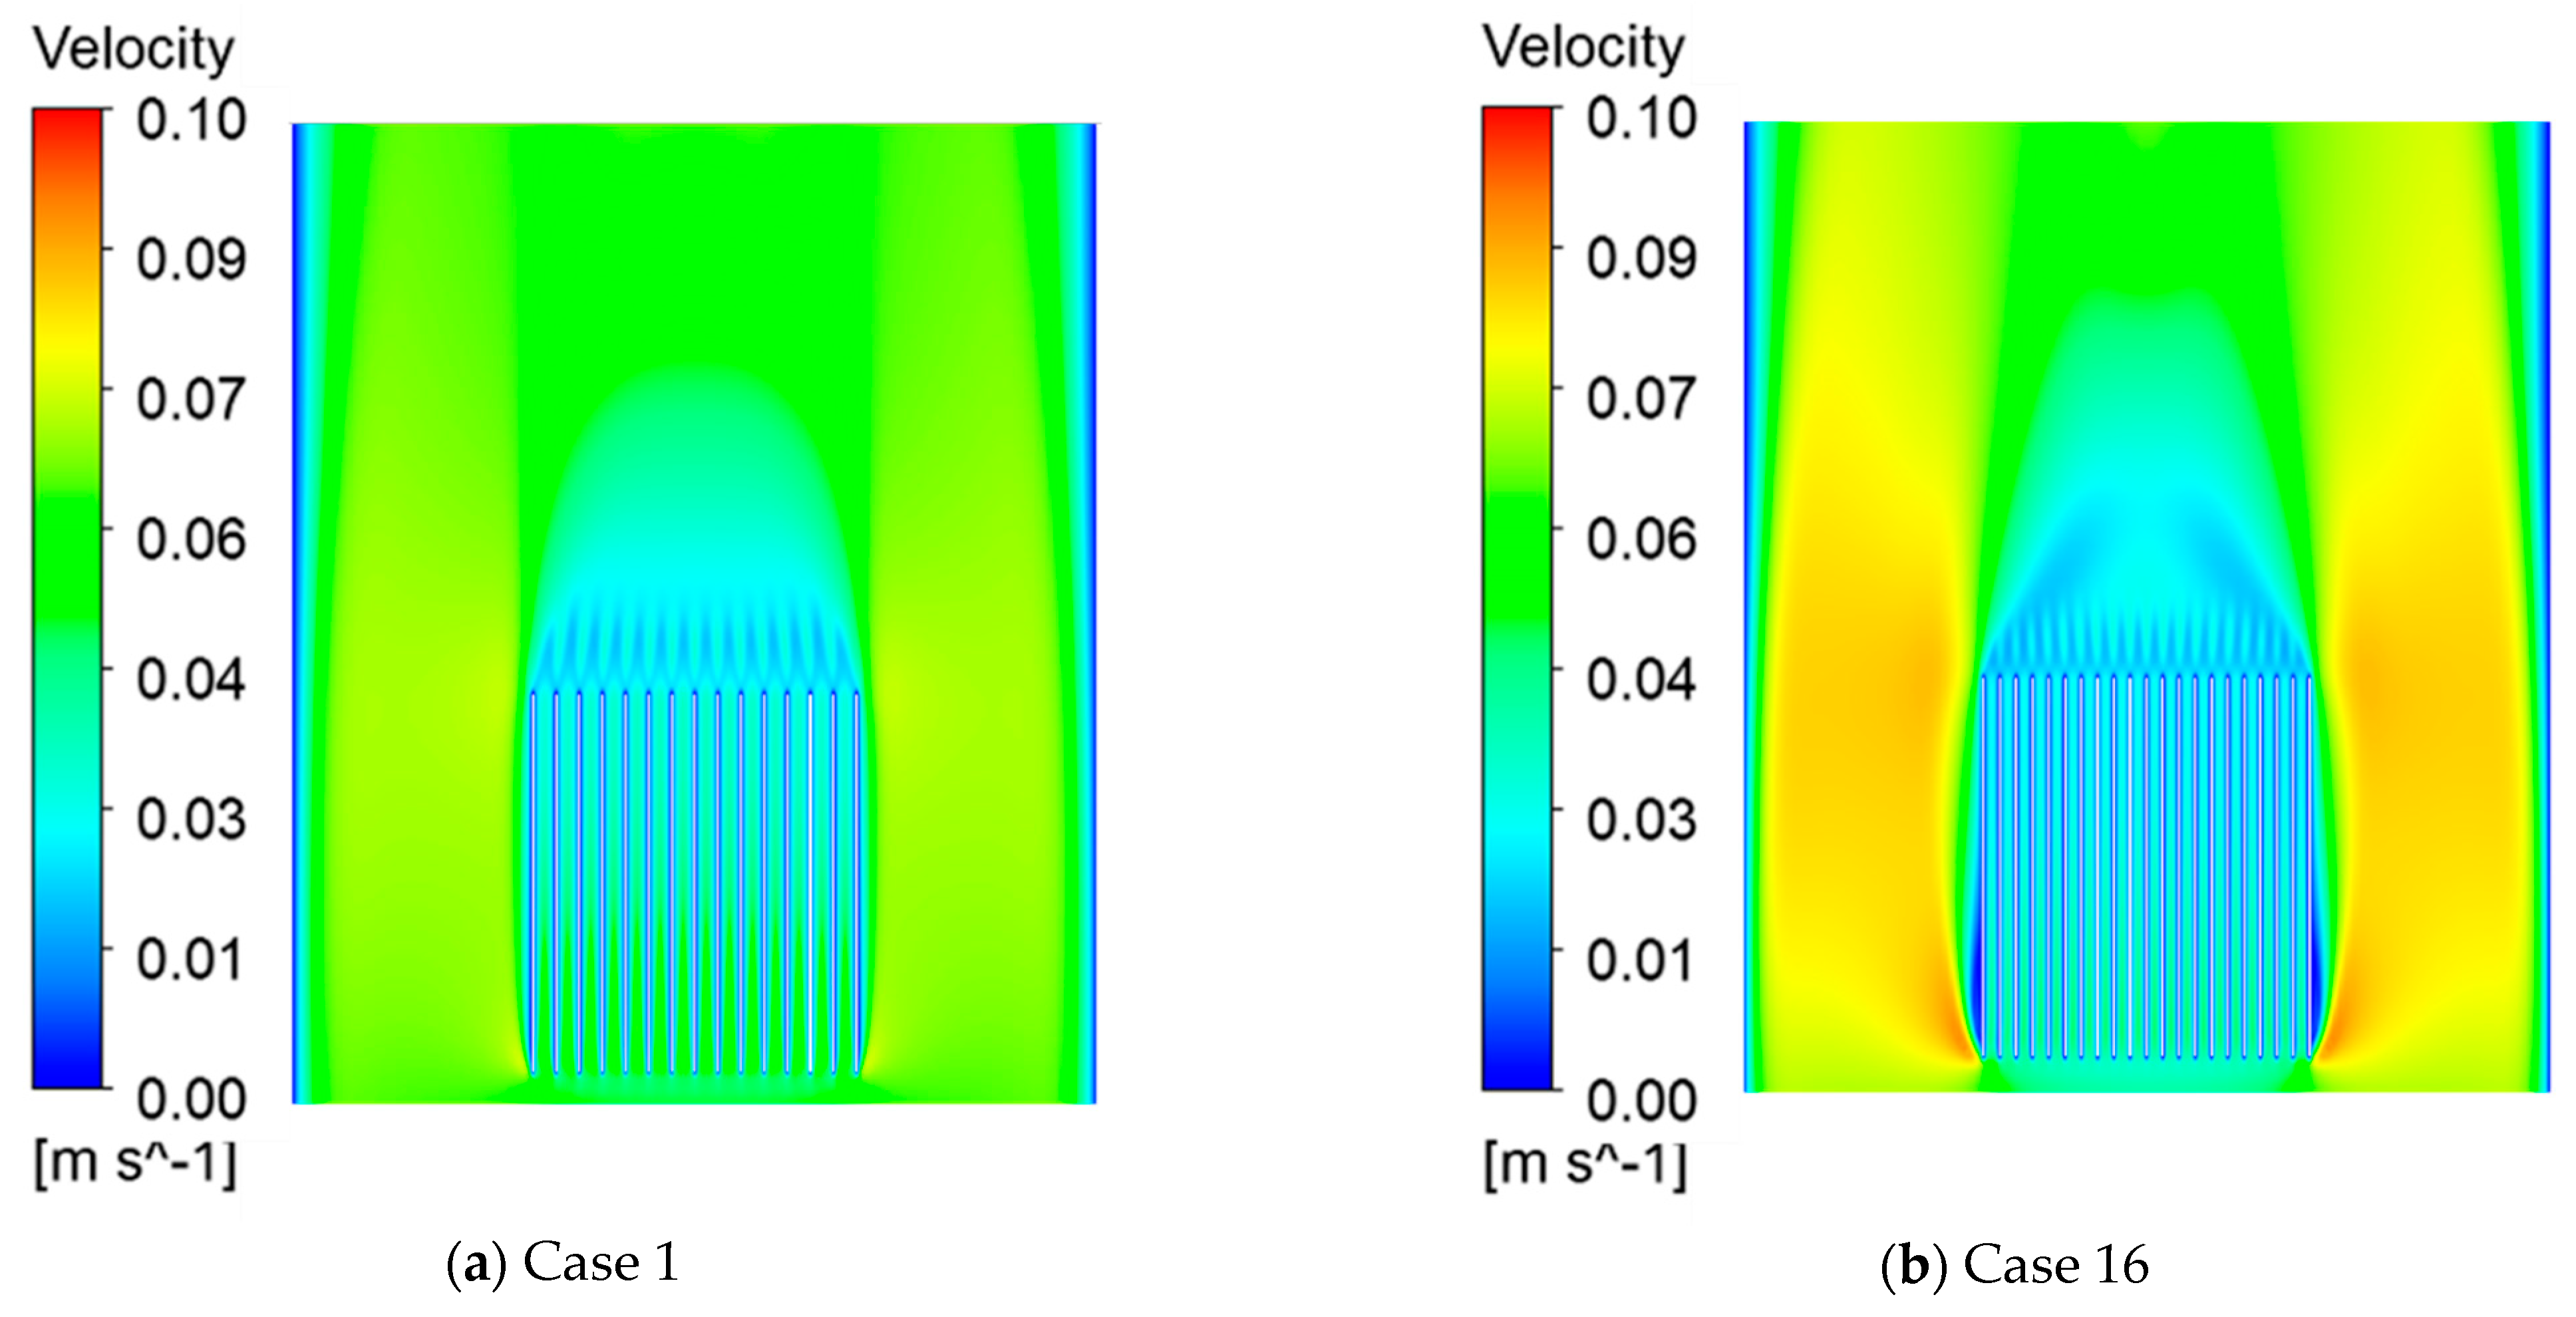
The maximum temperatures of 16 cases were ranked as shown in Table 4. It was found that the maximum temperature of Case 1 was the maximum. For Case 1 shown in Figure 5a, it had the minimum number of fins and the minimum fin height, so it had a smaller heat-transfer area with coolant. Since the fin thickness was small and the channel width was large, flow velocity was very gentle and the heat transfer also was reduced. The fin thickness was 0.5 mm, and the contact area between the bottom of the thin fins and the substrate was small, so the heat was difficult to transfer from the substrate to the coolant. We can see in Figure 6a that the channel width (Wc) was large and the flow velocity was very gentle. Figure 7a shows that the coolant flowing through the heat sink had a lower temperature due to the small heat-transfer area.
Figure 5b shows the temperature distribution of the heat sink in Case 16, which was 18.4 °C lower than that of Case 1. The fin width of Case 16 was also 0.5 mm; however, the number of fins was 21 and the fin height was 35 mm, so the heat-transfer area with coolant was increased. The contact area between the bottom of the fins and the substrate also increased due to the increase in the number of fins. We can see in Figure 6b that the number of fins was large and the fin spacing was narrow, so the flow velocity of the bypass on both sides of the heat sink increased. Figure 7b shows that the temperature of the coolant had a higher temperature than Case 1 due to the increased heat-transfer area.
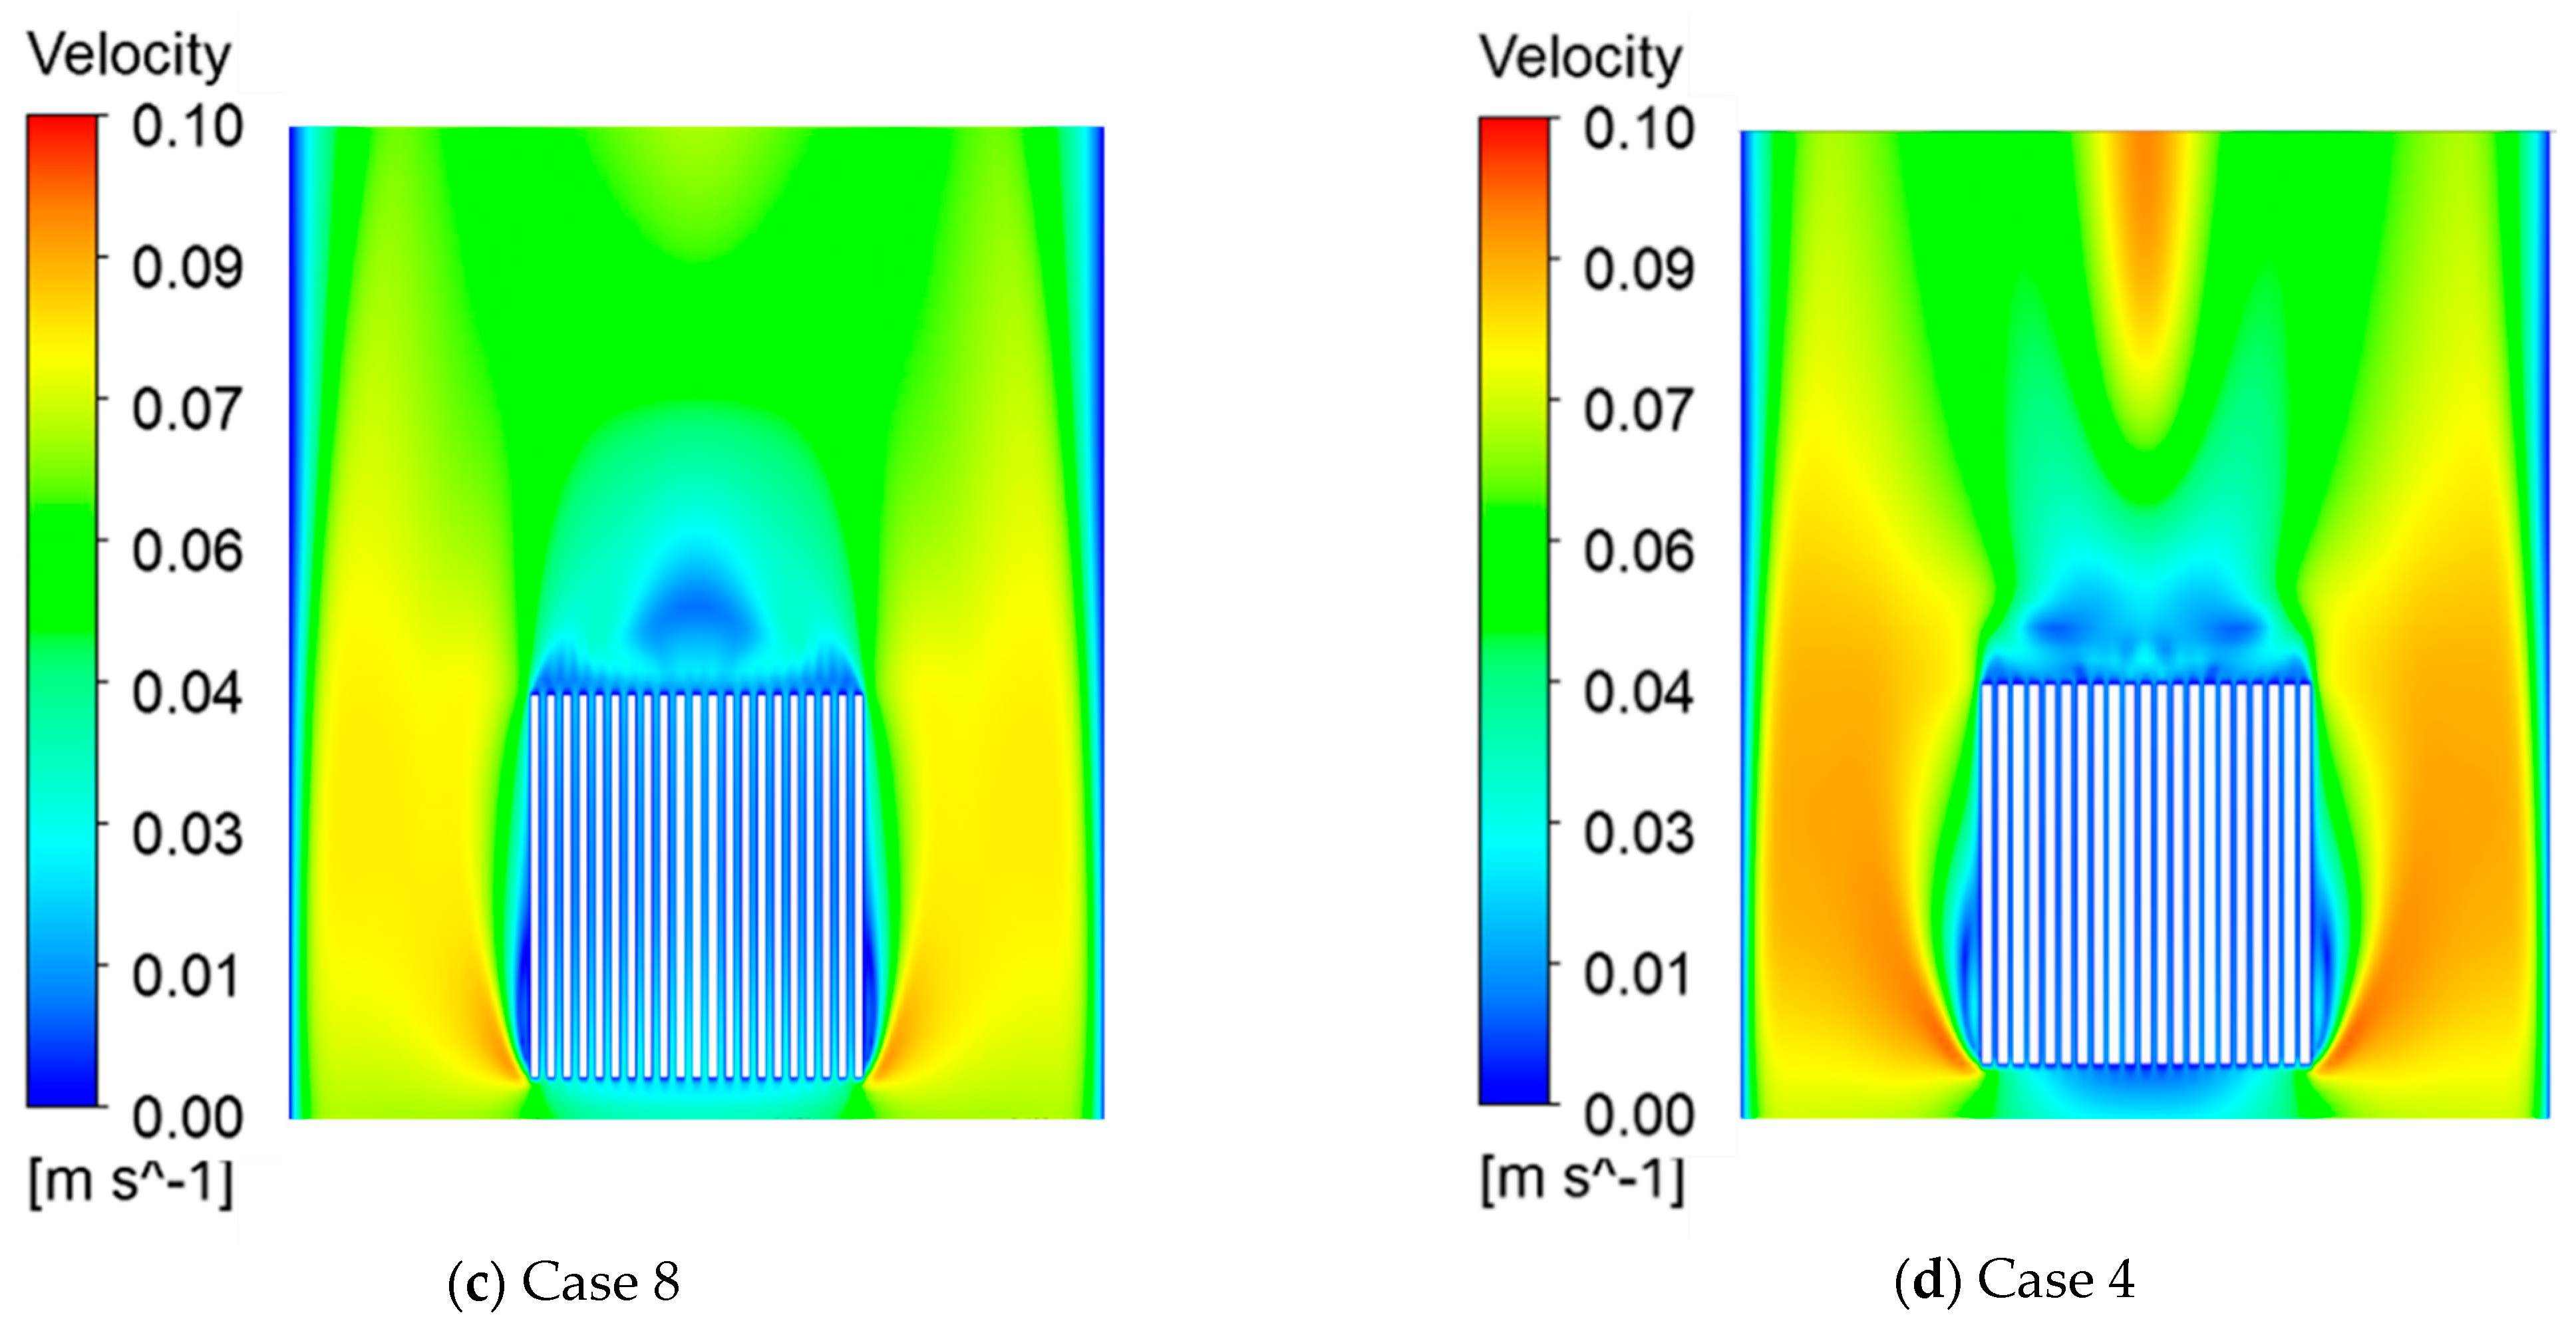
As shown in Figure 5d, Case 4 had the minimum temperature because it has the highest number of fins and a fin height of 40 mm, so it had more heat-transfer area with coolant. The fin width was 2 mm, so it could transfer heat from the substrate to the fins timely. Figure 6d and Figure 7d show the velocity distribution and temperature distribution of Case 4.

4.2. Range Analysis

According to the Section 3.3, Table 5 shows the values of kij and Rj. For all factors, the range value of W was the maximum of 13.99, which indicated that W was the most important factor affecting the maximum temperature. The range value of N was 8.89, which is the second-most important parameter influencing the temperature. H was smaller (4.96) and B was the smallest (3.42), which means that the thickness of the substrate had a slight impact on the maximum temperature. In conclusion, the order of importance of the four factors on the maximum temperature is thickness of fins, number of fins, height of fins, and substrate thickness.

4.3. Integrated Performance Analysis

According to the above calculation, the maximum temperature of Case 4 was the lowest. However, the mass of the heat sink was also an important parameter. Therefore, both the maximum temperature and the mass of the heat sink were considered as indexes. On this basis, the two-objective problem can be converted to a single-objective function F [33].
F = α f T + β f M
where fT is temperature function, fM is mass function, and α and β are the weight coefficient; α + β = 1. The weight coefficient lies on the importance of the objective function. In this paper, the thermal performance of heat sink was the most concerned, while mass was secondary. The mass was not considered until the temperature of the heat sink was acceptable. Thus, we took α is 0.75 and β is 0.25.
As the two objective functions have different units and orders of magnitude, the results of temperature and mass are normalized in the range of 0 and 1 by Equations (10) and (11) [34]. A larger normalization result can indicate better performance, while the best normalization result will be equal to 1.
f T = t max t t max t min
f M = m max m m max m min
where tmin is the minimum value of the maximum temperature, tmax is the maximum value of the maximum temperature, t is the maximum temperature of each case, mmin is the minimum value of the maximum mass, mmax is the maximum value of the maximum mass, and m is the mass of each case.
The calculation results are shown in Table 6.
Table 6 shows the analysis of integrated performance index. Case 8 had the highest integrated performance score of 0.85, which is optimal. Compared with Case 4, the maximum temperature increased by 4.5%, but the mass was reduced by 19%. The optimal combination scheme of the factors and levels could be achieved as shown in Table 7. Figure 5c, Figure 6c and Figure 7c show the temperature distribution and velocity distribution of Case 8.

5. Conclusions

With the development of the information industry, immersion liquid-cooling shows great potential in the thermal management of electronic components. Heat sinks play an important role in liquid cooling, so this paper considered the influences of four factors (substrate thickness, number of fins, thickness of fins, and height of fins) on heat-transfer performance to improve its efficiency.
To improve the calculation efficiency, the orthogonal analysis method was used, and 16 representative cases were designed based on orthogonal arrays. It selected the maximum temperature of each case as the index when using the dielectric coolant using numerical simulation.
Through range analysis, we concluded that the order of importance of the four factors on the maximum temperature of heat sink is thickness of fins, number of fins, height of fins, and substrate thickness. Heat sinks should have enough fins at a certain thickness. The results showed that Case 4 had the minimum temperature of the 16 cases, but consumed too much material. Thus, taking both the maximum temperature and the mass of the heat sink as indexes obtained the optimal structure (substrate thickness 5 mm, number of fins 21, thickness of fin 1.5 mm, and height of fin 30 mm.) by weighting the maximum temperature (0.75) and mass (0.25). The mass of the optimal heat sink was reduced by 19% under the condition of ensuring thermal performance when considering the mass index.

Author Contributions

Methodology, W.S.; Project administration, Z.C.; Resources, Q.C.; Writing—original draft, B.L.; Writing—review & editing, Z.C., Q.C. and W.S. All authors have read and agreed to the published version of the manuscript.

Funding

Major Science and Technological Innovation Projects of Shandong Province (No. 2019SDZY05), Open Fund of Science and Technology on Thermal Energy and Power Laboratory (No. TPL2019B01), Fundamental Research Funds of Shandong University (No. 32240072064035), and Natural Science Foundation of Shandong Province (No. 32240005201901).

Institutional Review Board Statement

Not applicable.

Informed Consent Statement

Not applicable.

Data Availability Statement

Data is contained within the article.

Acknowledgments

This work was supported by the Major Science and Technological Innovation Projects of Shandong Province (No. 2019SDZY05), Open Fund of Science and Technology on Thermal Energy and Power Laboratory (No. TPL2019B01), Fundamental Research Funds of Shandong University (No. 32240072064035), and Natural Science Foundation of Shandong Province (No. 32240005201901).

Conflicts of Interest

The authors declare no conflict of interest.

Nomenclature

Bthickness of substrate
Cpspecific heat capacity of fluid
Fintegrated performance index
fproportion factor
ggravitational acceleration
Hheight
kthermal conductivity of solid
L1length
L2width
Nnumber of fins
ppressure
qwheat flux
Rjrange
Tmaxmaximum temperature
Tftemperature of fluid
Tstemperature of solid
u, v, wvelocity
x, y, zspatial coordinates
Greek Symbols
α, βweight coefficient
λthermal conductivity of fluid
ρdensity
μdynamic viscosity

References

  1. Wei, J. Challenges in Cooling Design of CPU Packages for High-Performance Servers. Heat Transf. Eng. 2008, 29, 178–187. [Google Scholar] [CrossRef]
  2. Bailey, C. Thermal Management Technologies for Electronic Packaging: Current Capabilities and Future Challenges for Modelling Tools. In Proceedings of the 2008 10th Electronics Packaging Technology Conference, Singapore, 9–12 December 2008; pp. 527–532. [Google Scholar]
  3. Siricharoenpanich, A.; Wiriyasart, S.; Srichat, A.; Naphon, P. Thermal management system of CPU cooling with a novel short heat pipe cooling system. Case Stud. Therm. Eng. 2019, 15, 100545. [Google Scholar] [CrossRef]
  4. Li, F.; Ma, Q.; Xin, G.; Zhang, J.; Wang, X. Heat transfer and flow characteristics of microchannels with solid and porous ribs. Appl. Therm. Eng. 2020, 178, 115639. [Google Scholar] [CrossRef]
  5. Gagliano, S.; Cairone, F.; Amenta, A.; Bucolo, M. A Real Time Feed forward Control of Slug Flow in Microchannels. Energies 2019, 12, 2556. [Google Scholar] [CrossRef] [Green Version]
  6. Laguna, G.; Vilarrubí, M.; Ibañez, M.; Betancourt, Y.; Illa, J.; Azarkish, H.; Amnache, A.; Collin, L.; Coudrain, P.; Fréchette, L.; et al. Numerical parametric study of a hotspot-targeted micro-fluidic cooling array for microelectronics. Appl. Therm. Eng. 2018, 144, 71–80. [Google Scholar] [CrossRef]
  7. Anandan, P.; Gagliano, S.; Bucolo, M. Computational models in microfluidic bubble logic. Microfluid. Nanofluidics 2014, 18, 305–321. [Google Scholar] [CrossRef]
  8. Zhang, K.; Li, M.-J.; Wang, F.-L.; He, Y.-L. Experimental and numerical investigation of natural convection heat transfer of W-type fin arrays. Int. J. Heat Mass Transf. 2020, 152, 119315. [Google Scholar] [CrossRef]
  9. Naserian, M.M.; Fahiminia, M.; Goshayeshi, H.R. Experimental and numerical analysis of natural convection heat transfer coefficient of V-type fin configurations. J. Mech. Sci. Technol. 2013, 27, 2191–2197. [Google Scholar] [CrossRef]
  10. Altun, A.H.; Ziylan, O. Experimental investigation of the effects of horizontally oriented vertical sinusoidal wavy fins on heat transfer performance in case of natural convection. Int. J. Heat Mass Transf. 2019, 139, 425–431. [Google Scholar] [CrossRef]
  11. Nilpueng, K.; Ahn, H.S.; Jerng, D.-W.; Wongwises, S. Heat transfer and flow characteristics of sinusoidal wavy plate fin heat sink with and without crosscut flow control. Int. J. Heat Mass Transf. 2019, 137, 565–572. [Google Scholar] [CrossRef]
  12. El Ghandouri, I.; El Maakoul, A.; Saadeddine, S.; Meziane, M. Design and numerical investi-gations of natural convection heat transfer of a new rippling fin shape. Appl. Therm. Eng. 2020, 178, 115670. [Google Scholar] [CrossRef]
  13. Shyu, J.-C.; Jheng, J.-S. Heat Transfer Enhancement of Plate-Fin Heat Sinks with Different Types of Winglet Vortex Generators. Energies 2020, 13, 5219. [Google Scholar] [CrossRef]
  14. Shaeri, M.; Yaghoubi, M. Thermal enhancement from heat sinks by using perforated fins. Energy Convers. Manag. 2009, 50, 1264–1270. [Google Scholar] [CrossRef]
  15. Huang, G.-J.; Wong, S.-C.; Lin, C.-P. Enhancement of natural convection heat transfer from horizontal rectangular fin arrays with perforations in fin base. Int. J. Therm. Sci. 2012, 84, 164–174. [Google Scholar] [CrossRef]
  16. Maji, A.; Bhanja, D.; Patowari, P.K. Numerical investigation on heat transfer enhancement of heat sink using perforated pin fins with inline and staggered arrangement. Appl. Therm. Eng. 2017, 125, 596–616. [Google Scholar] [CrossRef]
  17. Tariq, A.; Altaf, K.; Ahmad, S.W.; Hussain, G.; Ratlamwala, T.A.H. Comparative numerical and ex-perimental analysis of thermal and hydraulic performance of improved plate fin heat sinks. Appl. Therm. Eng. 2021, 182, 115949. [Google Scholar]
  18. Yang, Y.-T.; Peng, H.-S. Numerical study of pin-fin heat sink with un-uniform fin height design. Int. J. Heat Mass Transf. 2008, 51, 4788–4796. [Google Scholar] [CrossRef]
  19. Yang, Y.-T.; Peng, H.-S. Numerical study of the heat sink with un-uniform fin width designs. Int. J. Heat Mass Transf. 2009, 52, 3473–3480. [Google Scholar] [CrossRef]
  20. Huang, C.-H.; Chen, Y.-H. An impingement heat sink module design problem in determining simultaneously the optimal non-uniform fin widths and heights. Int. J. Heat Mass Transf. 2014, 73, 627–633. [Google Scholar] [CrossRef]
  21. Huang, C.-H.; Chen, Y.-H.; Li, H.-Y. An impingement heat sink module design problem in determining opti-mal non-uniform fin widths. Int. J. Heat Mass Transf. 2013, 67, 992–1006. [Google Scholar] [CrossRef]
  22. Arshad, A.; Jabbal, M.; Sardari, P.T.; Bashir, M.A.; Faraji, H.; Yan, Y. Transient simulation of finned heat sinks embedded with PCM for electronics cooling. Therm. Sci. Eng. Prog. 2020, 18, 100520. [Google Scholar] [CrossRef]
  23. Ghanbarpour, A.; Hosseini, M.J.; Ranjbar, A.A.; Rahimi, M.; Bahrampoury, R.; Ghanbarpour, M. Evaluation of heat sink per-formance using PCM and vapor chamber/heat pipe. Renew. Energy 2021, 163, 698–719. [Google Scholar] [CrossRef]
  24. Kalbasi, R.; Afrand, M.; Alsarraf, J.; Tran, M.D. Studies on optimum fins number in PCM-based heat sinks. Energy 2019, 171, 1088–1099. [Google Scholar] [CrossRef]
  25. Yazici, M.Y.; Avci, M.; Aydin, O. Combined effects of inclination angle and fin number on thermal perfor-mance of a PCM-based heat sink. Appl. Therm. Eng. 2019, 159, 113956. [Google Scholar] [CrossRef]
  26. Jiaqiang, E.; Han, D.; Qiu, A.; Zhu, H.; Deng, Y.; Chen, J.; Zhao, X.; Zuo, W.; Wang, H.; Chen, J.; et al. Orthogonal experimental design of liquid-cooling structure on the cooling effect of a liq-uid-cooled battery thermal management system. Appl. Therm. Eng. 2018, 132, 508–520. [Google Scholar]
  27. Xiang, J.; Zhang, C.; Zhou, C.; Huang, J.; Liu, G.; Zhao, H. An integrated radial heat sink with thermosiphon for high-power LEDs applications. Heat Mass Transf. 2019, 55, 2455–2467. [Google Scholar] [CrossRef]
  28. Liu, Y.; Wu, R.; Yang, P.; Wang, T.; Liu, H.; Wang, L. Parameter study of the injection configuration in a zero boil-off hydrogen storage tank using orthogonal test design. Appl. Therm. Eng. 2016, 109, 283–294. [Google Scholar] [CrossRef]
  29. Wu, X.; Leung, D.Y. Optimization of biodiesel production from camelina oil using orthogonal experiment. Appl. Energy 2011, 88, 3615–3624. [Google Scholar] [CrossRef]
  30. Yang, K.-S.; Chu, W.-H.; Chen, I.-Y.; Wang, C.-C. A comparative study of the airside performance of heat sinks having pin fin configurations. Int. J. Heat Mass Transf. 2007, 50, 4661–4667. [Google Scholar] [CrossRef]
  31. Moffat, R.J. Describing the uncertainties in experimental results. Exp. Therm. Fluid Sci. 1988, 1, 3–17. [Google Scholar] [CrossRef] [Green Version]
  32. Tang, J.; Gong, G.; Su, H.; Wu, F.; Herman, C. Performance evaluation of a novel method of frost pre-vention and retardation for air source heat pumps using the orthogonal experiment design method. Appl. Energy 2016, 169, 696–708. [Google Scholar] [CrossRef]
  33. Deng, L.; Feng, B.; Zhang, Y. An optimization method for multi-objective and multi-factor designing of a ceramic slurry: Combining orthogonal experimental design with artificial neural networks. Ceram. Int. 2018, 44, 15918–15923. [Google Scholar] [CrossRef]
  34. Chiang, K.-T.; Chang, F.-P.; Tsai, T.-C. Optimum design parameters of Pin-Fin heat sink using the grey-fuzzy logic based on the orthogonal arrays. Int. Commun. Heat Mass Transf. 2006, 33, 744–752. [Google Scholar] [CrossRef]
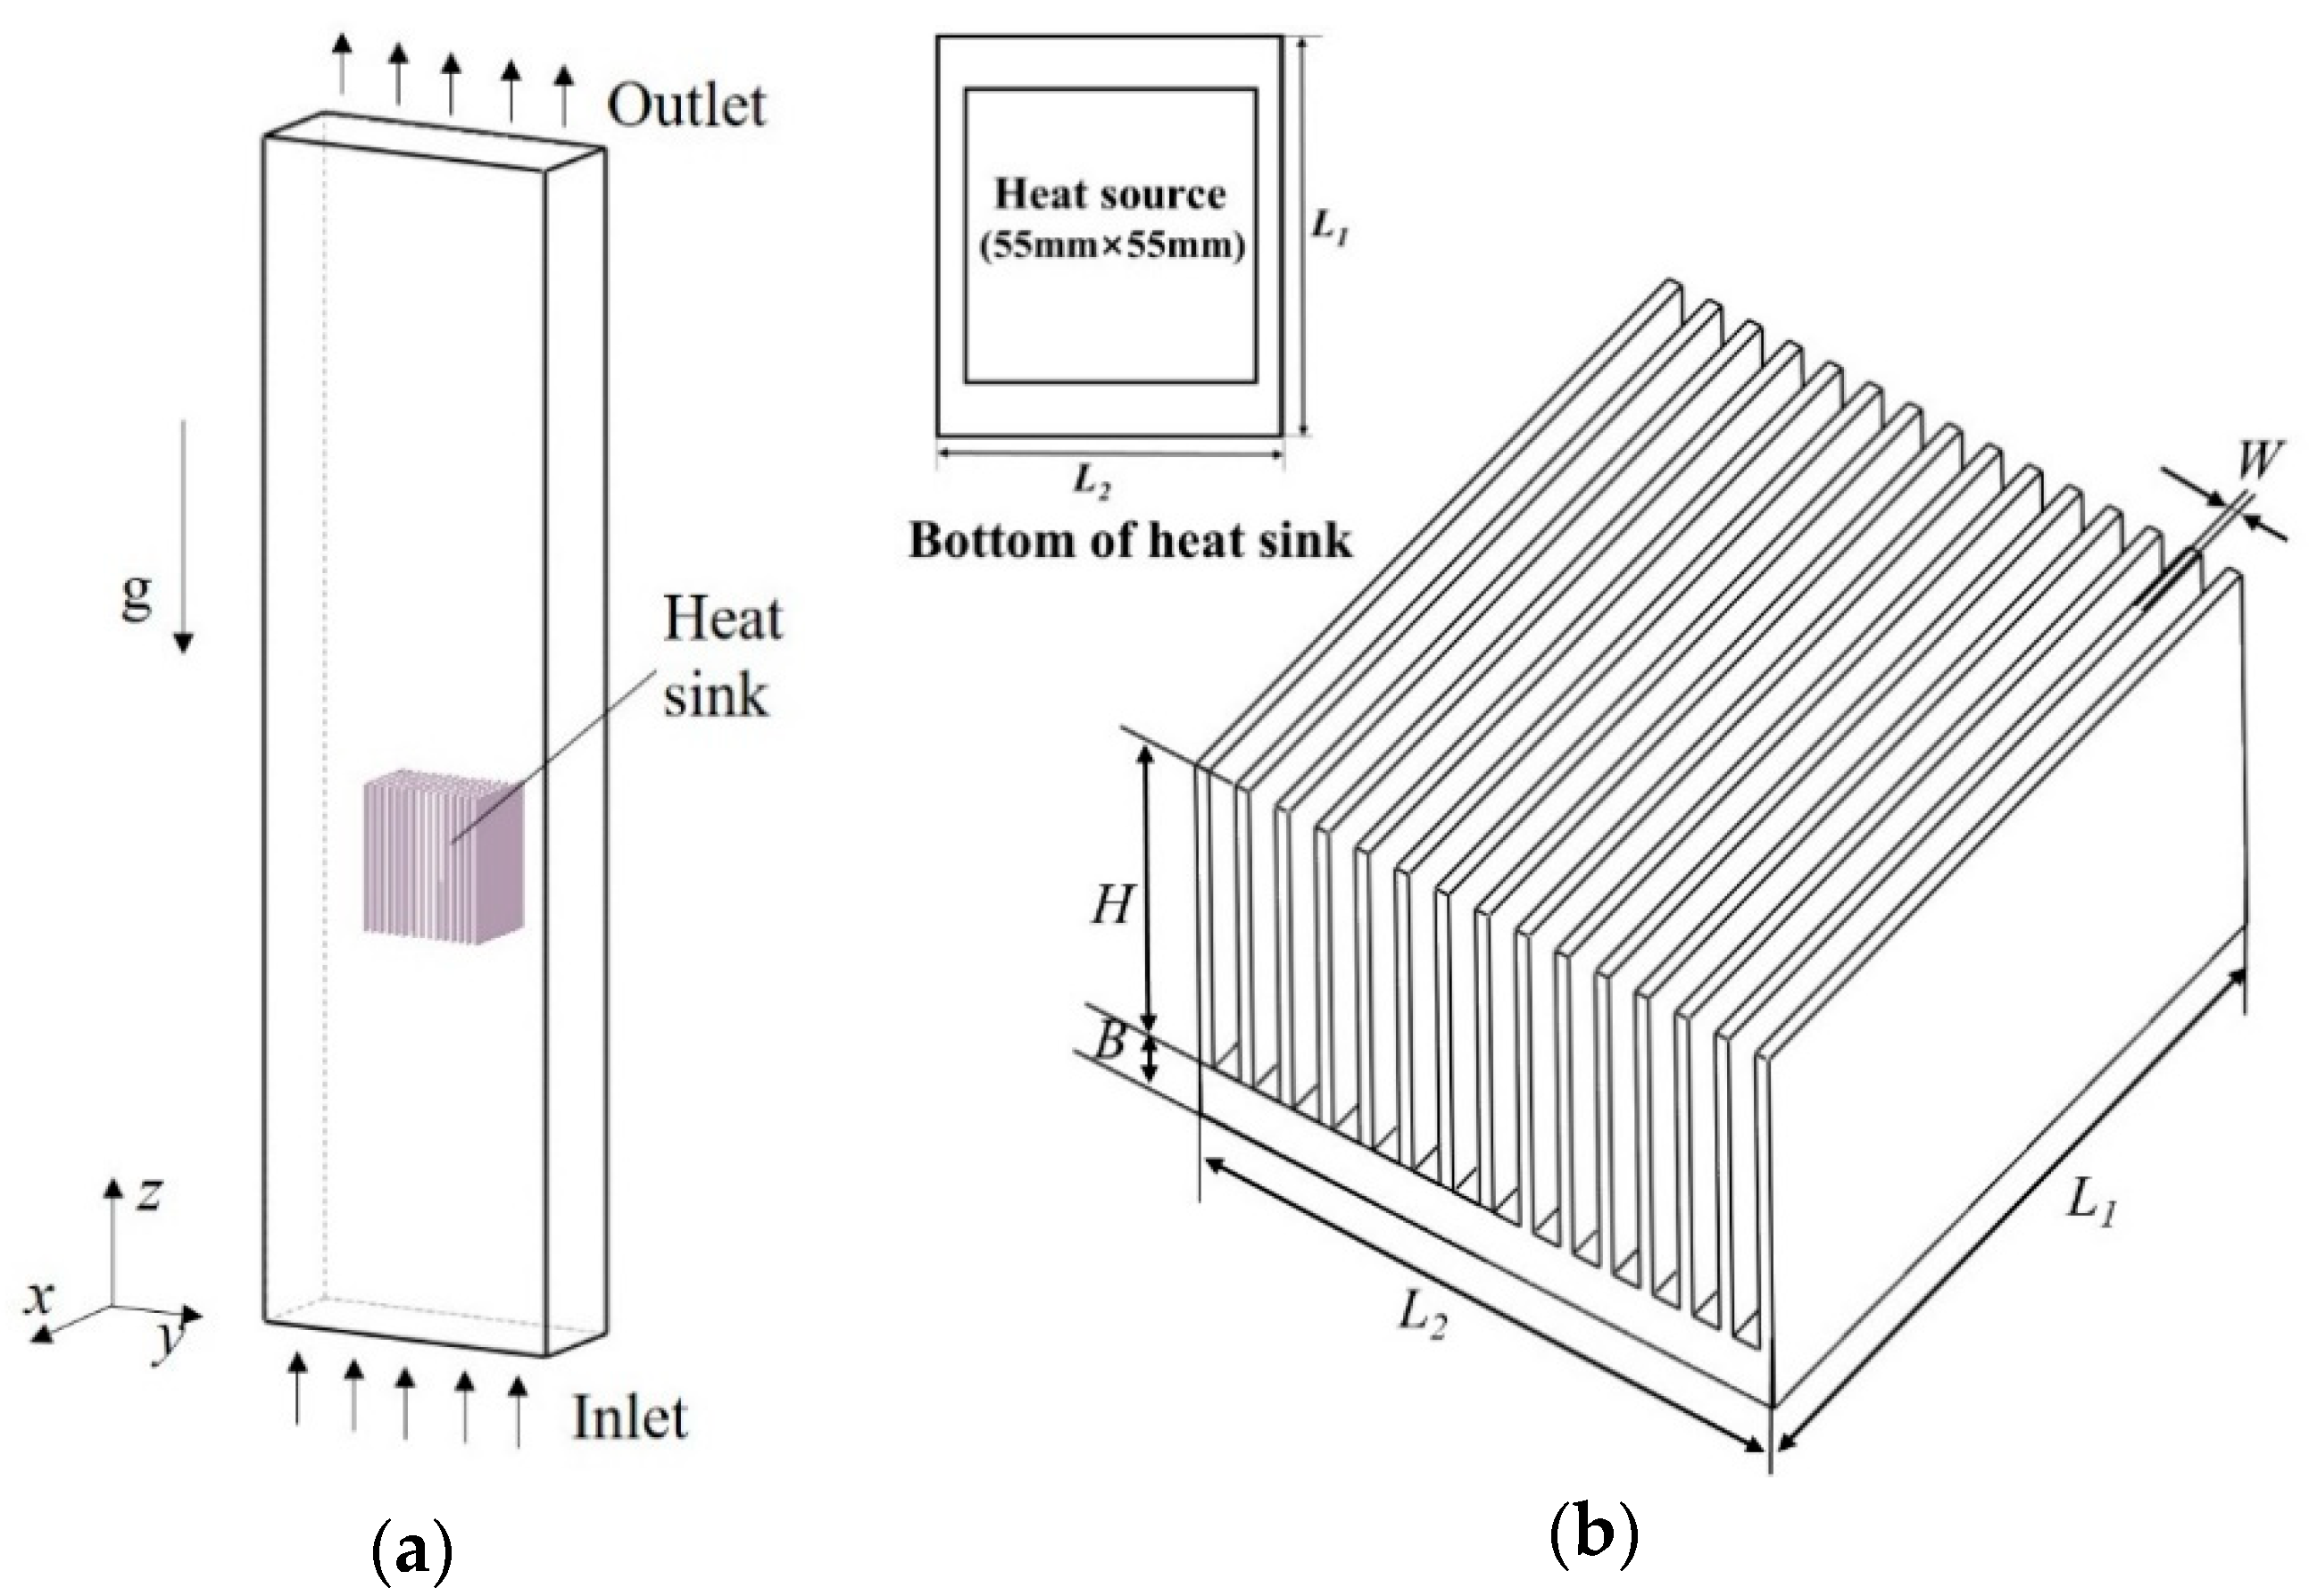
Figure 1. Computational domain (a) and heat sink (b).
Energies 14 00782 g001
Figure 2. Grid model.
Energies 14 00782 g002
Figure 3. Grid independence test.
Energies 14 00782 g003
Figure 4. Model validation by comparing with experimental results [30].
Energies 14 00782 g004
Figure 5. Temperature display of heat sinks.
Energies 14 00782 g005
Figure 6. Velocity distribution of each case at x = 15 mm.
Energies 14 00782 g006aEnergies 14 00782 g006b
Figure 7. Temperature distribution of each case at x = 15 mm.
Energies 14 00782 g007
Table 1. The physical properties of FC-40.
PropertyValue
Density (kg/m3)1903 − 2.15 × T (°C)
Specific heat (J/(kg·K))1100
Thermal conductivity(W/(m·K))0.065
Dynamic viscosity (mPa·s)3.4
Boiling point (°C)155
Table 2. Orthogonal factor and level table.
LevelFactor
B
(mm)
NW
(mm)
H
(mm)
13150.525
25171.030
37191.535
49212.040
Table 3. The L16(45) orthogonal array.
CaseBNWHBlank
111111
212222
313333
414444
521234
622143
723412
824321
931342
1032431
1133124
1234213
1341423
1442314
1543241
1644132
Table 4. Orthogonal design scheme and results.
CaseB
(mm)
NW
(mm)
H
(mm)
Wc
(mm)
Tmax
(°C)
Rank
13150.5254.1083.811
23171.0303.0066.925
33191.5352.0358.9813
43212.0401.1555.4716
55151.0353.5767.854
65170.5403.5373.342
75192.0251.5060.6811
85211.5301.6857.9814
97151.5403.0462.079
107172.0351.9457.8815
117190.5303.0869.843
127211.0252.2061.7010
139152.0302.5062.418
149171.5252.4763.777
159191.0402.5660.0112
169210.5352.7365.416
Table 5. The range analysis of the maximum temperature.
ParameterFactor
BNWH
K1j265.18276.14292.40269.96
K2j259.85261.91256.48257.15
K3j251.49249.51242.80250.12
K4j251.60240.56236.44250.89
k1j66.2969.0373.1067.49
k2j64.9665.4764.1264.28
k3j62.8762.3860.7062.53
k4j62.9060.1459.1162.72
Rj3.428.8913.994.96
Table 6. Integrated performance analysis.
CaseTmax (°C)Mass (kg)fTfMF
183.810.37 0.00 1.00 0.25
266.920.43 0.60 0.76 0.64
358.980.50 0.88 0.52 0.79
455.470.57 1.00 0.28 0.82
567.850.53 0.56 0.43 0.53
673.340.59 0.37 0.20 0.33
760.680.40 0.82 0.90 0.84
857.980.46 0.91 0.66 0.85
962.070.62 0.77 0.09 0.60
1057.880.55 0.91 0.33 0.77
1169.840.49 0.49 0.57 0.51
1261.700.42 0.78 0.81 0.79
1362.410.51 0.76 0.47 0.68
1463.770.45 0.71 0.71 0.71
1560.010.64 0.84 0.00 0.63
1665.410.58 0.65 0.24 0.55
Table 7. The optimal combination for the geometric parameters.
CaseB (mm)NW (mm)H (mm)
85211.530
Publisher’s Note: MDPI stays neutral with regard to jurisdictional claims in published maps and institutional affiliations.